Watkins Glen, NY Map & Demographics
Watkins Glen Map
Watkins Glen Overview
$36,523
PER CAPITA INCOME
$87,500
AVG FAMILY INCOME
$44,542
AVG HOUSEHOLD INCOME
33.2%
WAGE / INCOME GAP [ % ]
66.8¢/ $1
WAGE / INCOME GAP [ $ ]
0.47
INEQUALITY / GINI INDEX
1,777
TOTAL POPULATION
889
MALE POPULATION
888
FEMALE POPULATION
100.11
MALES / 100 FEMALES
99.89
FEMALES / 100 MALES
48.4
MEDIAN AGE
3.1
AVG FAMILY SIZE
2.0
AVG HOUSEHOLD SIZE
888
LABOR FORCE [ PEOPLE ]
58.4%
PERCENT IN LABOR FORCE
6.3%
UNEMPLOYMENT RATE
Watkins Glen Zip Codes
Watkins Glen Area Codes
Income in Watkins Glen
Income Overview in Watkins Glen
Per Capita Income in Watkins Glen is $36,523, while median incomes of families and households are $87,500 and $44,542 respectively.
| Characteristic | Number | Measure |
| Per Capita Income | 1,777 | $36,523 |
| Median Family Income | 358 | $87,500 |
| Mean Family Income | 358 | $106,072 |
| Median Household Income | 882 | $44,542 |
| Mean Household Income | 882 | $71,337 |
| Income Deficit | 358 | $0 |
| Wage / Income Gap (%) | 1,777 | 33.20% |
| Wage / Income Gap ($) | 1,777 | 66.80¢ per $1 |
| Gini / Inequality Index | 1,777 | 0.47 |
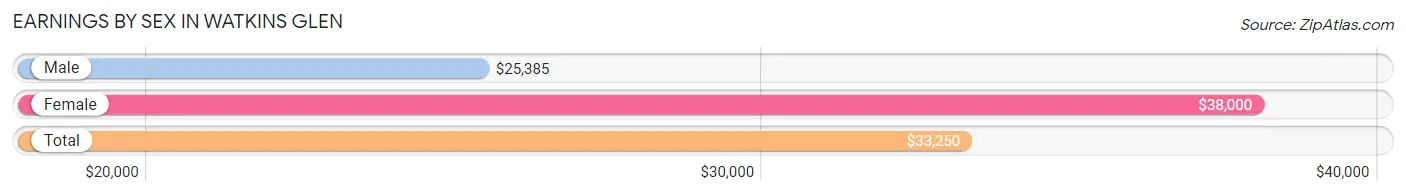
Earnings by Sex in Watkins Glen
Average Earnings in Watkins Glen are $33,250, $25,385 for men and $38,000 for women, a difference of 33.2%.
| Sex | Number | Average Earnings |
| Male | 476 (49.3%) | $25,385 |
| Female | 490 (50.7%) | $38,000 |
| Total | 966 (100.0%) | $33,250 |
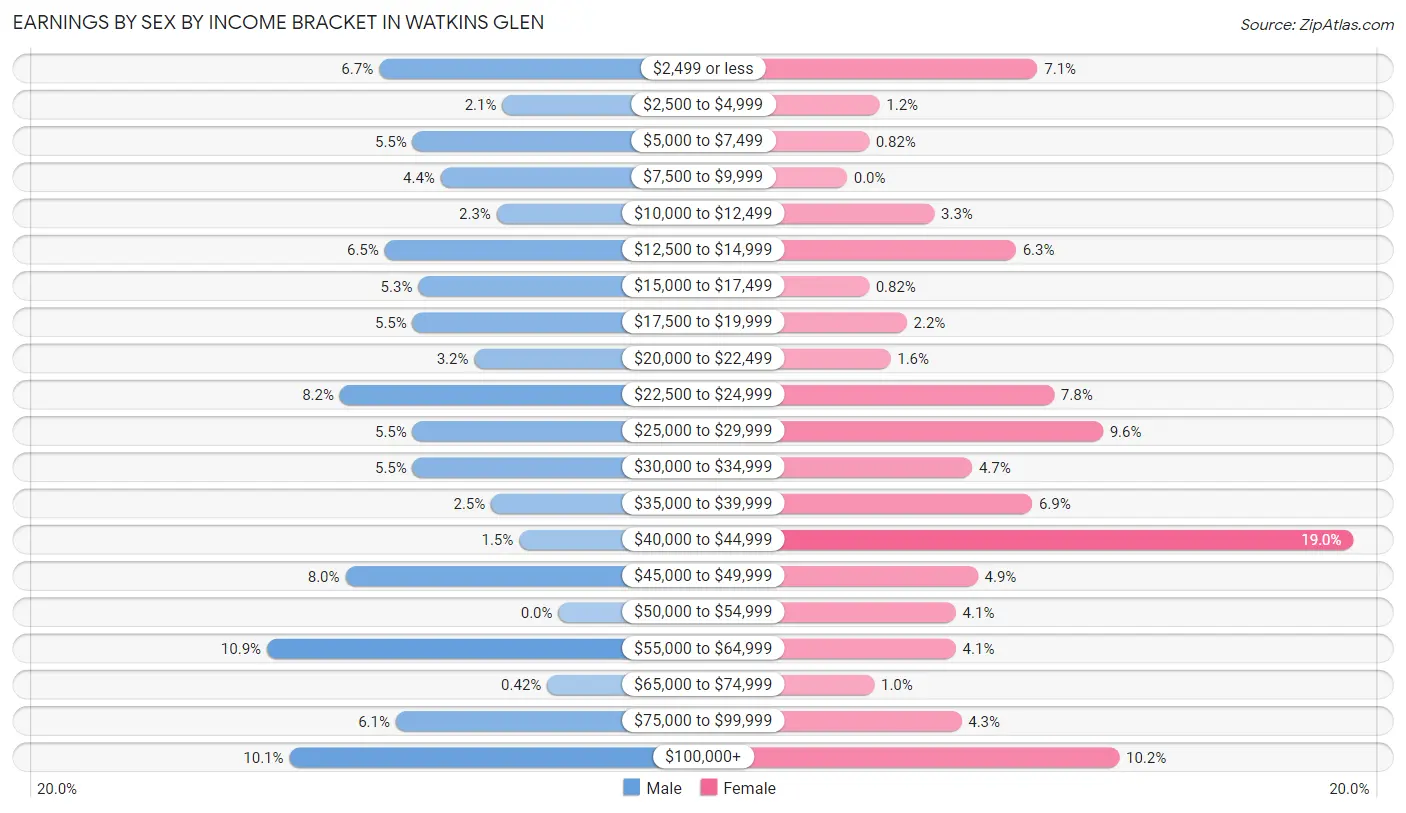
Earnings by Sex by Income Bracket in Watkins Glen
The most common earnings brackets in Watkins Glen are $55,000 to $64,999 for men (52 | 10.9%) and $40,000 to $44,999 for women (93 | 19.0%).
| Income | Male | Female |
| $2,499 or less | 32 (6.7%) | 35 (7.1%) |
| $2,500 to $4,999 | 10 (2.1%) | 6 (1.2%) |
| $5,000 to $7,499 | 26 (5.5%) | 4 (0.8%) |
| $7,500 to $9,999 | 21 (4.4%) | 0 (0.0%) |
| $10,000 to $12,499 | 11 (2.3%) | 16 (3.3%) |
| $12,500 to $14,999 | 31 (6.5%) | 31 (6.3%) |
| $15,000 to $17,499 | 25 (5.2%) | 4 (0.8%) |
| $17,500 to $19,999 | 26 (5.5%) | 11 (2.2%) |
| $20,000 to $22,499 | 15 (3.2%) | 8 (1.6%) |
| $22,500 to $24,999 | 39 (8.2%) | 38 (7.8%) |
| $25,000 to $29,999 | 26 (5.5%) | 47 (9.6%) |
| $30,000 to $34,999 | 26 (5.5%) | 23 (4.7%) |
| $35,000 to $39,999 | 12 (2.5%) | 34 (6.9%) |
| $40,000 to $44,999 | 7 (1.5%) | 93 (19.0%) |
| $45,000 to $49,999 | 38 (8.0%) | 24 (4.9%) |
| $50,000 to $54,999 | 0 (0.0%) | 20 (4.1%) |
| $55,000 to $64,999 | 52 (10.9%) | 20 (4.1%) |
| $65,000 to $74,999 | 2 (0.4%) | 5 (1.0%) |
| $75,000 to $99,999 | 29 (6.1%) | 21 (4.3%) |
| $100,000+ | 48 (10.1%) | 50 (10.2%) |
| Total | 476 (100.0%) | 490 (100.0%) |
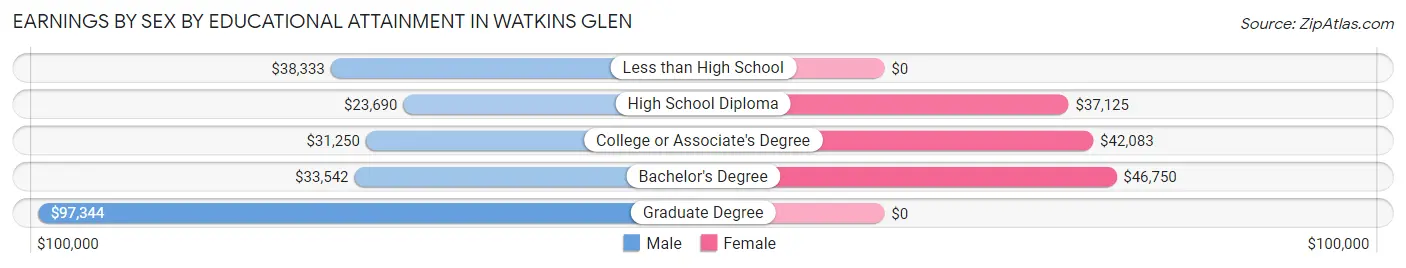
Earnings by Sex by Educational Attainment in Watkins Glen
Average earnings in Watkins Glen are $30,417 for men and $42,344 for women, a difference of 28.2%. Men with an educational attainment of graduate degree enjoy the highest average annual earnings of $97,344, while those with high school diploma education earn the least with $23,690. Women with an educational attainment of bachelor's degree earn the most with the average annual earnings of $46,750, while those with high school diploma education have the smallest earnings of $37,125.
| Educational Attainment | Male Income | Female Income |
| Less than High School | $38,333 | $0 |
| High School Diploma | $23,690 | $37,125 |
| College or Associate's Degree | $31,250 | $42,083 |
| Bachelor's Degree | $33,542 | $46,750 |
| Graduate Degree | $97,344 | $0 |
| Total | $30,417 | $42,344 |
Family Income in Watkins Glen
Family Income Brackets in Watkins Glen
According to the Watkins Glen family income data, there are 96 families falling into the $100,000 to $149,999 income range, which is the most common income bracket and makes up 26.8% of all families.
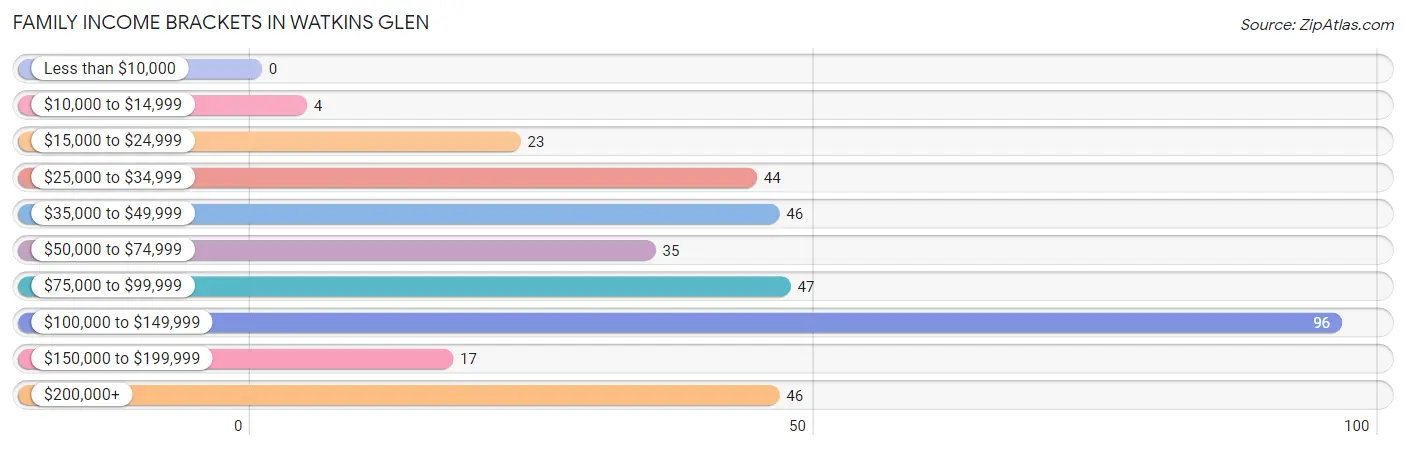
| Income Bracket | # Families | % Families |
| Less than $10,000 | 0 | 0.0% |
| $10,000 to $14,999 | 4 | 1.1% |
| $15,000 to $24,999 | 23 | 6.4% |
| $25,000 to $34,999 | 44 | 12.3% |
| $35,000 to $49,999 | 46 | 12.8% |
| $50,000 to $74,999 | 35 | 9.8% |
| $75,000 to $99,999 | 47 | 13.1% |
| $100,000 to $149,999 | 96 | 26.8% |
| $150,000 to $199,999 | 17 | 4.7% |
| $200,000+ | 46 | 12.8% |
Family Income by Famaliy Size in Watkins Glen
5-person families (54 | 15.1%) account for the highest median family income in Watkins Glen with $143,214 per family, while 3-person families (39 | 10.9%) have the highest median income of $37,448 per family member.
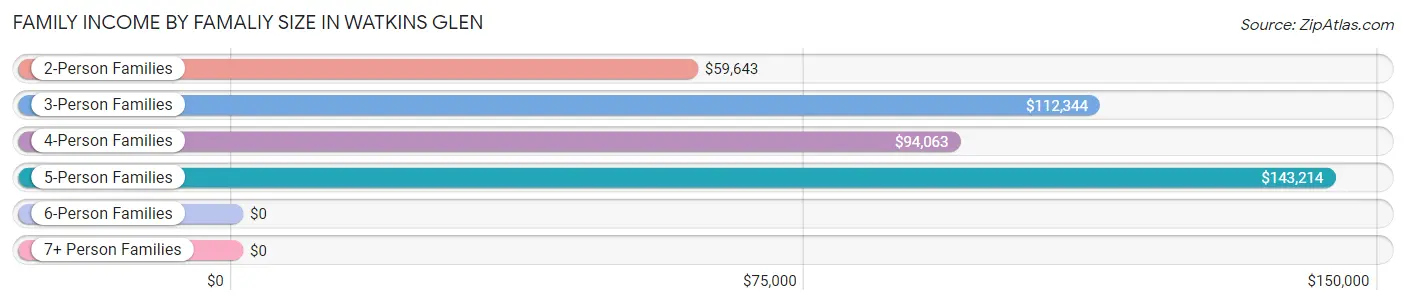
| Income Bracket | # Families | Median Income |
| 2-Person Families | 210 (58.7%) | $59,643 |
| 3-Person Families | 39 (10.9%) | $112,344 |
| 4-Person Families | 33 (9.2%) | $94,063 |
| 5-Person Families | 54 (15.1%) | $143,214 |
| 6-Person Families | 22 (6.1%) | $0 |
| 7+ Person Families | 0 (0.0%) | $0 |
| Total | 358 (100.0%) | $87,500 |
Family Income by Number of Earners in Watkins Glen
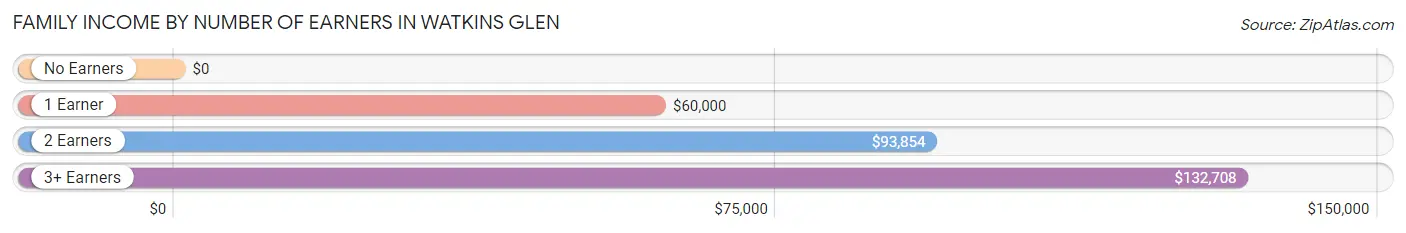
| Number of Earners | # Families | Median Income |
| No Earners | 54 (15.1%) | $0 |
| 1 Earner | 126 (35.2%) | $60,000 |
| 2 Earners | 105 (29.3%) | $93,854 |
| 3+ Earners | 73 (20.4%) | $132,708 |
| Total | 358 (100.0%) | $87,500 |
Household Income in Watkins Glen
Household Income Brackets in Watkins Glen
With 187 households falling in the category, the $35,000 to $49,999 income range is the most frequent in Watkins Glen, accounting for 21.2% of all households. In contrast, only 38 households (4.3%) fall into the $150,000 to $199,999 income bracket, making it the least populous group.
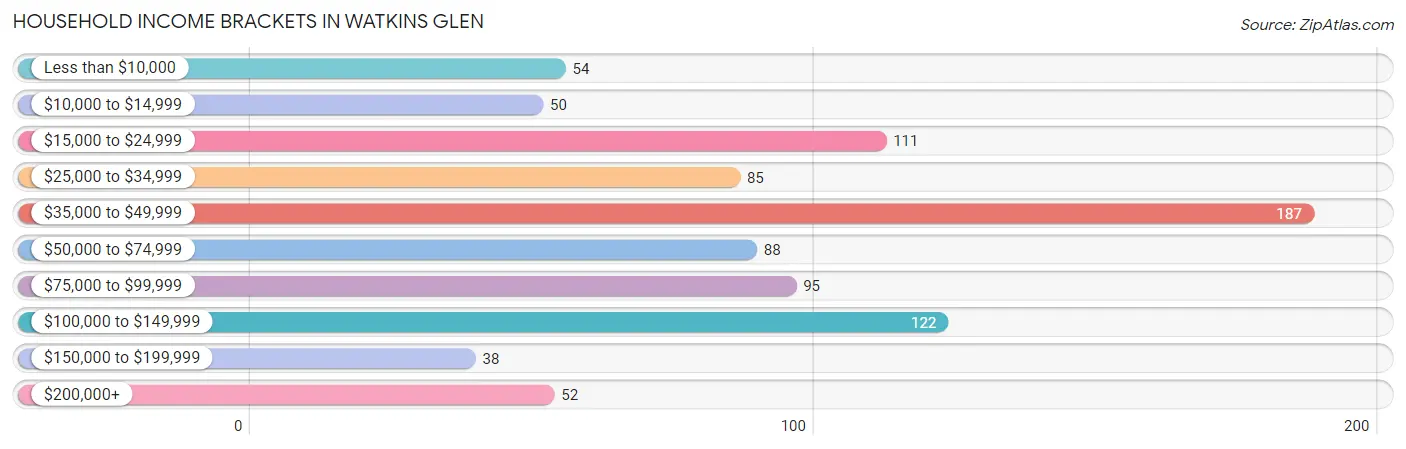
| Income Bracket | # Households | % Households |
| Less than $10,000 | 54 | 6.1% |
| $10,000 to $14,999 | 50 | 5.7% |
| $15,000 to $24,999 | 111 | 12.6% |
| $25,000 to $34,999 | 85 | 9.6% |
| $35,000 to $49,999 | 187 | 21.2% |
| $50,000 to $74,999 | 88 | 10.0% |
| $75,000 to $99,999 | 95 | 10.8% |
| $100,000 to $149,999 | 122 | 13.8% |
| $150,000 to $199,999 | 38 | 4.3% |
| $200,000+ | 52 | 5.9% |
Household Income by Householder Age in Watkins Glen
The median household income in Watkins Glen is $44,542, with the highest median household income of $86,250 found in the 45 to 64 years age bracket for the primary householder. A total of 266 households (30.2%) fall into this category. Meanwhile, the 15 to 24 years age bracket for the primary householder has the lowest median household income of $0, with 27 households (3.1%) in this group.
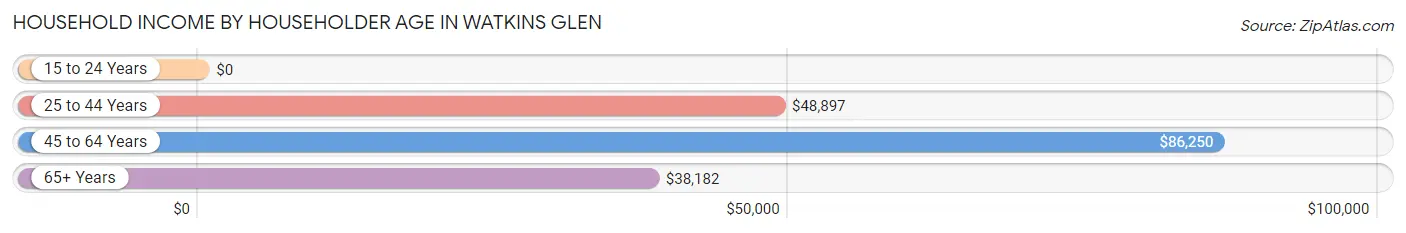
| Income Bracket | # Households | Median Income |
| 15 to 24 Years | 27 (3.1%) | $0 |
| 25 to 44 Years | 199 (22.6%) | $48,897 |
| 45 to 64 Years | 266 (30.2%) | $86,250 |
| 65+ Years | 390 (44.2%) | $38,182 |
| Total | 882 (100.0%) | $44,542 |
Poverty in Watkins Glen
Income Below Poverty by Sex and Age in Watkins Glen
With 12.3% poverty level for males and 8.5% for females among the residents of Watkins Glen, 75 year old and over males and 16 and 17 year old females are the most vulnerable to poverty, with 17 males (27.0%) and 6 females (30.0%) in their respective age groups living below the poverty level.
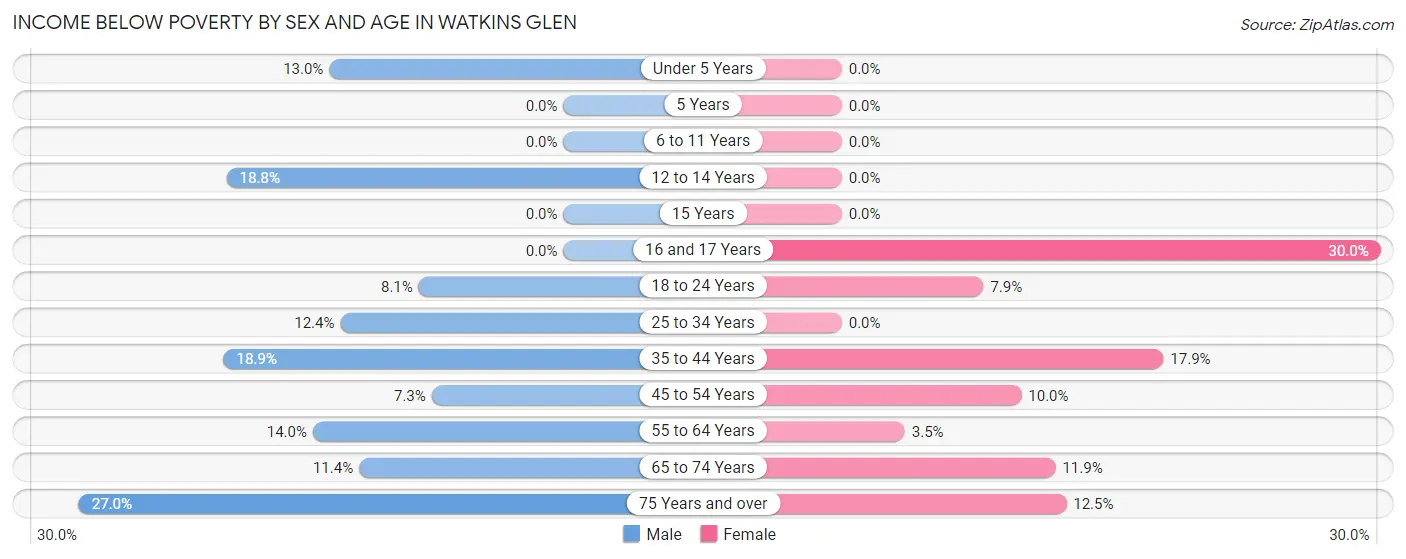
| Age Bracket | Male | Female |
| Under 5 Years | 6 (13.0%) | 0 (0.0%) |
| 5 Years | 0 (0.0%) | 0 (0.0%) |
| 6 to 11 Years | 0 (0.0%) | 0 (0.0%) |
| 12 to 14 Years | 6 (18.8%) | 0 (0.0%) |
| 15 Years | 0 (0.0%) | 0 (0.0%) |
| 16 and 17 Years | 0 (0.0%) | 6 (30.0%) |
| 18 to 24 Years | 5 (8.1%) | 6 (7.9%) |
| 25 to 34 Years | 19 (12.4%) | 0 (0.0%) |
| 35 to 44 Years | 14 (18.9%) | 12 (17.9%) |
| 45 to 54 Years | 8 (7.3%) | 11 (10.0%) |
| 55 to 64 Years | 12 (14.0%) | 4 (3.5%) |
| 65 to 74 Years | 19 (11.4%) | 25 (11.9%) |
| 75 Years and over | 17 (27.0%) | 11 (12.5%) |
| Total | 106 (12.3%) | 75 (8.5%) |
Income Above Poverty by Sex and Age in Watkins Glen
According to the poverty statistics in Watkins Glen, males aged 5 years and females aged under 5 years are the age groups that are most secure financially, with 100.0% of males and 100.0% of females in these age groups living above the poverty line.
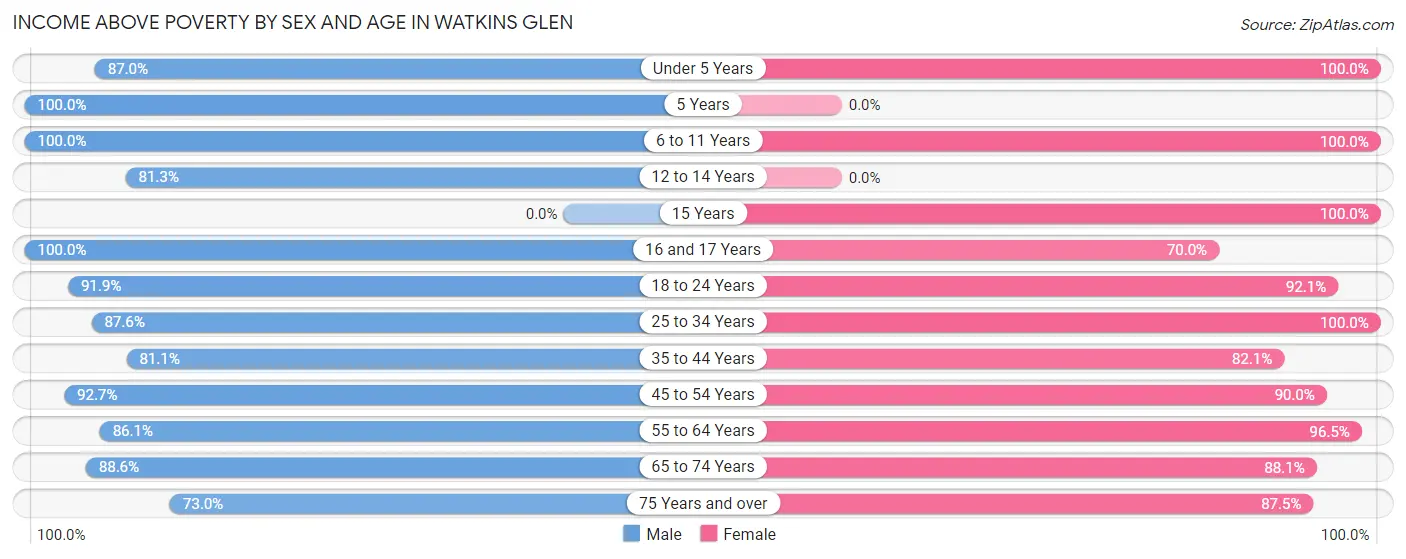
| Age Bracket | Male | Female |
| Under 5 Years | 40 (87.0%) | 38 (100.0%) |
| 5 Years | 10 (100.0%) | 0 (0.0%) |
| 6 to 11 Years | 56 (100.0%) | 39 (100.0%) |
| 12 to 14 Years | 26 (81.2%) | 0 (0.0%) |
| 15 Years | 0 (0.0%) | 35 (100.0%) |
| 16 and 17 Years | 6 (100.0%) | 14 (70.0%) |
| 18 to 24 Years | 57 (91.9%) | 70 (92.1%) |
| 25 to 34 Years | 134 (87.6%) | 91 (100.0%) |
| 35 to 44 Years | 60 (81.1%) | 55 (82.1%) |
| 45 to 54 Years | 101 (92.7%) | 99 (90.0%) |
| 55 to 64 Years | 74 (86.1%) | 110 (96.5%) |
| 65 to 74 Years | 148 (88.6%) | 185 (88.1%) |
| 75 Years and over | 46 (73.0%) | 77 (87.5%) |
| Total | 758 (87.7%) | 813 (91.5%) |
Income Below Poverty Among Married-Couple Families in Watkins Glen
The poverty statistics for married-couple families in Watkins Glen show that 4.4% or 12 of the total 271 families live below the poverty line. Families with 3 or 4 children have the highest poverty rate of 23.5%, comprising of 8 families. On the other hand, families with 1 or 2 children have the lowest poverty rate of 0.0%, which includes 0 families.
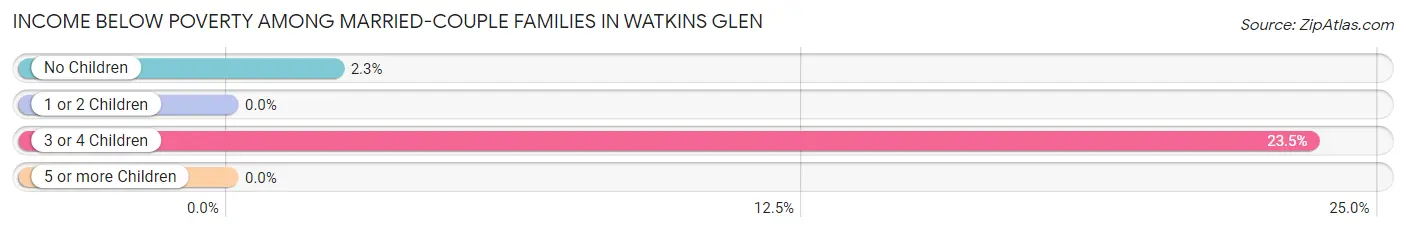
| Children | Above Poverty | Below Poverty |
| No Children | 170 (97.7%) | 4 (2.3%) |
| 1 or 2 Children | 63 (100.0%) | 0 (0.0%) |
| 3 or 4 Children | 26 (76.5%) | 8 (23.5%) |
| 5 or more Children | 0 (0.0%) | 0 (0.0%) |
| Total | 259 (95.6%) | 12 (4.4%) |
Income Below Poverty Among Single-Parent Households in Watkins Glen
| Children | Single Father | Single Mother |
| No Children | 0 (0.0%) | 0 (0.0%) |
| 1 or 2 Children | 0 (0.0%) | 0 (0.0%) |
| 3 or 4 Children | 0 (0.0%) | 0 (0.0%) |
| 5 or more Children | 0 (0.0%) | 0 (0.0%) |
| Total | 0 (0.0%) | 0 (0.0%) |
Income Below Poverty Among Married-Couple vs Single-Parent Households in Watkins Glen
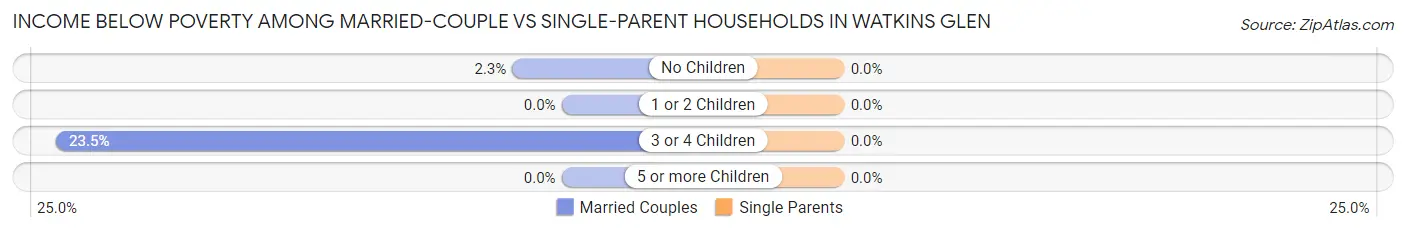
| Children | Married-Couple Families | Single-Parent Households |
| No Children | 4 (2.3%) | 0 (0.0%) |
| 1 or 2 Children | 0 (0.0%) | 0 (0.0%) |
| 3 or 4 Children | 8 (23.5%) | 0 (0.0%) |
| 5 or more Children | 0 (0.0%) | 0 (0.0%) |
| Total | 12 (4.4%) | 0 (0.0%) |
Race in Watkins Glen
The most populous races in Watkins Glen are White / Caucasian (1,590 | 89.5%), Asian (97 | 5.5%), and Black / African American (55 | 3.1%).
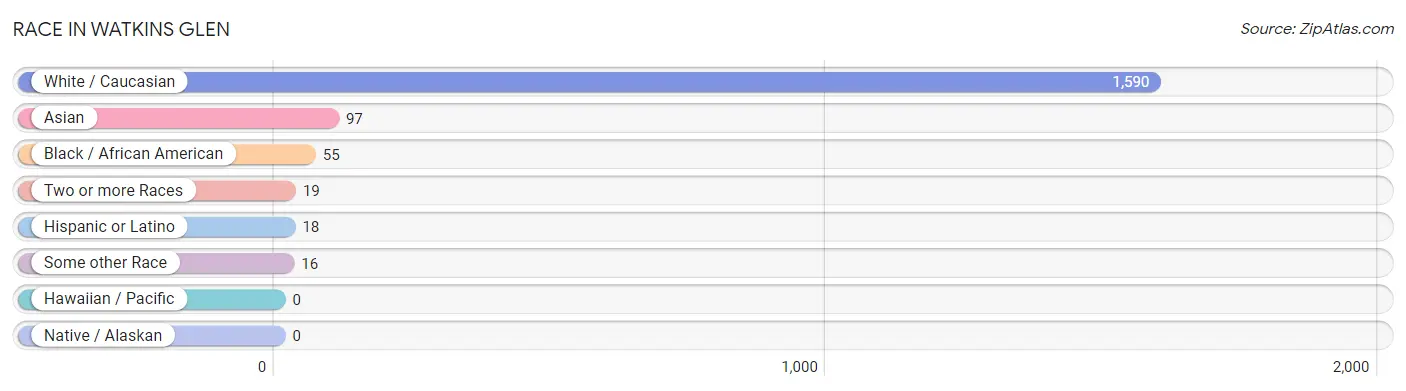
| Race | # Population | % Population |
| Asian | 97 | 5.5% |
| Black / African American | 55 | 3.1% |
| Hawaiian / Pacific | 0 | 0.0% |
| Hispanic or Latino | 18 | 1.0% |
| Native / Alaskan | 0 | 0.0% |
| White / Caucasian | 1,590 | 89.5% |
| Two or more Races | 19 | 1.1% |
| Some other Race | 16 | 0.9% |
| Total | 1,777 | 100.0% |
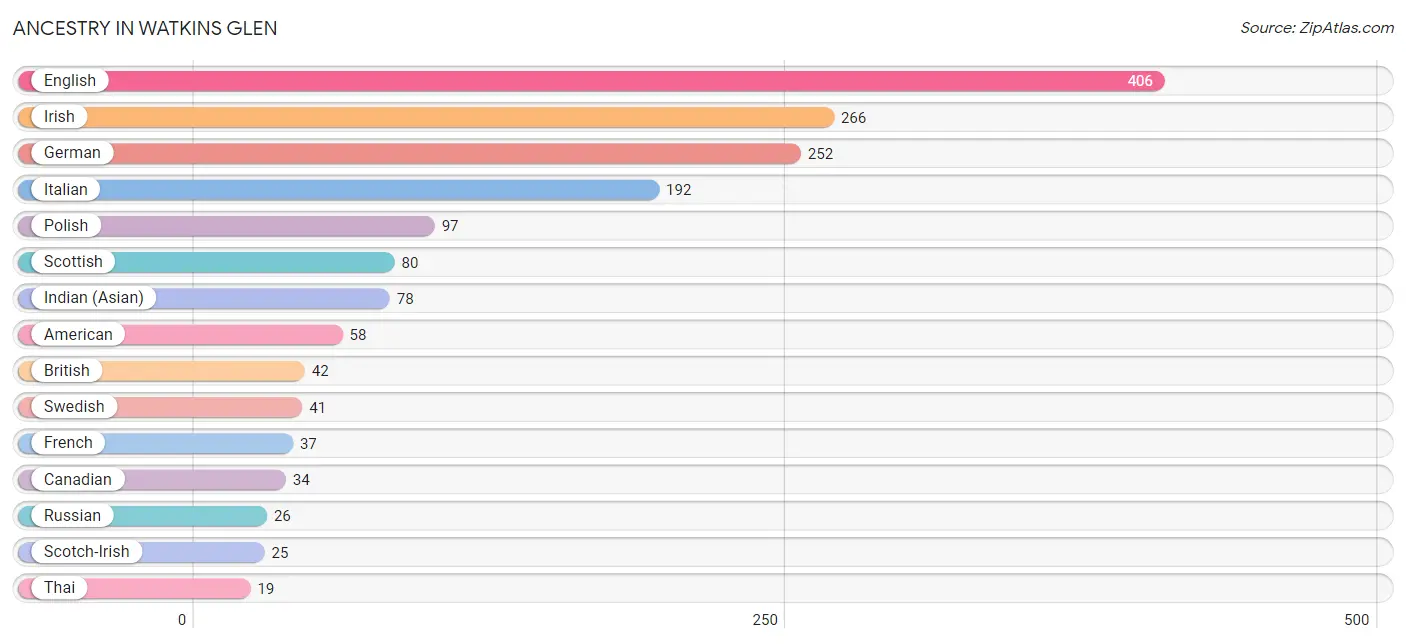
Ancestry in Watkins Glen
The most populous ancestries reported in Watkins Glen are English (406 | 22.9%), Irish (266 | 15.0%), German (252 | 14.2%), Italian (192 | 10.8%), and Polish (97 | 5.5%), together accounting for 68.3% of all Watkins Glen residents.
| Ancestry | # Population | % Population |
| American | 58 | 3.3% |
| Austrian | 16 | 0.9% |
| Belgian | 6 | 0.3% |
| British | 42 | 2.4% |
| Canadian | 34 | 1.9% |
| Cuban | 1 | 0.1% |
| Czech | 3 | 0.2% |
| Danish | 4 | 0.2% |
| Dutch | 17 | 1.0% |
| Ecuadorian | 10 | 0.6% |
| English | 406 | 22.9% |
| European | 14 | 0.8% |
| French | 37 | 2.1% |
| German | 252 | 14.2% |
| Greek | 8 | 0.4% |
| Hungarian | 5 | 0.3% |
| Indian (Asian) | 78 | 4.4% |
| Irish | 266 | 15.0% |
| Israeli | 6 | 0.3% |
| Italian | 192 | 10.8% |
| Jamaican | 7 | 0.4% |
| Norwegian | 10 | 0.6% |
| Pennsylvania German | 3 | 0.2% |
| Peruvian | 3 | 0.2% |
| Polish | 97 | 5.5% |
| Puerto Rican | 3 | 0.2% |
| Russian | 26 | 1.5% |
| Scandinavian | 5 | 0.3% |
| Scotch-Irish | 25 | 1.4% |
| Scottish | 80 | 4.5% |
| South American | 13 | 0.7% |
| Swedish | 41 | 2.3% |
| Swiss | 6 | 0.3% |
| Thai | 19 | 1.1% |
| Ukrainian | 3 | 0.2% |
| Welsh | 14 | 0.8% | View All 36 Rows |
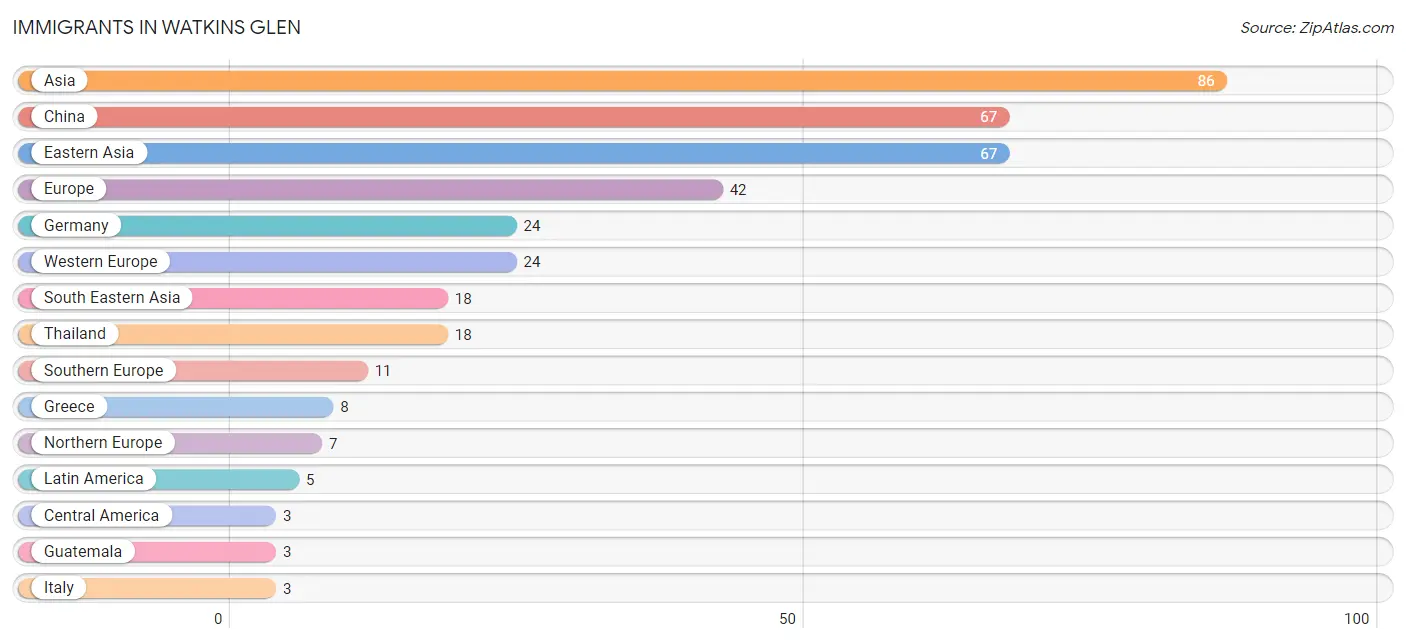
Immigrants in Watkins Glen
The most numerous immigrant groups reported in Watkins Glen came from Asia (86 | 4.8%), China (67 | 3.8%), Eastern Asia (67 | 3.8%), Europe (42 | 2.4%), and Germany (24 | 1.3%), together accounting for 16.1% of all Watkins Glen residents.
| Immigration Origin | # Population | % Population |
| Asia | 86 | 4.8% |
| Caribbean | 2 | 0.1% |
| Central America | 3 | 0.2% |
| China | 67 | 3.8% |
| Dominican Republic | 2 | 0.1% |
| Eastern Asia | 67 | 3.8% |
| Europe | 42 | 2.4% |
| Germany | 24 | 1.3% |
| Greece | 8 | 0.4% |
| Guatemala | 3 | 0.2% |
| India | 1 | 0.1% |
| Italy | 3 | 0.2% |
| Latin America | 5 | 0.3% |
| Northern Europe | 7 | 0.4% |
| South Central Asia | 1 | 0.1% |
| South Eastern Asia | 18 | 1.0% |
| Southern Europe | 11 | 0.6% |
| Thailand | 18 | 1.0% |
| Western Europe | 24 | 1.3% | View All 19 Rows |
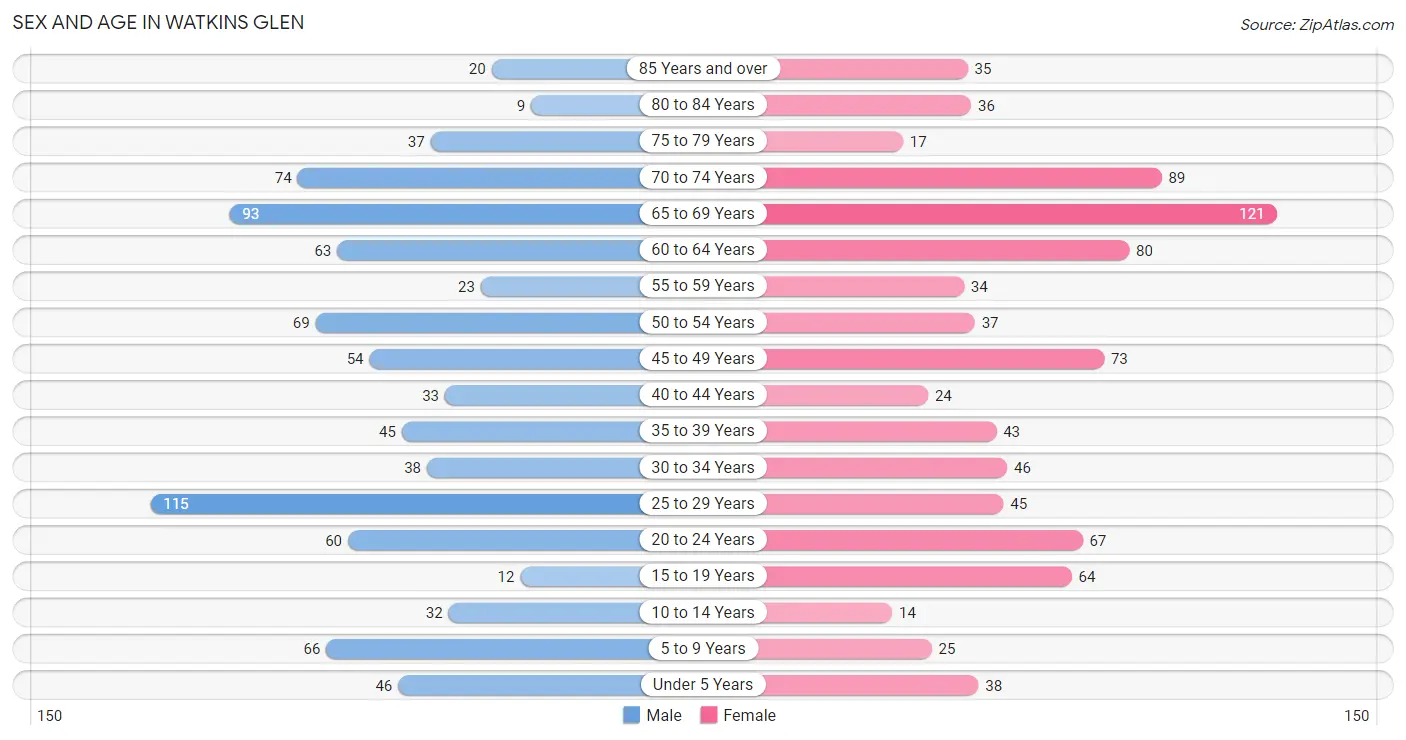
Sex and Age in Watkins Glen
Sex and Age in Watkins Glen
The most populous age groups in Watkins Glen are 25 to 29 Years (115 | 12.9%) for men and 65 to 69 Years (121 | 13.6%) for women.
| Age Bracket | Male | Female |
| Under 5 Years | 46 (5.2%) | 38 (4.3%) |
| 5 to 9 Years | 66 (7.4%) | 25 (2.8%) |
| 10 to 14 Years | 32 (3.6%) | 14 (1.6%) |
| 15 to 19 Years | 12 (1.3%) | 64 (7.2%) |
| 20 to 24 Years | 60 (6.8%) | 67 (7.5%) |
| 25 to 29 Years | 115 (12.9%) | 45 (5.1%) |
| 30 to 34 Years | 38 (4.3%) | 46 (5.2%) |
| 35 to 39 Years | 45 (5.1%) | 43 (4.8%) |
| 40 to 44 Years | 33 (3.7%) | 24 (2.7%) |
| 45 to 49 Years | 54 (6.1%) | 73 (8.2%) |
| 50 to 54 Years | 69 (7.8%) | 37 (4.2%) |
| 55 to 59 Years | 23 (2.6%) | 34 (3.8%) |
| 60 to 64 Years | 63 (7.1%) | 80 (9.0%) |
| 65 to 69 Years | 93 (10.5%) | 121 (13.6%) |
| 70 to 74 Years | 74 (8.3%) | 89 (10.0%) |
| 75 to 79 Years | 37 (4.2%) | 17 (1.9%) |
| 80 to 84 Years | 9 (1.0%) | 36 (4.1%) |
| 85 Years and over | 20 (2.2%) | 35 (3.9%) |
| Total | 889 (100.0%) | 888 (100.0%) |
Families and Households in Watkins Glen
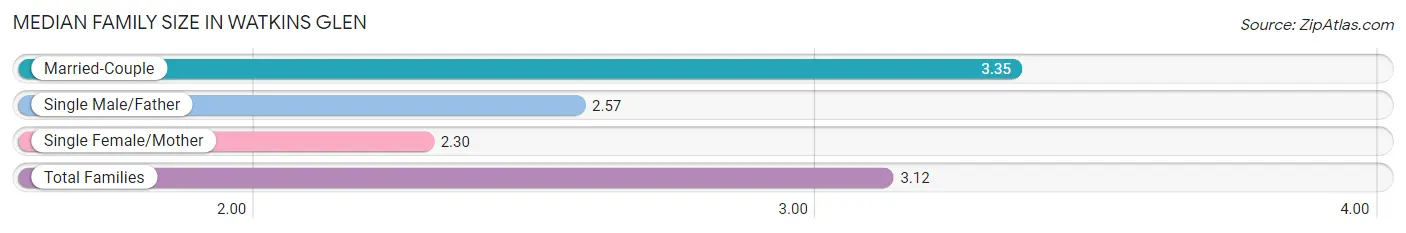
Median Family Size in Watkins Glen
The median family size in Watkins Glen is 3.12 persons per family, with married-couple families (271 | 75.7%) accounting for the largest median family size of 3.35 persons per family. On the other hand, single female/mother families (50 | 14.0%) represent the smallest median family size with 2.30 persons per family.
| Family Type | # Families | Family Size |
| Married-Couple | 271 (75.7%) | 3.35 |
| Single Male/Father | 37 (10.3%) | 2.57 |
| Single Female/Mother | 50 (14.0%) | 2.30 |
| Total Families | 358 (100.0%) | 3.12 |
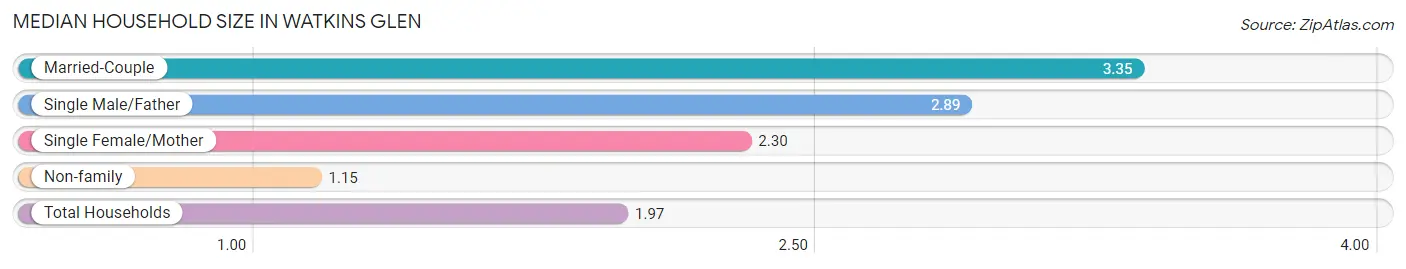
Median Household Size in Watkins Glen
The median household size in Watkins Glen is 1.97 persons per household, with married-couple households (271 | 30.7%) accounting for the largest median household size of 3.35 persons per household. non-family households (524 | 59.4%) represent the smallest median household size with 1.15 persons per household.
| Household Type | # Households | Household Size |
| Married-Couple | 271 (30.7%) | 3.35 |
| Single Male/Father | 37 (4.2%) | 2.89 |
| Single Female/Mother | 50 (5.7%) | 2.30 |
| Non-family | 524 (59.4%) | 1.15 |
| Total Households | 882 (100.0%) | 1.97 |
Household Size by Marriage Status in Watkins Glen
Out of a total of 882 households in Watkins Glen, 358 (40.6%) are family households, while 524 (59.4%) are nonfamily households. The most numerous type of family households are 2-person households, comprising 198, and the most common type of nonfamily households are 1-person households, comprising 434.
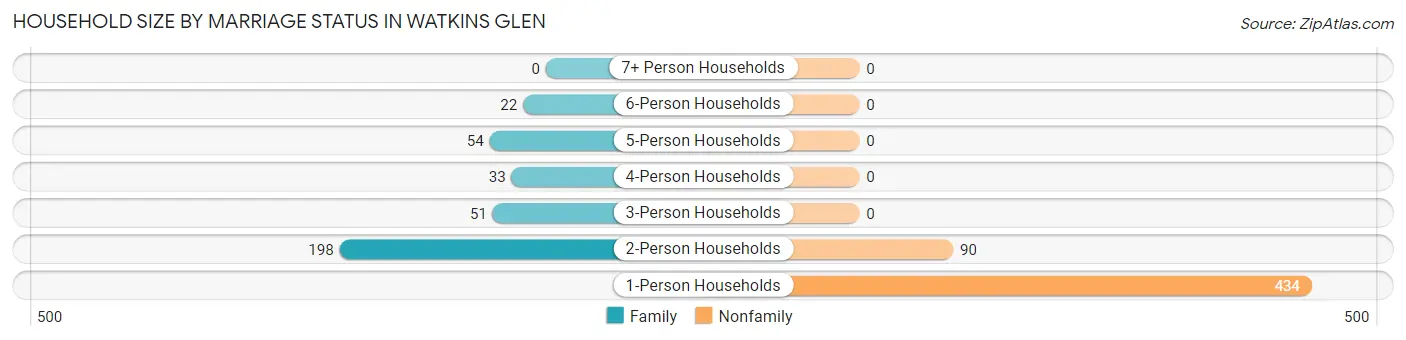
| Household Size | Family Households | Nonfamily Households |
| 1-Person Households | - | 434 (49.2%) |
| 2-Person Households | 198 (22.5%) | 90 (10.2%) |
| 3-Person Households | 51 (5.8%) | 0 (0.0%) |
| 4-Person Households | 33 (3.7%) | 0 (0.0%) |
| 5-Person Households | 54 (6.1%) | 0 (0.0%) |
| 6-Person Households | 22 (2.5%) | 0 (0.0%) |
| 7+ Person Households | 0 (0.0%) | 0 (0.0%) |
| Total | 358 (40.6%) | 524 (59.4%) |
Female Fertility in Watkins Glen
Fertility by Age in Watkins Glen
Average fertility rate in Watkins Glen is 11.0 births per 1,000 women. Women in the age bracket of 35 to 50 years have the highest fertility rate with 27.0 births per 1,000 women. Women in the age bracket of 35 to 50 years acount for 100.0% of all women with births.
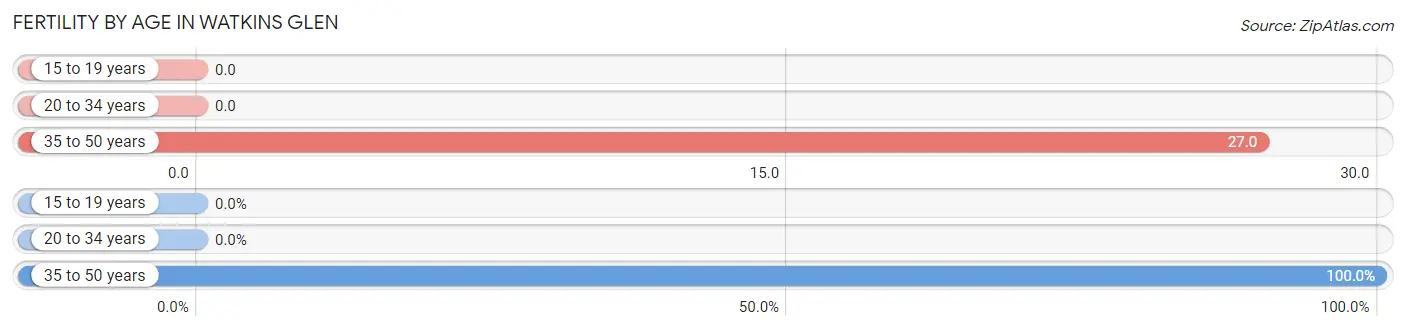
| Age Bracket | Women with Births | Births / 1,000 Women |
| 15 to 19 years | 0 (0.0%) | 0.0 |
| 20 to 34 years | 0 (0.0%) | 0.0 |
| 35 to 50 years | 4 (100.0%) | 27.0 |
| Total | 4 (100.0%) | 11.0 |
Fertility by Age by Marriage Status in Watkins Glen
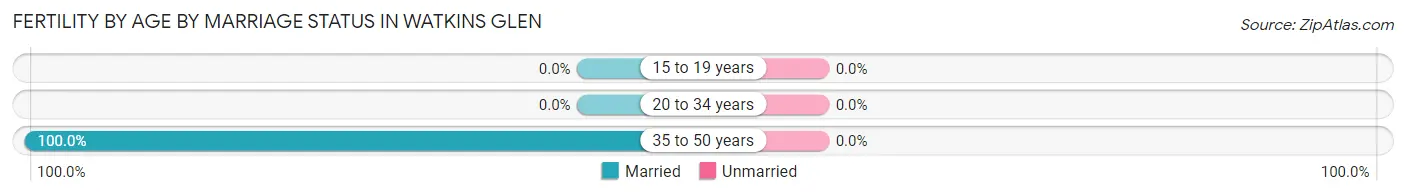
| Age Bracket | Married | Unmarried |
| 15 to 19 years | 0 (0.0%) | 0 (0.0%) |
| 20 to 34 years | 0 (0.0%) | 0 (0.0%) |
| 35 to 50 years | 4 (100.0%) | 0 (0.0%) |
| Total | 4 (100.0%) | 0 (0.0%) |
Fertility by Education in Watkins Glen
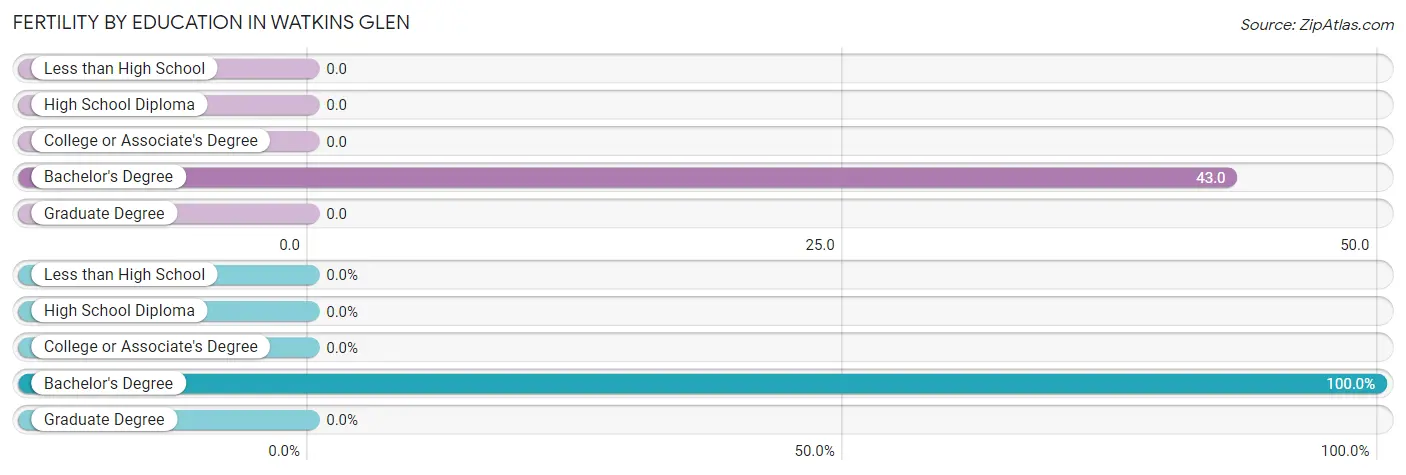
| Educational Attainment | Women with Births | Births / 1,000 Women |
| Less than High School | 0 (0.0%) | 0.0 |
| High School Diploma | 0 (0.0%) | 0.0 |
| College or Associate's Degree | 0 (0.0%) | 0.0 |
| Bachelor's Degree | 4 (100.0%) | 43.0 |
| Graduate Degree | 0 (0.0%) | 0.0 |
| Total | 4 (100.0%) | 11.0 |
Fertility by Education by Marriage Status in Watkins Glen
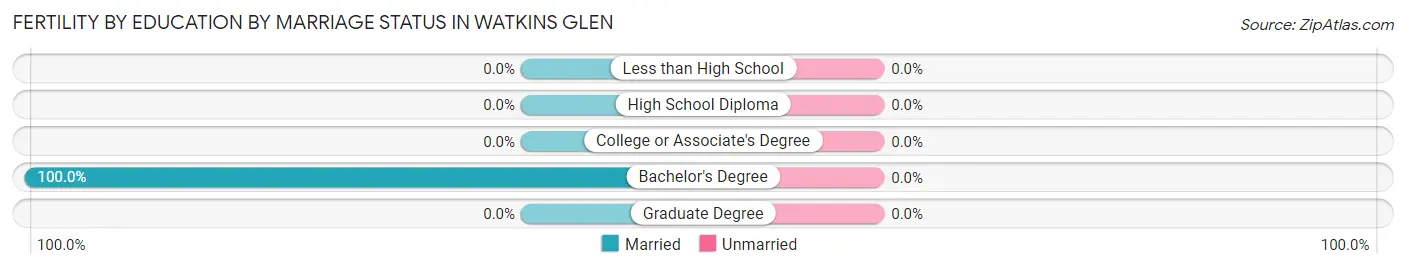
| Educational Attainment | Married | Unmarried |
| Less than High School | 0 (0.0%) | 0 (0.0%) |
| High School Diploma | 0 (0.0%) | 0 (0.0%) |
| College or Associate's Degree | 0 (0.0%) | 0 (0.0%) |
| Bachelor's Degree | 4 (100.0%) | 0 (0.0%) |
| Graduate Degree | 0 (0.0%) | 0 (0.0%) |
| Total | 4 (100.0%) | 0 (0.0%) |
Employment Characteristics in Watkins Glen
Employment by Class of Employer in Watkins Glen
Among the 829 employed individuals in Watkins Glen, private company employees (489 | 59.0%), not-for-profit organizations (137 | 16.5%), and local government employees (102 | 12.3%) make up the most common classes of employment.
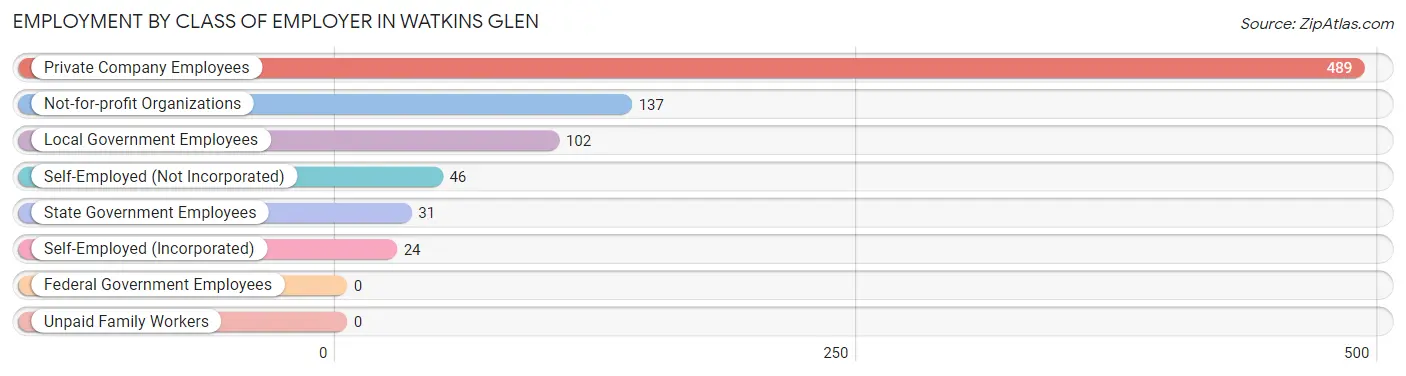
| Employer Class | # Employees | % Employees |
| Private Company Employees | 489 | 59.0% |
| Self-Employed (Incorporated) | 24 | 2.9% |
| Self-Employed (Not Incorporated) | 46 | 5.6% |
| Not-for-profit Organizations | 137 | 16.5% |
| Local Government Employees | 102 | 12.3% |
| State Government Employees | 31 | 3.7% |
| Federal Government Employees | 0 | 0.0% |
| Unpaid Family Workers | 0 | 0.0% |
| Total | 829 | 100.0% |
Employment Status by Age in Watkins Glen
According to the labor force statistics for Watkins Glen, out of the total population over 16 years of age (1,521), 58.4% or 888 individuals are in the labor force, with 6.3% or 56 of them unemployed. The age group with the highest labor force participation rate is 30 to 34 years, with 100.0% or 84 individuals in the labor force. Within the labor force, the 75 years and over age range has the highest percentage of unemployed individuals, with 41.7% or 5 of them being unemployed.
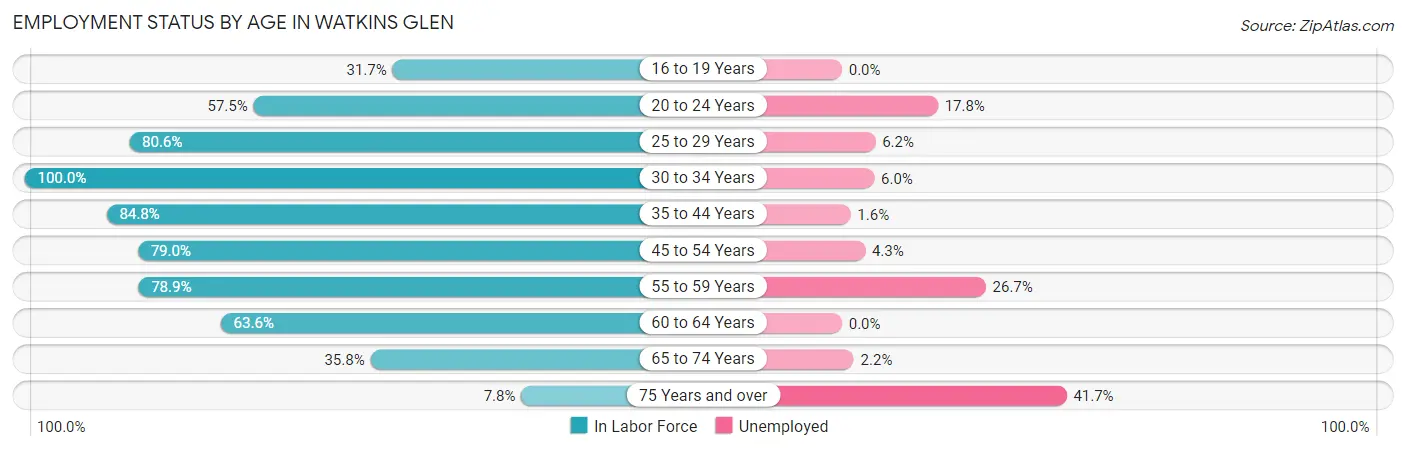
| Age Bracket | In Labor Force | Unemployed |
| 16 to 19 Years | 13 (31.7%) | 0 (0.0%) |
| 20 to 24 Years | 73 (57.5%) | 13 (17.8%) |
| 25 to 29 Years | 129 (80.6%) | 8 (6.2%) |
| 30 to 34 Years | 84 (100.0%) | 5 (6.0%) |
| 35 to 44 Years | 123 (84.8%) | 2 (1.6%) |
| 45 to 54 Years | 184 (79.0%) | 8 (4.3%) |
| 55 to 59 Years | 45 (78.9%) | 12 (26.7%) |
| 60 to 64 Years | 91 (63.6%) | 0 (0.0%) |
| 65 to 74 Years | 135 (35.8%) | 3 (2.2%) |
| 75 Years and over | 12 (7.8%) | 5 (41.7%) |
| Total | 888 (58.4%) | 56 (6.3%) |
Employment Status by Educational Attainment in Watkins Glen
According to labor force statistics for Watkins Glen, 79.8% of individuals (656) out of the total population between 25 and 64 years of age (822) are in the labor force, with 5.3% or 35 of them being unemployed. The group with the highest labor force participation rate are those with the educational attainment of college / associate degree, with 89.8% or 212 individuals in the labor force. Within the labor force, individuals with bachelor's degree or higher education have the highest percentage of unemployment, with 8.5% or 17 of them being unemployed.
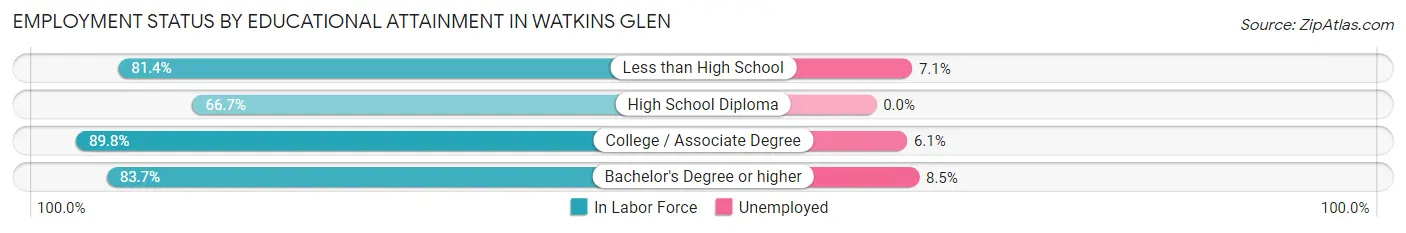
| Educational Attainment | In Labor Force | Unemployed |
| Less than High School | 70 (81.4%) | 6 (7.1%) |
| High School Diploma | 174 (66.7%) | 0 (0.0%) |
| College / Associate Degree | 212 (89.8%) | 14 (6.1%) |
| Bachelor's Degree or higher | 200 (83.7%) | 20 (8.5%) |
| Total | 656 (79.8%) | 44 (5.3%) |
Employment Occupations by Sex in Watkins Glen
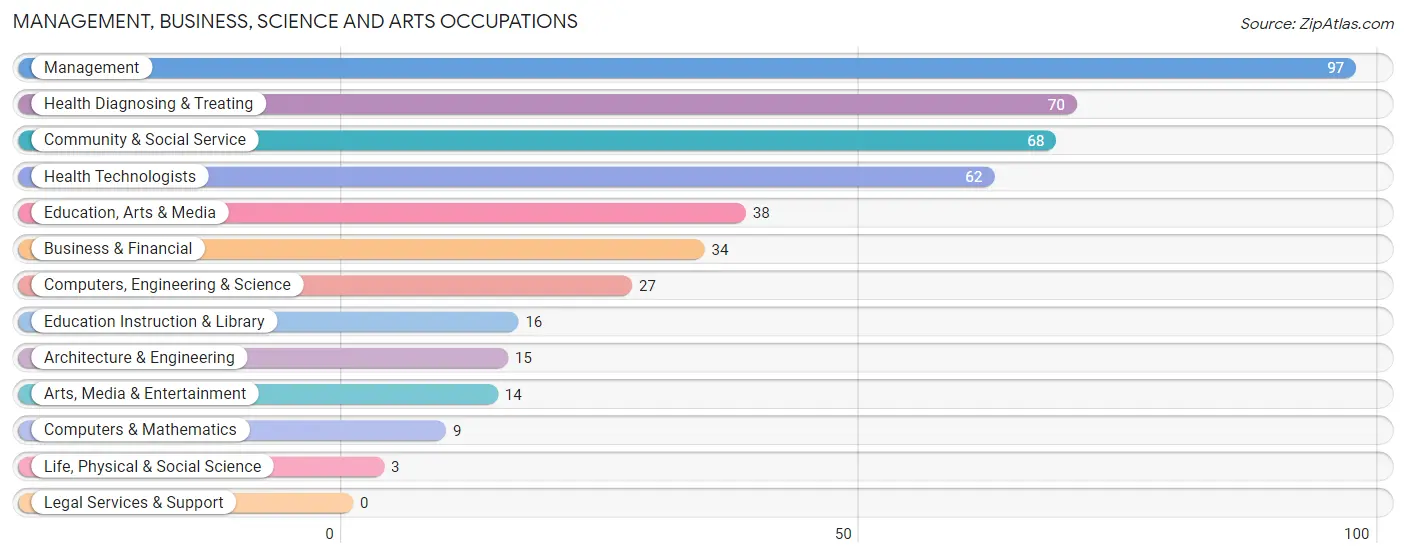
Management, Business, Science and Arts Occupations
The most common Management, Business, Science and Arts occupations in Watkins Glen are Management (97 | 11.6%), Health Diagnosing & Treating (70 | 8.4%), Community & Social Service (68 | 8.2%), Health Technologists (62 | 7.4%), and Education, Arts & Media (38 | 4.6%).
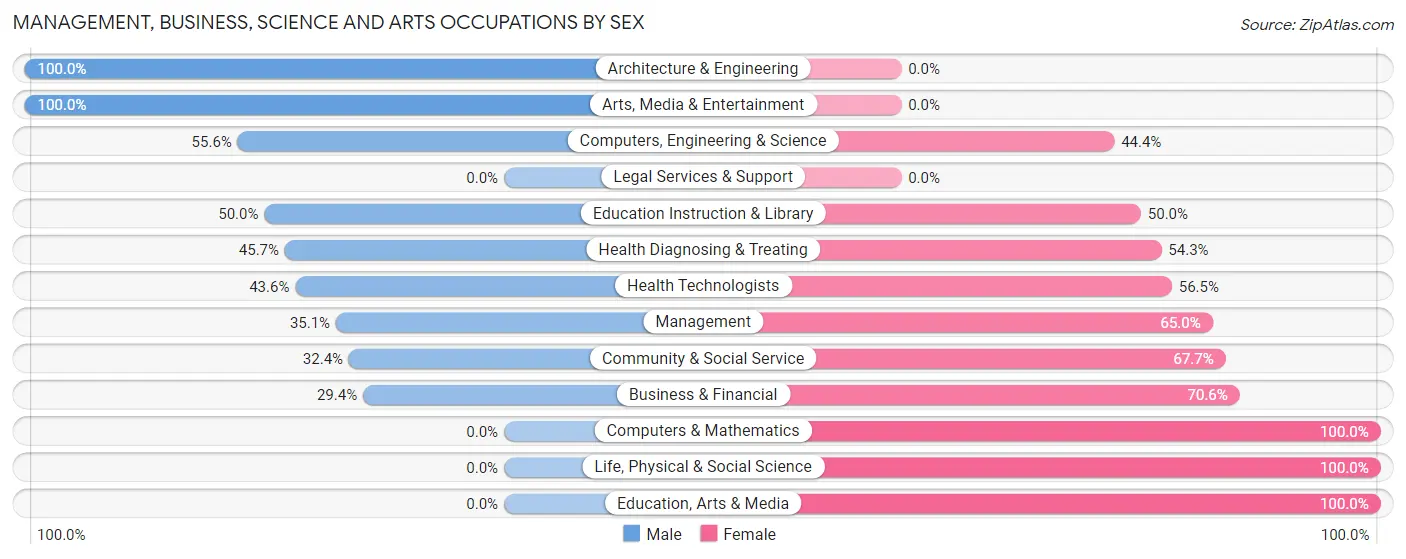
Management, Business, Science and Arts Occupations by Sex
Within the Management, Business, Science and Arts occupations in Watkins Glen, the most male-oriented occupations are Architecture & Engineering (100.0%), Arts, Media & Entertainment (100.0%), and Computers, Engineering & Science (55.6%), while the most female-oriented occupations are Computers & Mathematics (100.0%), Life, Physical & Social Science (100.0%), and Education, Arts & Media (100.0%).
| Occupation | Male | Female |
| Management | 34 (35.0%) | 63 (64.9%) |
| Business & Financial | 10 (29.4%) | 24 (70.6%) |
| Computers, Engineering & Science | 15 (55.6%) | 12 (44.4%) |
| Computers & Mathematics | 0 (0.0%) | 9 (100.0%) |
| Architecture & Engineering | 15 (100.0%) | 0 (0.0%) |
| Life, Physical & Social Science | 0 (0.0%) | 3 (100.0%) |
| Community & Social Service | 22 (32.4%) | 46 (67.6%) |
| Education, Arts & Media | 0 (0.0%) | 38 (100.0%) |
| Legal Services & Support | 0 (0.0%) | 0 (0.0%) |
| Education Instruction & Library | 8 (50.0%) | 8 (50.0%) |
| Arts, Media & Entertainment | 14 (100.0%) | 0 (0.0%) |
| Health Diagnosing & Treating | 32 (45.7%) | 38 (54.3%) |
| Health Technologists | 27 (43.5%) | 35 (56.5%) |
| Total (Category) | 113 (38.2%) | 183 (61.8%) |
| Total (Overall) | 401 (48.1%) | 432 (51.9%) |
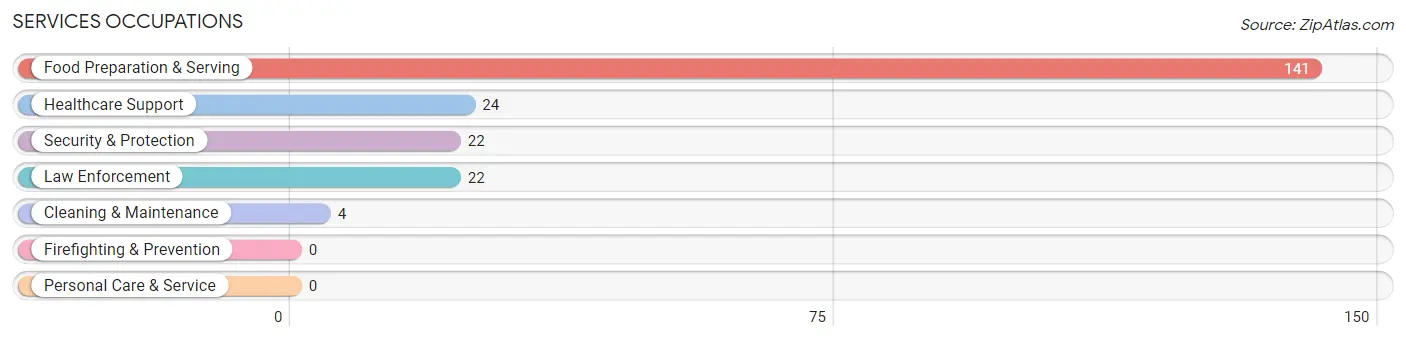
Services Occupations
The most common Services occupations in Watkins Glen are Food Preparation & Serving (141 | 16.9%), Healthcare Support (24 | 2.9%), Security & Protection (22 | 2.6%), Law Enforcement (22 | 2.6%), and Cleaning & Maintenance (4 | 0.5%).
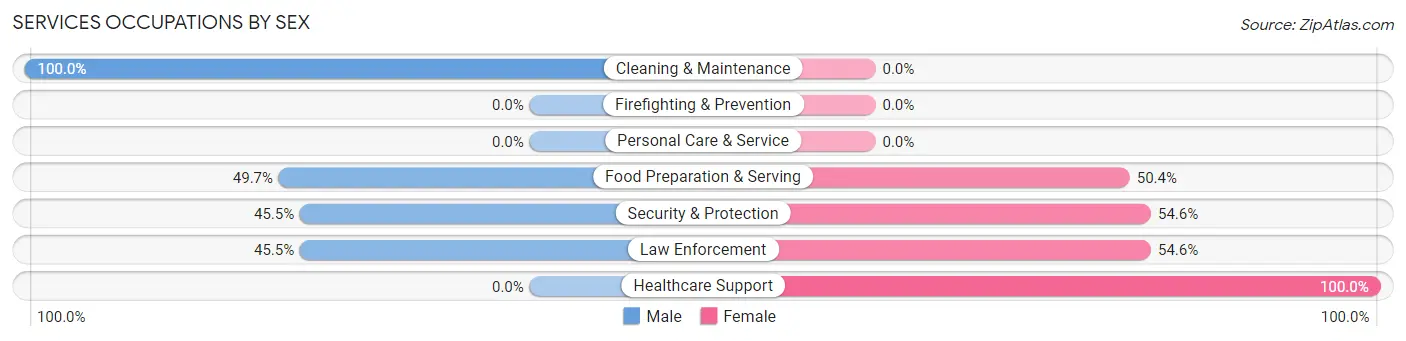
Services Occupations by Sex
Within the Services occupations in Watkins Glen, the most male-oriented occupations are Cleaning & Maintenance (100.0%), Food Preparation & Serving (49.6%), and Security & Protection (45.5%), while the most female-oriented occupations are Healthcare Support (100.0%), Security & Protection (54.5%), and Law Enforcement (54.5%).
| Occupation | Male | Female |
| Healthcare Support | 0 (0.0%) | 24 (100.0%) |
| Security & Protection | 10 (45.5%) | 12 (54.5%) |
| Firefighting & Prevention | 0 (0.0%) | 0 (0.0%) |
| Law Enforcement | 10 (45.5%) | 12 (54.5%) |
| Food Preparation & Serving | 70 (49.6%) | 71 (50.3%) |
| Cleaning & Maintenance | 4 (100.0%) | 0 (0.0%) |
| Personal Care & Service | 0 (0.0%) | 0 (0.0%) |
| Total (Category) | 84 (44.0%) | 107 (56.0%) |
| Total (Overall) | 401 (48.1%) | 432 (51.9%) |
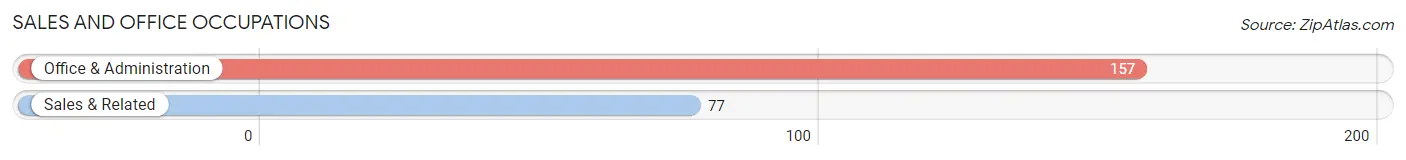
Sales and Office Occupations
The most common Sales and Office occupations in Watkins Glen are Office & Administration (157 | 18.9%), and Sales & Related (77 | 9.2%).
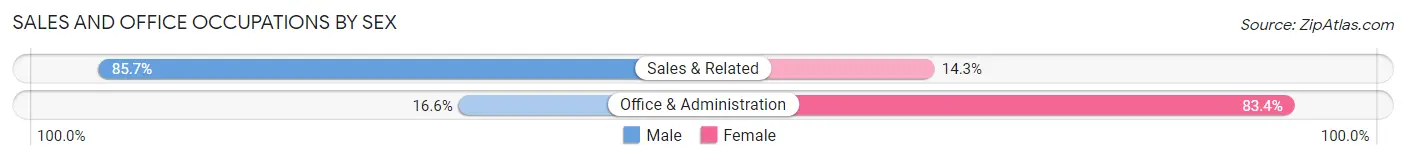
Sales and Office Occupations by Sex
| Occupation | Male | Female |
| Sales & Related | 66 (85.7%) | 11 (14.3%) |
| Office & Administration | 26 (16.6%) | 131 (83.4%) |
| Total (Category) | 92 (39.3%) | 142 (60.7%) |
| Total (Overall) | 401 (48.1%) | 432 (51.9%) |
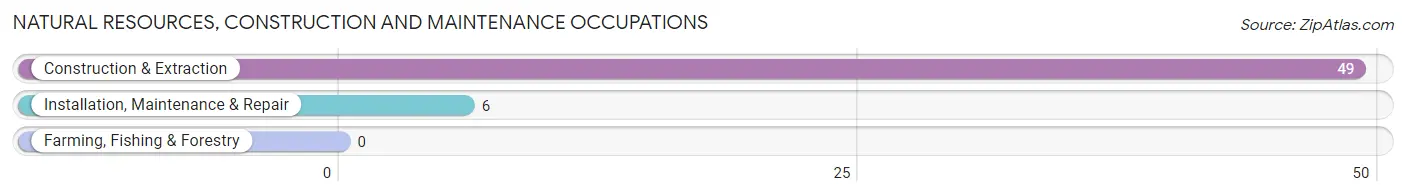
Natural Resources, Construction and Maintenance Occupations
The most common Natural Resources, Construction and Maintenance occupations in Watkins Glen are Construction & Extraction (49 | 5.9%), and Installation, Maintenance & Repair (6 | 0.7%).
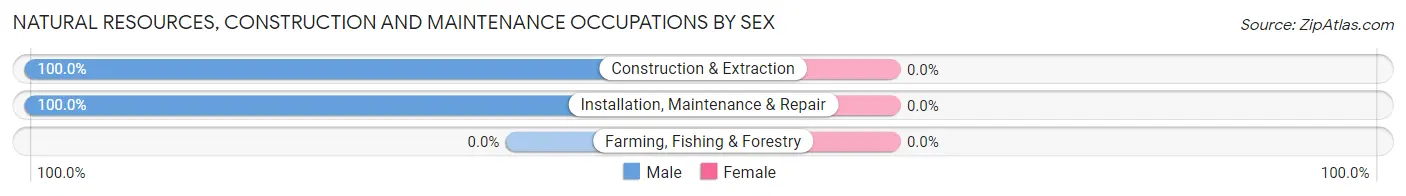
Natural Resources, Construction and Maintenance Occupations by Sex
| Occupation | Male | Female |
| Farming, Fishing & Forestry | 0 (0.0%) | 0 (0.0%) |
| Construction & Extraction | 49 (100.0%) | 0 (0.0%) |
| Installation, Maintenance & Repair | 6 (100.0%) | 0 (0.0%) |
| Total (Category) | 55 (100.0%) | 0 (0.0%) |
| Total (Overall) | 401 (48.1%) | 432 (51.9%) |
Production, Transportation and Moving Occupations
The most common Production, Transportation and Moving occupations in Watkins Glen are Production (29 | 3.5%), Transportation (25 | 3.0%), and Material Moving (3 | 0.4%).
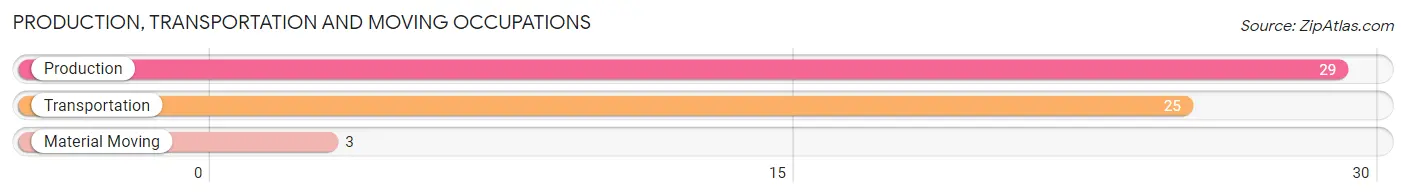
Production, Transportation and Moving Occupations by Sex
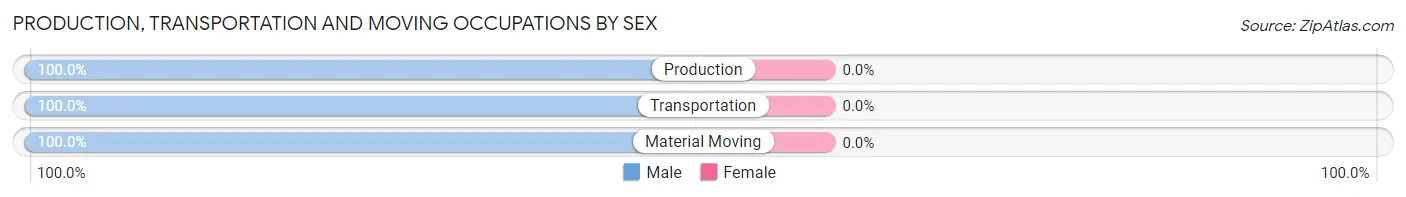
| Occupation | Male | Female |
| Production | 29 (100.0%) | 0 (0.0%) |
| Transportation | 25 (100.0%) | 0 (0.0%) |
| Material Moving | 3 (100.0%) | 0 (0.0%) |
| Total (Category) | 57 (100.0%) | 0 (0.0%) |
| Total (Overall) | 401 (48.1%) | 432 (51.9%) |
Employment Industries by Sex in Watkins Glen
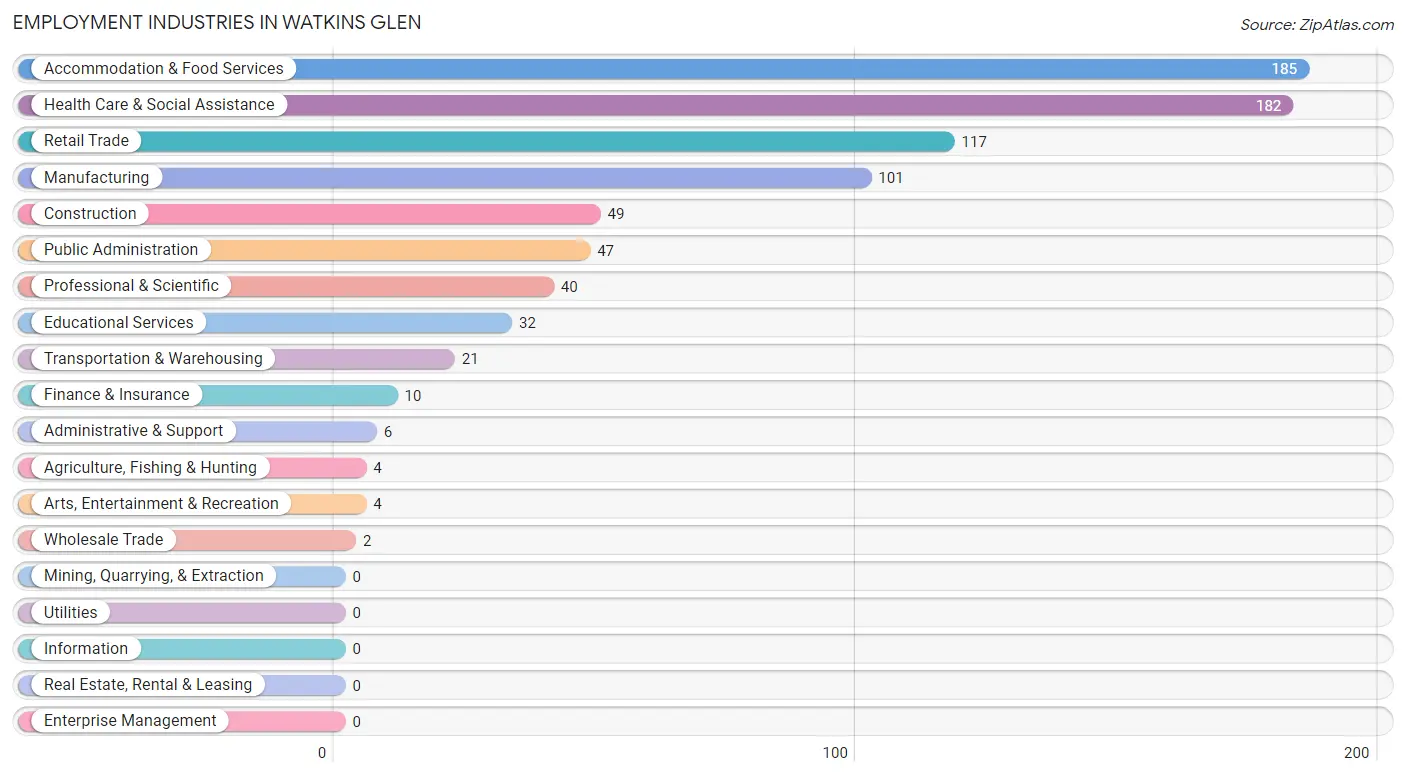
Employment Industries in Watkins Glen
The major employment industries in Watkins Glen include Accommodation & Food Services (185 | 22.2%), Health Care & Social Assistance (182 | 21.8%), Retail Trade (117 | 14.1%), Manufacturing (101 | 12.1%), and Construction (49 | 5.9%).
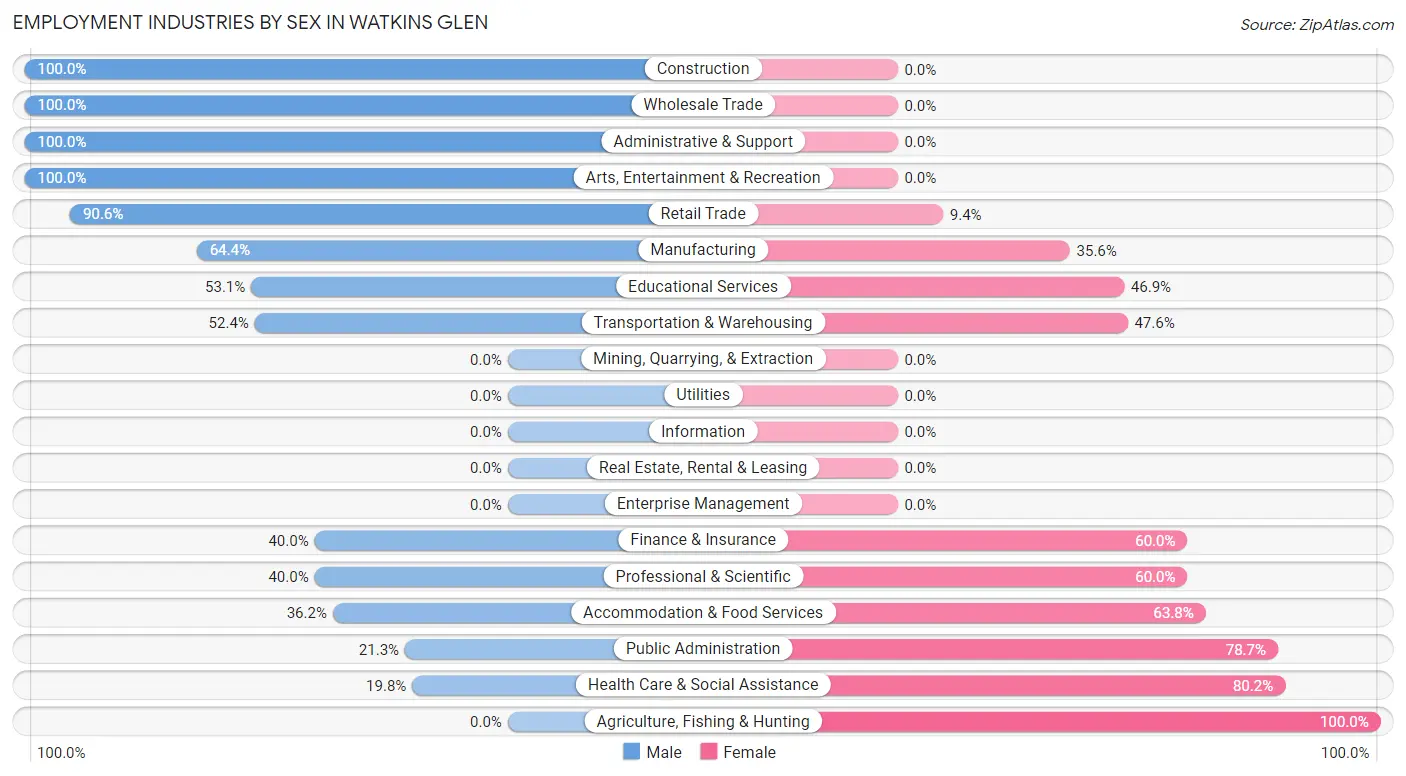
Employment Industries by Sex in Watkins Glen
The Watkins Glen industries that see more men than women are Construction (100.0%), Wholesale Trade (100.0%), and Administrative & Support (100.0%), whereas the industries that tend to have a higher number of women are Agriculture, Fishing & Hunting (100.0%), Health Care & Social Assistance (80.2%), and Public Administration (78.7%).
| Industry | Male | Female |
| Agriculture, Fishing & Hunting | 0 (0.0%) | 4 (100.0%) |
| Mining, Quarrying, & Extraction | 0 (0.0%) | 0 (0.0%) |
| Construction | 49 (100.0%) | 0 (0.0%) |
| Manufacturing | 65 (64.4%) | 36 (35.6%) |
| Wholesale Trade | 2 (100.0%) | 0 (0.0%) |
| Retail Trade | 106 (90.6%) | 11 (9.4%) |
| Transportation & Warehousing | 11 (52.4%) | 10 (47.6%) |
| Utilities | 0 (0.0%) | 0 (0.0%) |
| Information | 0 (0.0%) | 0 (0.0%) |
| Finance & Insurance | 4 (40.0%) | 6 (60.0%) |
| Real Estate, Rental & Leasing | 0 (0.0%) | 0 (0.0%) |
| Professional & Scientific | 16 (40.0%) | 24 (60.0%) |
| Enterprise Management | 0 (0.0%) | 0 (0.0%) |
| Administrative & Support | 6 (100.0%) | 0 (0.0%) |
| Educational Services | 17 (53.1%) | 15 (46.9%) |
| Health Care & Social Assistance | 36 (19.8%) | 146 (80.2%) |
| Arts, Entertainment & Recreation | 4 (100.0%) | 0 (0.0%) |
| Accommodation & Food Services | 67 (36.2%) | 118 (63.8%) |
| Public Administration | 10 (21.3%) | 37 (78.7%) |
| Total | 401 (48.1%) | 432 (51.9%) |
Education in Watkins Glen
School Enrollment in Watkins Glen
The most common levels of schooling among the 354 students in Watkins Glen are college / undergraduate (117 | 33.1%), elementary school (81 | 22.9%), and high school (67 | 18.9%).
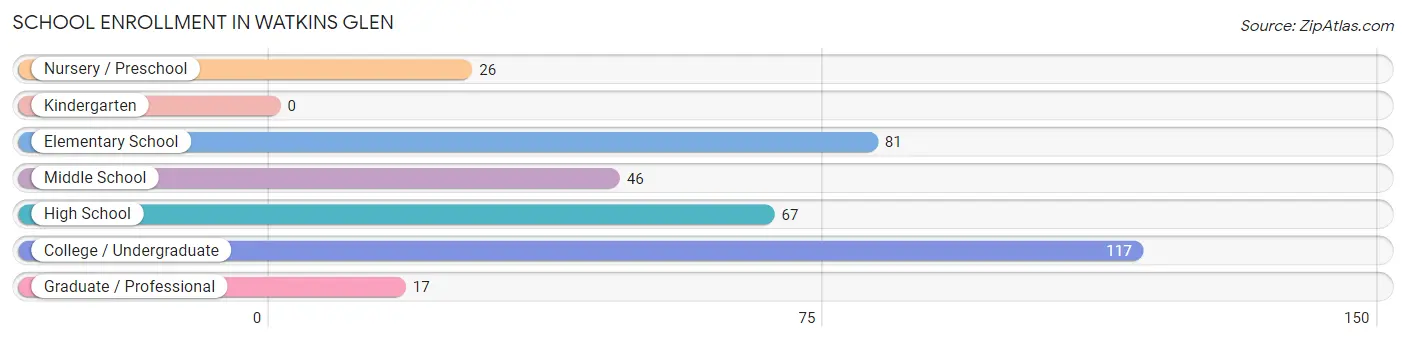
| School Level | # Students | % Students |
| Nursery / Preschool | 26 | 7.3% |
| Kindergarten | 0 | 0.0% |
| Elementary School | 81 | 22.9% |
| Middle School | 46 | 13.0% |
| High School | 67 | 18.9% |
| College / Undergraduate | 117 | 33.1% |
| Graduate / Professional | 17 | 4.8% |
| Total | 354 | 100.0% |
School Enrollment by Age by Funding Source in Watkins Glen
Out of a total of 354 students who are enrolled in schools in Watkins Glen, 43 (12.1%) attend a private institution, while the remaining 311 (87.9%) are enrolled in public schools. The age group of 20 to 24 year olds has the highest likelihood of being enrolled in private schools, with 30 (43.5% in the age bracket) enrolled. Conversely, the age group of 3 to 4 year olds has the lowest likelihood of being enrolled in a private school, with 16 (100.0% in the age bracket) attending a public institution.
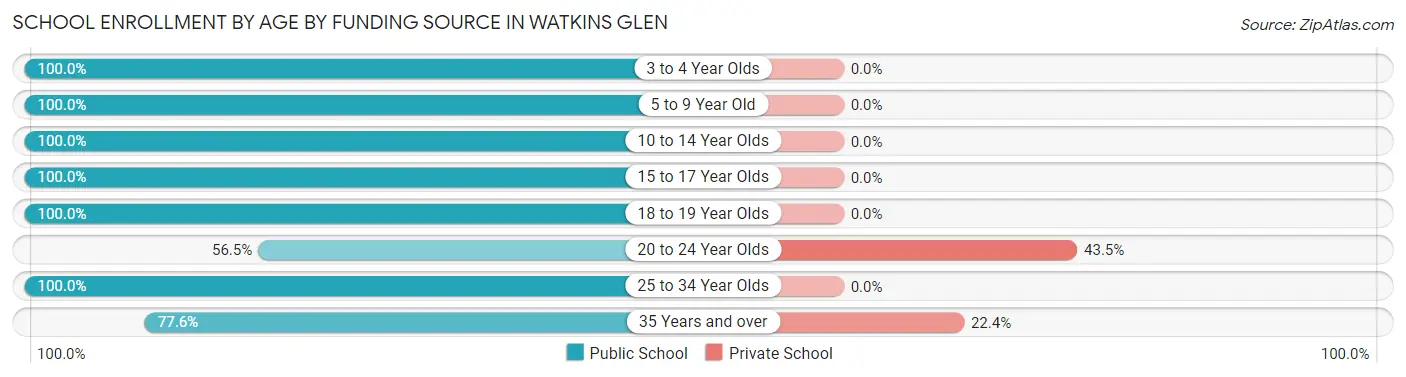
| Age Bracket | Public School | Private School |
| 3 to 4 Year Olds | 16 (100.0%) | 0 (0.0%) |
| 5 to 9 Year Old | 91 (100.0%) | 0 (0.0%) |
| 10 to 14 Year Olds | 46 (100.0%) | 0 (0.0%) |
| 15 to 17 Year Olds | 55 (100.0%) | 0 (0.0%) |
| 18 to 19 Year Olds | 15 (100.0%) | 0 (0.0%) |
| 20 to 24 Year Olds | 39 (56.5%) | 30 (43.5%) |
| 25 to 34 Year Olds | 4 (100.0%) | 0 (0.0%) |
| 35 Years and over | 45 (77.6%) | 13 (22.4%) |
| Total | 311 (87.9%) | 43 (12.1%) |
Educational Attainment by Field of Study in Watkins Glen
Science & technology (90 | 22.8%), business (88 | 22.3%), education (52 | 13.2%), social sciences (34 | 8.6%), and liberal arts & history (28 | 7.1%) are the most common fields of study among 395 individuals in Watkins Glen who have obtained a bachelor's degree or higher.
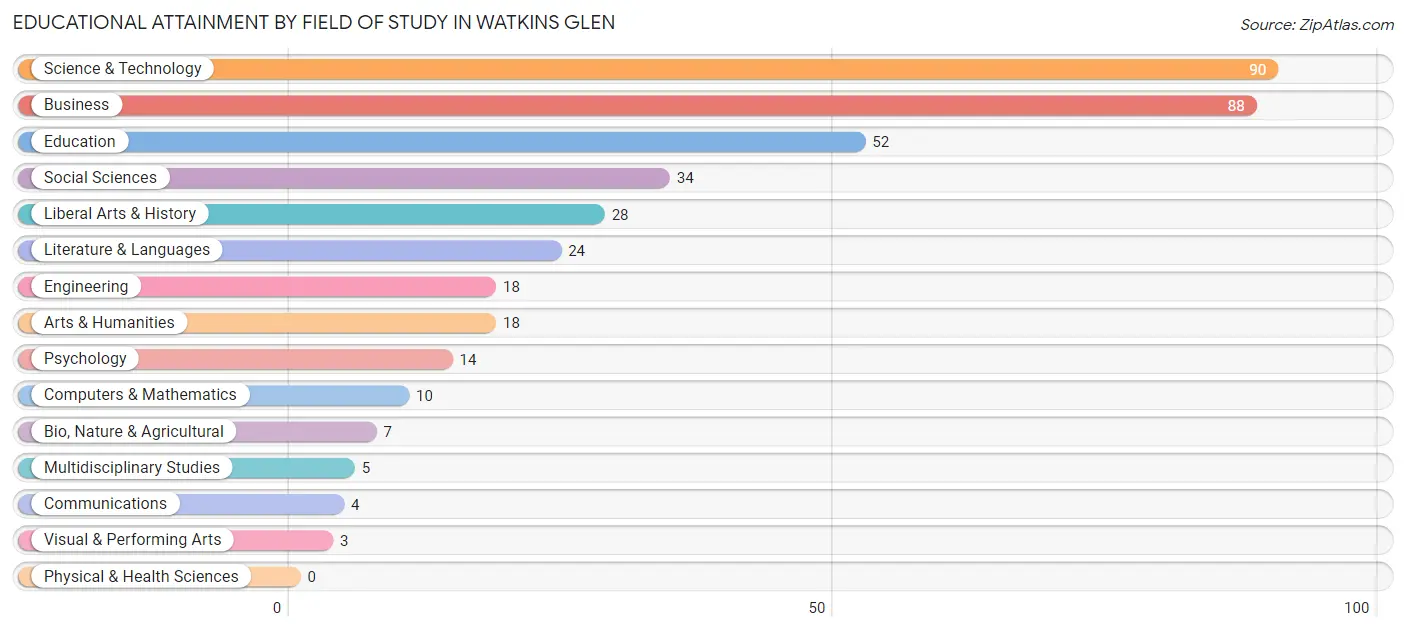
| Field of Study | # Graduates | % Graduates |
| Computers & Mathematics | 10 | 2.5% |
| Bio, Nature & Agricultural | 7 | 1.8% |
| Physical & Health Sciences | 0 | 0.0% |
| Psychology | 14 | 3.5% |
| Social Sciences | 34 | 8.6% |
| Engineering | 18 | 4.6% |
| Multidisciplinary Studies | 5 | 1.3% |
| Science & Technology | 90 | 22.8% |
| Business | 88 | 22.3% |
| Education | 52 | 13.2% |
| Literature & Languages | 24 | 6.1% |
| Liberal Arts & History | 28 | 7.1% |
| Visual & Performing Arts | 3 | 0.8% |
| Communications | 4 | 1.0% |
| Arts & Humanities | 18 | 4.6% |
| Total | 395 | 100.0% |
Transportation & Commute in Watkins Glen
Vehicle Availability by Sex in Watkins Glen
The most prevalent vehicle ownership categories in Watkins Glen are males with 2 vehicles (128, accounting for 31.9%) and females with 2 vehicles (122, making up 29.9%).
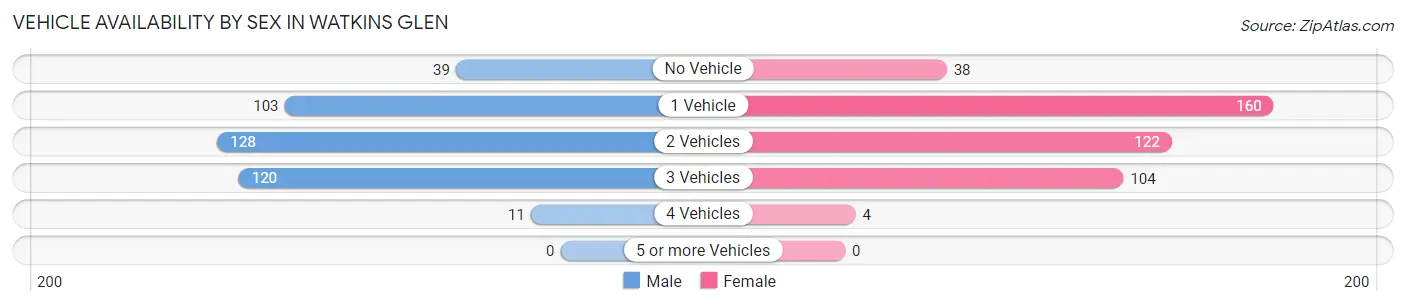
| Vehicles Available | Male | Female |
| No Vehicle | 39 (9.7%) | 38 (8.9%) |
| 1 Vehicle | 103 (25.7%) | 160 (37.4%) |
| 2 Vehicles | 128 (31.9%) | 122 (28.5%) |
| 3 Vehicles | 120 (29.9%) | 104 (24.3%) |
| 4 Vehicles | 11 (2.7%) | 4 (0.9%) |
| 5 or more Vehicles | 0 (0.0%) | 0 (0.0%) |
| Total | 401 (100.0%) | 428 (100.0%) |
Commute Time in Watkins Glen
The most frequently occuring commute durations in Watkins Glen are 5 to 9 minutes (197 commuters, 25.4%), less than 5 minutes (152 commuters, 19.6%), and 30 to 34 minutes (98 commuters, 12.6%).
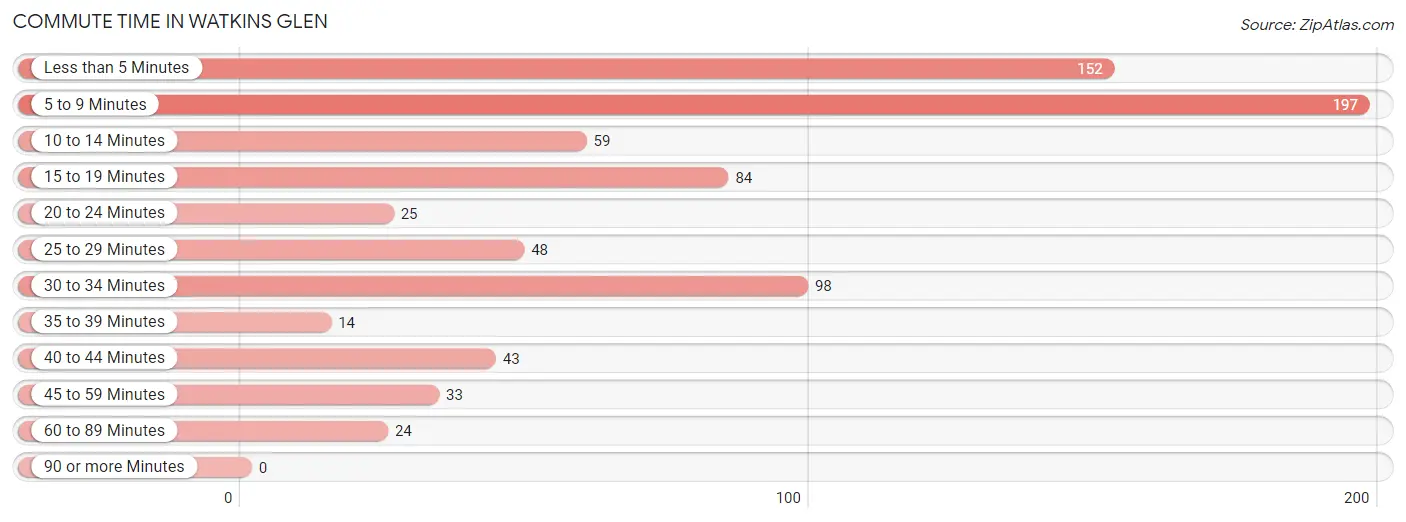
| Commute Time | # Commuters | % Commuters |
| Less than 5 Minutes | 152 | 19.6% |
| 5 to 9 Minutes | 197 | 25.4% |
| 10 to 14 Minutes | 59 | 7.6% |
| 15 to 19 Minutes | 84 | 10.8% |
| 20 to 24 Minutes | 25 | 3.2% |
| 25 to 29 Minutes | 48 | 6.2% |
| 30 to 34 Minutes | 98 | 12.6% |
| 35 to 39 Minutes | 14 | 1.8% |
| 40 to 44 Minutes | 43 | 5.5% |
| 45 to 59 Minutes | 33 | 4.3% |
| 60 to 89 Minutes | 24 | 3.1% |
| 90 or more Minutes | 0 | 0.0% |
Commute Time by Sex in Watkins Glen
The most common commute times in Watkins Glen are less than 5 minutes (77 commuters, 20.4%) for males and 5 to 9 minutes (121 commuters, 30.3%) for females.
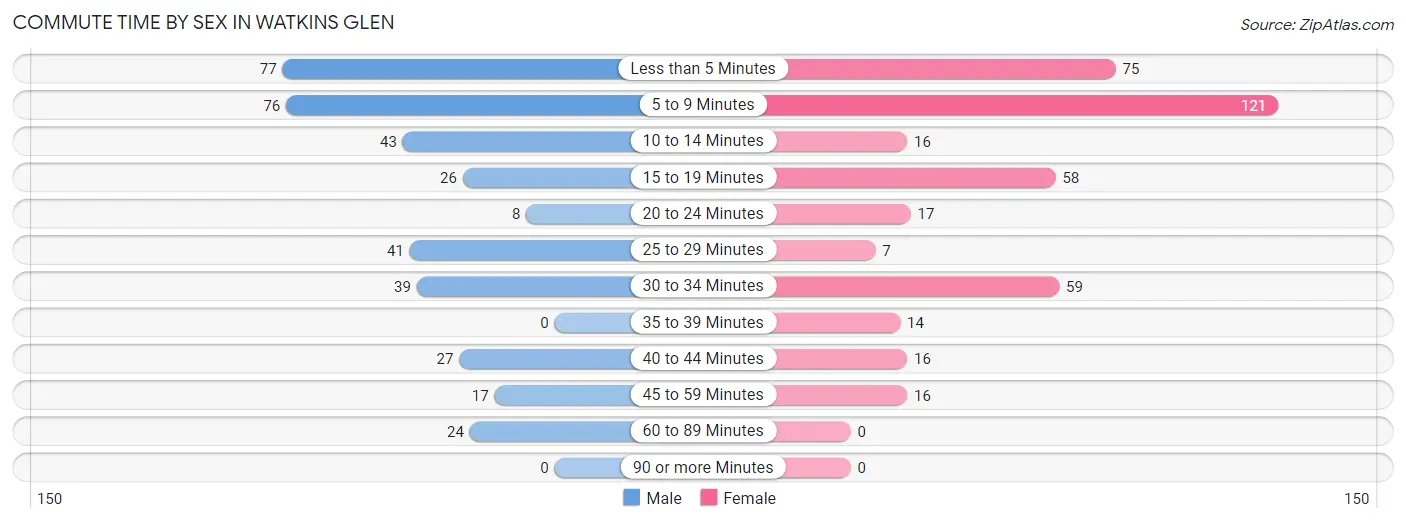
| Commute Time | Male | Female |
| Less than 5 Minutes | 77 (20.4%) | 75 (18.8%) |
| 5 to 9 Minutes | 76 (20.1%) | 121 (30.3%) |
| 10 to 14 Minutes | 43 (11.4%) | 16 (4.0%) |
| 15 to 19 Minutes | 26 (6.9%) | 58 (14.5%) |
| 20 to 24 Minutes | 8 (2.1%) | 17 (4.3%) |
| 25 to 29 Minutes | 41 (10.8%) | 7 (1.8%) |
| 30 to 34 Minutes | 39 (10.3%) | 59 (14.8%) |
| 35 to 39 Minutes | 0 (0.0%) | 14 (3.5%) |
| 40 to 44 Minutes | 27 (7.1%) | 16 (4.0%) |
| 45 to 59 Minutes | 17 (4.5%) | 16 (4.0%) |
| 60 to 89 Minutes | 24 (6.4%) | 0 (0.0%) |
| 90 or more Minutes | 0 (0.0%) | 0 (0.0%) |
Time of Departure to Work by Sex in Watkins Glen
The most frequent times of departure to work in Watkins Glen are 10:00 AM to 10:59 AM (53, 14.0%) for males and 7:00 AM to 7:29 AM (68, 17.0%) for females.
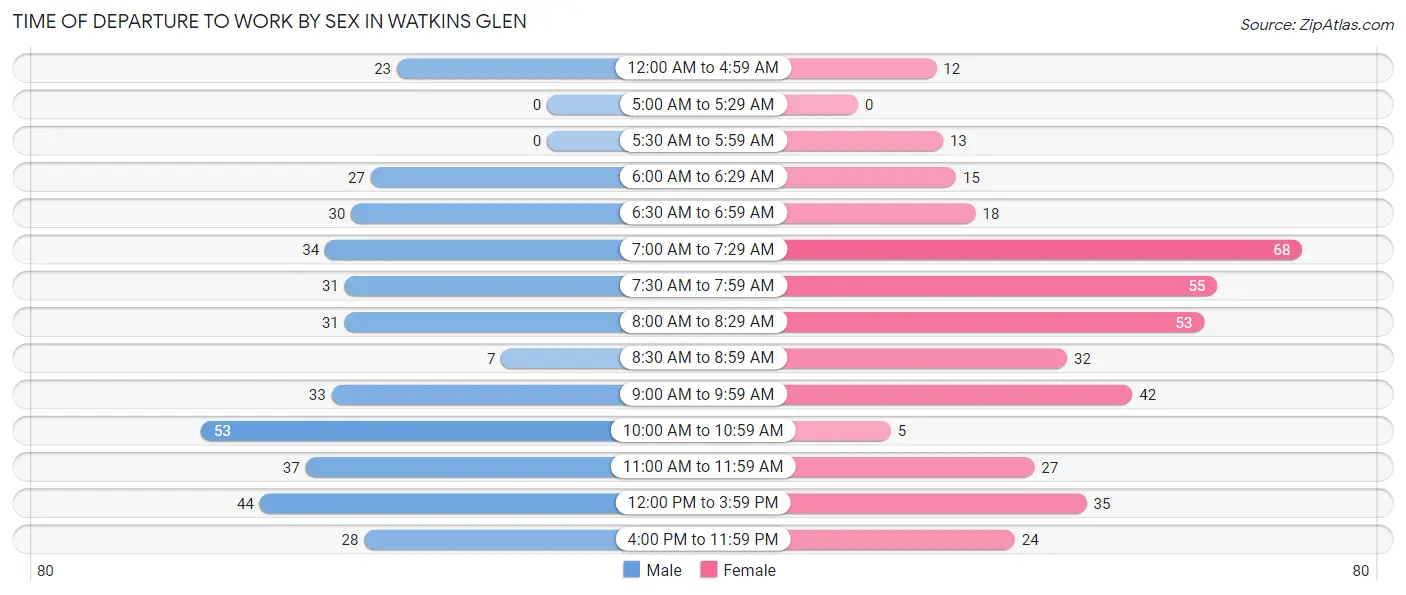
| Time of Departure | Male | Female |
| 12:00 AM to 4:59 AM | 23 (6.1%) | 12 (3.0%) |
| 5:00 AM to 5:29 AM | 0 (0.0%) | 0 (0.0%) |
| 5:30 AM to 5:59 AM | 0 (0.0%) | 13 (3.3%) |
| 6:00 AM to 6:29 AM | 27 (7.1%) | 15 (3.8%) |
| 6:30 AM to 6:59 AM | 30 (7.9%) | 18 (4.5%) |
| 7:00 AM to 7:29 AM | 34 (9.0%) | 68 (17.0%) |
| 7:30 AM to 7:59 AM | 31 (8.2%) | 55 (13.8%) |
| 8:00 AM to 8:29 AM | 31 (8.2%) | 53 (13.3%) |
| 8:30 AM to 8:59 AM | 7 (1.8%) | 32 (8.0%) |
| 9:00 AM to 9:59 AM | 33 (8.7%) | 42 (10.5%) |
| 10:00 AM to 10:59 AM | 53 (14.0%) | 5 (1.3%) |
| 11:00 AM to 11:59 AM | 37 (9.8%) | 27 (6.8%) |
| 12:00 PM to 3:59 PM | 44 (11.6%) | 35 (8.8%) |
| 4:00 PM to 11:59 PM | 28 (7.4%) | 24 (6.0%) |
| Total | 378 (100.0%) | 399 (100.0%) |
Housing Occupancy in Watkins Glen
Occupancy by Ownership in Watkins Glen
Of the total 882 dwellings in Watkins Glen, owner-occupied units account for 418 (47.4%), while renter-occupied units make up 464 (52.6%).
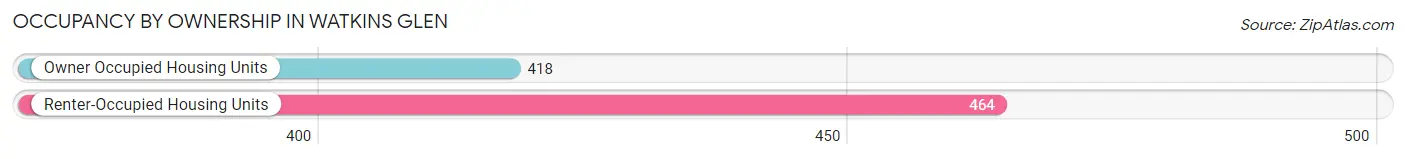
| Occupancy | # Housing Units | % Housing Units |
| Owner Occupied Housing Units | 418 | 47.4% |
| Renter-Occupied Housing Units | 464 | 52.6% |
| Total Occupied Housing Units | 882 | 100.0% |
Occupancy by Household Size in Watkins Glen
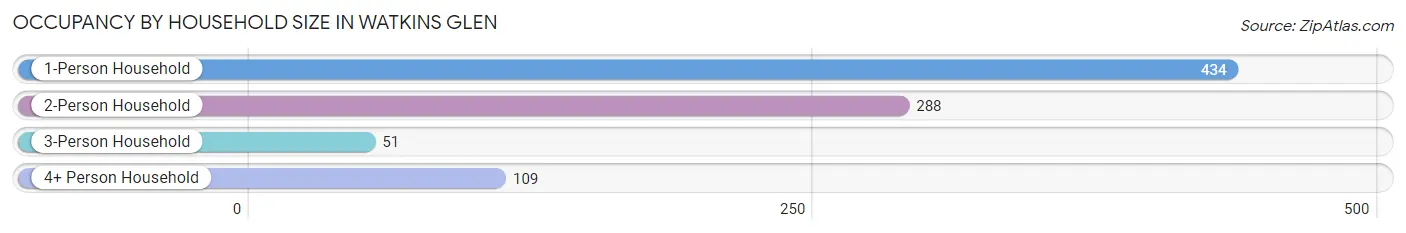
| Household Size | # Housing Units | % Housing Units |
| 1-Person Household | 434 | 49.2% |
| 2-Person Household | 288 | 32.7% |
| 3-Person Household | 51 | 5.8% |
| 4+ Person Household | 109 | 12.4% |
| Total Housing Units | 882 | 100.0% |
Occupancy by Ownership by Household Size in Watkins Glen
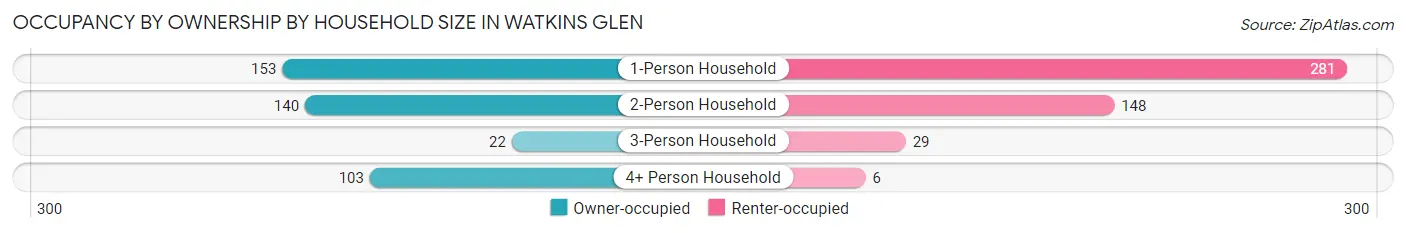
| Household Size | Owner-occupied | Renter-occupied |
| 1-Person Household | 153 (35.2%) | 281 (64.7%) |
| 2-Person Household | 140 (48.6%) | 148 (51.4%) |
| 3-Person Household | 22 (43.1%) | 29 (56.9%) |
| 4+ Person Household | 103 (94.5%) | 6 (5.5%) |
| Total Housing Units | 418 (47.4%) | 464 (52.6%) |
Occupancy by Educational Attainment in Watkins Glen
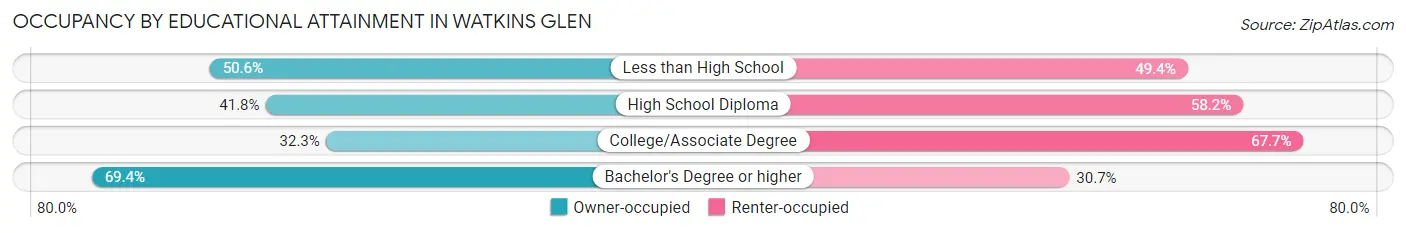
| Household Size | Owner-occupied | Renter-occupied |
| Less than High School | 40 (50.6%) | 39 (49.4%) |
| High School Diploma | 97 (41.8%) | 135 (58.2%) |
| College/Associate Degree | 100 (32.3%) | 210 (67.7%) |
| Bachelor's Degree or higher | 181 (69.4%) | 80 (30.6%) |
Occupancy by Age of Householder in Watkins Glen
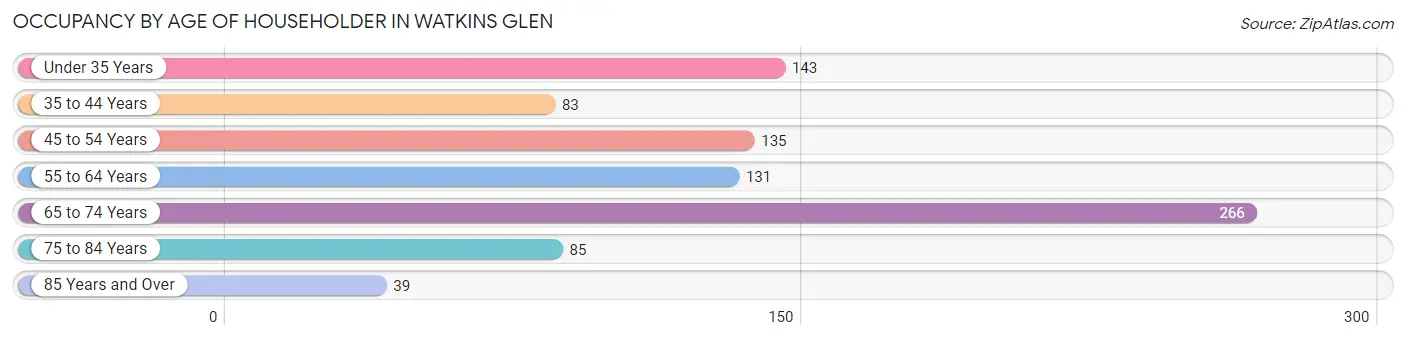
| Age Bracket | # Households | % Households |
| Under 35 Years | 143 | 16.2% |
| 35 to 44 Years | 83 | 9.4% |
| 45 to 54 Years | 135 | 15.3% |
| 55 to 64 Years | 131 | 14.8% |
| 65 to 74 Years | 266 | 30.2% |
| 75 to 84 Years | 85 | 9.6% |
| 85 Years and Over | 39 | 4.4% |
| Total | 882 | 100.0% |
Housing Finances in Watkins Glen
Median Income by Occupancy in Watkins Glen
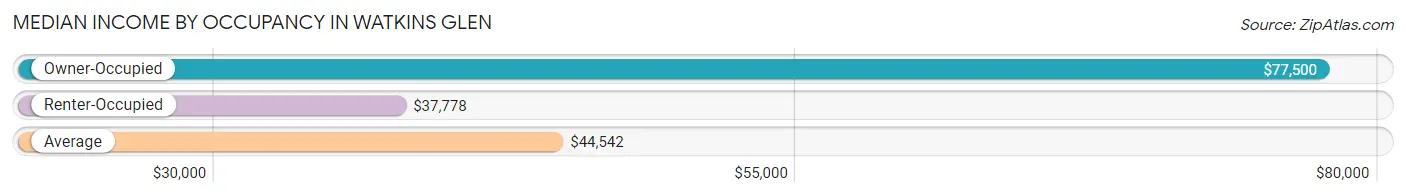
| Occupancy Type | # Households | Median Income |
| Owner-Occupied | 418 (47.4%) | $77,500 |
| Renter-Occupied | 464 (52.6%) | $37,778 |
| Average | 882 (100.0%) | $44,542 |
Occupancy by Householder Income Bracket in Watkins Glen
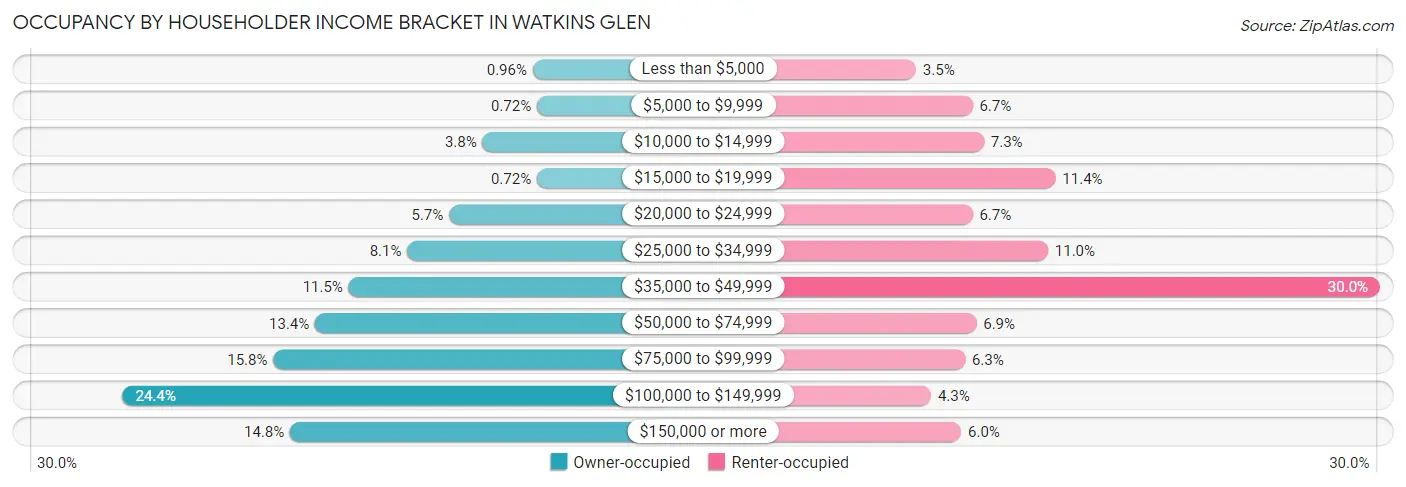
| Income Bracket | Owner-occupied | Renter-occupied |
| Less than $5,000 | 4 (1.0%) | 16 (3.5%) |
| $5,000 to $9,999 | 3 (0.7%) | 31 (6.7%) |
| $10,000 to $14,999 | 16 (3.8%) | 34 (7.3%) |
| $15,000 to $19,999 | 3 (0.7%) | 53 (11.4%) |
| $20,000 to $24,999 | 24 (5.7%) | 31 (6.7%) |
| $25,000 to $34,999 | 34 (8.1%) | 51 (11.0%) |
| $35,000 to $49,999 | 48 (11.5%) | 139 (30.0%) |
| $50,000 to $74,999 | 56 (13.4%) | 32 (6.9%) |
| $75,000 to $99,999 | 66 (15.8%) | 29 (6.2%) |
| $100,000 to $149,999 | 102 (24.4%) | 20 (4.3%) |
| $150,000 or more | 62 (14.8%) | 28 (6.0%) |
| Total | 418 (100.0%) | 464 (100.0%) |
Monthly Housing Cost Tiers in Watkins Glen
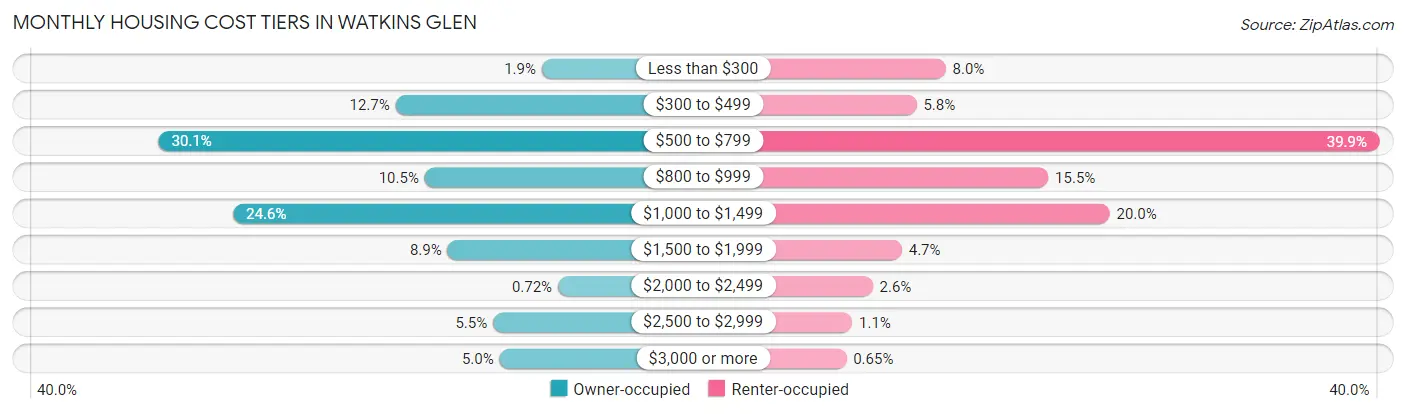
| Monthly Cost | Owner-occupied | Renter-occupied |
| Less than $300 | 8 (1.9%) | 37 (8.0%) |
| $300 to $499 | 53 (12.7%) | 27 (5.8%) |
| $500 to $799 | 126 (30.1%) | 185 (39.9%) |
| $800 to $999 | 44 (10.5%) | 72 (15.5%) |
| $1,000 to $1,499 | 103 (24.6%) | 93 (20.0%) |
| $1,500 to $1,999 | 37 (8.8%) | 22 (4.7%) |
| $2,000 to $2,499 | 3 (0.7%) | 12 (2.6%) |
| $2,500 to $2,999 | 23 (5.5%) | 5 (1.1%) |
| $3,000 or more | 21 (5.0%) | 3 (0.6%) |
| Total | 418 (100.0%) | 464 (100.0%) |
Physical Housing Characteristics in Watkins Glen
Housing Structures in Watkins Glen
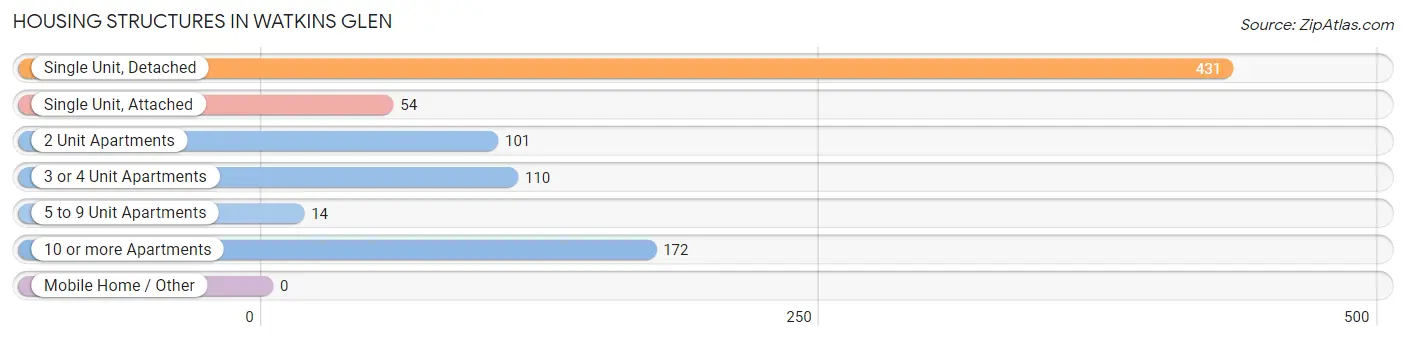
| Structure Type | # Housing Units | % Housing Units |
| Single Unit, Detached | 431 | 48.9% |
| Single Unit, Attached | 54 | 6.1% |
| 2 Unit Apartments | 101 | 11.5% |
| 3 or 4 Unit Apartments | 110 | 12.5% |
| 5 to 9 Unit Apartments | 14 | 1.6% |
| 10 or more Apartments | 172 | 19.5% |
| Mobile Home / Other | 0 | 0.0% |
| Total | 882 | 100.0% |
Housing Structures by Occupancy in Watkins Glen
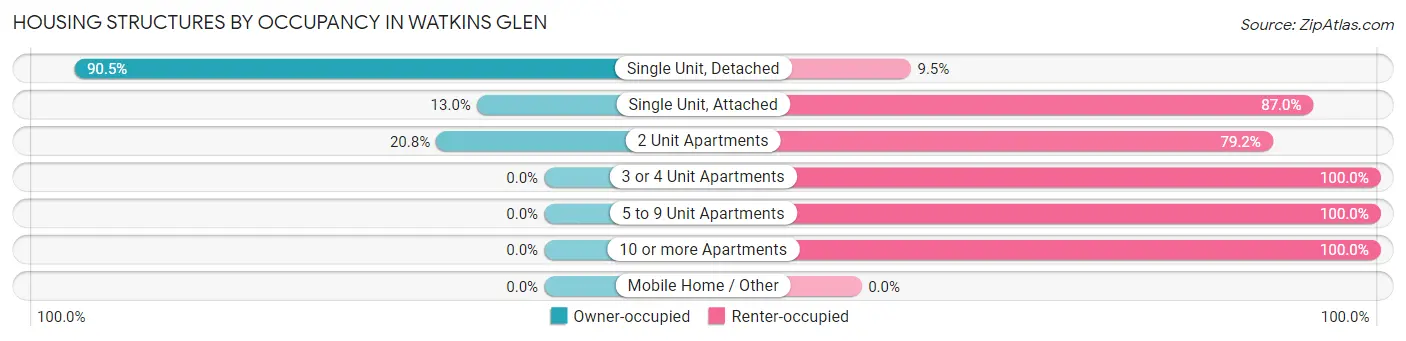
| Structure Type | Owner-occupied | Renter-occupied |
| Single Unit, Detached | 390 (90.5%) | 41 (9.5%) |
| Single Unit, Attached | 7 (13.0%) | 47 (87.0%) |
| 2 Unit Apartments | 21 (20.8%) | 80 (79.2%) |
| 3 or 4 Unit Apartments | 0 (0.0%) | 110 (100.0%) |
| 5 to 9 Unit Apartments | 0 (0.0%) | 14 (100.0%) |
| 10 or more Apartments | 0 (0.0%) | 172 (100.0%) |
| Mobile Home / Other | 0 (0.0%) | 0 (0.0%) |
| Total | 418 (47.4%) | 464 (52.6%) |
Housing Structures by Number of Rooms in Watkins Glen
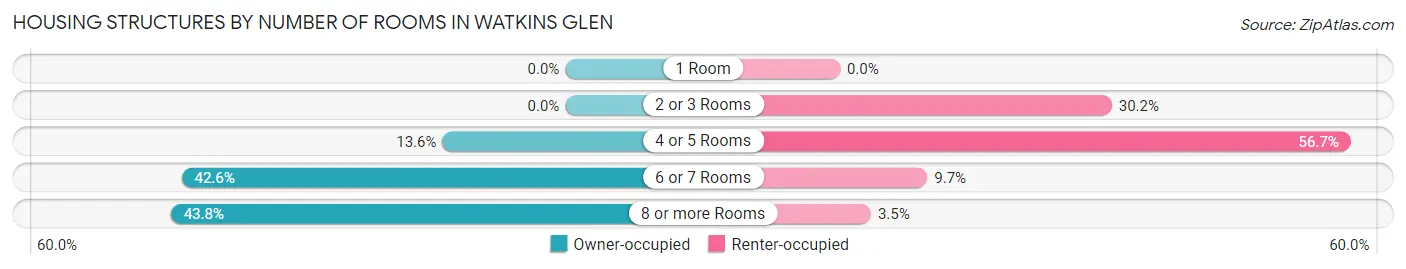
| Number of Rooms | Owner-occupied | Renter-occupied |
| 1 Room | 0 (0.0%) | 0 (0.0%) |
| 2 or 3 Rooms | 0 (0.0%) | 140 (30.2%) |
| 4 or 5 Rooms | 57 (13.6%) | 263 (56.7%) |
| 6 or 7 Rooms | 178 (42.6%) | 45 (9.7%) |
| 8 or more Rooms | 183 (43.8%) | 16 (3.5%) |
| Total | 418 (100.0%) | 464 (100.0%) |
Housing Structure by Heating Type in Watkins Glen
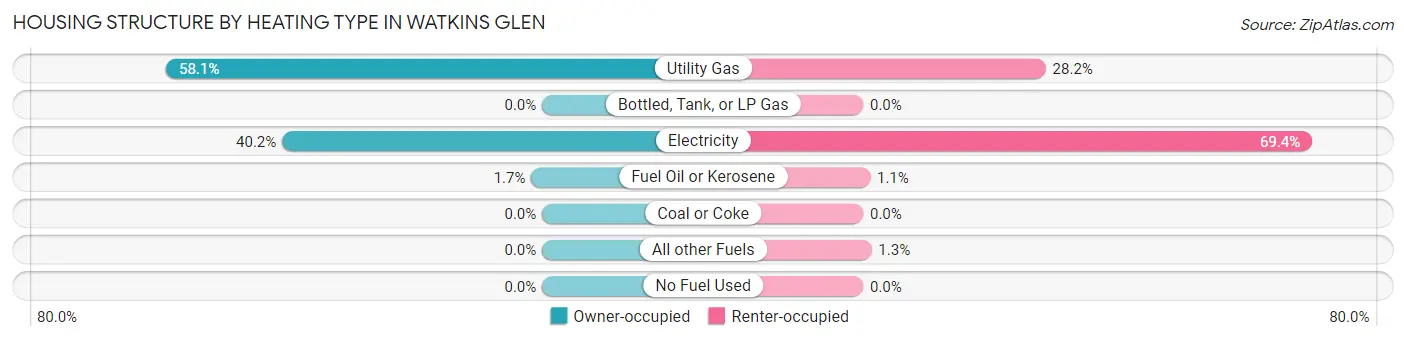
| Heating Type | Owner-occupied | Renter-occupied |
| Utility Gas | 243 (58.1%) | 131 (28.2%) |
| Bottled, Tank, or LP Gas | 0 (0.0%) | 0 (0.0%) |
| Electricity | 168 (40.2%) | 322 (69.4%) |
| Fuel Oil or Kerosene | 7 (1.7%) | 5 (1.1%) |
| Coal or Coke | 0 (0.0%) | 0 (0.0%) |
| All other Fuels | 0 (0.0%) | 6 (1.3%) |
| No Fuel Used | 0 (0.0%) | 0 (0.0%) |
| Total | 418 (100.0%) | 464 (100.0%) |
Household Vehicle Usage in Watkins Glen
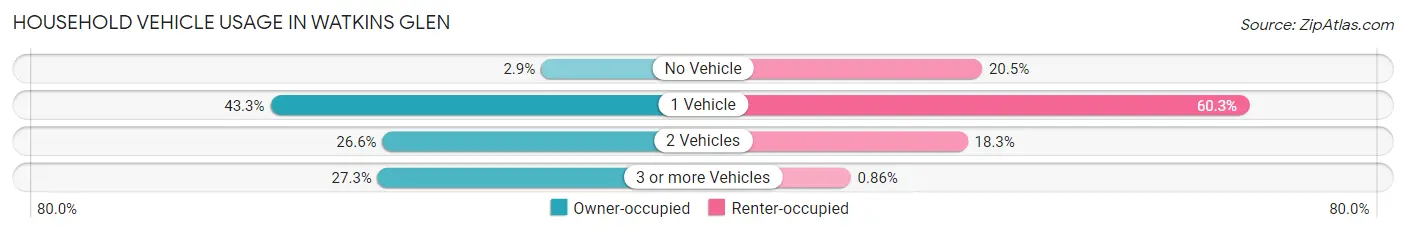
| Vehicles per Household | Owner-occupied | Renter-occupied |
| No Vehicle | 12 (2.9%) | 95 (20.5%) |
| 1 Vehicle | 181 (43.3%) | 280 (60.3%) |
| 2 Vehicles | 111 (26.6%) | 85 (18.3%) |
| 3 or more Vehicles | 114 (27.3%) | 4 (0.9%) |
| Total | 418 (100.0%) | 464 (100.0%) |
Real Estate & Mortgages in Watkins Glen
Real Estate and Mortgage Overview in Watkins Glen
| Characteristic | Without Mortgage | With Mortgage |
| Housing Units | 219 | 199 |
| Median Property Value | $152,800 | $192,200 |
| Median Household Income | $63,750 | $41 |
| Monthly Housing Costs | $567 | $21 |
| Real Estate Taxes | $3,184 | $0 |
Property Value by Mortgage Status in Watkins Glen
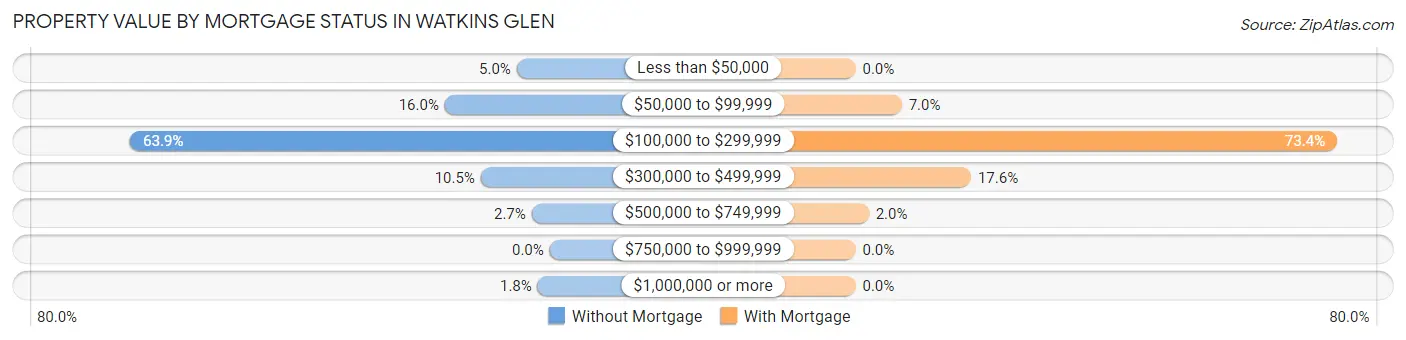
| Property Value | Without Mortgage | With Mortgage |
| Less than $50,000 | 11 (5.0%) | 0 (0.0%) |
| $50,000 to $99,999 | 35 (16.0%) | 14 (7.0%) |
| $100,000 to $299,999 | 140 (63.9%) | 146 (73.4%) |
| $300,000 to $499,999 | 23 (10.5%) | 35 (17.6%) |
| $500,000 to $749,999 | 6 (2.7%) | 4 (2.0%) |
| $750,000 to $999,999 | 0 (0.0%) | 0 (0.0%) |
| $1,000,000 or more | 4 (1.8%) | 0 (0.0%) |
| Total | 219 (100.0%) | 199 (100.0%) |
Household Income by Mortgage Status in Watkins Glen
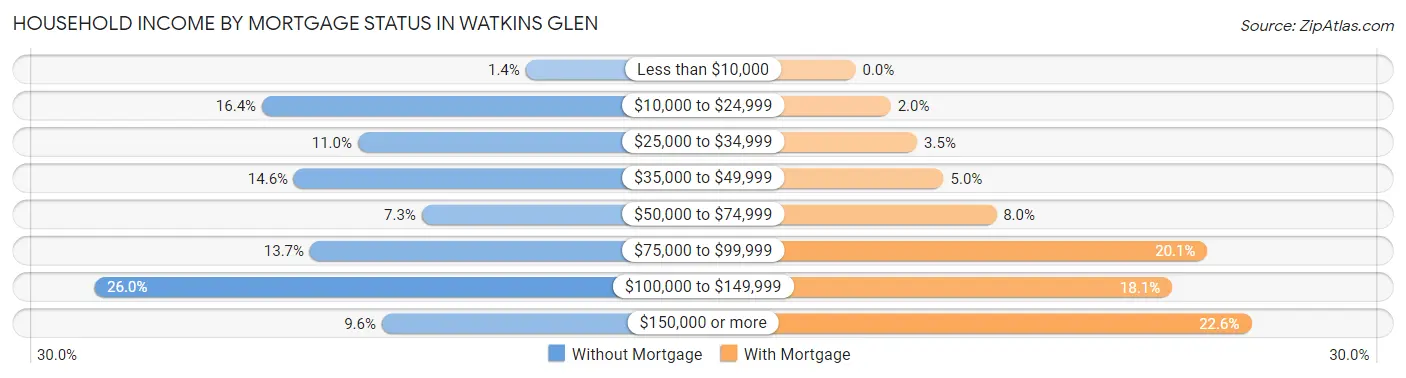
| Household Income | Without Mortgage | With Mortgage |
| Less than $10,000 | 3 (1.4%) | 0 (0.0%) |
| $10,000 to $24,999 | 36 (16.4%) | 4 (2.0%) |
| $25,000 to $34,999 | 24 (11.0%) | 7 (3.5%) |
| $35,000 to $49,999 | 32 (14.6%) | 10 (5.0%) |
| $50,000 to $74,999 | 16 (7.3%) | 16 (8.0%) |
| $75,000 to $99,999 | 30 (13.7%) | 40 (20.1%) |
| $100,000 to $149,999 | 57 (26.0%) | 36 (18.1%) |
| $150,000 or more | 21 (9.6%) | 45 (22.6%) |
| Total | 219 (100.0%) | 199 (100.0%) |
Property Value to Household Income Ratio in Watkins Glen
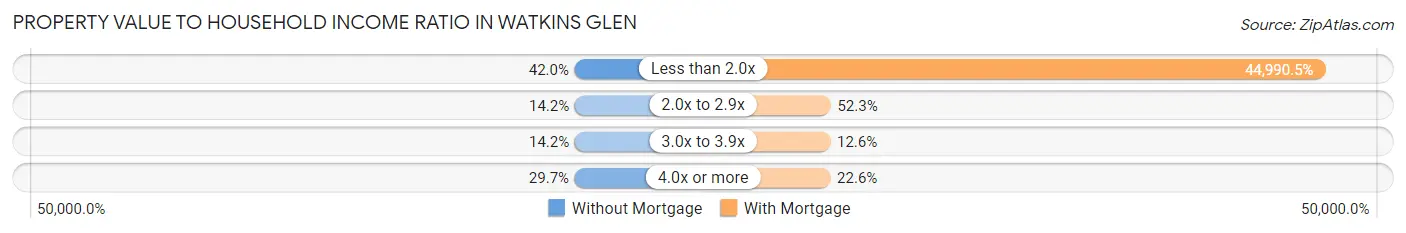
| Value-to-Income Ratio | Without Mortgage | With Mortgage |
| Less than 2.0x | 92 (42.0%) | 89,531 (44,990.4%) |
| 2.0x to 2.9x | 31 (14.2%) | 104 (52.3%) |
| 3.0x to 3.9x | 31 (14.2%) | 25 (12.6%) |
| 4.0x or more | 65 (29.7%) | 45 (22.6%) |
| Total | 219 (100.0%) | 199 (100.0%) |
Real Estate Taxes by Mortgage Status in Watkins Glen
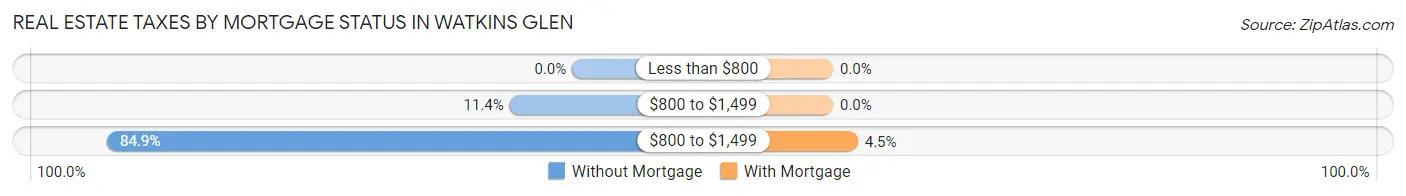
| Property Taxes | Without Mortgage | With Mortgage |
| Less than $800 | 0 (0.0%) | 0 (0.0%) |
| $800 to $1,499 | 25 (11.4%) | 0 (0.0%) |
| $800 to $1,499 | 186 (84.9%) | 9 (4.5%) |
| Total | 219 (100.0%) | 199 (100.0%) |
Health & Disability in Watkins Glen
Health Insurance Coverage by Age in Watkins Glen
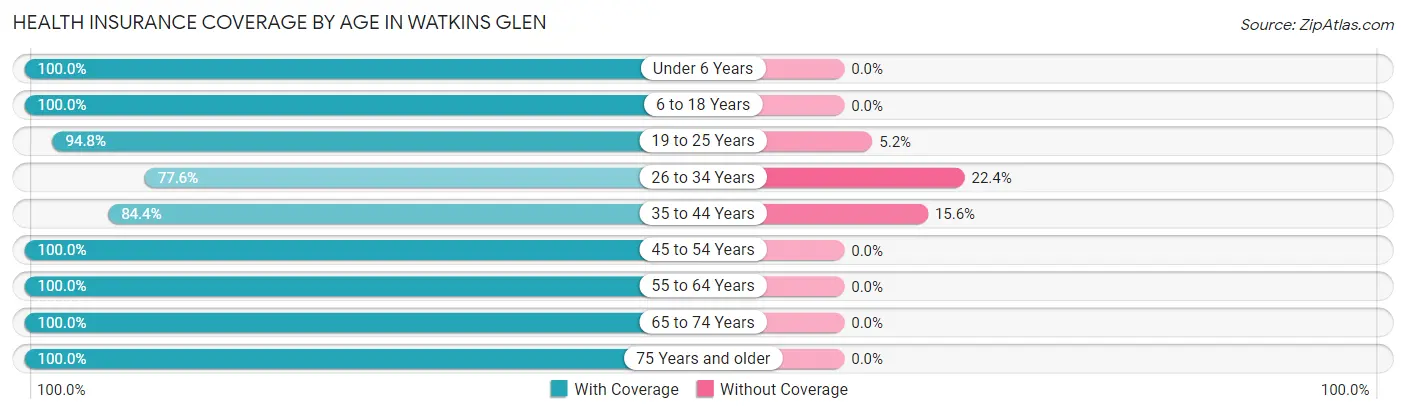
| Age Bracket | With Coverage | Without Coverage |
| Under 6 Years | 94 (100.0%) | 0 (0.0%) |
| 6 to 18 Years | 203 (100.0%) | 0 (0.0%) |
| 19 to 25 Years | 145 (94.8%) | 8 (5.2%) |
| 26 to 34 Years | 166 (77.6%) | 48 (22.4%) |
| 35 to 44 Years | 119 (84.4%) | 22 (15.6%) |
| 45 to 54 Years | 219 (100.0%) | 0 (0.0%) |
| 55 to 64 Years | 200 (100.0%) | 0 (0.0%) |
| 65 to 74 Years | 377 (100.0%) | 0 (0.0%) |
| 75 Years and older | 151 (100.0%) | 0 (0.0%) |
| Total | 1,674 (95.6%) | 78 (4.4%) |
Health Insurance Coverage by Citizenship Status in Watkins Glen
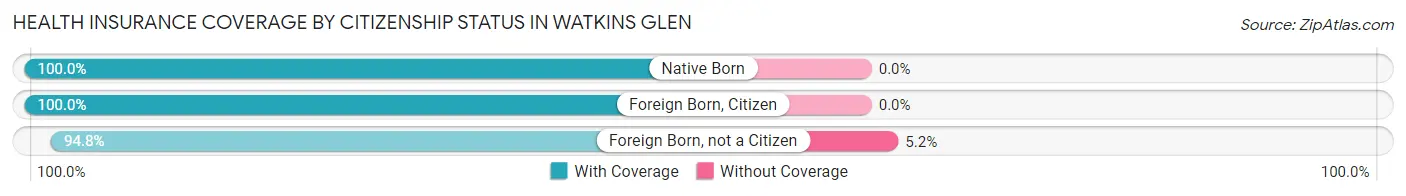
| Citizenship Status | With Coverage | Without Coverage |
| Native Born | 94 (100.0%) | 0 (0.0%) |
| Foreign Born, Citizen | 203 (100.0%) | 0 (0.0%) |
| Foreign Born, not a Citizen | 145 (94.8%) | 8 (5.2%) |
Health Insurance Coverage by Household Income in Watkins Glen
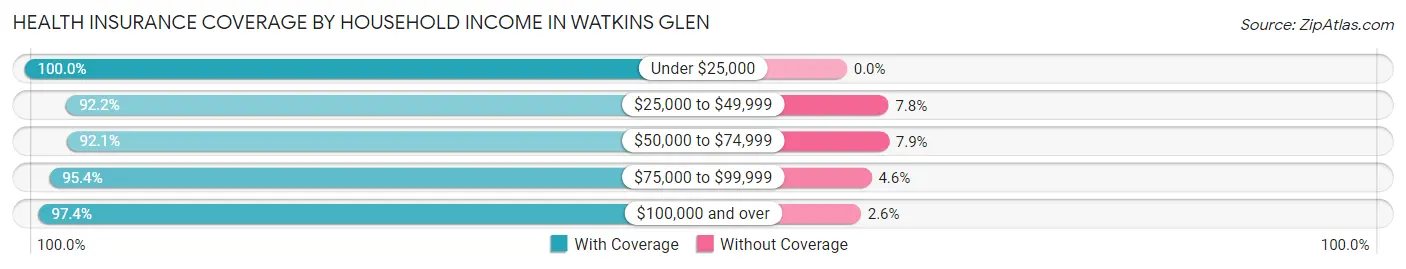
| Household Income | With Coverage | Without Coverage |
| Under $25,000 | 236 (100.0%) | 0 (0.0%) |
| $25,000 to $49,999 | 437 (92.2%) | 37 (7.8%) |
| $50,000 to $74,999 | 187 (92.1%) | 16 (7.9%) |
| $75,000 to $99,999 | 165 (95.4%) | 8 (4.6%) |
| $100,000 and over | 632 (97.4%) | 17 (2.6%) |
Public vs Private Health Insurance Coverage by Age in Watkins Glen
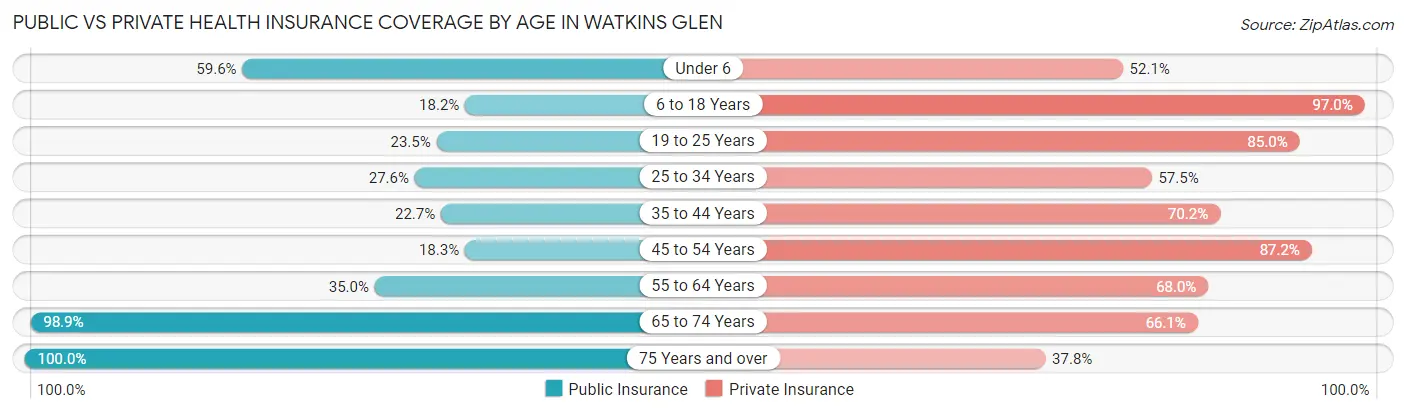
| Age Bracket | Public Insurance | Private Insurance |
| Under 6 | 56 (59.6%) | 49 (52.1%) |
| 6 to 18 Years | 37 (18.2%) | 197 (97.0%) |
| 19 to 25 Years | 36 (23.5%) | 130 (85.0%) |
| 25 to 34 Years | 59 (27.6%) | 123 (57.5%) |
| 35 to 44 Years | 32 (22.7%) | 99 (70.2%) |
| 45 to 54 Years | 40 (18.3%) | 191 (87.2%) |
| 55 to 64 Years | 70 (35.0%) | 136 (68.0%) |
| 65 to 74 Years | 373 (98.9%) | 249 (66.0%) |
| 75 Years and over | 151 (100.0%) | 57 (37.8%) |
| Total | 854 (48.7%) | 1,231 (70.3%) |
Disability Status by Sex by Age in Watkins Glen
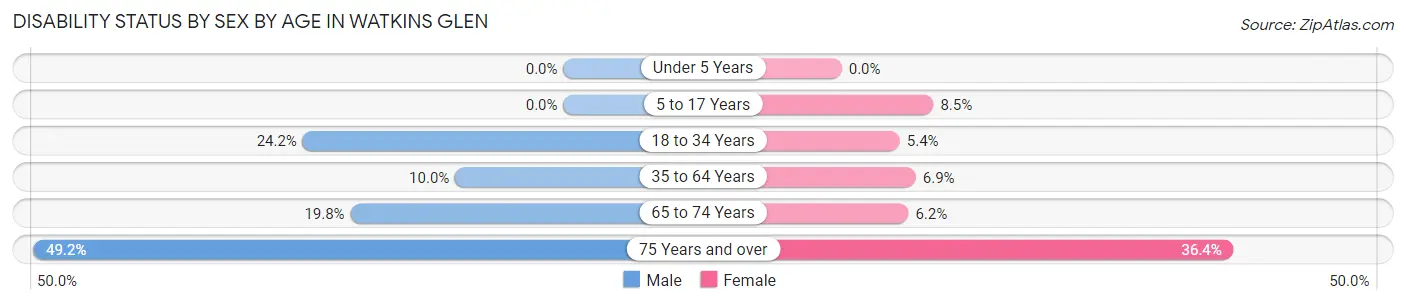
| Age Bracket | Male | Female |
| Under 5 Years | 0 (0.0%) | 0 (0.0%) |
| 5 to 17 Years | 0 (0.0%) | 8 (8.5%) |
| 18 to 34 Years | 52 (24.2%) | 9 (5.4%) |
| 35 to 64 Years | 27 (10.0%) | 20 (6.9%) |
| 65 to 74 Years | 33 (19.8%) | 13 (6.2%) |
| 75 Years and over | 31 (49.2%) | 32 (36.4%) |
Disability Class by Sex by Age in Watkins Glen
Disability Class: Hearing Difficulty
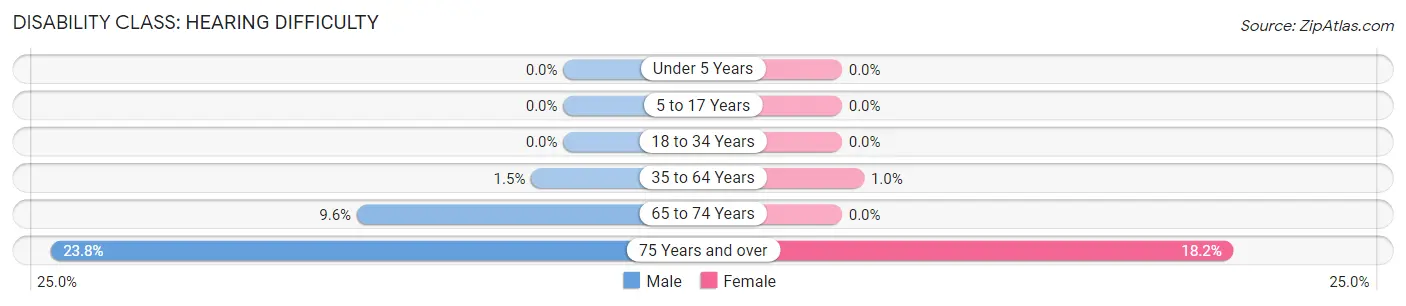
| Age Bracket | Male | Female |
| Under 5 Years | 0 (0.0%) | 0 (0.0%) |
| 5 to 17 Years | 0 (0.0%) | 0 (0.0%) |
| 18 to 34 Years | 0 (0.0%) | 0 (0.0%) |
| 35 to 64 Years | 4 (1.5%) | 3 (1.0%) |
| 65 to 74 Years | 16 (9.6%) | 0 (0.0%) |
| 75 Years and over | 15 (23.8%) | 16 (18.2%) |
Disability Class: Vision Difficulty
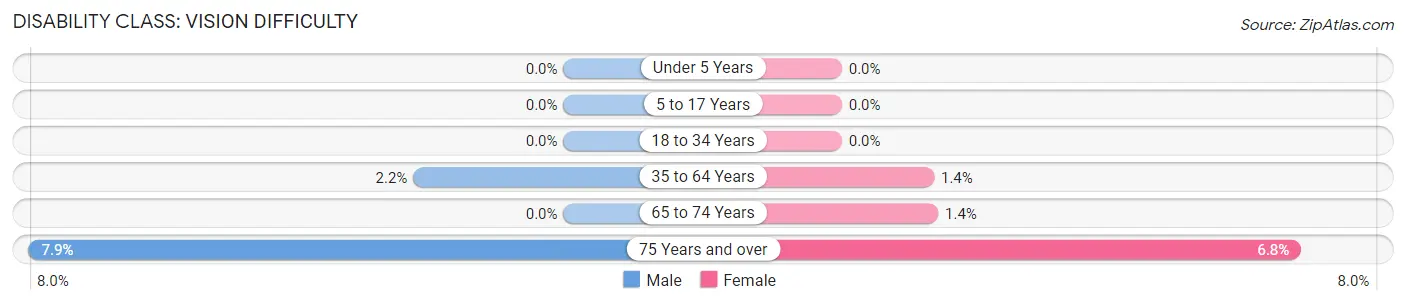
| Age Bracket | Male | Female |
| Under 5 Years | 0 (0.0%) | 0 (0.0%) |
| 5 to 17 Years | 0 (0.0%) | 0 (0.0%) |
| 18 to 34 Years | 0 (0.0%) | 0 (0.0%) |
| 35 to 64 Years | 6 (2.2%) | 4 (1.4%) |
| 65 to 74 Years | 0 (0.0%) | 3 (1.4%) |
| 75 Years and over | 5 (7.9%) | 6 (6.8%) |
Disability Class: Cognitive Difficulty
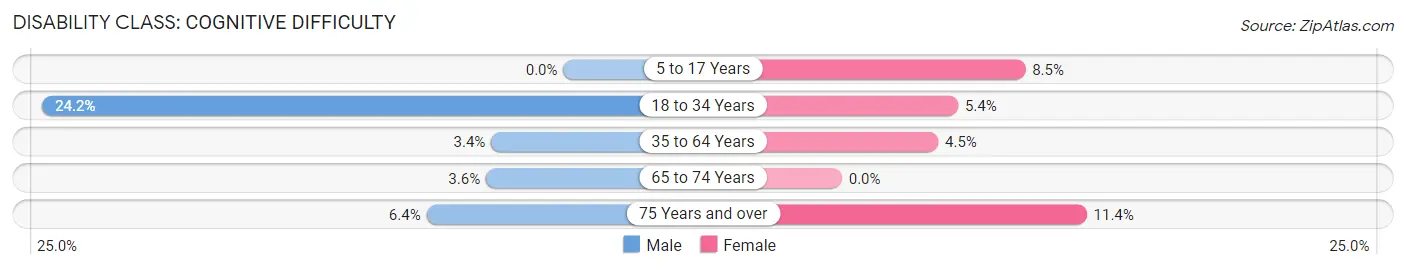
| Age Bracket | Male | Female |
| 5 to 17 Years | 0 (0.0%) | 8 (8.5%) |
| 18 to 34 Years | 52 (24.2%) | 9 (5.4%) |
| 35 to 64 Years | 9 (3.4%) | 13 (4.5%) |
| 65 to 74 Years | 6 (3.6%) | 0 (0.0%) |
| 75 Years and over | 4 (6.4%) | 10 (11.4%) |
Disability Class: Ambulatory Difficulty
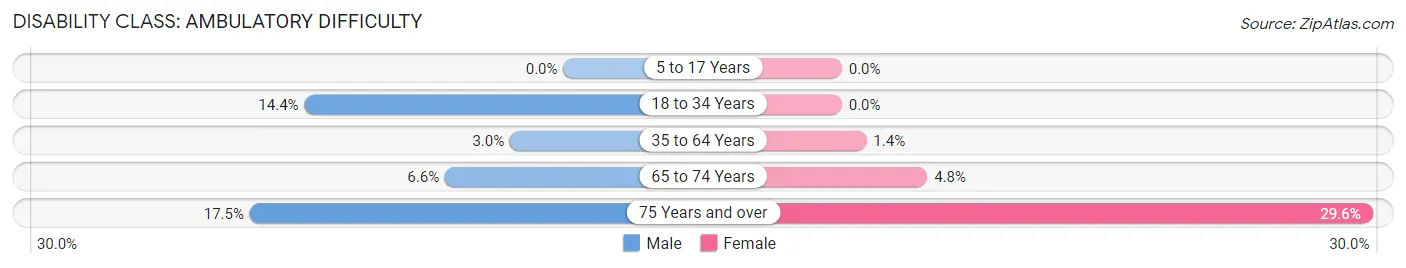
| Age Bracket | Male | Female |
| 5 to 17 Years | 0 (0.0%) | 0 (0.0%) |
| 18 to 34 Years | 31 (14.4%) | 0 (0.0%) |
| 35 to 64 Years | 8 (3.0%) | 4 (1.4%) |
| 65 to 74 Years | 11 (6.6%) | 10 (4.8%) |
| 75 Years and over | 11 (17.5%) | 26 (29.5%) |
Disability Class: Self-Care Difficulty
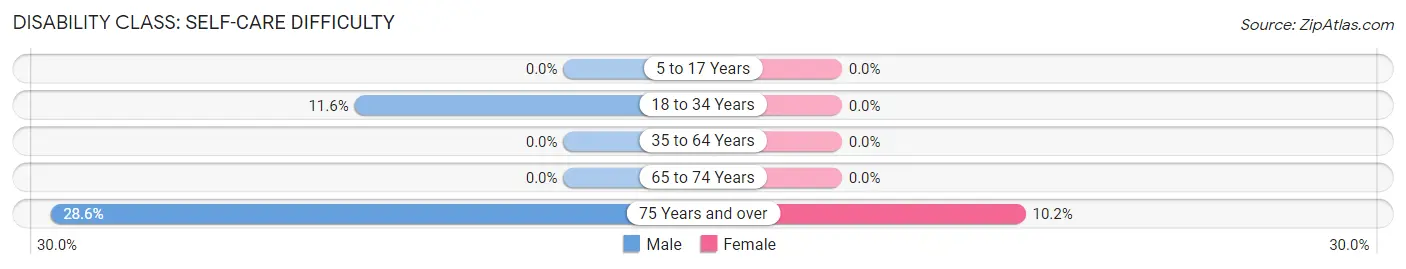
| Age Bracket | Male | Female |
| 5 to 17 Years | 0 (0.0%) | 0 (0.0%) |
| 18 to 34 Years | 25 (11.6%) | 0 (0.0%) |
| 35 to 64 Years | 0 (0.0%) | 0 (0.0%) |
| 65 to 74 Years | 0 (0.0%) | 0 (0.0%) |
| 75 Years and over | 18 (28.6%) | 9 (10.2%) |
Technology Access in Watkins Glen
Computing Device Access in Watkins Glen
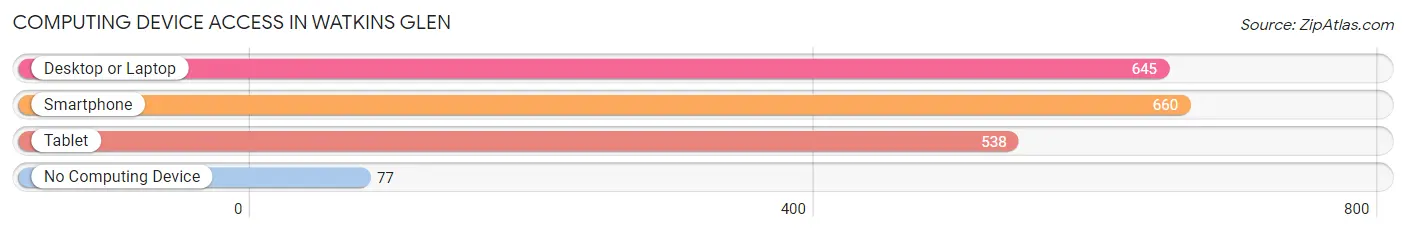
| Device Type | # Households | % Households |
| Desktop or Laptop | 645 | 73.1% |
| Smartphone | 660 | 74.8% |
| Tablet | 538 | 61.0% |
| No Computing Device | 77 | 8.7% |
| Total | 882 | 100.0% |
Internet Access in Watkins Glen
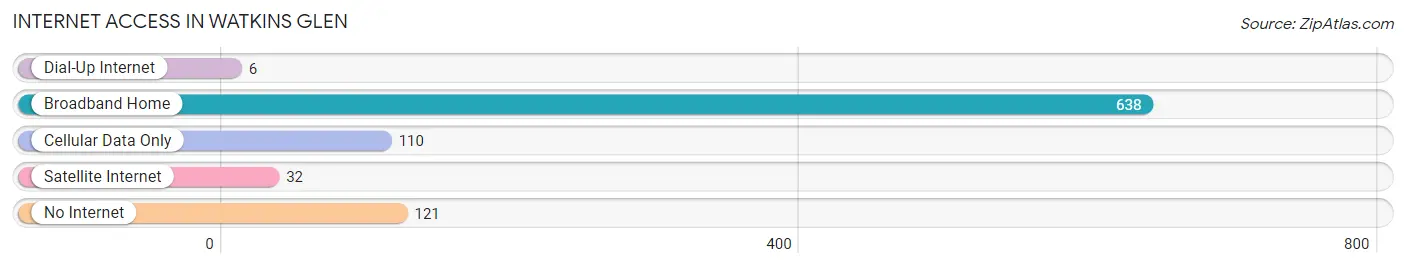
| Internet Type | # Households | % Households |
| Dial-Up Internet | 6 | 0.7% |
| Broadband Home | 638 | 72.3% |
| Cellular Data Only | 110 | 12.5% |
| Satellite Internet | 32 | 3.6% |
| No Internet | 121 | 13.7% |
| Total | 882 | 100.0% |
Watkins Glen Summary
Watkins Glen is a village located in Schuyler County, New York, United States. It is the county seat of Schuyler County and is located at the southern tip of Seneca Lake, one of the Finger Lakes. The population was 1,859 at the 2010 census. It is the site of the Watkins Glen International racetrack, which hosts the NASCAR Cup Series, IndyCar Series, and other racing events.
History
The area around Watkins Glen was first settled in the late 1700s by pioneers from New England. The village was founded in 1842 by Dr. Samuel Watkins, a physician from Pennsylvania. He purchased land from the local Native Americans and named the village after himself. The village was incorporated in 1848.
In the late 19th century, Watkins Glen became a popular tourist destination due to its natural beauty and proximity to Seneca Lake. The village was home to several hotels and resorts, and was known as the "Gorge of the Genesee."
In the early 20th century, Watkins Glen became a popular destination for auto racing. The first race was held in 1948, and the Watkins Glen International racetrack was built in 1956. The track has hosted some of the most prestigious races in the world, including the Formula One United States Grand Prix and the NASCAR Cup Series.
Geography
Watkins Glen is located at 42°20'N 76°51'W (42.33, -76.85). According to the United States Census Bureau, the village has a total area of 1.2 square miles (3.1 km2), all of it land.
The village is located at the southern tip of Seneca Lake, one of the Finger Lakes. The village is surrounded by hills and gorges, and is known for its scenic beauty.
Economy
The economy of Watkins Glen is largely based on tourism. The village is home to several hotels and resorts, as well as the Watkins Glen International racetrack. The racetrack hosts several major racing events each year, including the NASCAR Cup Series, IndyCar Series, and other events.
The village is also home to several wineries, breweries, and distilleries, as well as several restaurants and shops.
Demographics
As of the census of 2010, there were 1,859 people, 817 households, and 463 families residing in the village. The population density was 1,541.7 people per square mile (595.2/km2). There were 890 housing units at an average density of 741.7 per square mile (286.7/km2). The racial makeup of the village was 97.2% White, 0.7% African American, 0.2% Native American, 0.4% Asian, 0.1% Pacific Islander, 0.3% from other races, and 1.1% from two or more races. Hispanic or Latino of any race were 1.3% of the population.
There were 817 households, out of which 24.2% had children under the age of 18 living with them, 43.2% were married couples living together, 11.2% had a female householder with no husband present, and 41.2% were non-families. 35.2% of all households were made up of individuals, and 15.2% had someone living alone who was 65 years of age or older. The average household size was 2.20 and the average family size was 2.83.
In the village, the population was spread out, with 20.7% under the age of 18, 6.7% from 18 to 24, 24.3% from 25 to 44, 28.2% from 45 to 64, and 20.1% who were 65 years of age or older. The median age was 43 years. For every 100 females, there were 87.3 males. For every 100 females age 18 and over, there were 83.2 males.
The median income for a household in the village was $35,938, and the median income for a family was $45,000. Males had a median income of $31,250 versus $25,000 for females. The per capita income for the village was $20,945. About 8.2% of families and 11.2% of the population were below the poverty line, including 16.2% of those under age 18 and 8.2% of those age 65 or over.
Common Questions
What is Per Capita Income in Watkins Glen?
Per Capita income in Watkins Glen is $36,523.
What is the Median Family Income in Watkins Glen?
Median Family Income in Watkins Glen is $87,500.
What is the Median Household income in Watkins Glen?
Median Household Income in Watkins Glen is $44,542.
What is Income or Wage Gap in Watkins Glen?
Income or Wage Gap in Watkins Glen is 33.2%.
Women in Watkins Glen earn 66.8 cents for every dollar earned by a man.
What is Inequality or Gini Index in Watkins Glen?
Inequality or Gini Index in Watkins Glen is 0.47.
What is the Total Population of Watkins Glen?
Total Population of Watkins Glen is 1,777.
What is the Total Male Population of Watkins Glen?
Total Male Population of Watkins Glen is 889.
What is the Total Female Population of Watkins Glen?
Total Female Population of Watkins Glen is 888.
What is the Ratio of Males per 100 Females in Watkins Glen?
There are 100.11 Males per 100 Females in Watkins Glen.
What is the Ratio of Females per 100 Males in Watkins Glen?
There are 99.89 Females per 100 Males in Watkins Glen.
What is the Median Population Age in Watkins Glen?
Median Population Age in Watkins Glen is 48.4 Years.
What is the Average Family Size in Watkins Glen
Average Family Size in Watkins Glen is 3.1 People.
What is the Average Household Size in Watkins Glen
Average Household Size in Watkins Glen is 2.0 People.
How Large is the Labor Force in Watkins Glen?
There are 888 People in the Labor Forcein in Watkins Glen.
What is the Percentage of People in the Labor Force in Watkins Glen?
58.4% of People are in the Labor Force in Watkins Glen.
What is the Unemployment Rate in Watkins Glen?
Unemployment Rate in Watkins Glen is 6.3%.