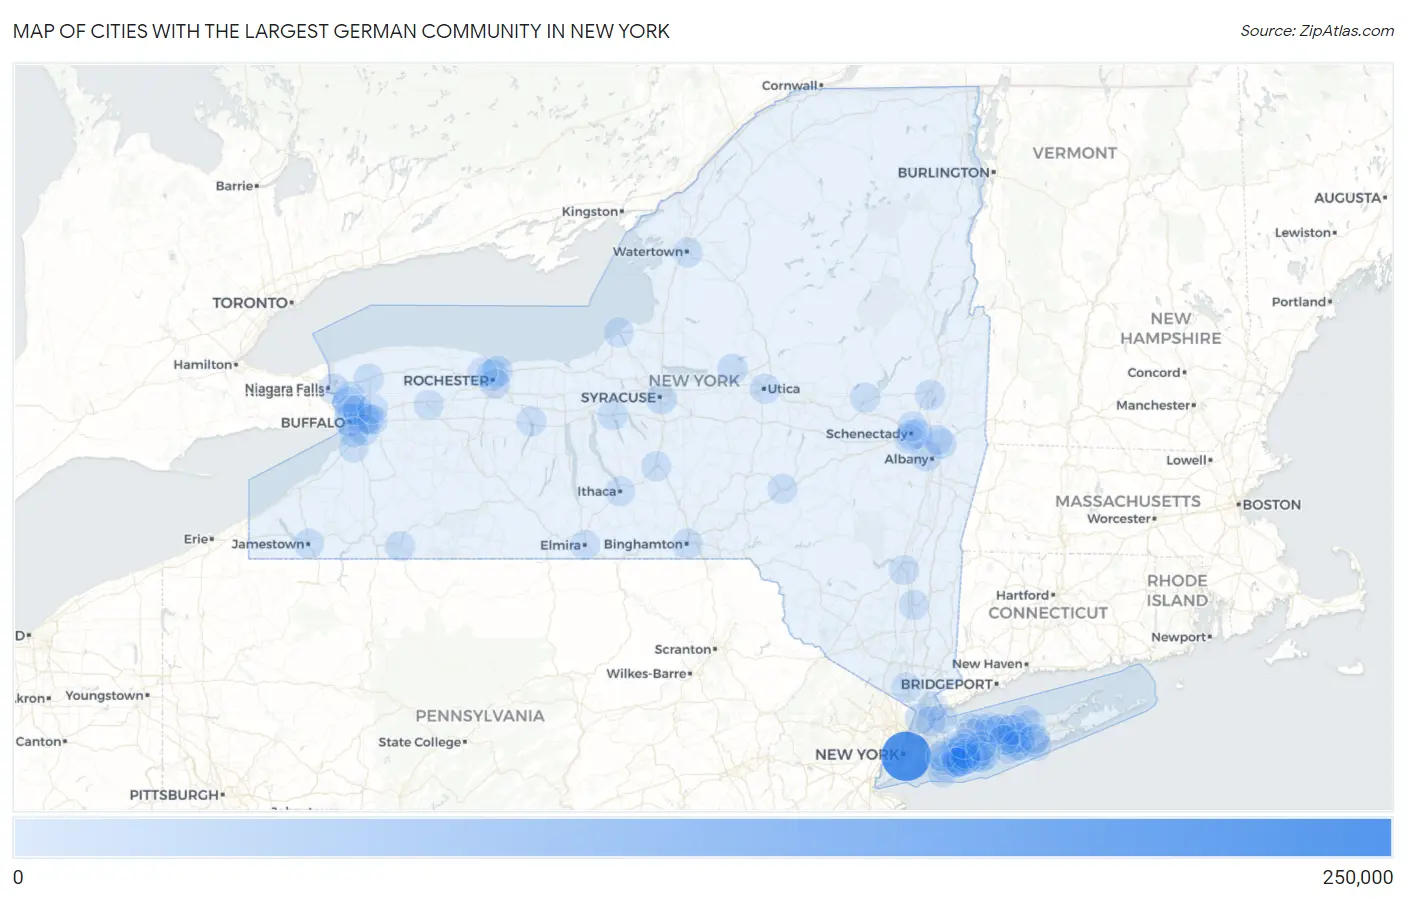
Cities with the Largest German Community in New York
RELATED REPORTS & OPTIONS
German
New York
Compare Cities
Map of Cities with the Largest German Community in New York
0
250,000
Cities with the Largest German Community in New York
| City | German | vs State | vs National | |
| 1. | New York | 248,548 | 1,764,027(14.09%)#1 | 41,919,607(0.59%)#1 |
| 2. | Buffalo | 29,012 | 1,764,027(1.64%)#2 | 41,919,607(0.07%)#84 |
| 3. | Cheektowaga | 17,102 | 1,764,027(0.97%)#3 | 41,919,607(0.04%)#195 |
| 4. | Rochester | 16,924 | 1,764,027(0.96%)#4 | 41,919,607(0.04%)#199 |
| 5. | Tonawanda | 13,828 | 1,764,027(0.78%)#5 | 41,919,607(0.03%)#268 |
| 6. | West Seneca | 13,140 | 1,764,027(0.74%)#6 | 41,919,607(0.03%)#289 |
| 7. | Syracuse | 12,240 | 1,764,027(0.69%)#7 | 41,919,607(0.03%)#316 |
| 8. | Irondequoit | 10,330 | 1,764,027(0.59%)#8 | 41,919,607(0.02%)#424 |
| 9. | North Tonawanda | 8,481 | 1,764,027(0.48%)#9 | 41,919,607(0.02%)#567 |
| 10. | Albany | 7,697 | 1,764,027(0.44%)#10 | 41,919,607(0.02%)#655 |
| 11. | Yonkers | 7,195 | 1,764,027(0.41%)#11 | 41,919,607(0.02%)#716 |
| 12. | Niagara Falls | 6,504 | 1,764,027(0.37%)#12 | 41,919,607(0.02%)#812 |
| 13. | Levittown | 5,834 | 1,764,027(0.33%)#13 | 41,919,607(0.01%)#929 |
| 14. | Brighton | 5,691 | 1,764,027(0.32%)#14 | 41,919,607(0.01%)#960 |
| 15. | Schenectady | 5,364 | 1,764,027(0.30%)#15 | 41,919,607(0.01%)#1,033 |
| 16. | Binghamton | 5,283 | 1,764,027(0.30%)#16 | 41,919,607(0.01%)#1,052 |
| 17. | Lockport | 4,936 | 1,764,027(0.28%)#17 | 41,919,607(0.01%)#1,135 |
| 18. | Utica | 4,884 | 1,764,027(0.28%)#18 | 41,919,607(0.01%)#1,149 |
| 19. | West Babylon | 4,858 | 1,764,027(0.28%)#19 | 41,919,607(0.01%)#1,156 |
| 20. | Saratoga Springs | 4,806 | 1,764,027(0.27%)#20 | 41,919,607(0.01%)#1,170 |
| 21. | Jamestown | 4,622 | 1,764,027(0.26%)#21 | 41,919,607(0.01%)#1,219 |
| 22. | Depew | 4,474 | 1,764,027(0.25%)#22 | 41,919,607(0.01%)#1,269 |
| 23. | Troy | 4,427 | 1,764,027(0.25%)#23 | 41,919,607(0.01%)#1,280 |
| 24. | Rome | 4,335 | 1,764,027(0.25%)#24 | 41,919,607(0.01%)#1,318 |
| 25. | Coram | 4,206 | 1,764,027(0.24%)#25 | 41,919,607(0.01%)#1,360 |
| 26. | Auburn | 4,199 | 1,764,027(0.24%)#26 | 41,919,607(0.01%)#1,362 |
| 27. | West Islip | 3,847 | 1,764,027(0.22%)#27 | 41,919,607(0.01%)#1,500 |
| 28. | East Northport | 3,835 | 1,764,027(0.22%)#28 | 41,919,607(0.01%)#1,506 |
| 29. | Holbrook | 3,791 | 1,764,027(0.21%)#29 | 41,919,607(0.01%)#1,519 |
| 30. | Elmira | 3,685 | 1,764,027(0.21%)#30 | 41,919,607(0.01%)#1,562 |
| 31. | Commack | 3,613 | 1,764,027(0.20%)#31 | 41,919,607(0.01%)#1,595 |
| 32. | Hicksville | 3,600 | 1,764,027(0.20%)#32 | 41,919,607(0.01%)#1,601 |
| 33. | Centereach | 3,584 | 1,764,027(0.20%)#33 | 41,919,607(0.01%)#1,609 |
| 34. | Smithtown | 3,547 | 1,764,027(0.20%)#34 | 41,919,607(0.01%)#1,626 |
| 35. | Lindenhurst | 3,517 | 1,764,027(0.20%)#35 | 41,919,607(0.01%)#1,636 |
| 36. | White Plains | 3,489 | 1,764,027(0.20%)#36 | 41,919,607(0.01%)#1,648 |
| 37. | Kenmore | 3,427 | 1,764,027(0.19%)#37 | 41,919,607(0.01%)#1,690 |
| 38. | Shirley | 3,399 | 1,764,027(0.19%)#38 | 41,919,607(0.01%)#1,706 |
| 39. | Long Beach | 3,380 | 1,764,027(0.19%)#39 | 41,919,607(0.01%)#1,713 |
| 40. | Batavia | 3,311 | 1,764,027(0.19%)#40 | 41,919,607(0.01%)#1,757 |
| 41. | Sayville | 3,282 | 1,764,027(0.19%)#41 | 41,919,607(0.01%)#1,774 |
| 42. | East Patchogue | 3,272 | 1,764,027(0.19%)#42 | 41,919,607(0.01%)#1,778 |
| 43. | New Rochelle | 3,255 | 1,764,027(0.18%)#43 | 41,919,607(0.01%)#1,787 |
| 44. | Oceanside | 3,245 | 1,764,027(0.18%)#44 | 41,919,607(0.01%)#1,792 |
| 45. | Eggertsville | 3,162 | 1,764,027(0.18%)#45 | 41,919,607(0.01%)#1,848 |
| 46. | Rotterdam | 3,108 | 1,764,027(0.18%)#46 | 41,919,607(0.01%)#1,880 |
| 47. | Kingston | 3,107 | 1,764,027(0.18%)#47 | 41,919,607(0.01%)#1,881 |
| 48. | Massapequa | 3,060 | 1,764,027(0.17%)#48 | 41,919,607(0.01%)#1,911 |
| 49. | Lancaster | 3,050 | 1,764,027(0.17%)#49 | 41,919,607(0.01%)#1,917 |
| 50. | Rockville Centre | 3,025 | 1,764,027(0.17%)#50 | 41,919,607(0.01%)#1,939 |
| 51. | Ithaca | 2,995 | 1,764,027(0.17%)#51 | 41,919,607(0.01%)#1,961 |
| 52. | Gloversville | 2,958 | 1,764,027(0.17%)#52 | 41,919,607(0.01%)#1,996 |
| 53. | Wantagh | 2,945 | 1,764,027(0.17%)#53 | 41,919,607(0.01%)#2,007 |
| 54. | Huntington | 2,932 | 1,764,027(0.17%)#54 | 41,919,607(0.01%)#2,012 |
| 55. | East Meadow | 2,929 | 1,764,027(0.17%)#55 | 41,919,607(0.01%)#2,014 |
| 56. | Holtsville | 2,929 | 1,764,027(0.17%)#56 | 41,919,607(0.01%)#2,016 |
| 57. | Garden City | 2,857 | 1,764,027(0.16%)#57 | 41,919,607(0.01%)#2,061 |
| 58. | Niskayuna | 2,815 | 1,764,027(0.16%)#58 | 41,919,607(0.01%)#2,100 |
| 59. | Ridge | 2,718 | 1,764,027(0.15%)#59 | 41,919,607(0.01%)#2,175 |
| 60. | Medford | 2,717 | 1,764,027(0.15%)#60 | 41,919,607(0.01%)#2,176 |
| 61. | East Massapequa | 2,714 | 1,764,027(0.15%)#61 | 41,919,607(0.01%)#2,178 |
| 62. | Mastic Beach | 2,673 | 1,764,027(0.15%)#62 | 41,919,607(0.01%)#2,210 |
| 63. | Rocky Point | 2,671 | 1,764,027(0.15%)#63 | 41,919,607(0.01%)#2,213 |
| 64. | Hamburg | 2,670 | 1,764,027(0.15%)#64 | 41,919,607(0.01%)#2,214 |
| 65. | Lackawanna | 2,651 | 1,764,027(0.15%)#65 | 41,919,607(0.01%)#2,234 |
| 66. | Watertown | 2,641 | 1,764,027(0.15%)#66 | 41,919,607(0.01%)#2,240 |
| 67. | Olean | 2,641 | 1,764,027(0.15%)#67 | 41,919,607(0.01%)#2,241 |
| 68. | Massapequa Park | 2,608 | 1,764,027(0.15%)#68 | 41,919,607(0.01%)#2,265 |
| 69. | Greece | 2,600 | 1,764,027(0.15%)#69 | 41,919,607(0.01%)#2,270 |
| 70. | Poughkeepsie | 2,583 | 1,764,027(0.15%)#70 | 41,919,607(0.01%)#2,288 |
| 71. | Huntington Station | 2,579 | 1,764,027(0.15%)#71 | 41,919,607(0.01%)#2,289 |
| 72. | Bethpage | 2,528 | 1,764,027(0.14%)#72 | 41,919,607(0.01%)#2,335 |
| 73. | Oswego | 2,399 | 1,764,027(0.14%)#73 | 41,919,607(0.01%)#2,454 |
| 74. | Lake Ronkonkoma | 2,376 | 1,764,027(0.13%)#74 | 41,919,607(0.01%)#2,478 |
| 75. | Cohoes | 2,374 | 1,764,027(0.13%)#75 | 41,919,607(0.01%)#2,479 |
| 76. | Franklin Square | 2,370 | 1,764,027(0.13%)#76 | 41,919,607(0.01%)#2,482 |
| 77. | Kings Park | 2,333 | 1,764,027(0.13%)#77 | 41,919,607(0.01%)#2,530 |
| 78. | Canandaigua | 2,327 | 1,764,027(0.13%)#78 | 41,919,607(0.01%)#2,539 |
| 79. | North Bellmore | 2,301 | 1,764,027(0.13%)#79 | 41,919,607(0.01%)#2,571 |
| 80. | East Glenville | 2,274 | 1,764,027(0.13%)#80 | 41,919,607(0.01%)#2,608 |
| 81. | Selden | 2,272 | 1,764,027(0.13%)#81 | 41,919,607(0.01%)#2,611 |
| 82. | St James | 2,264 | 1,764,027(0.13%)#82 | 41,919,607(0.01%)#2,623 |
| 83. | North Babylon | 2,252 | 1,764,027(0.13%)#83 | 41,919,607(0.01%)#2,635 |
| 84. | Seaford | 2,247 | 1,764,027(0.13%)#84 | 41,919,607(0.01%)#2,639 |
| 85. | Patchogue | 2,230 | 1,764,027(0.13%)#85 | 41,919,607(0.01%)#2,656 |
| 86. | Cortland | 2,216 | 1,764,027(0.13%)#86 | 41,919,607(0.01%)#2,671 |
| 87. | North Massapequa | 2,210 | 1,764,027(0.13%)#87 | 41,919,607(0.01%)#2,676 |
| 88. | Mastic | 2,206 | 1,764,027(0.13%)#88 | 41,919,607(0.01%)#2,679 |
| 89. | Merrick | 2,201 | 1,764,027(0.12%)#89 | 41,919,607(0.01%)#2,685 |
| 90. | South Farmingdale | 2,190 | 1,764,027(0.12%)#90 | 41,919,607(0.01%)#2,695 |
| 91. | Babylon | 2,168 | 1,764,027(0.12%)#91 | 41,919,607(0.01%)#2,721 |
| 92. | Ronkonkoma | 2,151 | 1,764,027(0.12%)#92 | 41,919,607(0.01%)#2,742 |
| 93. | Bellmore | 2,137 | 1,764,027(0.12%)#93 | 41,919,607(0.01%)#2,761 |
| 94. | Latham | 2,104 | 1,764,027(0.12%)#94 | 41,919,607(0.01%)#2,809 |
| 95. | Plainview | 2,086 | 1,764,027(0.12%)#95 | 41,919,607(0.00%)#2,827 |
| 96. | Harris Hill | 2,070 | 1,764,027(0.12%)#96 | 41,919,607(0.00%)#2,845 |
| 97. | New City | 2,069 | 1,764,027(0.12%)#97 | 41,919,607(0.00%)#2,846 |
| 98. | Rye | 2,058 | 1,764,027(0.12%)#98 | 41,919,607(0.00%)#2,858 |
| 99. | Deer Park | 2,041 | 1,764,027(0.12%)#99 | 41,919,607(0.00%)#2,877 |
| 100. | Oneonta | 2,015 | 1,764,027(0.11%)#100 | 41,919,607(0.00%)#2,913 |
Common Questions
What are the Top 10 Cities with the Largest German Community in New York?
Top 10 Cities with the Largest German Community in New York are:
#1
248,548
#2
29,012
#3
17,102
#4
16,924
#5
13,828
#6
13,140
#7
12,240
#8
10,330
#9
8,481
#10
7,697
What city has the Largest German Community in New York?
New York has the Largest German Community in New York with 248,548.
What is the Total German Population in the State of New York?
Total German Population in New York is 1,764,027.
What is the Total German Population in the United States?
Total German Population in the United States is 41,919,607.