Cities with the Highest Percentage of Peruvian Population in New York
RELATED REPORTS & OPTIONS
Peruvian
New York
Compare Cities
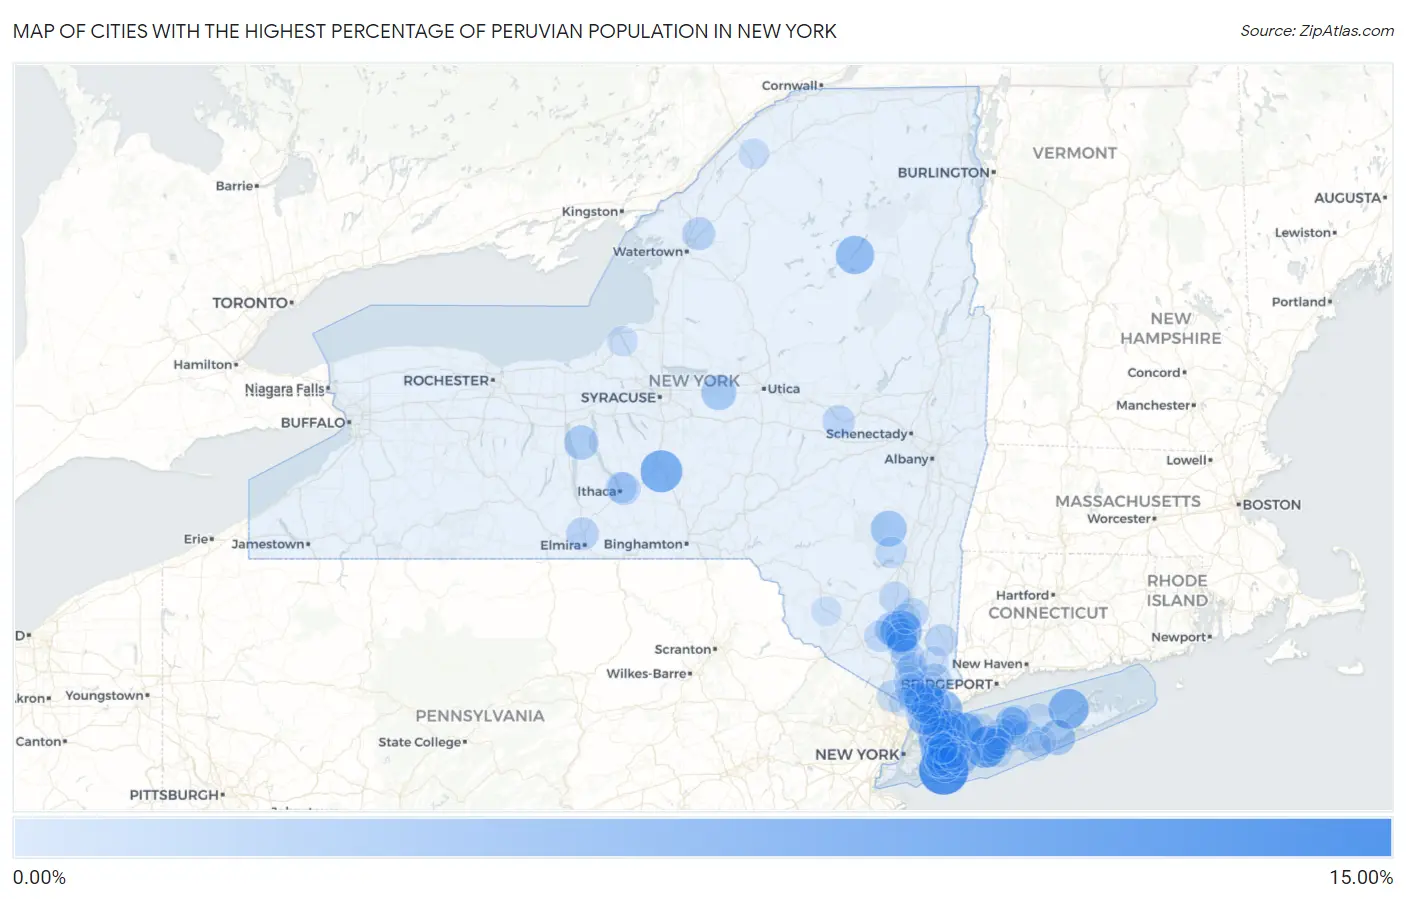
Map of Cities with the Highest Percentage of Peruvian Population in New York
0.00%
15.00%
Cities with the Highest Percentage of Peruvian Population in New York
| City | Peruvian | vs State | vs National | |
| 1. | Island Park | 12.13% | 0.41%(+11.7)#1 | 0.22%(+11.9)#9 |
| 2. | Blodgett Mills | 7.69% | 0.41%(+7.28)#2 | 0.22%(+7.48)#29 |
| 3. | Baywood | 7.10% | 0.41%(+6.68)#3 | 0.22%(+6.88)#36 |
| 4. | Balmville | 6.98% | 0.41%(+6.57)#4 | 0.22%(+6.77)#38 |
| 5. | Mattituck | 6.44% | 0.41%(+6.02)#5 | 0.22%(+6.22)#43 |
| 6. | Port Chester | 6.26% | 0.41%(+5.85)#6 | 0.22%(+6.05)#46 |
| 7. | Laurel Hollow | 6.00% | 0.41%(+5.59)#7 | 0.22%(+5.78)#50 |
| 8. | Manorhaven | 5.60% | 0.41%(+5.18)#8 | 0.22%(+5.38)#55 |
| 9. | New Hyde Park | 5.50% | 0.41%(+5.09)#9 | 0.22%(+5.29)#58 |
| 10. | Elmsford | 5.43% | 0.41%(+5.02)#10 | 0.22%(+5.22)#61 |
| 11. | Long Lake | 5.41% | 0.41%(+4.99)#11 | 0.22%(+5.19)#63 |
| 12. | Locust Valley | 5.40% | 0.41%(+4.99)#12 | 0.22%(+5.18)#65 |
| 13. | White Plains | 4.75% | 0.41%(+4.33)#13 | 0.22%(+4.53)#72 |
| 14. | Brentwood | 4.46% | 0.41%(+4.05)#14 | 0.22%(+4.25)#80 |
| 15. | Tannersville | 4.08% | 0.41%(+3.66)#15 | 0.22%(+3.86)#95 |
| 16. | Westhampton | 3.82% | 0.41%(+3.41)#16 | 0.22%(+3.61)#105 |
| 17. | Glen Head | 3.67% | 0.41%(+3.25)#17 | 0.22%(+3.45)#111 |
| 18. | Oneida Castle | 3.58% | 0.41%(+3.16)#18 | 0.22%(+3.36)#115 |
| 19. | Orange Lake | 3.34% | 0.41%(+2.93)#19 | 0.22%(+3.12)#126 |
| 20. | Franklin Square | 3.22% | 0.41%(+2.81)#20 | 0.22%(+3.01)#132 |
| 21. | Romulus | 3.13% | 0.41%(+2.72)#21 | 0.22%(+2.92)#138 |
| 22. | Tuckahoe | 3.00% | 0.41%(+2.59)#22 | 0.22%(+2.79)#154 |
| 23. | Newburgh | 2.58% | 0.41%(+2.17)#23 | 0.22%(+2.37)#201 |
| 24. | Roslyn Estates | 2.52% | 0.41%(+2.10)#24 | 0.22%(+2.30)#208 |
| 25. | Fairview Cdp Westchester County | 2.51% | 0.41%(+2.10)#25 | 0.22%(+2.30)#210 |
| 26. | Mount Kisco | 2.41% | 0.41%(+1.99)#26 | 0.22%(+2.19)#226 |
| 27. | Evans Mills | 2.39% | 0.41%(+1.97)#27 | 0.22%(+2.17)#232 |
| 28. | Highland Falls | 2.28% | 0.41%(+1.87)#28 | 0.22%(+2.07)#244 |
| 29. | Forest Home | 2.26% | 0.41%(+1.84)#29 | 0.22%(+2.04)#253 |
| 30. | Terryville | 2.20% | 0.41%(+1.79)#30 | 0.22%(+1.99)#261 |
| 31. | Horseheads | 2.19% | 0.41%(+1.78)#31 | 0.22%(+1.98)#263 |
| 32. | Glen Cove | 2.12% | 0.41%(+1.70)#32 | 0.22%(+1.90)#275 |
| 33. | Westbury | 2.10% | 0.41%(+1.68)#33 | 0.22%(+1.88)#278 |
| 34. | Great Neck Plaza | 2.10% | 0.41%(+1.68)#34 | 0.22%(+1.88)#279 |
| 35. | Eldred | 2.09% | 0.41%(+1.68)#35 | 0.22%(+1.88)#282 |
| 36. | Stewart Manor | 2.05% | 0.41%(+1.63)#36 | 0.22%(+1.83)#289 |
| 37. | Farmingville | 2.04% | 0.41%(+1.62)#37 | 0.22%(+1.82)#295 |
| 38. | Canajoharie | 2.04% | 0.41%(+1.62)#38 | 0.22%(+1.82)#296 |
| 39. | Bay Shore | 1.91% | 0.41%(+1.49)#39 | 0.22%(+1.69)#325 |
| 40. | Port Jefferson Station | 1.87% | 0.41%(+1.45)#40 | 0.22%(+1.65)#339 |
| 41. | Airmont | 1.86% | 0.41%(+1.44)#41 | 0.22%(+1.64)#343 |
| 42. | Lake Carmel | 1.79% | 0.41%(+1.38)#42 | 0.22%(+1.58)#356 |
| 43. | Elmont | 1.78% | 0.41%(+1.37)#43 | 0.22%(+1.57)#359 |
| 44. | Manhasset Hills | 1.77% | 0.41%(+1.35)#44 | 0.22%(+1.55)#366 |
| 45. | Tarrytown | 1.72% | 0.41%(+1.31)#45 | 0.22%(+1.51)#376 |
| 46. | Oceanside | 1.69% | 0.41%(+1.27)#46 | 0.22%(+1.47)#384 |
| 47. | New Windsor | 1.63% | 0.41%(+1.21)#47 | 0.22%(+1.41)#400 |
| 48. | Mamaroneck | 1.63% | 0.41%(+1.21)#48 | 0.22%(+1.41)#401 |
| 49. | Crown Heights | 1.62% | 0.41%(+1.20)#49 | 0.22%(+1.40)#404 |
| 50. | New Paltz | 1.60% | 0.41%(+1.19)#50 | 0.22%(+1.39)#406 |
| 51. | Maybrook | 1.59% | 0.41%(+1.18)#51 | 0.22%(+1.38)#408 |
| 52. | Lynbrook | 1.58% | 0.41%(+1.17)#52 | 0.22%(+1.37)#411 |
| 53. | Garden City South | 1.53% | 0.41%(+1.12)#53 | 0.22%(+1.32)#430 |
| 54. | Valley Stream | 1.52% | 0.41%(+1.11)#54 | 0.22%(+1.31)#434 |
| 55. | Cayuga Heights | 1.51% | 0.41%(+1.09)#55 | 0.22%(+1.29)#445 |
| 56. | Buchanan | 1.50% | 0.41%(+1.08)#56 | 0.22%(+1.28)#449 |
| 57. | South Nyack | 1.49% | 0.41%(+1.08)#57 | 0.22%(+1.28)#450 |
| 58. | Woodstock | 1.46% | 0.41%(+1.05)#58 | 0.22%(+1.25)#460 |
| 59. | Cornwall On Hudson | 1.45% | 0.41%(+1.03)#59 | 0.22%(+1.23)#469 |
| 60. | Yaphank | 1.44% | 0.41%(+1.03)#60 | 0.22%(+1.23)#470 |
| 61. | Malverne | 1.36% | 0.41%(+0.946)#61 | 0.22%(+1.15)#507 |
| 62. | Valhalla | 1.31% | 0.41%(+0.896)#62 | 0.22%(+1.10)#526 |
| 63. | Carmel | 1.31% | 0.41%(+0.894)#63 | 0.22%(+1.09)#527 |
| 64. | Nesconset | 1.29% | 0.41%(+0.877)#64 | 0.22%(+1.08)#536 |
| 65. | Wading River | 1.25% | 0.41%(+0.832)#65 | 0.22%(+1.03)#553 |
| 66. | Selden | 1.23% | 0.41%(+0.817)#66 | 0.22%(+1.02)#565 |
| 67. | Islandia | 1.21% | 0.41%(+0.790)#67 | 0.22%(+0.990)#574 |
| 68. | Central Islip | 1.19% | 0.41%(+0.774)#68 | 0.22%(+0.973)#584 |
| 69. | Ossining | 1.13% | 0.41%(+0.712)#69 | 0.22%(+0.911)#607 |
| 70. | New Rochelle | 1.11% | 0.41%(+0.696)#70 | 0.22%(+0.896)#621 |
| 71. | Bronxville | 1.10% | 0.41%(+0.681)#71 | 0.22%(+0.881)#630 |
| 72. | North Massapequa | 1.09% | 0.41%(+0.679)#72 | 0.22%(+0.878)#632 |
| 73. | Haverstraw | 1.07% | 0.41%(+0.659)#73 | 0.22%(+0.859)#644 |
| 74. | Rensselaer Falls | 1.05% | 0.41%(+0.632)#74 | 0.22%(+0.832)#667 |
| 75. | Chappaqua | 1.03% | 0.41%(+0.616)#75 | 0.22%(+0.816)#677 |
| 76. | East Meadow | 1.02% | 0.41%(+0.605)#76 | 0.22%(+0.805)#681 |
| 77. | Mount Sinai | 1.01% | 0.41%(+0.599)#77 | 0.22%(+0.798)#686 |
| 78. | Baldwin | 0.98% | 0.41%(+0.565)#78 | 0.22%(+0.765)#707 |
| 79. | Seaford | 0.98% | 0.41%(+0.563)#79 | 0.22%(+0.762)#708 |
| 80. | Peekskill | 0.96% | 0.41%(+0.550)#80 | 0.22%(+0.749)#719 |
| 81. | Shenorock | 0.96% | 0.41%(+0.541)#81 | 0.22%(+0.741)#729 |
| 82. | Sleepy Hollow | 0.94% | 0.41%(+0.528)#82 | 0.22%(+0.727)#740 |
| 83. | East Northport | 0.94% | 0.41%(+0.527)#83 | 0.22%(+0.726)#742 |
| 84. | Marlboro | 0.94% | 0.41%(+0.520)#84 | 0.22%(+0.720)#746 |
| 85. | East Setauket | 0.92% | 0.41%(+0.504)#85 | 0.22%(+0.703)#762 |
| 86. | Congers | 0.91% | 0.41%(+0.499)#86 | 0.22%(+0.698)#764 |
| 87. | Minetto | 0.91% | 0.41%(+0.494)#87 | 0.22%(+0.694)#766 |
| 88. | Uniondale | 0.86% | 0.41%(+0.441)#88 | 0.22%(+0.640)#805 |
| 89. | Fairview Cdp Dutchess County | 0.85% | 0.41%(+0.436)#89 | 0.22%(+0.635)#811 |
| 90. | Hartsdale | 0.84% | 0.41%(+0.429)#90 | 0.22%(+0.628)#815 |
| 91. | Halesite | 0.83% | 0.41%(+0.413)#91 | 0.22%(+0.613)#830 |
| 92. | Williston Park | 0.80% | 0.41%(+0.381)#92 | 0.22%(+0.580)#860 |
| 93. | Pearl River | 0.79% | 0.41%(+0.377)#93 | 0.22%(+0.576)#865 |
| 94. | Center Moriches | 0.79% | 0.41%(+0.371)#94 | 0.22%(+0.571)#868 |
| 95. | Sands Point | 0.78% | 0.41%(+0.362)#95 | 0.22%(+0.562)#875 |
| 96. | East Islip | 0.77% | 0.41%(+0.359)#96 | 0.22%(+0.558)#878 |
| 97. | North Merrick | 0.77% | 0.41%(+0.356)#97 | 0.22%(+0.556)#880 |
| 98. | Garden City Park | 0.76% | 0.41%(+0.344)#98 | 0.22%(+0.544)#894 |
| 99. | Mastic Beach | 0.75% | 0.41%(+0.332)#99 | 0.22%(+0.532)#908 |
| 100. | Monticello | 0.73% | 0.41%(+0.319)#100 | 0.22%(+0.518)#919 |
Common Questions
What are the Top 10 Cities with the Highest Percentage of Peruvian Population in New York?
Top 10 Cities with the Highest Percentage of Peruvian Population in New York are:
#1
12.13%
#2
7.69%
#3
7.10%
#4
6.98%
#5
6.44%
#6
6.26%
#7
6.00%
#8
5.60%
#9
5.50%
#10
5.43%
What city has the Highest Percentage of Peruvian Population in New York?
Island Park has the Highest Percentage of Peruvian Population in New York with 12.13%.
What is the Percentage of Peruvian Population in the State of New York?
Percentage of Peruvian Population in New York is 0.41%.
What is the Percentage of Peruvian Population in the United States?
Percentage of Peruvian Population in the United States is 0.22%.