Cities with the Highest Percentage of Immigrants from South Africa in New York
RELATED REPORTS & OPTIONS
South Africa
New York
Compare Cities
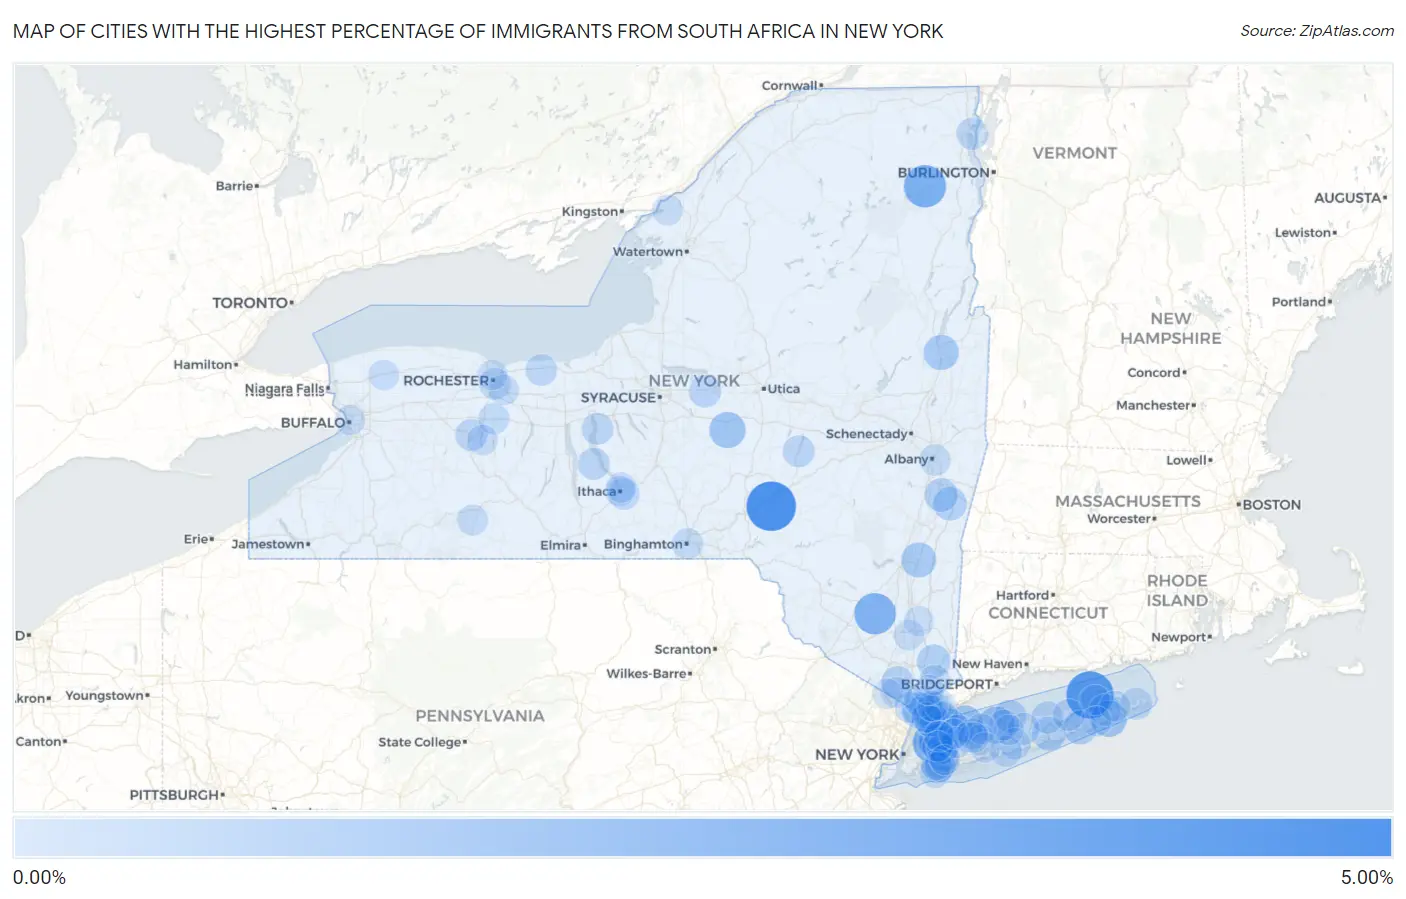
Map of Cities with the Highest Percentage of Immigrants from South Africa in New York
0.00%
5.00%
Cities with the Highest Percentage of Immigrants from South Africa in New York
| City | South Africa | vs State | vs National | |
| 1. | Franklin | 4.16% | 0.040%(+4.12)#-1 | 0.035%(+4.12)#0 |
| 2. | Greenport West | 3.68% | 0.040%(+3.64)#0 | 0.035%(+3.64)#1 |
| 3. | Wilmington | 2.58% | 0.040%(+2.54)#1 | 0.035%(+2.54)#2 |
| 4. | Great Neck Estates | 2.52% | 0.040%(+2.48)#2 | 0.035%(+2.49)#3 |
| 5. | Watchtower | 2.39% | 0.040%(+2.35)#3 | 0.035%(+2.35)#4 |
| 6. | Thomaston | 1.45% | 0.040%(+1.41)#4 | 0.035%(+1.42)#5 |
| 7. | Nissequogue | 1.44% | 0.040%(+1.40)#5 | 0.035%(+1.41)#6 |
| 8. | Lloyd Harbor | 1.37% | 0.040%(+1.33)#6 | 0.035%(+1.34)#7 |
| 9. | East Hampton | 1.34% | 0.040%(+1.30)#7 | 0.035%(+1.30)#8 |
| 10. | Hamilton | 1.29% | 0.040%(+1.25)#8 | 0.035%(+1.25)#9 |
| 11. | Glens Falls North | 1.07% | 0.040%(+1.03)#9 | 0.035%(+1.03)#10 |
| 12. | Red Hook | 1.05% | 0.040%(+1.01)#10 | 0.035%(+1.01)#11 |
| 13. | Lattingtown | 1.03% | 0.040%(+0.990)#11 | 0.035%(+0.995)#12 |
| 14. | Marist College | 0.85% | 0.040%(+0.809)#12 | 0.035%(+0.814)#13 |
| 15. | Shinnecock Hills | 0.84% | 0.040%(+0.803)#13 | 0.035%(+0.808)#14 |
| 16. | Kensington | 0.83% | 0.040%(+0.790)#14 | 0.035%(+0.795)#15 |
| 17. | Walworth | 0.81% | 0.040%(+0.769)#15 | 0.035%(+0.774)#16 |
| 18. | Eastport | 0.75% | 0.040%(+0.709)#16 | 0.035%(+0.714)#17 |
| 19. | Dobbs Ferry | 0.74% | 0.040%(+0.704)#17 | 0.035%(+0.708)#18 |
| 20. | Shenorock | 0.74% | 0.040%(+0.703)#18 | 0.035%(+0.708)#19 |
| 21. | Chatham | 0.74% | 0.040%(+0.697)#19 | 0.035%(+0.702)#20 |
| 22. | Valatie | 0.72% | 0.040%(+0.679)#20 | 0.035%(+0.684)#21 |
| 23. | Rye | 0.68% | 0.040%(+0.641)#21 | 0.035%(+0.646)#22 |
| 24. | Scarsdale | 0.63% | 0.040%(+0.591)#22 | 0.035%(+0.596)#271 |
| 25. | Belle Terre | 0.62% | 0.040%(+0.576)#23 | 0.035%(+0.581)#272 |
| 26. | Hartsdale | 0.62% | 0.040%(+0.576)#24 | 0.035%(+0.581)#273 |
| 27. | Oyster Bay | 0.57% | 0.040%(+0.532)#25 | 0.035%(+0.537)#274 |
| 28. | Pomona | 0.52% | 0.040%(+0.481)#26 | 0.035%(+0.486)#275 |
| 29. | Canastota | 0.51% | 0.040%(+0.465)#27 | 0.035%(+0.470)#276 |
| 30. | Larchmont | 0.50% | 0.040%(+0.464)#28 | 0.035%(+0.469)#277 |
| 31. | Baiting Hollow | 0.45% | 0.040%(+0.408)#29 | 0.035%(+0.413)#278 |
| 32. | Cumberland Head | 0.44% | 0.040%(+0.402)#30 | 0.035%(+0.407)#279 |
| 33. | Northwest Harbor | 0.42% | 0.040%(+0.379)#31 | 0.035%(+0.384)#280 |
| 34. | Lynbrook | 0.42% | 0.040%(+0.379)#32 | 0.035%(+0.383)#281 |
| 35. | Geneseo | 0.41% | 0.040%(+0.375)#33 | 0.035%(+0.380)#282 |
| 36. | Middle Island | 0.41% | 0.040%(+0.370)#34 | 0.035%(+0.375)#283 |
| 37. | Laurel | 0.41% | 0.040%(+0.368)#35 | 0.035%(+0.373)#284 |
| 38. | Interlaken | 0.40% | 0.040%(+0.358)#36 | 0.035%(+0.362)#285 |
| 39. | Cooperstown | 0.39% | 0.040%(+0.353)#37 | 0.035%(+0.358)#286 |
| 40. | Union Springs | 0.39% | 0.040%(+0.351)#38 | 0.035%(+0.355)#287 |
| 41. | Herricks | 0.38% | 0.040%(+0.339)#39 | 0.035%(+0.343)#288 |
| 42. | East Ithaca | 0.37% | 0.040%(+0.335)#40 | 0.035%(+0.339)#289 |
| 43. | Montauk | 0.37% | 0.040%(+0.330)#41 | 0.035%(+0.335)#290 |
| 44. | Greenville Cdp Westchester County | 0.35% | 0.040%(+0.315)#42 | 0.035%(+0.319)#291 |
| 45. | Williamson | 0.35% | 0.040%(+0.312)#43 | 0.035%(+0.316)#292 |
| 46. | Woodsburgh | 0.34% | 0.040%(+0.298)#44 | 0.035%(+0.303)#293 |
| 47. | Brighton | 0.31% | 0.040%(+0.272)#45 | 0.035%(+0.277)#294 |
| 48. | East Hills | 0.30% | 0.040%(+0.264)#46 | 0.035%(+0.268)#295 |
| 49. | Hastings On Hudson | 0.28% | 0.040%(+0.244)#47 | 0.035%(+0.248)#296 |
| 50. | North Patchogue | 0.28% | 0.040%(+0.242)#48 | 0.035%(+0.247)#297 |
| 51. | West Sayville | 0.28% | 0.040%(+0.238)#49 | 0.035%(+0.243)#298 |
| 52. | Lima | 0.27% | 0.040%(+0.227)#50 | 0.035%(+0.232)#299 |
| 53. | Tappan | 0.26% | 0.040%(+0.216)#51 | 0.035%(+0.221)#300 |
| 54. | Binghamton | 0.25% | 0.040%(+0.206)#52 | 0.035%(+0.210)#301 |
| 55. | Harrison | 0.24% | 0.040%(+0.204)#53 | 0.035%(+0.208)#302 |
| 56. | Rensselaer | 0.24% | 0.040%(+0.198)#54 | 0.035%(+0.202)#303 |
| 57. | Atlantic Beach | 0.23% | 0.040%(+0.187)#55 | 0.035%(+0.192)#304 |
| 58. | Mamaroneck | 0.23% | 0.040%(+0.186)#56 | 0.035%(+0.190)#305 |
| 59. | West Hempstead | 0.23% | 0.040%(+0.186)#57 | 0.035%(+0.190)#306 |
| 60. | Tarrytown | 0.22% | 0.040%(+0.181)#58 | 0.035%(+0.185)#307 |
| 61. | Garden City Park | 0.21% | 0.040%(+0.166)#59 | 0.035%(+0.170)#308 |
| 62. | Alfred | 0.20% | 0.040%(+0.157)#60 | 0.035%(+0.161)#309 |
| 63. | Jericho | 0.20% | 0.040%(+0.156)#61 | 0.035%(+0.161)#310 |
| 64. | Hewlett Harbor | 0.19% | 0.040%(+0.148)#62 | 0.035%(+0.152)#311 |
| 65. | Port Washington | 0.18% | 0.040%(+0.142)#63 | 0.035%(+0.147)#312 |
| 66. | New Rochelle | 0.18% | 0.040%(+0.136)#64 | 0.035%(+0.140)#313 |
| 67. | Baxter Estates | 0.17% | 0.040%(+0.134)#65 | 0.035%(+0.139)#314 |
| 68. | Fort Covington | 0.17% | 0.040%(+0.126)#66 | 0.035%(+0.131)#315 |
| 69. | Springs | 0.16% | 0.040%(+0.124)#67 | 0.035%(+0.128)#316 |
| 70. | Conesus Lake | 0.16% | 0.040%(+0.116)#68 | 0.035%(+0.120)#317 |
| 71. | West Hills | 0.16% | 0.040%(+0.116)#69 | 0.035%(+0.120)#318 |
| 72. | Monsey | 0.16% | 0.040%(+0.115)#70 | 0.035%(+0.120)#319 |
| 73. | Woodmere | 0.15% | 0.040%(+0.113)#71 | 0.035%(+0.118)#320 |
| 74. | Beacon | 0.15% | 0.040%(+0.111)#72 | 0.035%(+0.116)#321 |
| 75. | Stony Brook | 0.14% | 0.040%(+0.104)#73 | 0.035%(+0.109)#322 |
| 76. | Gasport | 0.14% | 0.040%(+0.103)#74 | 0.035%(+0.108)#323 |
| 77. | Lake Success | 0.14% | 0.040%(+0.102)#75 | 0.035%(+0.106)#324 |
| 78. | Rye Brook | 0.14% | 0.040%(+0.101)#76 | 0.035%(+0.106)#325 |
| 79. | Dix Hills | 0.13% | 0.040%(+0.090)#77 | 0.035%(+0.094)#326 |
| 80. | Pittsford | 0.12% | 0.040%(+0.082)#78 | 0.035%(+0.086)#327 |
| 81. | Huntington Station | 0.12% | 0.040%(+0.078)#79 | 0.035%(+0.083)#328 |
| 82. | Clayton | 0.12% | 0.040%(+0.075)#80 | 0.035%(+0.080)#329 |
| 83. | Centereach | 0.10% | 0.040%(+0.060)#81 | 0.035%(+0.065)#330 |
| 84. | Shelter Island Heights | 0.095% | 0.040%(+0.055)#82 | 0.035%(+0.059)#331 |
| 85. | East Northport | 0.094% | 0.040%(+0.054)#83 | 0.035%(+0.058)#332 |
| 86. | Rockville Centre | 0.081% | 0.040%(+0.041)#84 | 0.035%(+0.046)#333 |
| 87. | Suffern | 0.079% | 0.040%(+0.039)#85 | 0.035%(+0.044)#334 |
| 88. | Eastchester | 0.073% | 0.040%(+0.033)#86 | 0.035%(+0.037)#335 |
| 89. | Rochester | 0.071% | 0.040%(+0.031)#87 | 0.035%(+0.036)#470 |
| 90. | Bridgehampton | 0.071% | 0.040%(+0.030)#88 | 0.035%(+0.035)#471 |
| 91. | Baywood | 0.070% | 0.040%(+0.030)#89 | 0.035%(+0.034)#472 |
| 92. | White Plains | 0.069% | 0.040%(+0.029)#90 | 0.035%(+0.034)#473 |
| 93. | Myers Corner | 0.066% | 0.040%(+0.026)#91 | 0.035%(+0.030)#474 |
| 94. | Mount Kisco | 0.065% | 0.040%(+0.025)#92 | 0.035%(+0.029)#475 |
| 95. | Buffalo | 0.063% | 0.040%(+0.022)#93 | 0.035%(+0.027)#476 |
| 96. | Ithaca | 0.061% | 0.040%(+0.021)#94 | 0.035%(+0.025)#477 |
| 97. | South Huntington | 0.058% | 0.040%(+0.018)#95 | 0.035%(+0.023)#478 |
| 98. | Pleasantville | 0.054% | 0.040%(+0.014)#96 | 0.035%(+0.018)#479 |
| 99. | Upper Brookville | 0.053% | 0.040%(+0.013)#97 | 0.035%(+0.018)#480 |
| 100. | Cayuga Heights | 0.049% | 0.040%(+0.009)#98 | 0.035%(+0.014)#481 |
Common Questions
What are the Top 10 Cities with the Highest Percentage of Immigrants from South Africa in New York?
Top 10 Cities with the Highest Percentage of Immigrants from South Africa in New York are:
#1
4.16%
#2
3.68%
#3
2.58%
#4
2.52%
#5
2.39%
#6
1.45%
#7
1.44%
#8
1.37%
#9
1.34%
#10
1.29%
What city has the Highest Percentage of Immigrants from South Africa in New York?
Franklin has the Highest Percentage of Immigrants from South Africa in New York with 4.16%.
What is the Percentage of Immigrants from South Africa in the State of New York?
Percentage of Immigrants from South Africa in New York is 0.040%.
What is the Percentage of Immigrants from South Africa in the United States?
Percentage of Immigrants from South Africa in the United States is 0.035%.