University at Buffalo, NY Map & Demographics
University at Buffalo Map
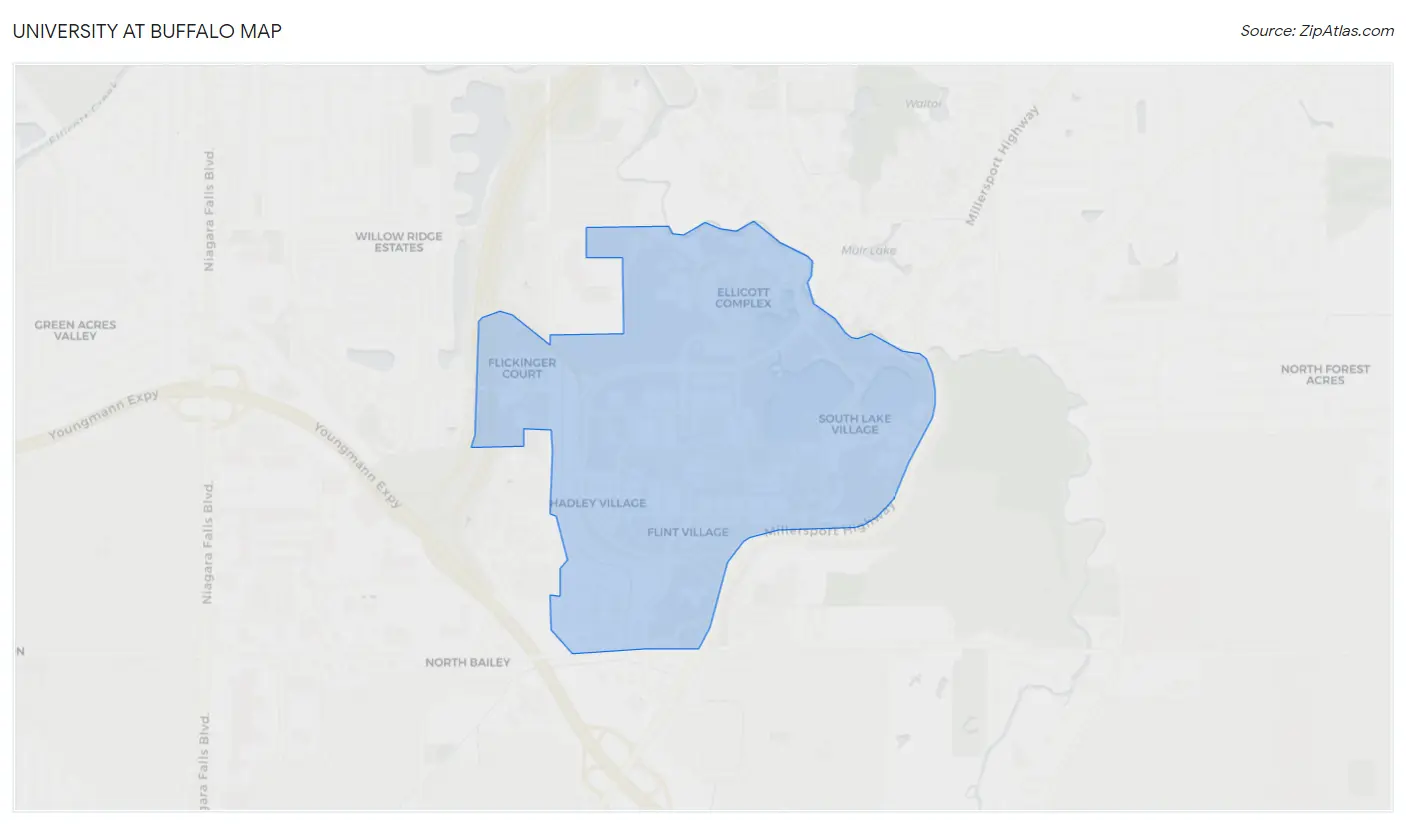
University at Buffalo Overview
$7,160
PER CAPITA INCOME
9.9%
WAGE / INCOME GAP [ % ]
90.1¢/ $1
WAGE / INCOME GAP [ $ ]
0.46
INEQUALITY / GINI INDEX
6,189
TOTAL POPULATION
3,222
MALE POPULATION
2,967
FEMALE POPULATION
108.59
MALES / 100 FEMALES
92.09
FEMALES / 100 MALES
19.3
MEDIAN AGE
2.2
AVG FAMILY SIZE
1.6
AVG HOUSEHOLD SIZE
1,318
LABOR FORCE [ PEOPLE ]
21.3%
PERCENT IN LABOR FORCE
2.1%
UNEMPLOYMENT RATE
Income in University at Buffalo
Income Overview in University at Buffalo
| Characteristic | Number | Measure |
| Per Capita Income | 6,189 | $7,160 |
| Median Family Income | 16 | $0 |
| Mean Family Income | 16 | $0 |
| Median Household Income | 173 | $0 |
| Mean Household Income | 173 | $85,539 |
| Income Deficit | 16 | $0 |
| Wage / Income Gap (%) | 6,189 | 9.93% |
| Wage / Income Gap ($) | 6,189 | 90.07¢ per $1 |
| Gini / Inequality Index | 6,189 | 0.46 |
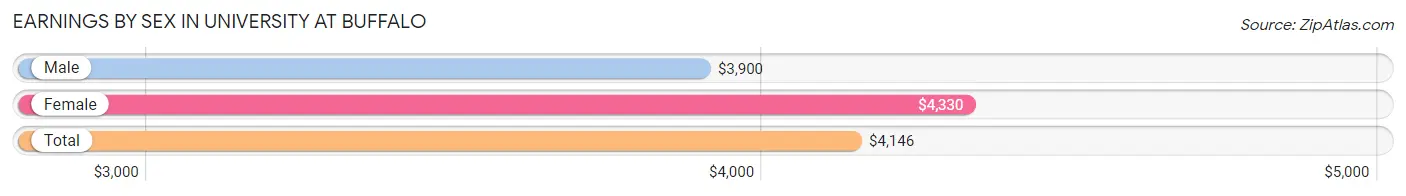
Earnings by Sex in University at Buffalo
Average Earnings in University at Buffalo are $4,146, $3,900 for men and $4,330 for women, a difference of 9.9%.
| Sex | Number | Average Earnings |
| Male | 2,162 (49.7%) | $3,900 |
| Female | 2,185 (50.3%) | $4,330 |
| Total | 4,347 (100.0%) | $4,146 |
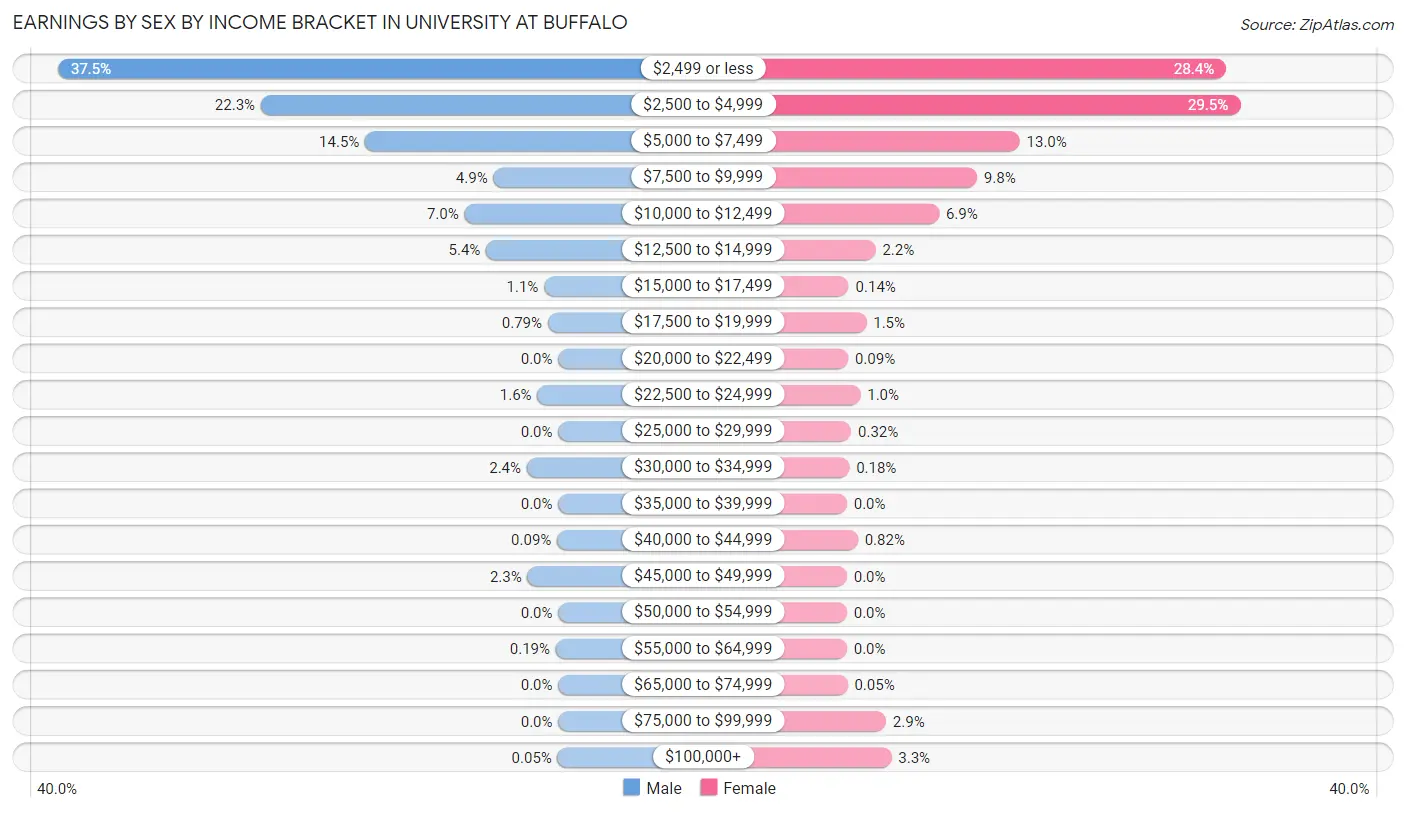
Earnings by Sex by Income Bracket in University at Buffalo
The most common earnings brackets in University at Buffalo are $2,499 or less for men (811 | 37.5%) and $2,500 to $4,999 for women (644 | 29.5%).
| Income | Male | Female |
| $2,499 or less | 811 (37.5%) | 621 (28.4%) |
| $2,500 to $4,999 | 482 (22.3%) | 644 (29.5%) |
| $5,000 to $7,499 | 313 (14.5%) | 283 (13.0%) |
| $7,500 to $9,999 | 105 (4.9%) | 213 (9.8%) |
| $10,000 to $12,499 | 152 (7.0%) | 151 (6.9%) |
| $12,500 to $14,999 | 117 (5.4%) | 47 (2.1%) |
| $15,000 to $17,499 | 23 (1.1%) | 3 (0.1%) |
| $17,500 to $19,999 | 17 (0.8%) | 32 (1.5%) |
| $20,000 to $22,499 | 0 (0.0%) | 2 (0.1%) |
| $22,500 to $24,999 | 34 (1.6%) | 22 (1.0%) |
| $25,000 to $29,999 | 0 (0.0%) | 7 (0.3%) |
| $30,000 to $34,999 | 51 (2.4%) | 4 (0.2%) |
| $35,000 to $39,999 | 0 (0.0%) | 0 (0.0%) |
| $40,000 to $44,999 | 2 (0.1%) | 18 (0.8%) |
| $45,000 to $49,999 | 50 (2.3%) | 0 (0.0%) |
| $50,000 to $54,999 | 0 (0.0%) | 0 (0.0%) |
| $55,000 to $64,999 | 4 (0.2%) | 0 (0.0%) |
| $65,000 to $74,999 | 0 (0.0%) | 1 (0.1%) |
| $75,000 to $99,999 | 0 (0.0%) | 64 (2.9%) |
| $100,000+ | 1 (0.1%) | 73 (3.3%) |
| Total | 2,162 (100.0%) | 2,185 (100.0%) |
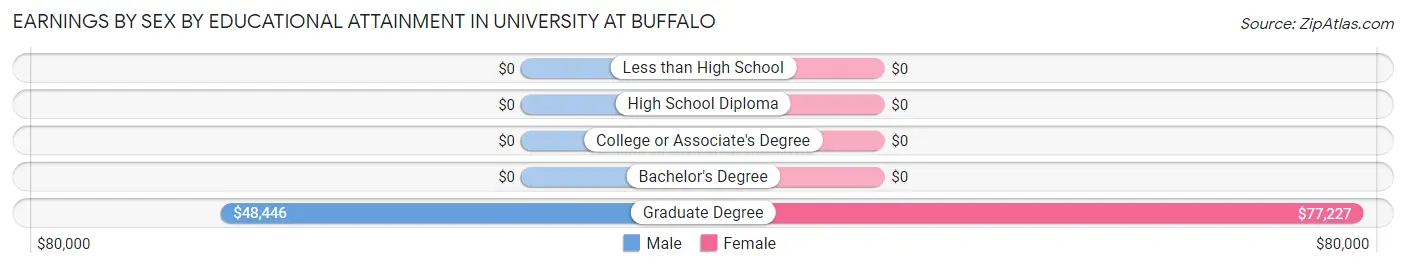
Earnings by Sex by Educational Attainment in University at Buffalo
Average earnings in University at Buffalo are $48,041 for men and $76,875 for women, a difference of 37.5%. Men with an educational attainment of graduate degree enjoy the highest average annual earnings of $48,446, while those with graduate degree education earn the least with $48,446. Women with an educational attainment of graduate degree earn the most with the average annual earnings of $77,227, while those with graduate degree education have the smallest earnings of $77,227.
| Educational Attainment | Male Income | Female Income |
| Less than High School | - | - |
| High School Diploma | - | - |
| College or Associate's Degree | - | - |
| Bachelor's Degree | - | - |
| Graduate Degree | $48,446 | $77,227 |
| Total | $48,041 | $76,875 |
Family Income in University at Buffalo
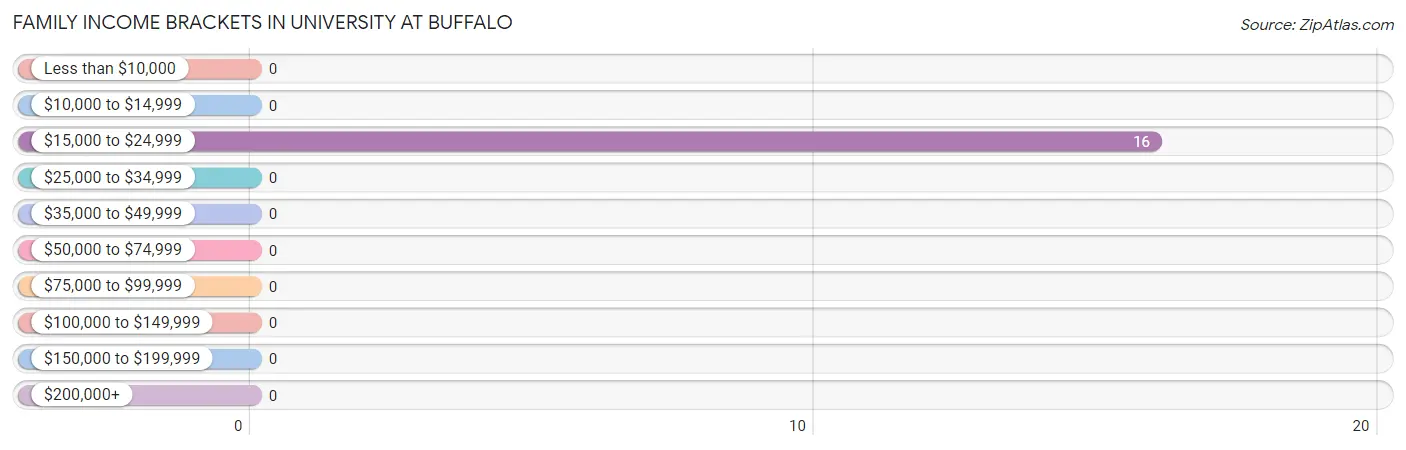
Family Income Brackets in University at Buffalo
According to the University at Buffalo family income data, there are 16 families falling into the $15,000 to $24,999 income range, which is the most common income bracket and makes up 100.0% of all families.
| Income Bracket | # Families | % Families |
| Less than $10,000 | 0 | 0.0% |
| $10,000 to $14,999 | 0 | 0.0% |
| $15,000 to $24,999 | 16 | 100.0% |
| $25,000 to $34,999 | 0 | 0.0% |
| $35,000 to $49,999 | 0 | 0.0% |
| $50,000 to $74,999 | 0 | 0.0% |
| $75,000 to $99,999 | 0 | 0.0% |
| $100,000 to $149,999 | 0 | 0.0% |
| $150,000 to $199,999 | 0 | 0.0% |
| $200,000+ | 0 | 0.0% |
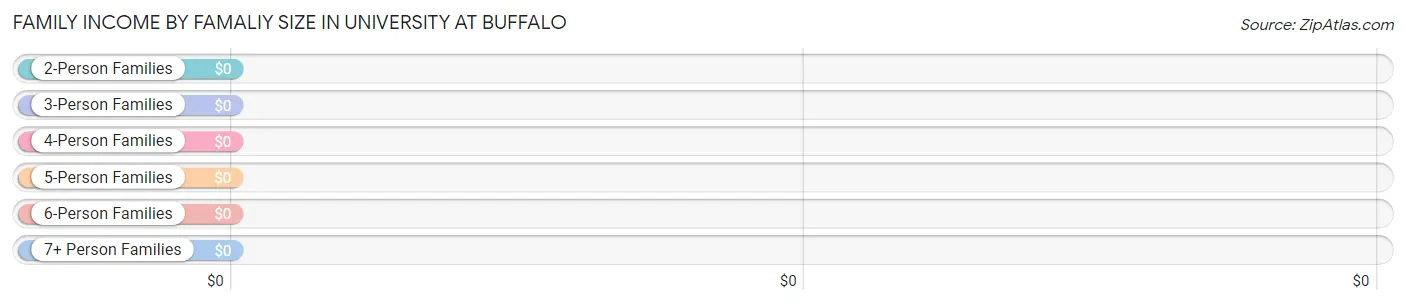
Family Income by Famaliy Size in University at Buffalo
| Income Bracket | # Families | Median Income |
| 2-Person Families | 16 (100.0%) | $0 |
| 3-Person Families | 0 (0.0%) | $0 |
| 4-Person Families | 0 (0.0%) | $0 |
| 5-Person Families | 0 (0.0%) | $0 |
| 6-Person Families | 0 (0.0%) | $0 |
| 7+ Person Families | 0 (0.0%) | $0 |
| Total | 16 (100.0%) | $0 |
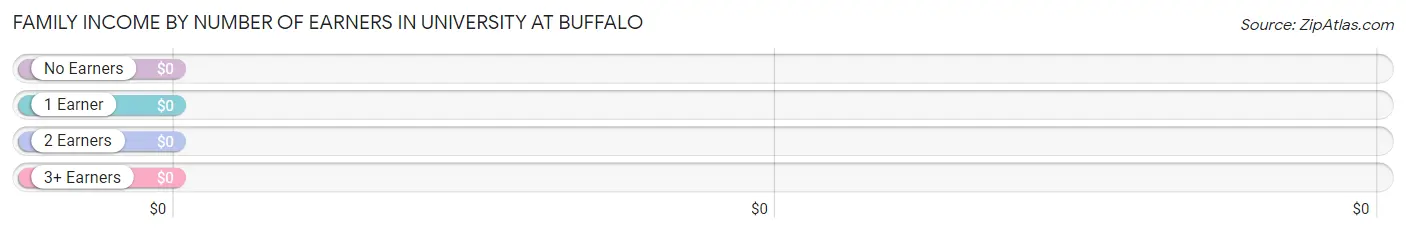
Family Income by Number of Earners in University at Buffalo
| Number of Earners | # Families | Median Income |
| No Earners | 0 (0.0%) | $0 |
| 1 Earner | 16 (100.0%) | $0 |
| 2 Earners | 0 (0.0%) | $0 |
| 3+ Earners | 0 (0.0%) | $0 |
| Total | 16 (100.0%) | $0 |
Household Income in University at Buffalo
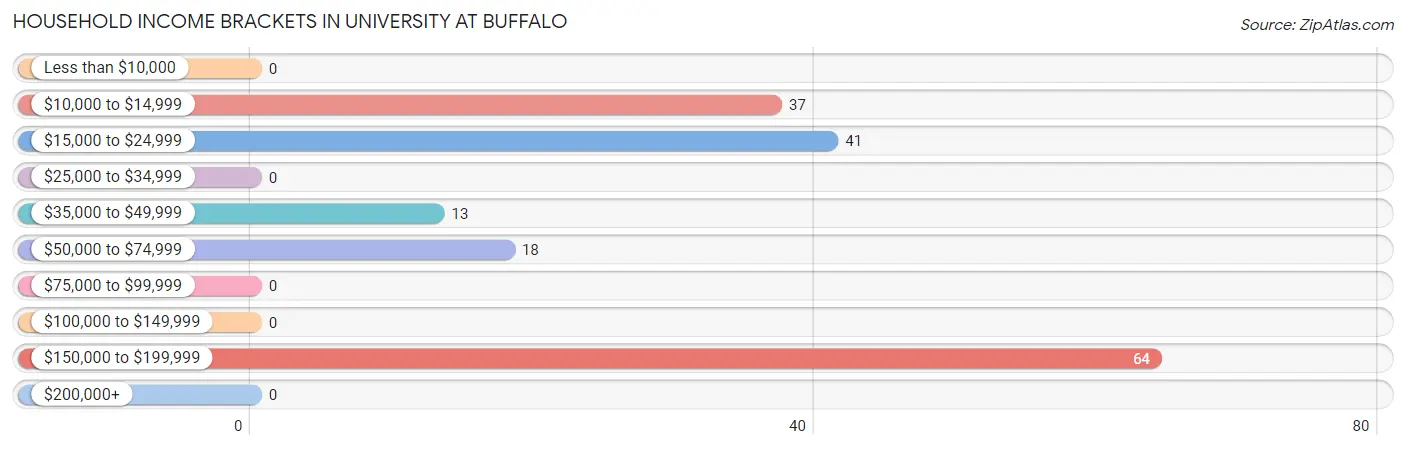
Household Income Brackets in University at Buffalo
With 64 households falling in the category, the $150,000 to $199,999 income range is the most frequent in University at Buffalo, accounting for 37.0% of all households.
| Income Bracket | # Households | % Households |
| Less than $10,000 | 0 | 0.0% |
| $10,000 to $14,999 | 37 | 21.4% |
| $15,000 to $24,999 | 41 | 23.7% |
| $25,000 to $34,999 | 0 | 0.0% |
| $35,000 to $49,999 | 13 | 7.5% |
| $50,000 to $74,999 | 18 | 10.4% |
| $75,000 to $99,999 | 0 | 0.0% |
| $100,000 to $149,999 | 0 | 0.0% |
| $150,000 to $199,999 | 64 | 37.0% |
| $200,000+ | 0 | 0.0% |
Household Income by Householder Age in University at Buffalo
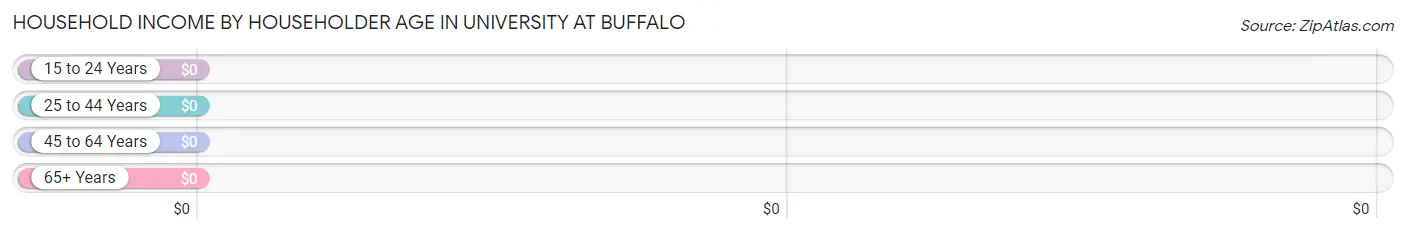
| Income Bracket | # Households | Median Income |
| 15 to 24 Years | 80 (46.2%) | $0 |
| 25 to 44 Years | 29 (16.8%) | $0 |
| 45 to 64 Years | 64 (37.0%) | $0 |
| 65+ Years | 0 (0.0%) | $0 |
| Total | 173 (100.0%) | $0 |
Poverty in University at Buffalo
Income Below Poverty by Sex and Age in University at Buffalo
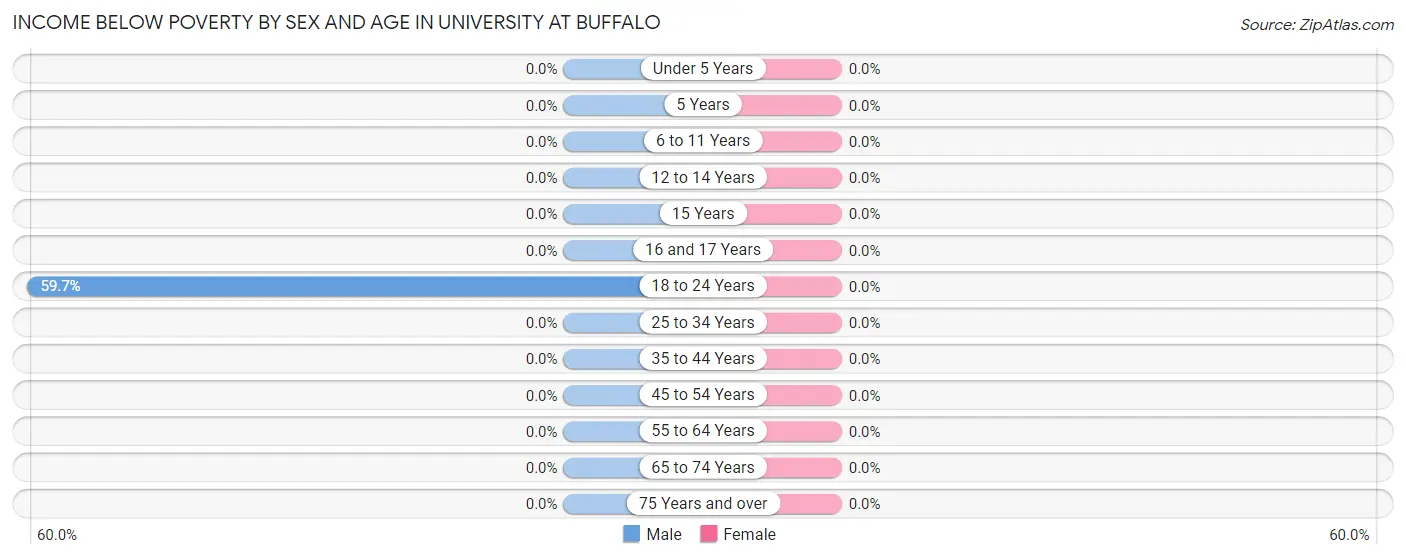
| Age Bracket | Male | Female |
| Under 5 Years | 0 (0.0%) | 0 (0.0%) |
| 5 Years | 0 (0.0%) | 0 (0.0%) |
| 6 to 11 Years | 0 (0.0%) | 0 (0.0%) |
| 12 to 14 Years | 0 (0.0%) | 0 (0.0%) |
| 15 Years | 0 (0.0%) | 0 (0.0%) |
| 16 and 17 Years | 0 (0.0%) | 0 (0.0%) |
| 18 to 24 Years | 37 (59.7%) | 0 (0.0%) |
| 25 to 34 Years | 0 (0.0%) | 0 (0.0%) |
| 35 to 44 Years | 0 (0.0%) | 0 (0.0%) |
| 45 to 54 Years | 0 (0.0%) | 0 (0.0%) |
| 55 to 64 Years | 0 (0.0%) | 0 (0.0%) |
| 65 to 74 Years | 0 (0.0%) | 0 (0.0%) |
| 75 Years and over | 0 (0.0%) | 0 (0.0%) |
| Total | 37 (40.7%) | 0 (0.0%) |
Income Above Poverty by Sex and Age in University at Buffalo
According to the poverty statistics in University at Buffalo, males aged 25 to 34 years and females aged 18 to 24 years are the age groups that are most secure financially, with 100.0% of males and 100.0% of females in these age groups living above the poverty line.
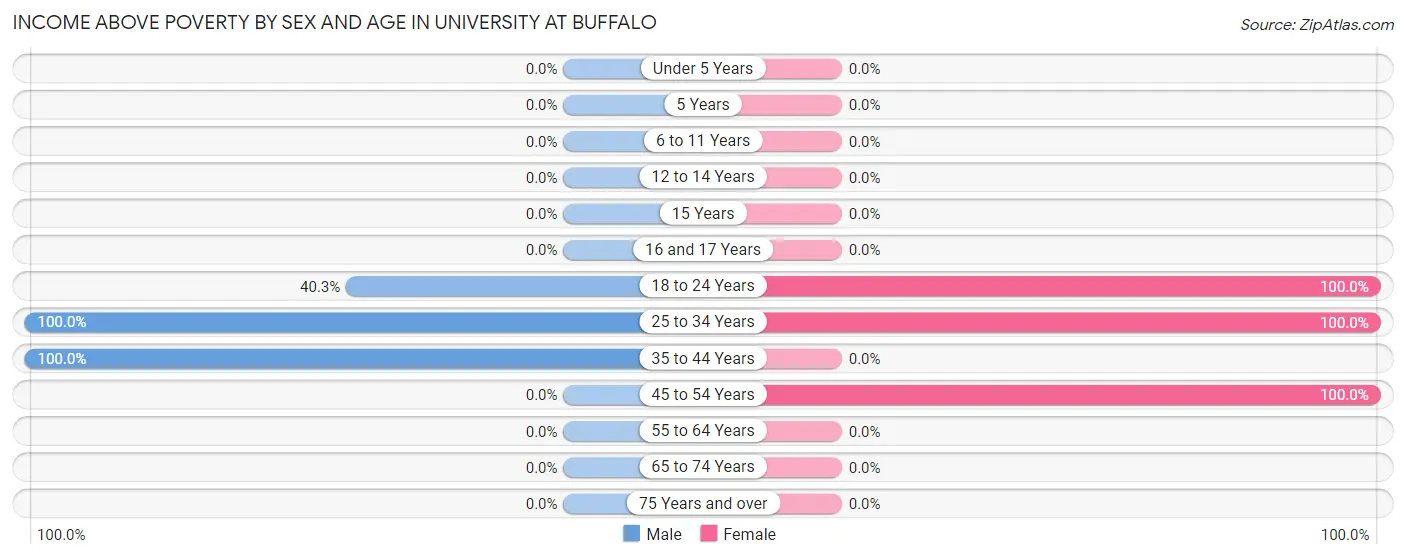
| Age Bracket | Male | Female |
| Under 5 Years | 0 (0.0%) | 0 (0.0%) |
| 5 Years | 0 (0.0%) | 0 (0.0%) |
| 6 to 11 Years | 0 (0.0%) | 0 (0.0%) |
| 12 to 14 Years | 0 (0.0%) | 0 (0.0%) |
| 15 Years | 0 (0.0%) | 0 (0.0%) |
| 16 and 17 Years | 0 (0.0%) | 0 (0.0%) |
| 18 to 24 Years | 25 (40.3%) | 18 (100.0%) |
| 25 to 34 Years | 13 (100.0%) | 38 (100.0%) |
| 35 to 44 Years | 16 (100.0%) | 0 (0.0%) |
| 45 to 54 Years | 0 (0.0%) | 137 (100.0%) |
| 55 to 64 Years | 0 (0.0%) | 0 (0.0%) |
| 65 to 74 Years | 0 (0.0%) | 0 (0.0%) |
| 75 Years and over | 0 (0.0%) | 0 (0.0%) |
| Total | 54 (59.3%) | 193 (100.0%) |
Income Below Poverty Among Married-Couple Families in University at Buffalo
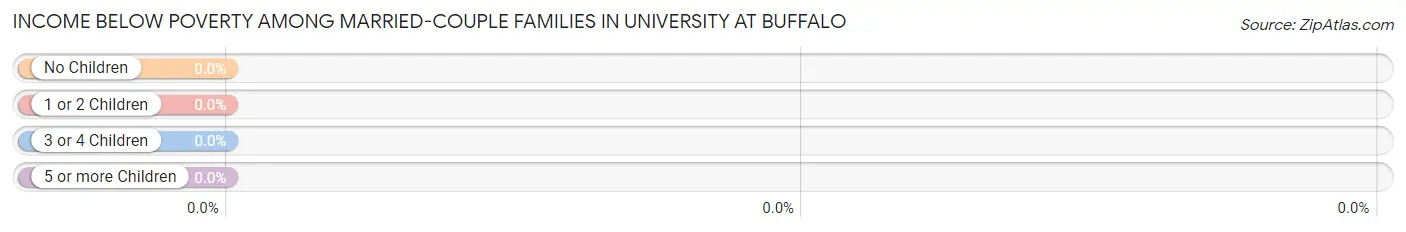
| Children | Above Poverty | Below Poverty |
| No Children | 16 (100.0%) | 0 (0.0%) |
| 1 or 2 Children | 0 (0.0%) | 0 (0.0%) |
| 3 or 4 Children | 0 (0.0%) | 0 (0.0%) |
| 5 or more Children | 0 (0.0%) | 0 (0.0%) |
| Total | 16 (100.0%) | 0 (0.0%) |
Income Below Poverty Among Single-Parent Households in University at Buffalo
| Children | Single Father | Single Mother |
| No Children | 0 (0.0%) | 0 (0.0%) |
| 1 or 2 Children | 0 (0.0%) | 0 (0.0%) |
| 3 or 4 Children | 0 (0.0%) | 0 (0.0%) |
| 5 or more Children | 0 (0.0%) | 0 (0.0%) |
| Total | 0 (0.0%) | 0 (0.0%) |
Income Below Poverty Among Married-Couple vs Single-Parent Households in University at Buffalo
| Children | Married-Couple Families | Single-Parent Households |
| No Children | 0 (0.0%) | 0 (0.0%) |
| 1 or 2 Children | 0 (0.0%) | 0 (0.0%) |
| 3 or 4 Children | 0 (0.0%) | 0 (0.0%) |
| 5 or more Children | 0 (0.0%) | 0 (0.0%) |
| Total | 0 (0.0%) | 0 (0.0%) |
Race in University at Buffalo
The most populous races in University at Buffalo are White / Caucasian (3,407 | 55.0%), Black / African American (1,115 | 18.0%), and Asian (992 | 16.0%).
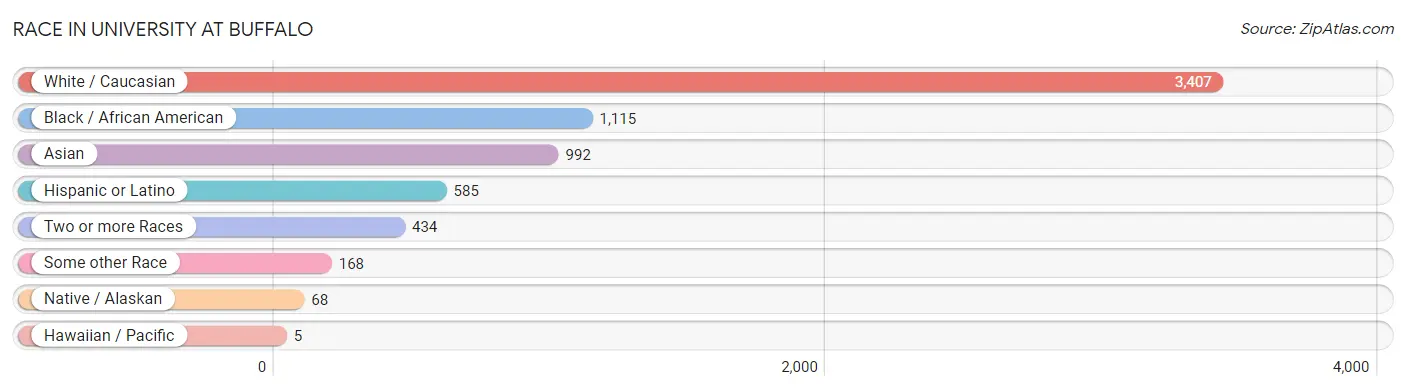
| Race | # Population | % Population |
| Asian | 992 | 16.0% |
| Black / African American | 1,115 | 18.0% |
| Hawaiian / Pacific | 5 | 0.1% |
| Hispanic or Latino | 585 | 9.5% |
| Native / Alaskan | 68 | 1.1% |
| White / Caucasian | 3,407 | 55.0% |
| Two or more Races | 434 | 7.0% |
| Some other Race | 168 | 2.7% |
| Total | 6,189 | 100.0% |
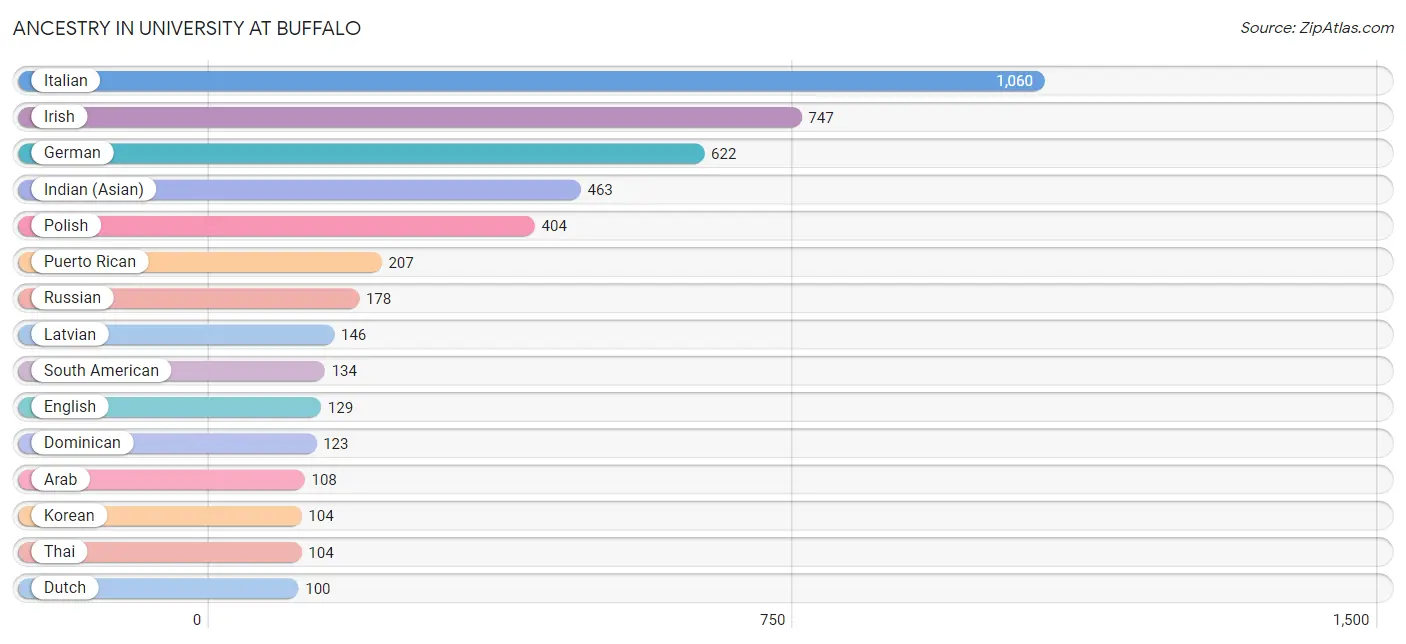
Ancestry in University at Buffalo
The most populous ancestries reported in University at Buffalo are Italian (1,060 | 17.1%), Irish (747 | 12.1%), German (622 | 10.1%), Indian (Asian) (463 | 7.5%), and Polish (404 | 6.5%), together accounting for 53.3% of all University at Buffalo residents.
| Ancestry | # Population | % Population |
| African | 52 | 0.8% |
| American | 51 | 0.8% |
| Arab | 108 | 1.8% |
| Austrian | 15 | 0.2% |
| Bahamian | 6 | 0.1% |
| Bhutanese | 44 | 0.7% |
| British | 44 | 0.7% |
| Burmese | 83 | 1.3% |
| Cambodian | 37 | 0.6% |
| Canadian | 1 | 0.0% |
| Central American | 50 | 0.8% |
| Cherokee | 2 | 0.0% |
| Chilean | 8 | 0.1% |
| Colombian | 9 | 0.2% |
| Costa Rican | 6 | 0.1% |
| Cuban | 32 | 0.5% |
| Czech | 12 | 0.2% |
| Danish | 42 | 0.7% |
| Dominican | 123 | 2.0% |
| Dutch | 100 | 1.6% |
| Eastern European | 4 | 0.1% |
| Ecuadorian | 74 | 1.2% |
| Egyptian | 16 | 0.3% |
| English | 129 | 2.1% |
| European | 41 | 0.7% |
| Filipino | 10 | 0.2% |
| Finnish | 3 | 0.1% |
| French | 48 | 0.8% |
| French Canadian | 11 | 0.2% |
| German | 622 | 10.1% |
| German Russian | 88 | 1.4% |
| Greek | 17 | 0.3% |
| Guatemalan | 2 | 0.0% |
| Guyanese | 8 | 0.1% |
| Honduran | 18 | 0.3% |
| Hungarian | 10 | 0.2% |
| Icelander | 3 | 0.1% |
| Indian (Asian) | 463 | 7.5% |
| Indonesian | 28 | 0.4% |
| Iranian | 4 | 0.1% |
| Irish | 747 | 12.1% |
| Iroquois | 40 | 0.6% |
| Italian | 1,060 | 17.1% |
| Jamaican | 9 | 0.2% |
| Jordanian | 1 | 0.0% |
| Korean | 104 | 1.7% |
| Laotian | 11 | 0.2% |
| Latvian | 146 | 2.4% |
| Lebanese | 2 | 0.0% |
| Lithuanian | 5 | 0.1% |
| Macedonian | 9 | 0.2% |
| Malaysian | 3 | 0.1% |
| Mexican | 10 | 0.2% |
| Native Hawaiian | 5 | 0.1% |
| Nicaraguan | 2 | 0.0% |
| Norwegian | 40 | 0.6% |
| Pakistani | 8 | 0.1% |
| Palestinian | 4 | 0.1% |
| Panamanian | 1 | 0.0% |
| Peruvian | 23 | 0.4% |
| Polish | 404 | 6.5% |
| Portuguese | 15 | 0.2% |
| Puerto Rican | 207 | 3.3% |
| Romanian | 8 | 0.1% |
| Russian | 178 | 2.9% |
| Salvadoran | 13 | 0.2% |
| Scandinavian | 8 | 0.1% |
| Scottish | 18 | 0.3% |
| Serbian | 4 | 0.1% |
| Slovak | 4 | 0.1% |
| South American | 134 | 2.2% |
| Spaniard | 2 | 0.0% |
| Spanish | 4 | 0.1% |
| Sri Lankan | 78 | 1.3% |
| Subsaharan African | 57 | 0.9% |
| Swedish | 11 | 0.2% |
| Taiwanese | 11 | 0.2% |
| Thai | 104 | 1.7% |
| Trinidadian and Tobagonian | 6 | 0.1% |
| Turkish | 9 | 0.2% |
| Ukrainian | 96 | 1.5% |
| Venezuelan | 16 | 0.3% |
| Vietnamese | 63 | 1.0% |
| Welsh | 6 | 0.1% |
| West Indian | 23 | 0.4% |
| Yugoslavian | 4 | 0.1% | View All 86 Rows |
Immigrants in University at Buffalo
The most numerous immigrant groups reported in University at Buffalo came from Asia (465 | 7.5%), Eastern Asia (266 | 4.3%), China (215 | 3.5%), Europe (188 | 3.0%), and Eastern Europe (162 | 2.6%), together accounting for 20.9% of all University at Buffalo residents.
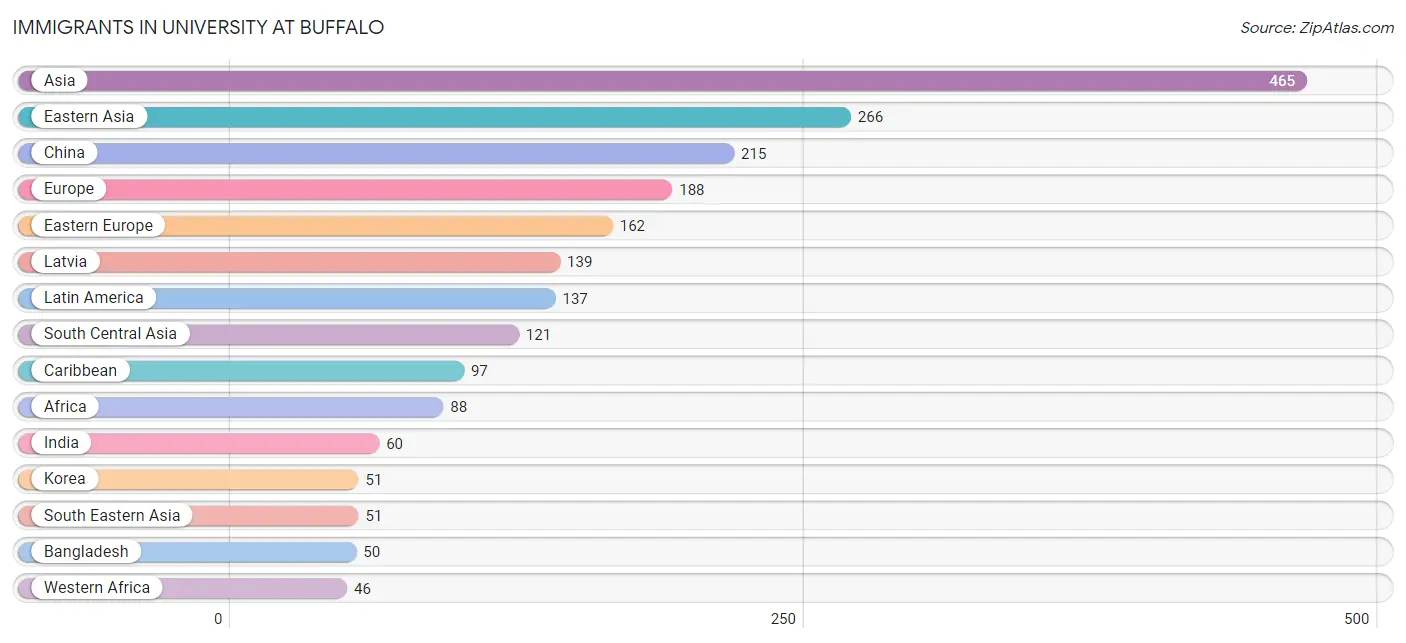
| Immigration Origin | # Population | % Population |
| Africa | 88 | 1.4% |
| Asia | 465 | 7.5% |
| Bangladesh | 50 | 0.8% |
| Barbados | 37 | 0.6% |
| Canada | 5 | 0.1% |
| Caribbean | 97 | 1.6% |
| Central America | 5 | 0.1% |
| China | 215 | 3.5% |
| Congo | 29 | 0.5% |
| Dominican Republic | 32 | 0.5% |
| Eastern Africa | 3 | 0.1% |
| Eastern Asia | 266 | 4.3% |
| Eastern Europe | 162 | 2.6% |
| Ecuador | 2 | 0.0% |
| Egypt | 3 | 0.1% |
| England | 7 | 0.1% |
| Europe | 188 | 3.0% |
| Ghana | 5 | 0.1% |
| Grenada | 11 | 0.2% |
| Guyana | 31 | 0.5% |
| Honduras | 5 | 0.1% |
| Hong Kong | 8 | 0.1% |
| India | 60 | 1.0% |
| Indonesia | 11 | 0.2% |
| Jamaica | 4 | 0.1% |
| Jordan | 7 | 0.1% |
| Kenya | 3 | 0.1% |
| Korea | 51 | 0.8% |
| Kuwait | 1 | 0.0% |
| Latin America | 137 | 2.2% |
| Latvia | 139 | 2.2% |
| Lebanon | 2 | 0.0% |
| Middle Africa | 29 | 0.5% |
| Netherlands | 12 | 0.2% |
| Nigeria | 31 | 0.5% |
| Northern Africa | 10 | 0.2% |
| Northern Europe | 7 | 0.1% |
| Pakistan | 3 | 0.1% |
| Philippines | 2 | 0.0% |
| Romania | 8 | 0.1% |
| Russia | 9 | 0.2% |
| Saudi Arabia | 6 | 0.1% |
| Serbia | 4 | 0.1% |
| Singapore | 2 | 0.0% |
| South America | 35 | 0.6% |
| South Central Asia | 121 | 2.0% |
| South Eastern Asia | 51 | 0.8% |
| Southern Europe | 7 | 0.1% |
| Spain | 7 | 0.1% |
| Sri Lanka | 8 | 0.1% |
| Taiwan | 13 | 0.2% |
| Thailand | 5 | 0.1% |
| Trinidad and Tobago | 6 | 0.1% |
| Turkey | 7 | 0.1% |
| Ukraine | 2 | 0.0% |
| Venezuela | 2 | 0.0% |
| Vietnam | 3 | 0.1% |
| Western Africa | 46 | 0.7% |
| Western Asia | 27 | 0.4% |
| Western Europe | 12 | 0.2% | View All 60 Rows |
Sex and Age in University at Buffalo
Sex and Age in University at Buffalo
The most populous age groups in University at Buffalo are 15 to 19 Years (2,215 | 68.8%) for men and 15 to 19 Years (2,012 | 67.8%) for women.
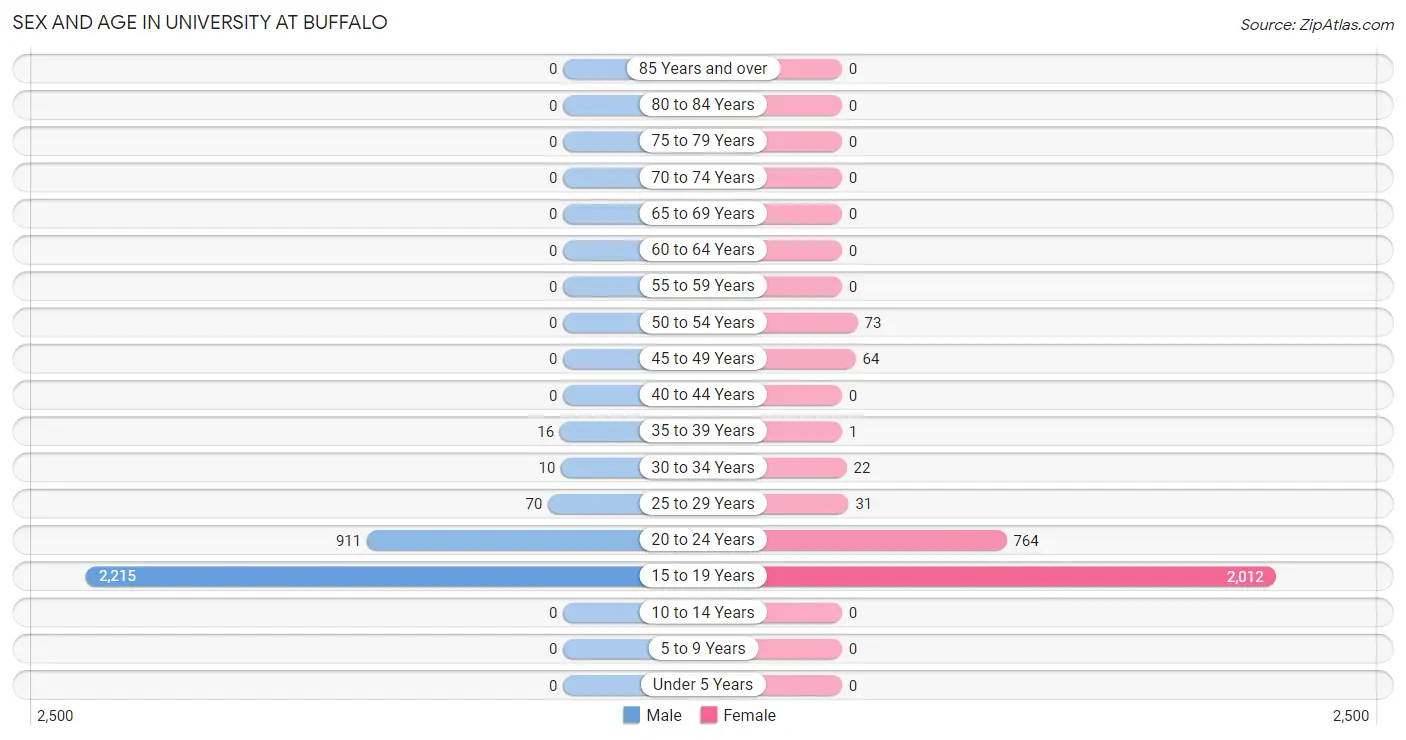
| Age Bracket | Male | Female |
| Under 5 Years | 0 (0.0%) | 0 (0.0%) |
| 5 to 9 Years | 0 (0.0%) | 0 (0.0%) |
| 10 to 14 Years | 0 (0.0%) | 0 (0.0%) |
| 15 to 19 Years | 2,215 (68.8%) | 2,012 (67.8%) |
| 20 to 24 Years | 911 (28.3%) | 764 (25.8%) |
| 25 to 29 Years | 70 (2.2%) | 31 (1.0%) |
| 30 to 34 Years | 10 (0.3%) | 22 (0.7%) |
| 35 to 39 Years | 16 (0.5%) | 1 (0.0%) |
| 40 to 44 Years | 0 (0.0%) | 0 (0.0%) |
| 45 to 49 Years | 0 (0.0%) | 64 (2.2%) |
| 50 to 54 Years | 0 (0.0%) | 73 (2.5%) |
| 55 to 59 Years | 0 (0.0%) | 0 (0.0%) |
| 60 to 64 Years | 0 (0.0%) | 0 (0.0%) |
| 65 to 69 Years | 0 (0.0%) | 0 (0.0%) |
| 70 to 74 Years | 0 (0.0%) | 0 (0.0%) |
| 75 to 79 Years | 0 (0.0%) | 0 (0.0%) |
| 80 to 84 Years | 0 (0.0%) | 0 (0.0%) |
| 85 Years and over | 0 (0.0%) | 0 (0.0%) |
| Total | 3,222 (100.0%) | 2,967 (100.0%) |
Families and Households in University at Buffalo
Median Family Size in University at Buffalo
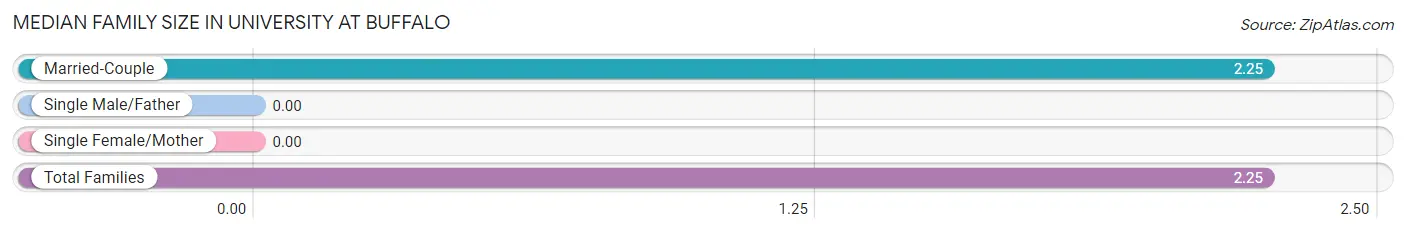
| Family Type | # Families | Family Size |
| Married-Couple | 16 (100.0%) | 2.25 |
| Single Male/Father | 0 (0.0%) | - |
| Single Female/Mother | 0 (0.0%) | - |
| Total Families | 16 (100.0%) | 2.25 |
Median Household Size in University at Buffalo
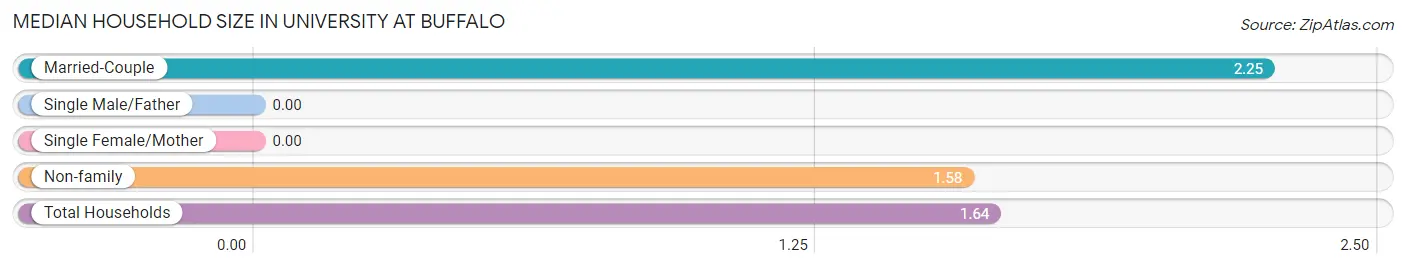
| Household Type | # Households | Household Size |
| Married-Couple | 16 (9.2%) | 2.25 |
| Single Male/Father | 0 (0.0%) | - |
| Single Female/Mother | 0 (0.0%) | - |
| Non-family | 157 (90.7%) | 1.58 |
| Total Households | 173 (100.0%) | 1.64 |
Household Size by Marriage Status in University at Buffalo
Out of a total of 173 households in University at Buffalo, 16 (9.2%) are family households, while 157 (90.7%) are nonfamily households. The most numerous type of family households are 2-person households, comprising 16, and the most common type of nonfamily households are 2-person households, comprising 82.
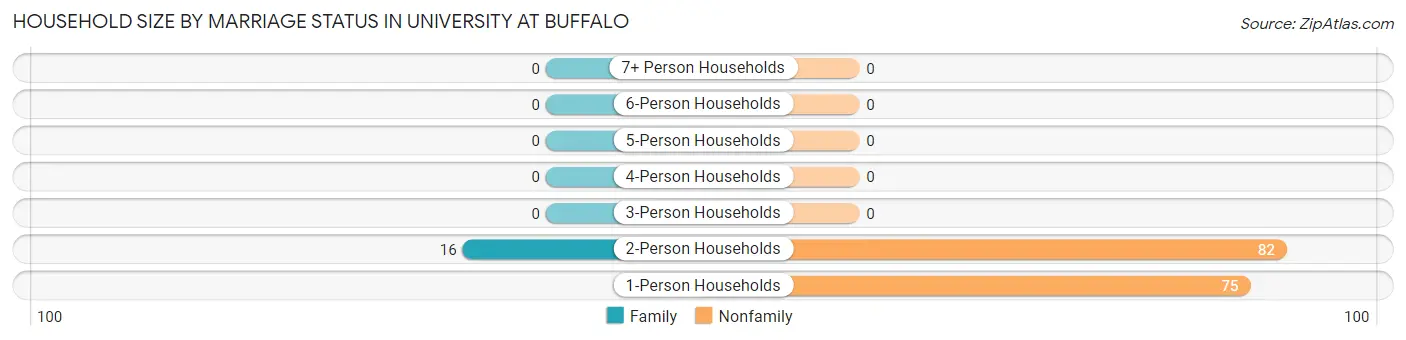
| Household Size | Family Households | Nonfamily Households |
| 1-Person Households | - | 75 (43.3%) |
| 2-Person Households | 16 (9.2%) | 82 (47.4%) |
| 3-Person Households | 0 (0.0%) | 0 (0.0%) |
| 4-Person Households | 0 (0.0%) | 0 (0.0%) |
| 5-Person Households | 0 (0.0%) | 0 (0.0%) |
| 6-Person Households | 0 (0.0%) | 0 (0.0%) |
| 7+ Person Households | 0 (0.0%) | 0 (0.0%) |
| Total | 16 (9.2%) | 157 (90.7%) |
Female Fertility in University at Buffalo
Fertility by Age in University at Buffalo
| Age Bracket | Women with Births | Births / 1,000 Women |
| 15 to 19 years | 0 (0.0%) | 0.0 |
| 20 to 34 years | 0 (0.0%) | 0.0 |
| 35 to 50 years | 0 (0.0%) | 0.0 |
| Total | 0 (0.0%) | 0.0 |
Fertility by Age by Marriage Status in University at Buffalo
| Age Bracket | Married | Unmarried |
| 15 to 19 years | 0 (0.0%) | 0 (0.0%) |
| 20 to 34 years | 0 (0.0%) | 0 (0.0%) |
| 35 to 50 years | 0 (0.0%) | 0 (0.0%) |
| Total | 0 (0.0%) | 0 (0.0%) |
Fertility by Education in University at Buffalo
| Educational Attainment | Women with Births | Births / 1,000 Women |
| Less than High School | 0 (0.0%) | 0.0 |
| High School Diploma | 0 (0.0%) | 0.0 |
| College or Associate's Degree | 0 (0.0%) | 0.0 |
| Bachelor's Degree | 0 (0.0%) | 0.0 |
| Graduate Degree | 0 (0.0%) | 0.0 |
| Total | 0 (0.0%) | 0.0 |
Fertility by Education by Marriage Status in University at Buffalo
| Educational Attainment | Married | Unmarried |
| Less than High School | 0 (0.0%) | 0 (0.0%) |
| High School Diploma | 0 (0.0%) | 0 (0.0%) |
| College or Associate's Degree | 0 (0.0%) | 0 (0.0%) |
| Bachelor's Degree | 0 (0.0%) | 0 (0.0%) |
| Graduate Degree | 0 (0.0%) | 0 (0.0%) |
| Total | 0 (0.0%) | 0 (0.0%) |
Employment Characteristics in University at Buffalo
Employment by Class of Employer in University at Buffalo
Among the 1,268 employed individuals in University at Buffalo, private company employees (638 | 50.3%), state government employees (464 | 36.6%), and not-for-profit organizations (106 | 8.4%) make up the most common classes of employment.
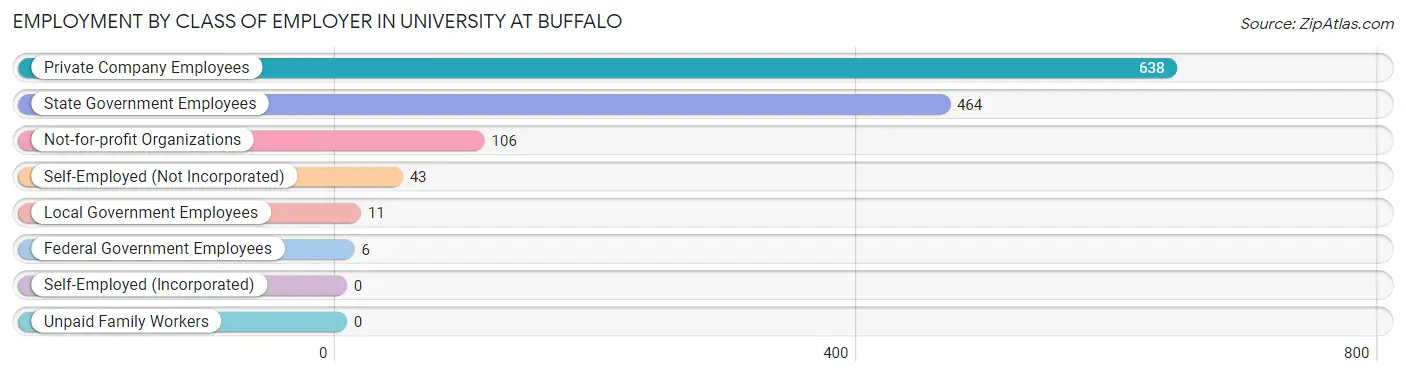
| Employer Class | # Employees | % Employees |
| Private Company Employees | 638 | 50.3% |
| Self-Employed (Incorporated) | 0 | 0.0% |
| Self-Employed (Not Incorporated) | 43 | 3.4% |
| Not-for-profit Organizations | 106 | 8.4% |
| Local Government Employees | 11 | 0.9% |
| State Government Employees | 464 | 36.6% |
| Federal Government Employees | 6 | 0.5% |
| Unpaid Family Workers | 0 | 0.0% |
| Total | 1,268 | 100.0% |
Employment Status by Age in University at Buffalo
According to the labor force statistics for University at Buffalo, out of the total population over 16 years of age (6,189), 21.3% or 1,318 individuals are in the labor force, with 2.1% or 28 of them unemployed. The age group with the highest labor force participation rate is 25 to 29 years, with 78.2% or 79 individuals in the labor force. Within the labor force, the 16 to 19 years age range has the highest percentage of unemployed individuals, with 2.3% or 16 of them being unemployed.
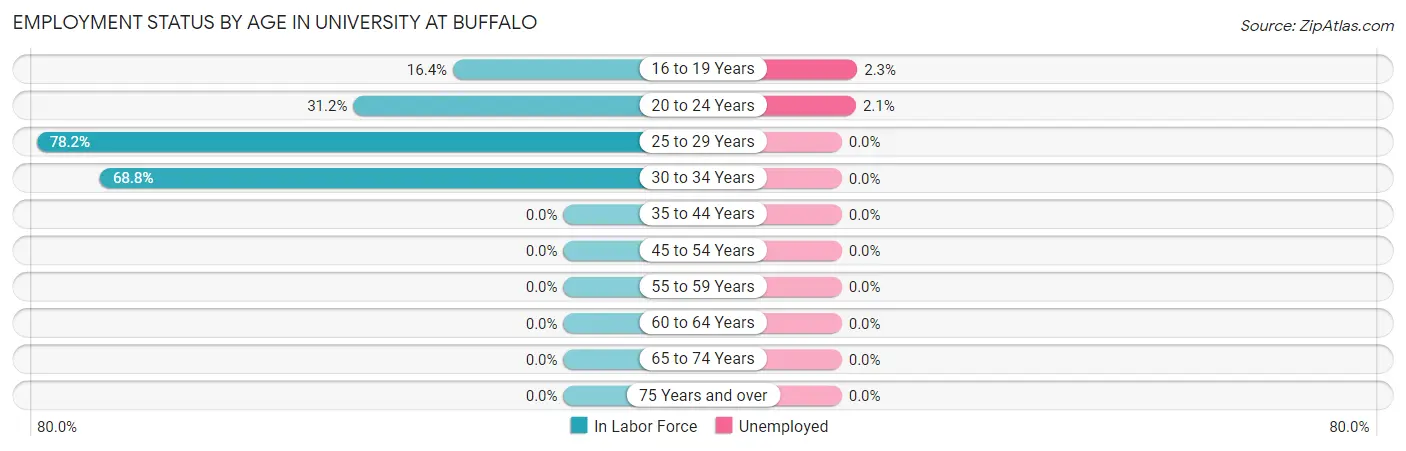
| Age Bracket | In Labor Force | Unemployed |
| 16 to 19 Years | 693 (16.4%) | 16 (2.3%) |
| 20 to 24 Years | 523 (31.2%) | 11 (2.1%) |
| 25 to 29 Years | 79 (78.2%) | 0 (0.0%) |
| 30 to 34 Years | 22 (68.8%) | 0 (0.0%) |
| 35 to 44 Years | 0 (0.0%) | 0 (0.0%) |
| 45 to 54 Years | 0 (0.0%) | 0 (0.0%) |
| 55 to 59 Years | 0 (0.0%) | 0 (0.0%) |
| 60 to 64 Years | 0 (0.0%) | 0 (0.0%) |
| 65 to 74 Years | 0 (0.0%) | 0 (0.0%) |
| 75 Years and over | 0 (0.0%) | 0 (0.0%) |
| Total | 1,318 (21.3%) | 28 (2.1%) |
Employment Status by Educational Attainment in University at Buffalo
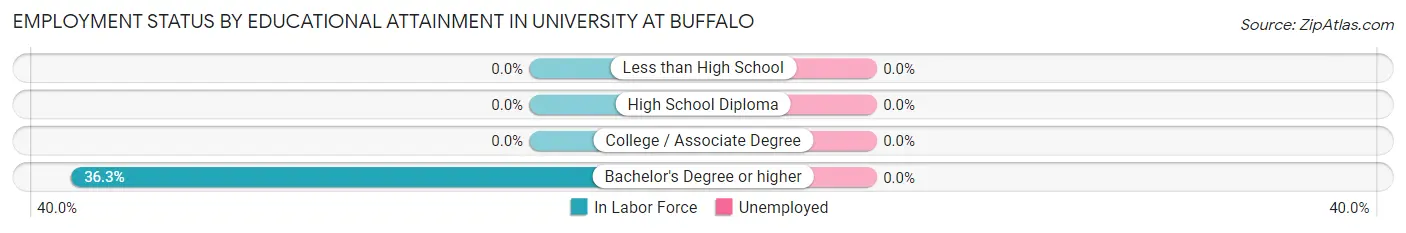
| Educational Attainment | In Labor Force | Unemployed |
| Less than High School | 0 (0.0%) | 0 (0.0%) |
| High School Diploma | 0 (0.0%) | 0 (0.0%) |
| College / Associate Degree | 0 (0.0%) | 0 (0.0%) |
| Bachelor's Degree or higher | 101 (36.3%) | 0 (0.0%) |
| Total | 101 (35.2%) | 0 (0.0%) |
Employment Occupations by Sex in University at Buffalo
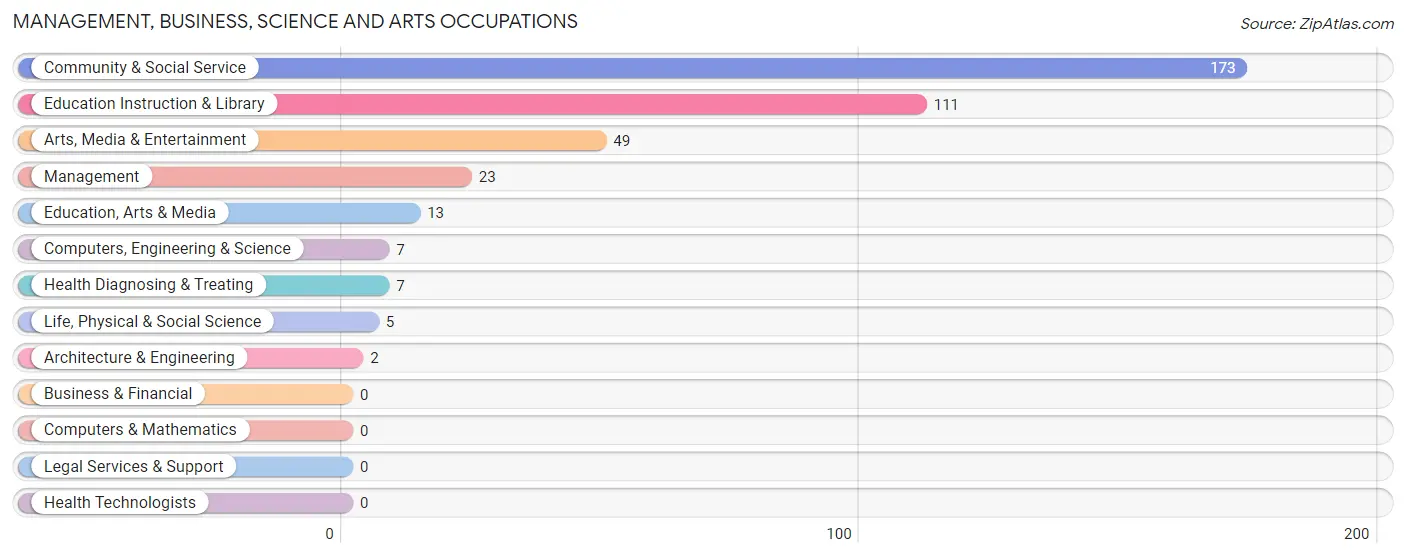
Management, Business, Science and Arts Occupations
The most common Management, Business, Science and Arts occupations in University at Buffalo are Community & Social Service (173 | 13.4%), Education Instruction & Library (111 | 8.6%), Arts, Media & Entertainment (49 | 3.8%), Management (23 | 1.8%), and Education, Arts & Media (13 | 1.0%).
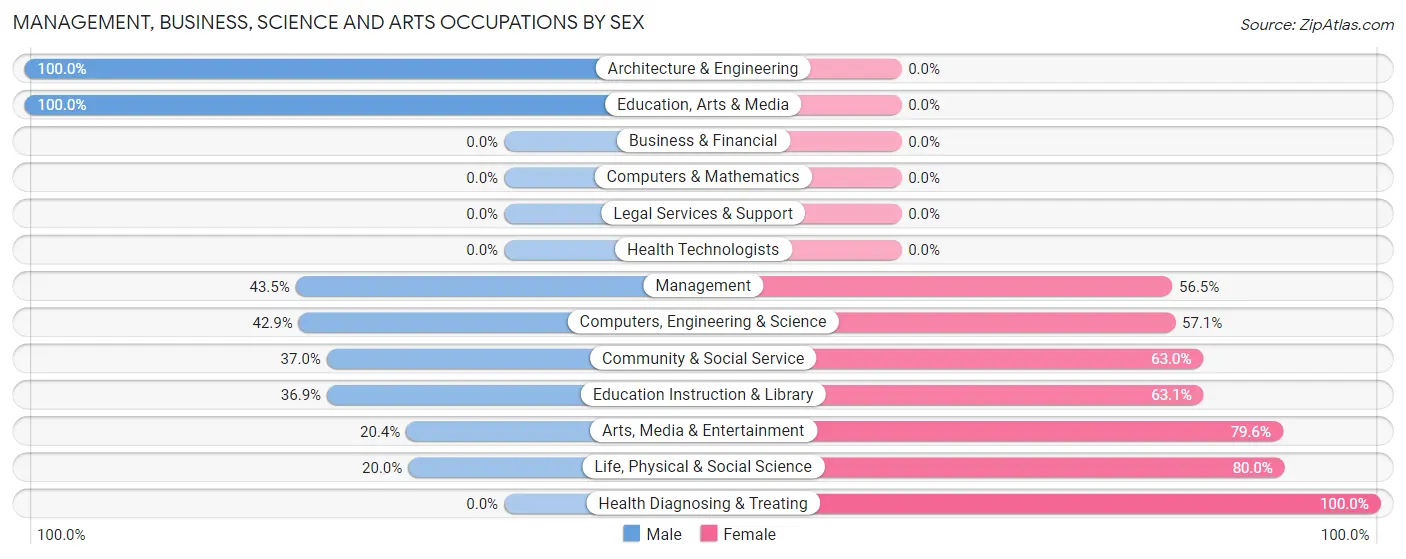
Management, Business, Science and Arts Occupations by Sex
Within the Management, Business, Science and Arts occupations in University at Buffalo, the most male-oriented occupations are Architecture & Engineering (100.0%), Education, Arts & Media (100.0%), and Management (43.5%), while the most female-oriented occupations are Health Diagnosing & Treating (100.0%), Life, Physical & Social Science (80.0%), and Arts, Media & Entertainment (79.6%).
| Occupation | Male | Female |
| Management | 10 (43.5%) | 13 (56.5%) |
| Business & Financial | 0 (0.0%) | 0 (0.0%) |
| Computers, Engineering & Science | 3 (42.9%) | 4 (57.1%) |
| Computers & Mathematics | 0 (0.0%) | 0 (0.0%) |
| Architecture & Engineering | 2 (100.0%) | 0 (0.0%) |
| Life, Physical & Social Science | 1 (20.0%) | 4 (80.0%) |
| Community & Social Service | 64 (37.0%) | 109 (63.0%) |
| Education, Arts & Media | 13 (100.0%) | 0 (0.0%) |
| Legal Services & Support | 0 (0.0%) | 0 (0.0%) |
| Education Instruction & Library | 41 (36.9%) | 70 (63.1%) |
| Arts, Media & Entertainment | 10 (20.4%) | 39 (79.6%) |
| Health Diagnosing & Treating | 0 (0.0%) | 7 (100.0%) |
| Health Technologists | 0 (0.0%) | 0 (0.0%) |
| Total (Category) | 77 (36.7%) | 133 (63.3%) |
| Total (Overall) | 663 (51.4%) | 627 (48.6%) |
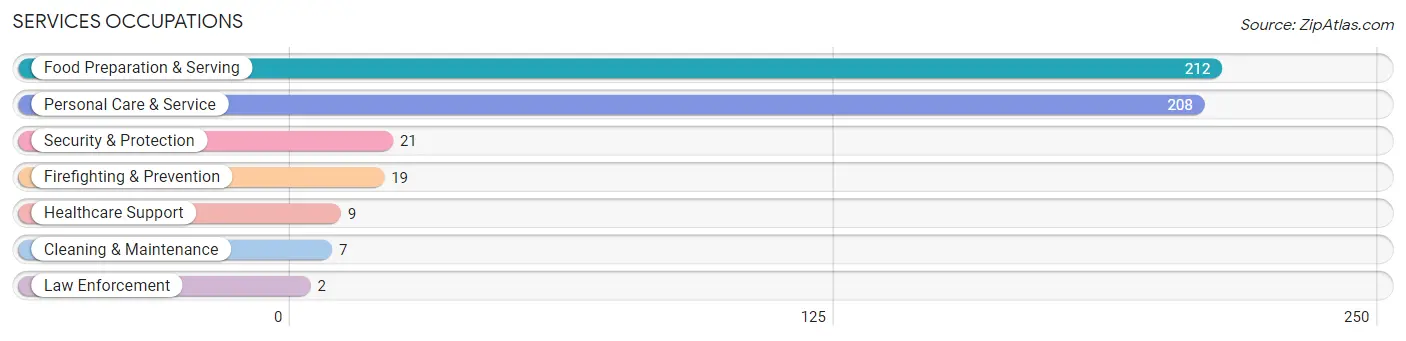
Services Occupations
The most common Services occupations in University at Buffalo are Food Preparation & Serving (212 | 16.4%), Personal Care & Service (208 | 16.1%), Security & Protection (21 | 1.6%), Firefighting & Prevention (19 | 1.5%), and Healthcare Support (9 | 0.7%).
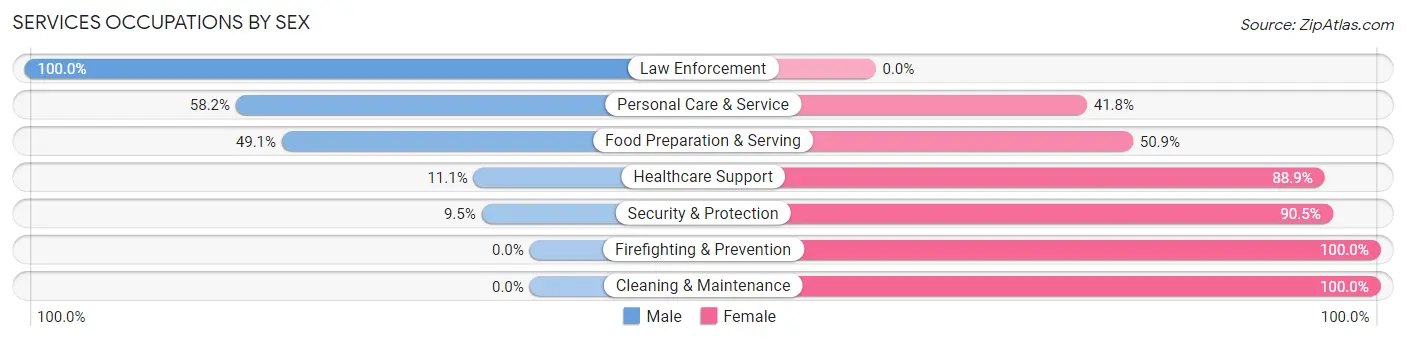
Services Occupations by Sex
Within the Services occupations in University at Buffalo, the most male-oriented occupations are Law Enforcement (100.0%), Personal Care & Service (58.2%), and Food Preparation & Serving (49.1%), while the most female-oriented occupations are Firefighting & Prevention (100.0%), Cleaning & Maintenance (100.0%), and Security & Protection (90.5%).
| Occupation | Male | Female |
| Healthcare Support | 1 (11.1%) | 8 (88.9%) |
| Security & Protection | 2 (9.5%) | 19 (90.5%) |
| Firefighting & Prevention | 0 (0.0%) | 19 (100.0%) |
| Law Enforcement | 2 (100.0%) | 0 (0.0%) |
| Food Preparation & Serving | 104 (49.1%) | 108 (50.9%) |
| Cleaning & Maintenance | 0 (0.0%) | 7 (100.0%) |
| Personal Care & Service | 121 (58.2%) | 87 (41.8%) |
| Total (Category) | 228 (49.9%) | 229 (50.1%) |
| Total (Overall) | 663 (51.4%) | 627 (48.6%) |
Sales and Office Occupations
The most common Sales and Office occupations in University at Buffalo are Office & Administration (345 | 26.7%), and Sales & Related (232 | 18.0%).

Sales and Office Occupations by Sex
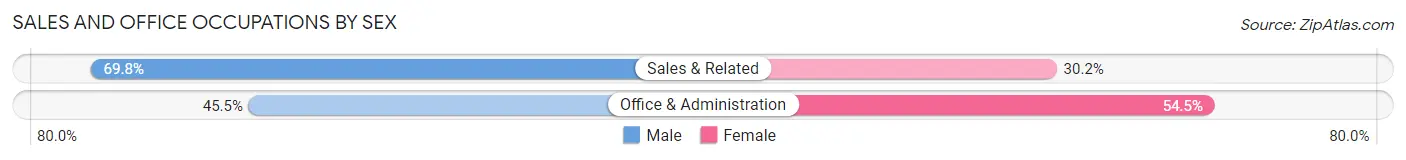
| Occupation | Male | Female |
| Sales & Related | 162 (69.8%) | 70 (30.2%) |
| Office & Administration | 157 (45.5%) | 188 (54.5%) |
| Total (Category) | 319 (55.3%) | 258 (44.7%) |
| Total (Overall) | 663 (51.4%) | 627 (48.6%) |
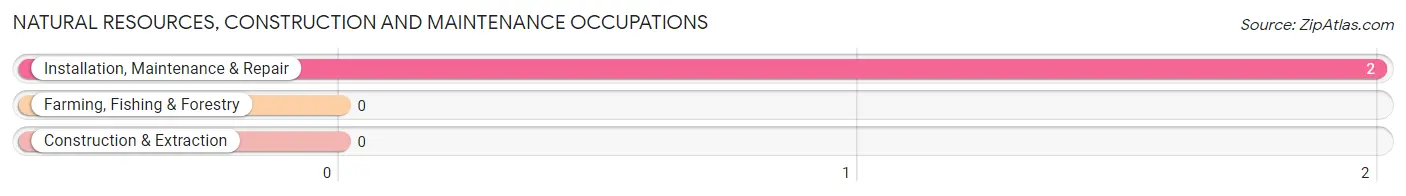
Natural Resources, Construction and Maintenance Occupations
The most common Natural Resources, Construction and Maintenance occupations in University at Buffalo are , and Installation, Maintenance & Repair (2 | 0.2%).
Natural Resources, Construction and Maintenance Occupations by Sex
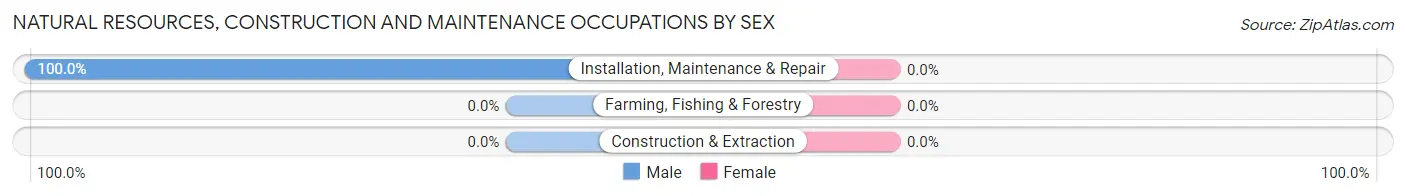
| Occupation | Male | Female |
| Farming, Fishing & Forestry | 0 (0.0%) | 0 (0.0%) |
| Construction & Extraction | 0 (0.0%) | 0 (0.0%) |
| Installation, Maintenance & Repair | 2 (100.0%) | 0 (0.0%) |
| Total (Category) | 2 (100.0%) | 0 (0.0%) |
| Total (Overall) | 663 (51.4%) | 627 (48.6%) |
Production, Transportation and Moving Occupations
The most common Production, Transportation and Moving occupations in University at Buffalo are Material Moving (37 | 2.9%), and Production (7 | 0.5%).
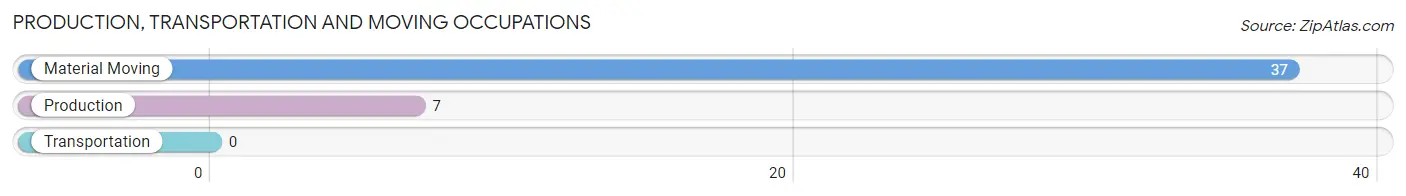
Production, Transportation and Moving Occupations by Sex
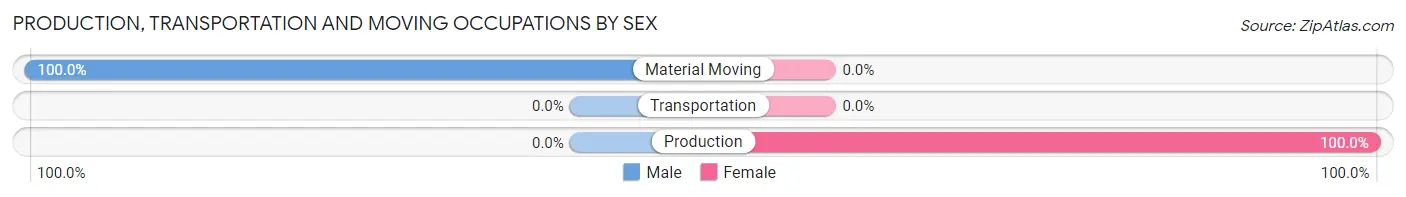
| Occupation | Male | Female |
| Production | 0 (0.0%) | 7 (100.0%) |
| Transportation | 0 (0.0%) | 0 (0.0%) |
| Material Moving | 37 (100.0%) | 0 (0.0%) |
| Total (Category) | 37 (84.1%) | 7 (15.9%) |
| Total (Overall) | 663 (51.4%) | 627 (48.6%) |
Employment Industries by Sex in University at Buffalo
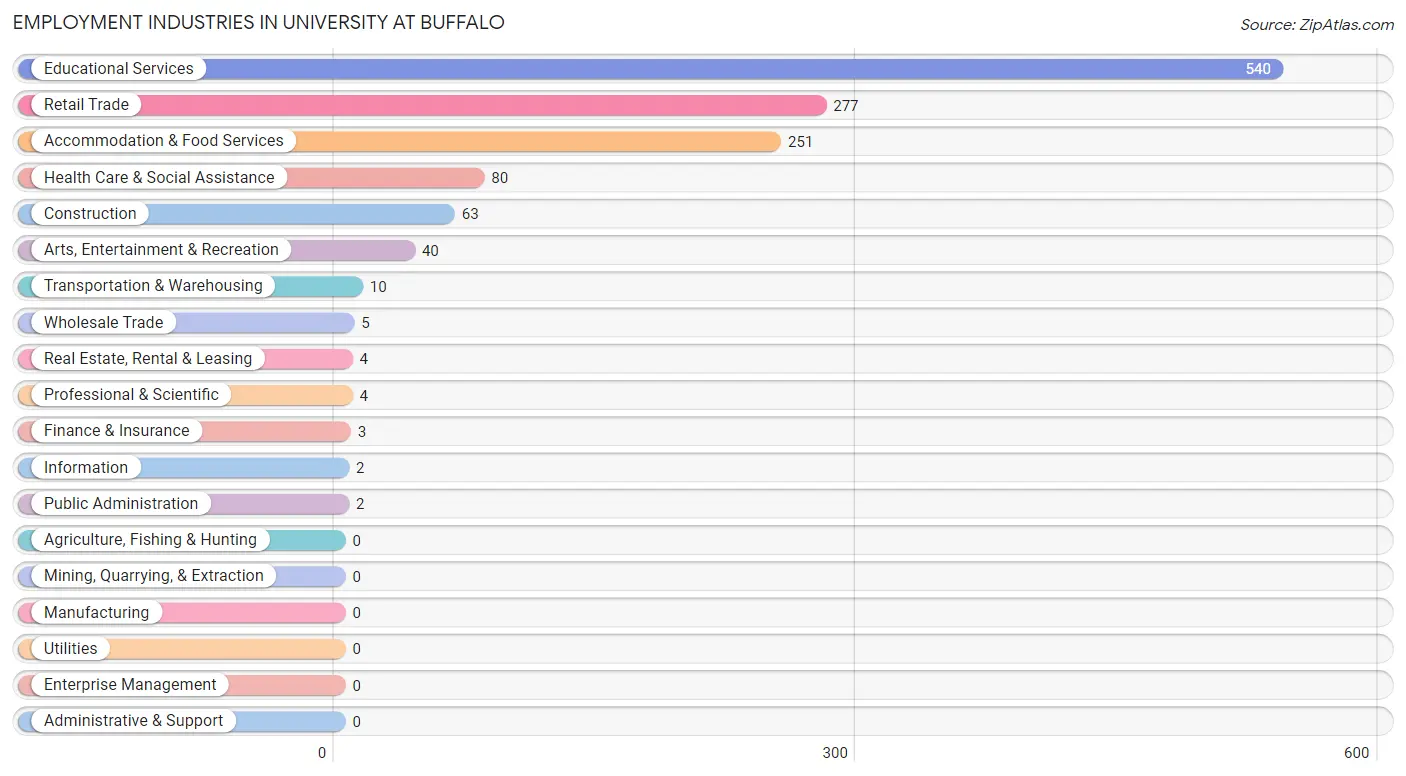
Employment Industries in University at Buffalo
The major employment industries in University at Buffalo include Educational Services (540 | 41.9%), Retail Trade (277 | 21.5%), Accommodation & Food Services (251 | 19.5%), Health Care & Social Assistance (80 | 6.2%), and Construction (63 | 4.9%).
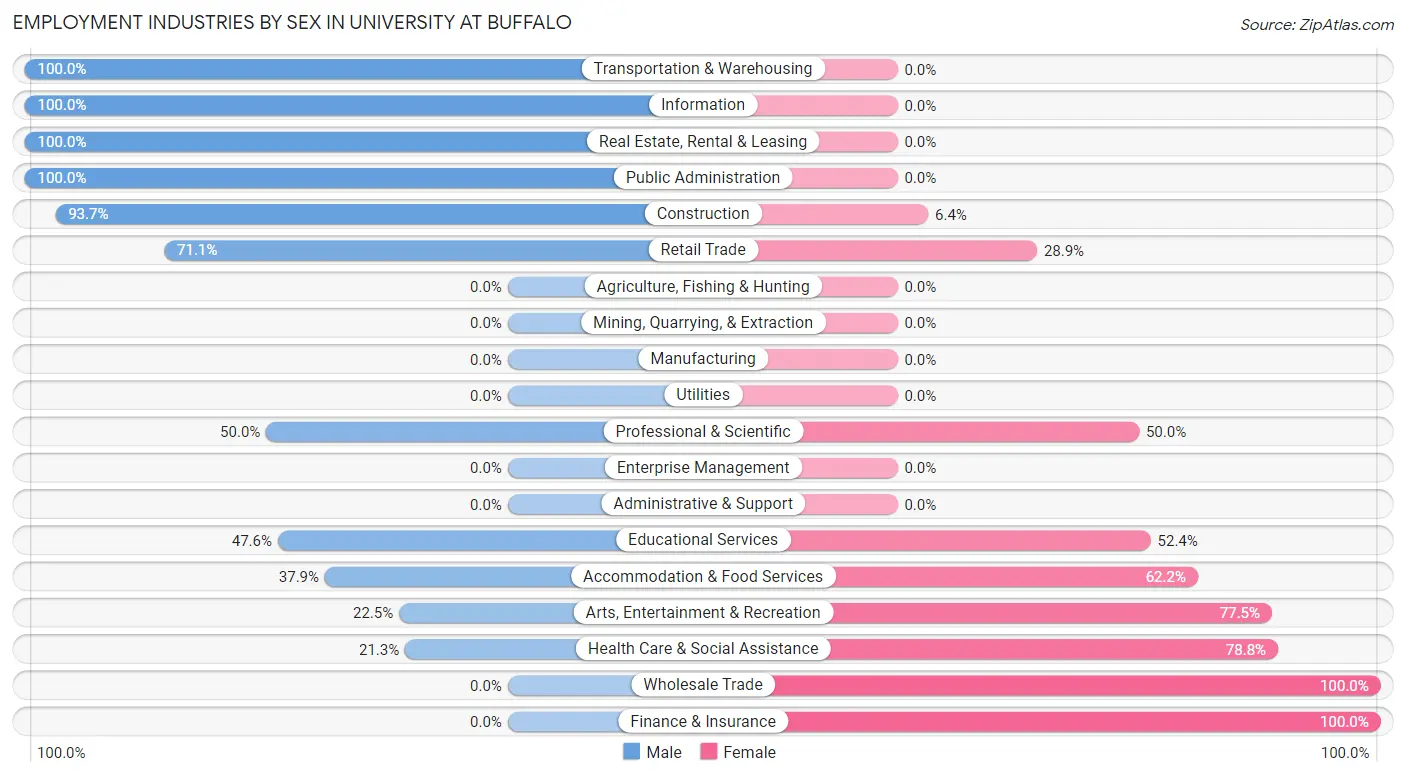
Employment Industries by Sex in University at Buffalo
The University at Buffalo industries that see more men than women are Transportation & Warehousing (100.0%), Information (100.0%), and Real Estate, Rental & Leasing (100.0%), whereas the industries that tend to have a higher number of women are Wholesale Trade (100.0%), Finance & Insurance (100.0%), and Health Care & Social Assistance (78.7%).
| Industry | Male | Female |
| Agriculture, Fishing & Hunting | 0 (0.0%) | 0 (0.0%) |
| Mining, Quarrying, & Extraction | 0 (0.0%) | 0 (0.0%) |
| Construction | 59 (93.6%) | 4 (6.4%) |
| Manufacturing | 0 (0.0%) | 0 (0.0%) |
| Wholesale Trade | 0 (0.0%) | 5 (100.0%) |
| Retail Trade | 197 (71.1%) | 80 (28.9%) |
| Transportation & Warehousing | 10 (100.0%) | 0 (0.0%) |
| Utilities | 0 (0.0%) | 0 (0.0%) |
| Information | 2 (100.0%) | 0 (0.0%) |
| Finance & Insurance | 0 (0.0%) | 3 (100.0%) |
| Real Estate, Rental & Leasing | 4 (100.0%) | 0 (0.0%) |
| Professional & Scientific | 2 (50.0%) | 2 (50.0%) |
| Enterprise Management | 0 (0.0%) | 0 (0.0%) |
| Administrative & Support | 0 (0.0%) | 0 (0.0%) |
| Educational Services | 257 (47.6%) | 283 (52.4%) |
| Health Care & Social Assistance | 17 (21.2%) | 63 (78.7%) |
| Arts, Entertainment & Recreation | 9 (22.5%) | 31 (77.5%) |
| Accommodation & Food Services | 95 (37.9%) | 156 (62.2%) |
| Public Administration | 2 (100.0%) | 0 (0.0%) |
| Total | 663 (51.4%) | 627 (48.6%) |
Education in University at Buffalo
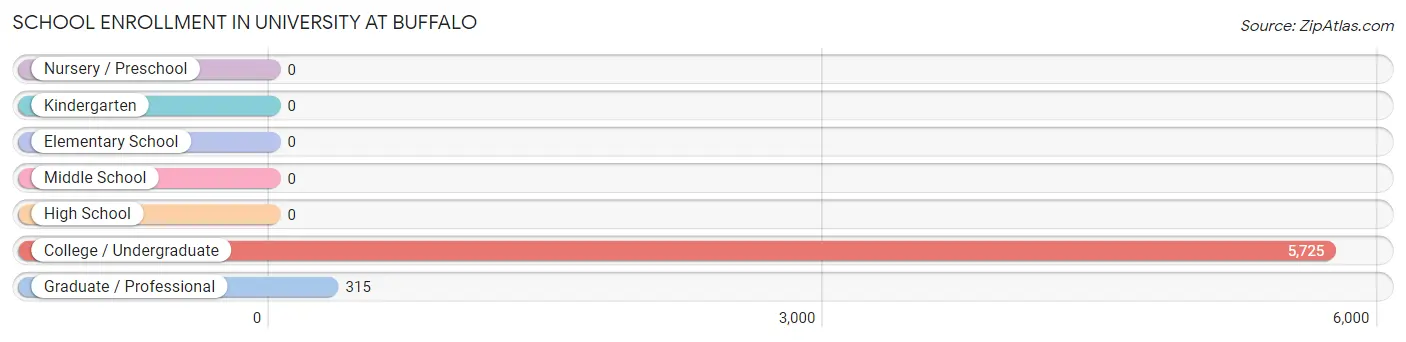
School Enrollment in University at Buffalo
The most common levels of schooling among the 6,040 students in University at Buffalo are college / undergraduate (5,725 | 94.8%), and graduate / professional (315 | 5.2%).
| School Level | # Students | % Students |
| Nursery / Preschool | 0 | 0.0% |
| Kindergarten | 0 | 0.0% |
| Elementary School | 0 | 0.0% |
| Middle School | 0 | 0.0% |
| High School | 0 | 0.0% |
| College / Undergraduate | 5,725 | 94.8% |
| Graduate / Professional | 315 | 5.2% |
| Total | 6,040 | 100.0% |
School Enrollment by Age by Funding Source in University at Buffalo
Out of a total of 6,040 students who are enrolled in schools in University at Buffalo, 332 (5.5%) attend a private institution, while the remaining 5,708 (94.5%) are enrolled in public schools. The age group of 25 to 34 year olds has the highest likelihood of being enrolled in private schools, with 14 (15.4% in the age bracket) enrolled. Conversely, the age group of 15 to 17 year olds has the lowest likelihood of being enrolled in a private school, with 256 (100.0% in the age bracket) attending a public institution.
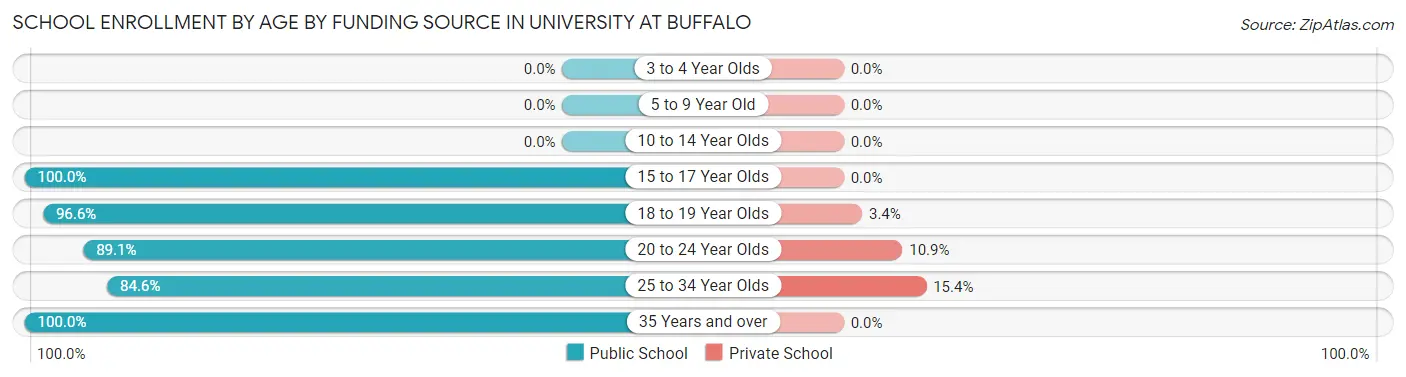
| Age Bracket | Public School | Private School |
| 3 to 4 Year Olds | 0 (0.0%) | 0 (0.0%) |
| 5 to 9 Year Old | 0 (0.0%) | 0 (0.0%) |
| 10 to 14 Year Olds | 0 (0.0%) | 0 (0.0%) |
| 15 to 17 Year Olds | 256 (100.0%) | 0 (0.0%) |
| 18 to 19 Year Olds | 3,835 (96.6%) | 136 (3.4%) |
| 20 to 24 Year Olds | 1,476 (89.1%) | 181 (10.9%) |
| 25 to 34 Year Olds | 77 (84.6%) | 14 (15.4%) |
| 35 Years and over | 65 (100.0%) | 0 (0.0%) |
| Total | 5,708 (94.5%) | 332 (5.5%) |
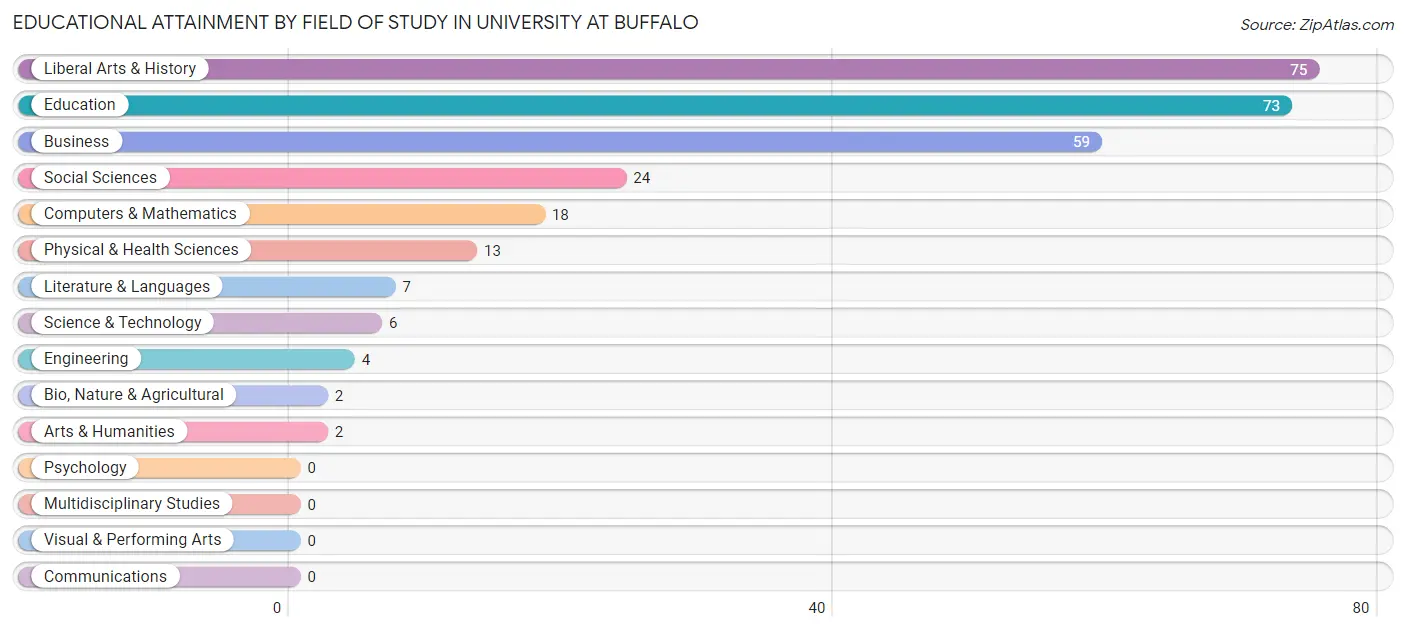
Educational Attainment by Field of Study in University at Buffalo
Liberal arts & history (75 | 26.5%), education (73 | 25.8%), business (59 | 20.8%), social sciences (24 | 8.5%), and computers & mathematics (18 | 6.4%) are the most common fields of study among 283 individuals in University at Buffalo who have obtained a bachelor's degree or higher.
| Field of Study | # Graduates | % Graduates |
| Computers & Mathematics | 18 | 6.4% |
| Bio, Nature & Agricultural | 2 | 0.7% |
| Physical & Health Sciences | 13 | 4.6% |
| Psychology | 0 | 0.0% |
| Social Sciences | 24 | 8.5% |
| Engineering | 4 | 1.4% |
| Multidisciplinary Studies | 0 | 0.0% |
| Science & Technology | 6 | 2.1% |
| Business | 59 | 20.8% |
| Education | 73 | 25.8% |
| Literature & Languages | 7 | 2.5% |
| Liberal Arts & History | 75 | 26.5% |
| Visual & Performing Arts | 0 | 0.0% |
| Communications | 0 | 0.0% |
| Arts & Humanities | 2 | 0.7% |
| Total | 283 | 100.0% |
Transportation & Commute in University at Buffalo
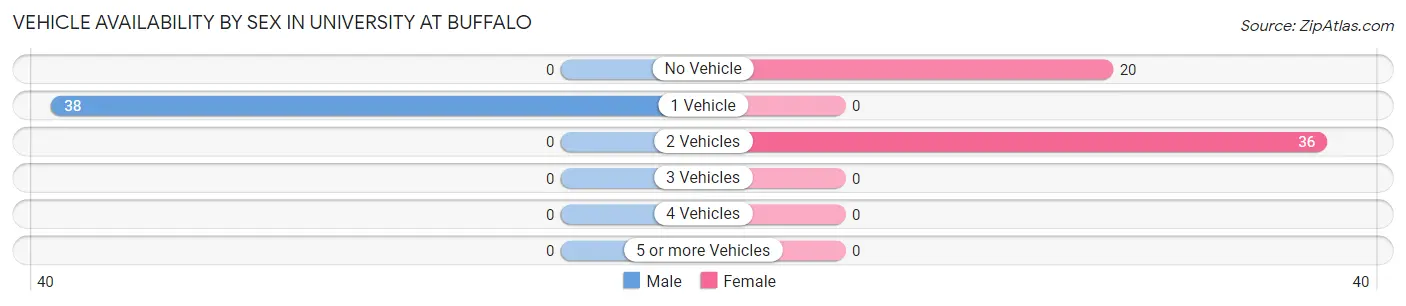
Vehicle Availability by Sex in University at Buffalo
The most prevalent vehicle ownership categories in University at Buffalo are males with 1 vehicle (38, accounting for 100.0%) and females with 1 vehicle (0, making up 67.9%).
| Vehicles Available | Male | Female |
| No Vehicle | 0 (0.0%) | 20 (35.7%) |
| 1 Vehicle | 38 (100.0%) | 0 (0.0%) |
| 2 Vehicles | 0 (0.0%) | 36 (64.3%) |
| 3 Vehicles | 0 (0.0%) | 0 (0.0%) |
| 4 Vehicles | 0 (0.0%) | 0 (0.0%) |
| 5 or more Vehicles | 0 (0.0%) | 0 (0.0%) |
| Total | 38 (100.0%) | 56 (100.0%) |
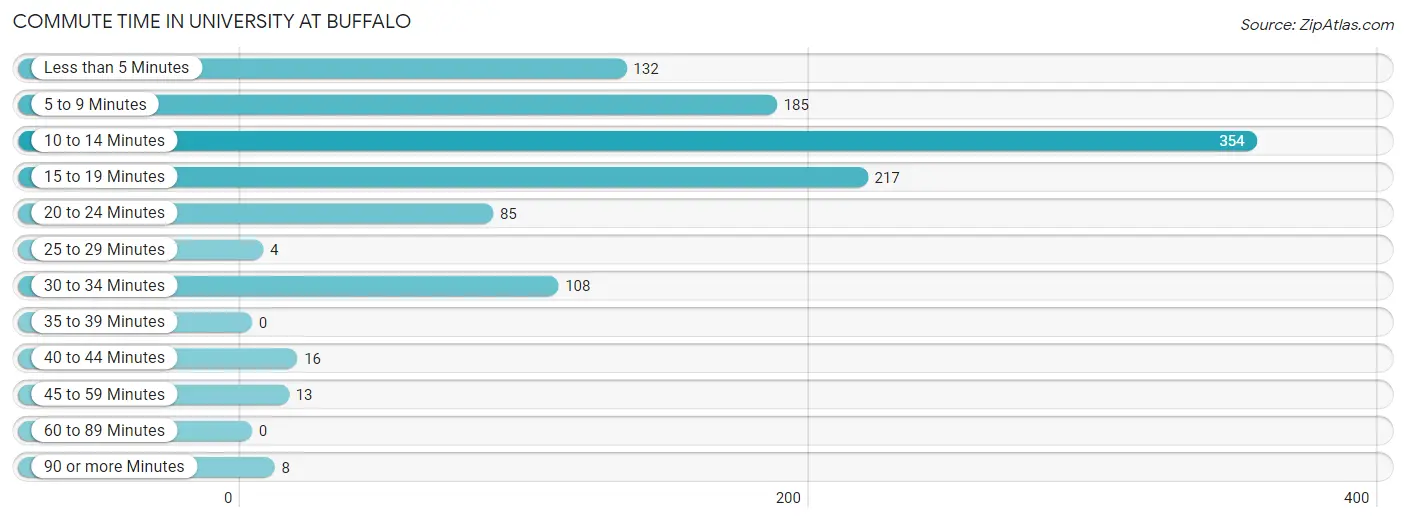
Commute Time in University at Buffalo
The most frequently occuring commute durations in University at Buffalo are 10 to 14 minutes (354 commuters, 31.6%), 15 to 19 minutes (217 commuters, 19.3%), and 5 to 9 minutes (185 commuters, 16.5%).
| Commute Time | # Commuters | % Commuters |
| Less than 5 Minutes | 132 | 11.8% |
| 5 to 9 Minutes | 185 | 16.5% |
| 10 to 14 Minutes | 354 | 31.6% |
| 15 to 19 Minutes | 217 | 19.3% |
| 20 to 24 Minutes | 85 | 7.6% |
| 25 to 29 Minutes | 4 | 0.4% |
| 30 to 34 Minutes | 108 | 9.6% |
| 35 to 39 Minutes | 0 | 0.0% |
| 40 to 44 Minutes | 16 | 1.4% |
| 45 to 59 Minutes | 13 | 1.2% |
| 60 to 89 Minutes | 0 | 0.0% |
| 90 or more Minutes | 8 | 0.7% |
Commute Time by Sex in University at Buffalo
The most common commute times in University at Buffalo are 10 to 14 minutes (160 commuters, 28.8%) for males and 10 to 14 minutes (194 commuters, 34.3%) for females.
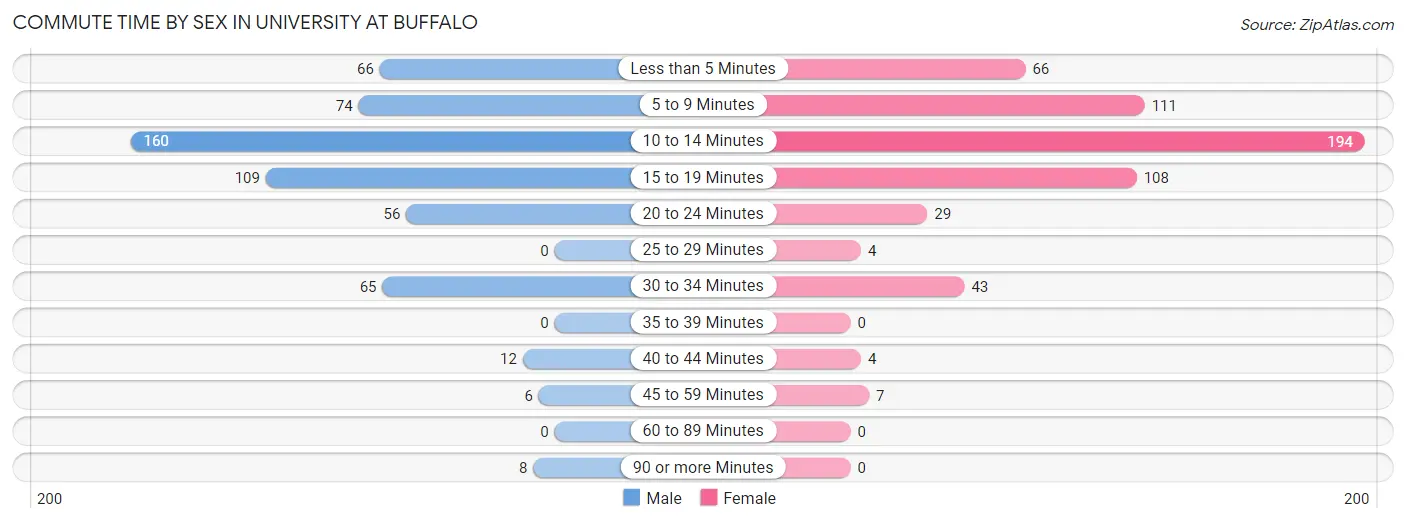
| Commute Time | Male | Female |
| Less than 5 Minutes | 66 (11.9%) | 66 (11.7%) |
| 5 to 9 Minutes | 74 (13.3%) | 111 (19.6%) |
| 10 to 14 Minutes | 160 (28.8%) | 194 (34.3%) |
| 15 to 19 Minutes | 109 (19.6%) | 108 (19.1%) |
| 20 to 24 Minutes | 56 (10.1%) | 29 (5.1%) |
| 25 to 29 Minutes | 0 (0.0%) | 4 (0.7%) |
| 30 to 34 Minutes | 65 (11.7%) | 43 (7.6%) |
| 35 to 39 Minutes | 0 (0.0%) | 0 (0.0%) |
| 40 to 44 Minutes | 12 (2.2%) | 4 (0.7%) |
| 45 to 59 Minutes | 6 (1.1%) | 7 (1.2%) |
| 60 to 89 Minutes | 0 (0.0%) | 0 (0.0%) |
| 90 or more Minutes | 8 (1.4%) | 0 (0.0%) |
Time of Departure to Work by Sex in University at Buffalo
The most frequent times of departure to work in University at Buffalo are 12:00 PM to 3:59 PM (172, 30.9%) for males and 12:00 PM to 3:59 PM (164, 29.0%) for females.
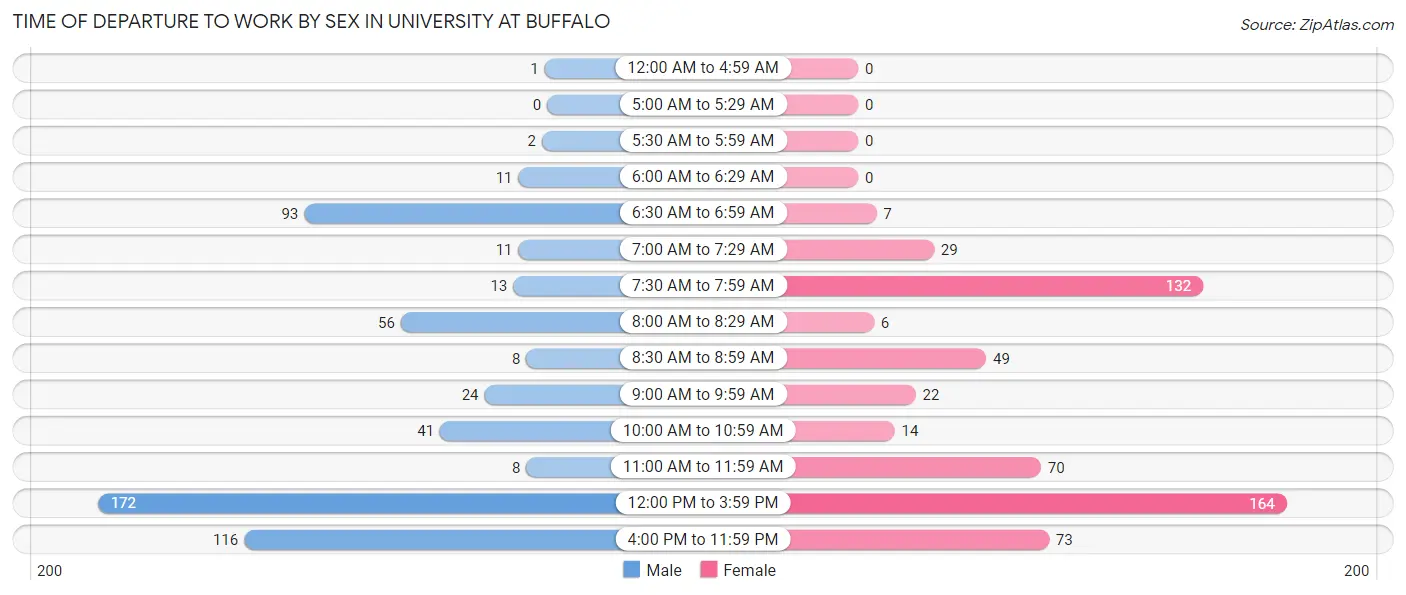
| Time of Departure | Male | Female |
| 12:00 AM to 4:59 AM | 1 (0.2%) | 0 (0.0%) |
| 5:00 AM to 5:29 AM | 0 (0.0%) | 0 (0.0%) |
| 5:30 AM to 5:59 AM | 2 (0.4%) | 0 (0.0%) |
| 6:00 AM to 6:29 AM | 11 (2.0%) | 0 (0.0%) |
| 6:30 AM to 6:59 AM | 93 (16.7%) | 7 (1.2%) |
| 7:00 AM to 7:29 AM | 11 (2.0%) | 29 (5.1%) |
| 7:30 AM to 7:59 AM | 13 (2.3%) | 132 (23.3%) |
| 8:00 AM to 8:29 AM | 56 (10.1%) | 6 (1.1%) |
| 8:30 AM to 8:59 AM | 8 (1.4%) | 49 (8.7%) |
| 9:00 AM to 9:59 AM | 24 (4.3%) | 22 (3.9%) |
| 10:00 AM to 10:59 AM | 41 (7.4%) | 14 (2.5%) |
| 11:00 AM to 11:59 AM | 8 (1.4%) | 70 (12.4%) |
| 12:00 PM to 3:59 PM | 172 (30.9%) | 164 (29.0%) |
| 4:00 PM to 11:59 PM | 116 (20.9%) | 73 (12.9%) |
| Total | 556 (100.0%) | 566 (100.0%) |
Housing Occupancy in University at Buffalo
Occupancy by Ownership in University at Buffalo
Of the total 173 dwellings in University at Buffalo, owner-occupied units account for 0 (0.0%), while renter-occupied units make up 173 (100.0%).
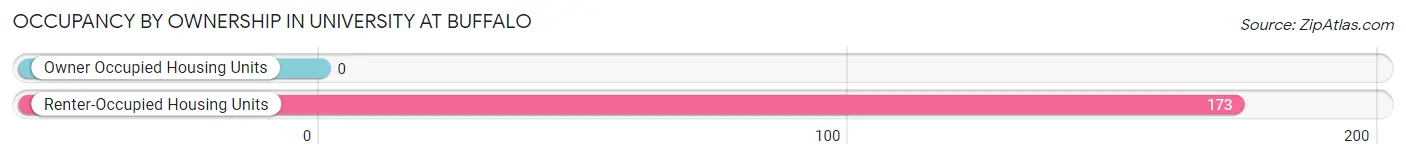
| Occupancy | # Housing Units | % Housing Units |
| Owner Occupied Housing Units | 0 | 0.0% |
| Renter-Occupied Housing Units | 173 | 100.0% |
| Total Occupied Housing Units | 173 | 100.0% |
Occupancy by Household Size in University at Buffalo
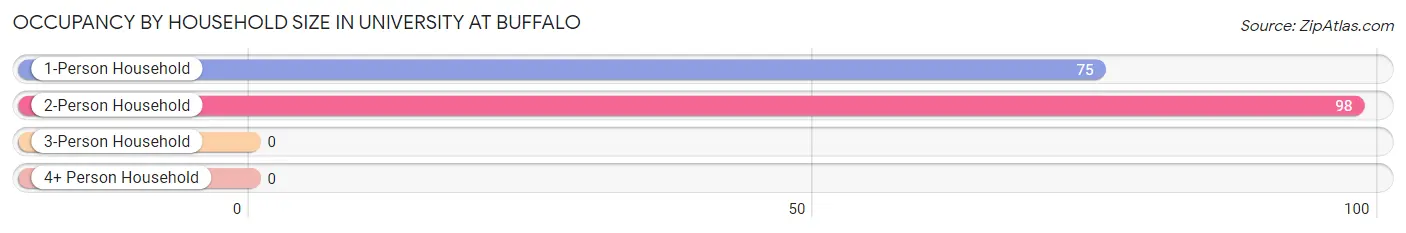
| Household Size | # Housing Units | % Housing Units |
| 1-Person Household | 75 | 43.3% |
| 2-Person Household | 98 | 56.7% |
| 3-Person Household | 0 | 0.0% |
| 4+ Person Household | 0 | 0.0% |
| Total Housing Units | 173 | 100.0% |
Occupancy by Ownership by Household Size in University at Buffalo
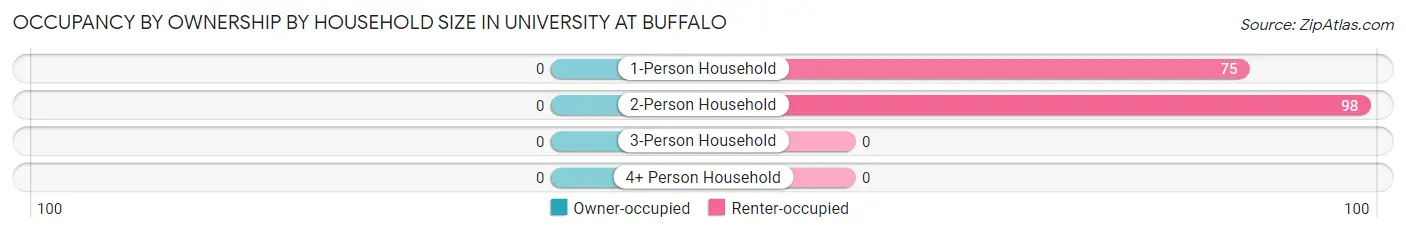
| Household Size | Owner-occupied | Renter-occupied |
| 1-Person Household | 0 (0.0%) | 75 (100.0%) |
| 2-Person Household | 0 (0.0%) | 98 (100.0%) |
| 3-Person Household | 0 (0.0%) | 0 (0.0%) |
| 4+ Person Household | 0 (0.0%) | 0 (0.0%) |
| Total Housing Units | 0 (0.0%) | 173 (100.0%) |
Occupancy by Educational Attainment in University at Buffalo
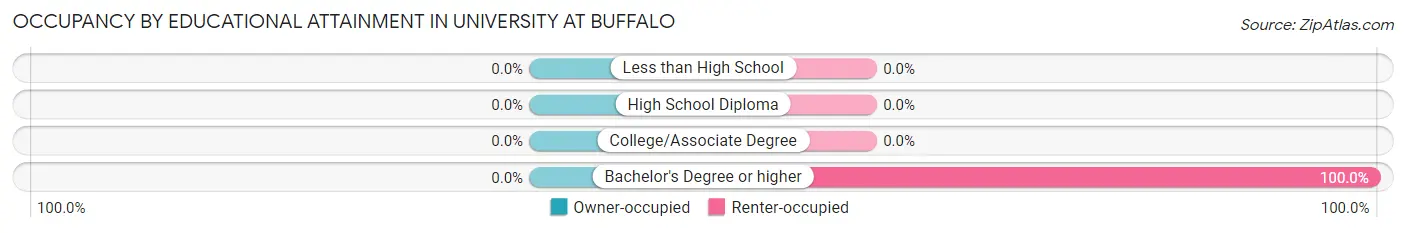
| Household Size | Owner-occupied | Renter-occupied |
| Less than High School | 0 (0.0%) | 0 (0.0%) |
| High School Diploma | 0 (0.0%) | 0 (0.0%) |
| College/Associate Degree | 0 (0.0%) | 0 (0.0%) |
| Bachelor's Degree or higher | 0 (0.0%) | 173 (100.0%) |
Occupancy by Age of Householder in University at Buffalo
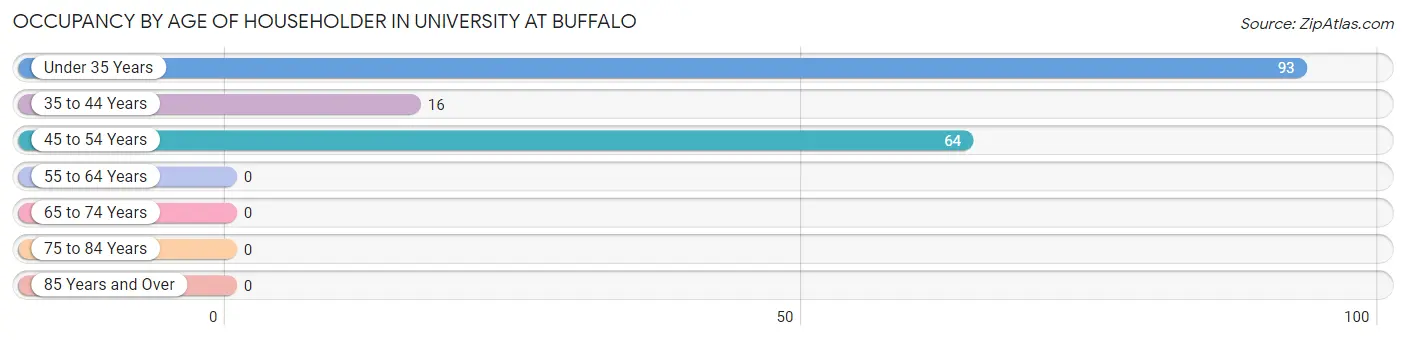
| Age Bracket | # Households | % Households |
| Under 35 Years | 93 | 53.8% |
| 35 to 44 Years | 16 | 9.2% |
| 45 to 54 Years | 64 | 37.0% |
| 55 to 64 Years | 0 | 0.0% |
| 65 to 74 Years | 0 | 0.0% |
| 75 to 84 Years | 0 | 0.0% |
| 85 Years and Over | 0 | 0.0% |
| Total | 173 | 100.0% |
Housing Finances in University at Buffalo
Median Income by Occupancy in University at Buffalo
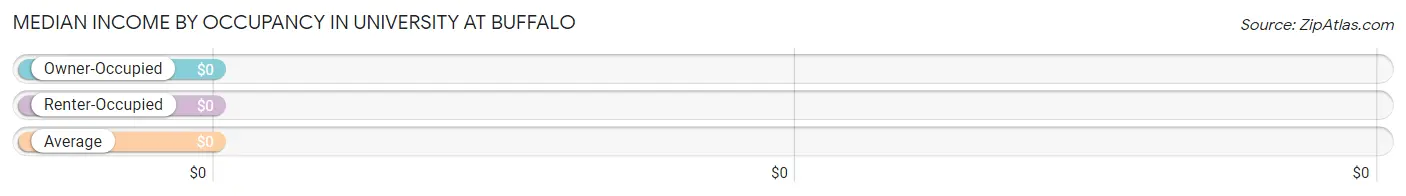
| Occupancy Type | # Households | Median Income |
| Owner-Occupied | 0 (0.0%) | $0 |
| Renter-Occupied | 173 (100.0%) | $0 |
| Average | 173 (100.0%) | $0 |
Occupancy by Householder Income Bracket in University at Buffalo
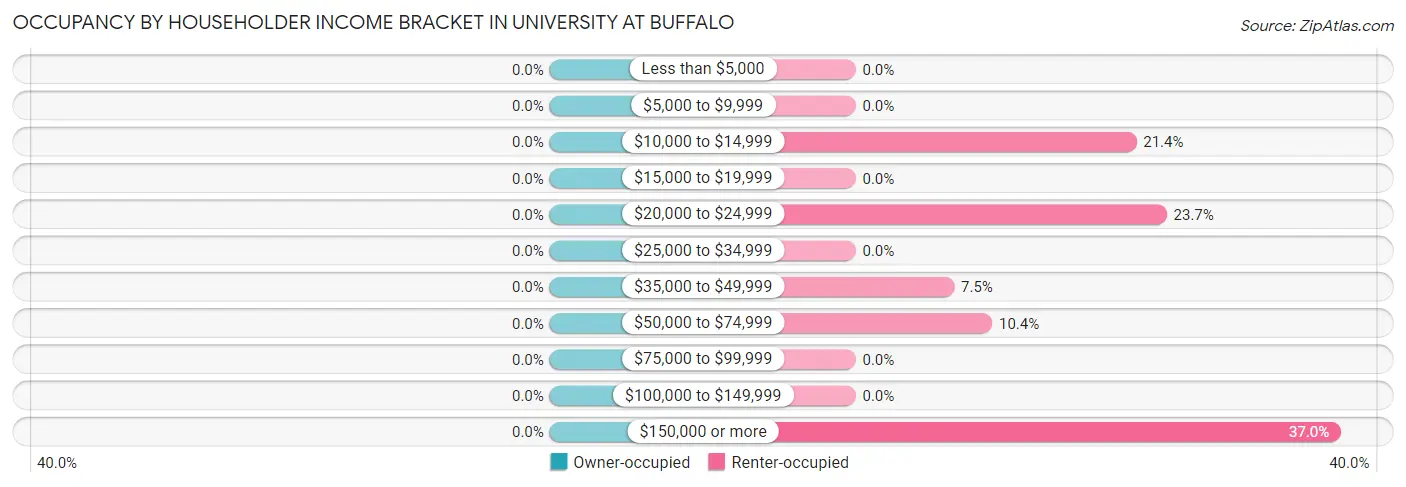
| Income Bracket | Owner-occupied | Renter-occupied |
| Less than $5,000 | 0 (0.0%) | 0 (0.0%) |
| $5,000 to $9,999 | 0 (0.0%) | 0 (0.0%) |
| $10,000 to $14,999 | 0 (0.0%) | 37 (21.4%) |
| $15,000 to $19,999 | 0 (0.0%) | 0 (0.0%) |
| $20,000 to $24,999 | 0 (0.0%) | 41 (23.7%) |
| $25,000 to $34,999 | 0 (0.0%) | 0 (0.0%) |
| $35,000 to $49,999 | 0 (0.0%) | 13 (7.5%) |
| $50,000 to $74,999 | 0 (0.0%) | 18 (10.4%) |
| $75,000 to $99,999 | 0 (0.0%) | 0 (0.0%) |
| $100,000 to $149,999 | 0 (0.0%) | 0 (0.0%) |
| $150,000 or more | 0 (0.0%) | 64 (37.0%) |
| Total | 0 (0.0%) | 173 (100.0%) |
Monthly Housing Cost Tiers in University at Buffalo
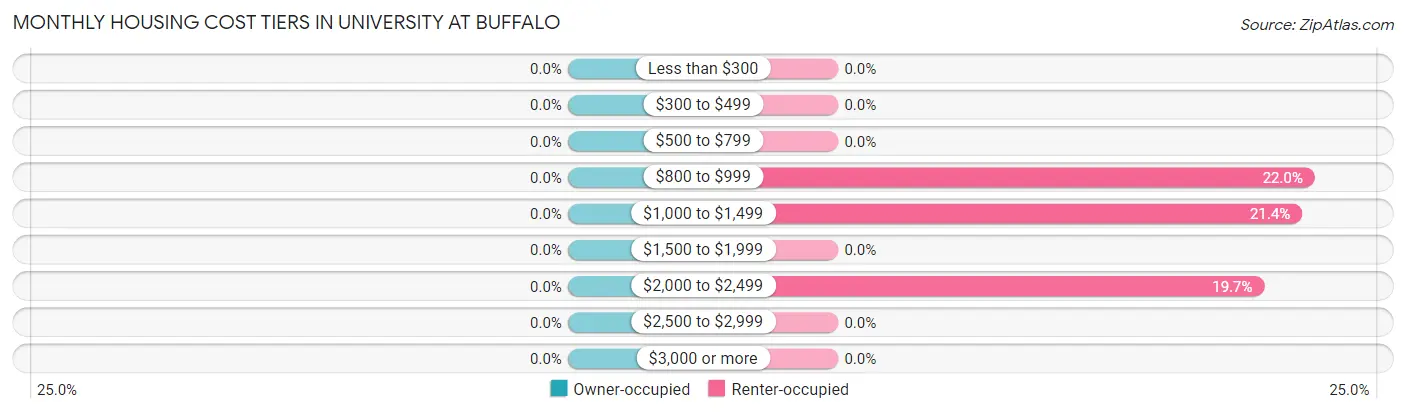
| Monthly Cost | Owner-occupied | Renter-occupied |
| Less than $300 | 0 (0.0%) | 0 (0.0%) |
| $300 to $499 | 0 (0.0%) | 0 (0.0%) |
| $500 to $799 | 0 (0.0%) | 0 (0.0%) |
| $800 to $999 | 0 (0.0%) | 38 (22.0%) |
| $1,000 to $1,499 | 0 (0.0%) | 37 (21.4%) |
| $1,500 to $1,999 | 0 (0.0%) | 0 (0.0%) |
| $2,000 to $2,499 | 0 (0.0%) | 34 (19.7%) |
| $2,500 to $2,999 | 0 (0.0%) | 0 (0.0%) |
| $3,000 or more | 0 (0.0%) | 0 (0.0%) |
| Total | 0 (0.0%) | 173 (100.0%) |
Physical Housing Characteristics in University at Buffalo
Housing Structures in University at Buffalo
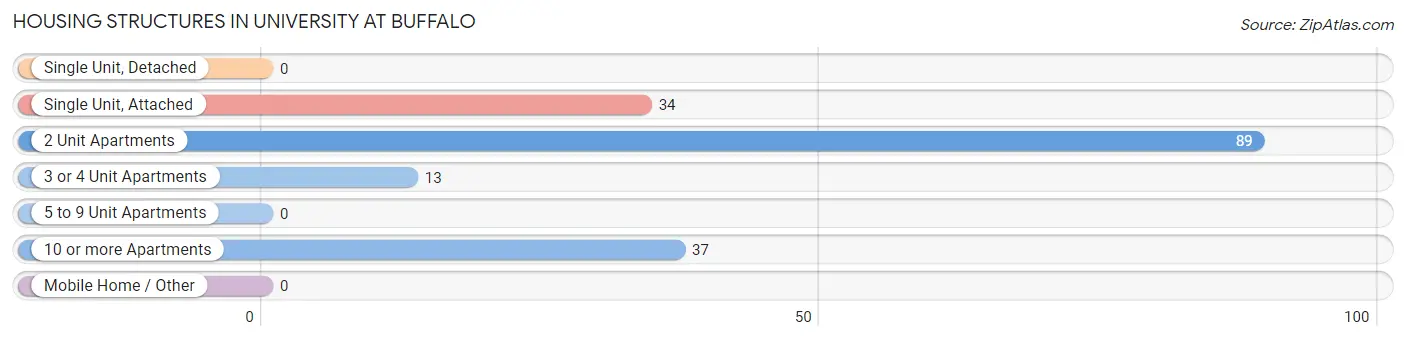
| Structure Type | # Housing Units | % Housing Units |
| Single Unit, Detached | 0 | 0.0% |
| Single Unit, Attached | 34 | 19.7% |
| 2 Unit Apartments | 89 | 51.4% |
| 3 or 4 Unit Apartments | 13 | 7.5% |
| 5 to 9 Unit Apartments | 0 | 0.0% |
| 10 or more Apartments | 37 | 21.4% |
| Mobile Home / Other | 0 | 0.0% |
| Total | 173 | 100.0% |
Housing Structures by Occupancy in University at Buffalo
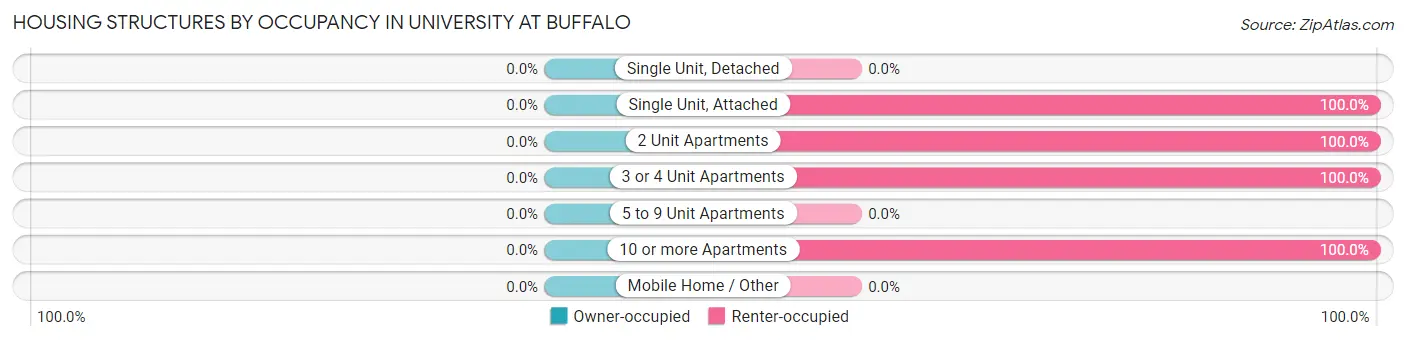
| Structure Type | Owner-occupied | Renter-occupied |
| Single Unit, Detached | 0 (0.0%) | 0 (0.0%) |
| Single Unit, Attached | 0 (0.0%) | 34 (100.0%) |
| 2 Unit Apartments | 0 (0.0%) | 89 (100.0%) |
| 3 or 4 Unit Apartments | 0 (0.0%) | 13 (100.0%) |
| 5 to 9 Unit Apartments | 0 (0.0%) | 0 (0.0%) |
| 10 or more Apartments | 0 (0.0%) | 37 (100.0%) |
| Mobile Home / Other | 0 (0.0%) | 0 (0.0%) |
| Total | 0 (0.0%) | 173 (100.0%) |
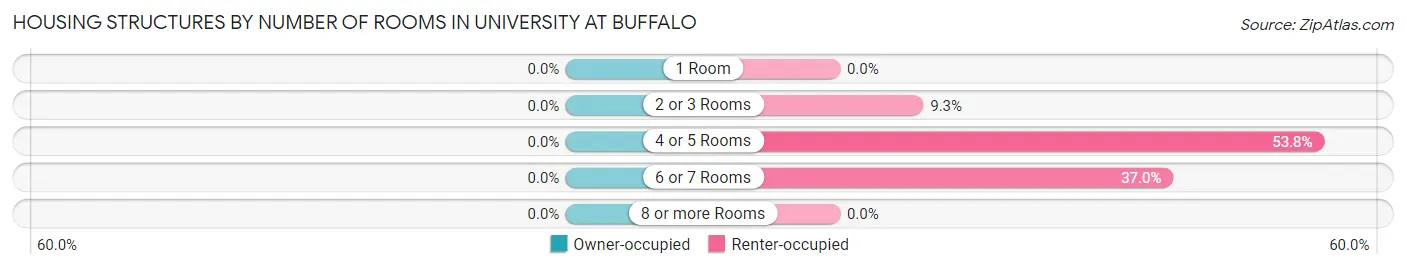
Housing Structures by Number of Rooms in University at Buffalo
| Number of Rooms | Owner-occupied | Renter-occupied |
| 1 Room | 0 (0.0%) | 0 (0.0%) |
| 2 or 3 Rooms | 0 (0.0%) | 16 (9.2%) |
| 4 or 5 Rooms | 0 (0.0%) | 93 (53.8%) |
| 6 or 7 Rooms | 0 (0.0%) | 64 (37.0%) |
| 8 or more Rooms | 0 (0.0%) | 0 (0.0%) |
| Total | 0 (0.0%) | 173 (100.0%) |
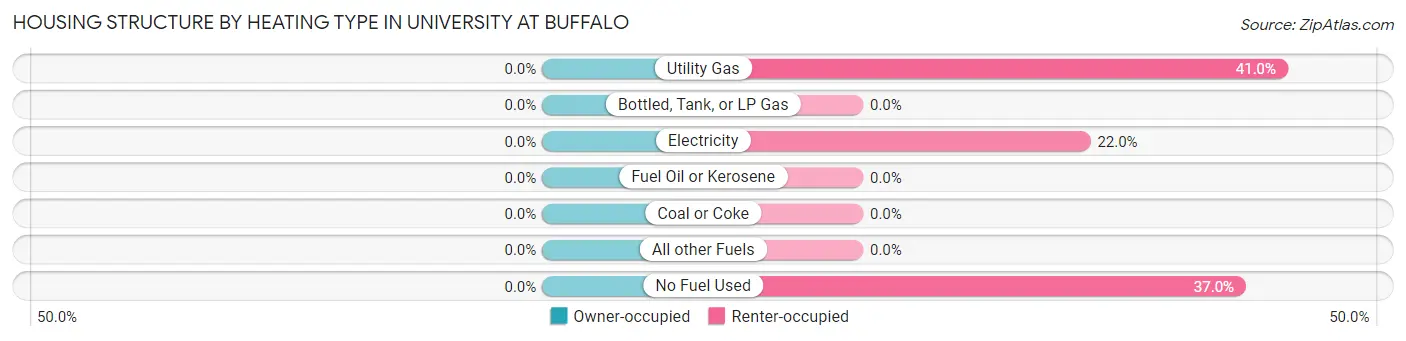
Housing Structure by Heating Type in University at Buffalo
| Heating Type | Owner-occupied | Renter-occupied |
| Utility Gas | 0 (0.0%) | 71 (41.0%) |
| Bottled, Tank, or LP Gas | 0 (0.0%) | 0 (0.0%) |
| Electricity | 0 (0.0%) | 38 (22.0%) |
| Fuel Oil or Kerosene | 0 (0.0%) | 0 (0.0%) |
| Coal or Coke | 0 (0.0%) | 0 (0.0%) |
| All other Fuels | 0 (0.0%) | 0 (0.0%) |
| No Fuel Used | 0 (0.0%) | 64 (37.0%) |
| Total | 0 (0.0%) | 173 (100.0%) |
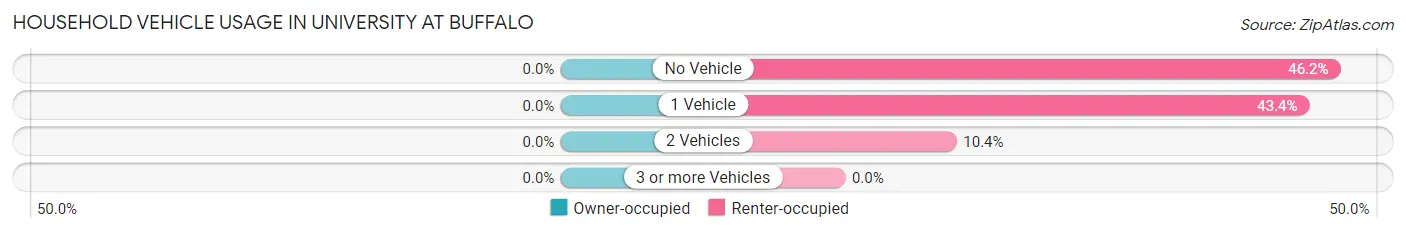
Household Vehicle Usage in University at Buffalo
| Vehicles per Household | Owner-occupied | Renter-occupied |
| No Vehicle | 0 (0.0%) | 80 (46.2%) |
| 1 Vehicle | 0 (0.0%) | 75 (43.3%) |
| 2 Vehicles | 0 (0.0%) | 18 (10.4%) |
| 3 or more Vehicles | 0 (0.0%) | 0 (0.0%) |
| Total | 0 (0.0%) | 173 (100.0%) |
Real Estate & Mortgages in University at Buffalo
Real Estate and Mortgage Overview in University at Buffalo
| Characteristic | Without Mortgage | With Mortgage |
| Housing Units | 0 | 0 |
| Median Property Value | - | - |
| Median Household Income | - | - |
| Monthly Housing Costs | - | - |
| Real Estate Taxes | - | - |
Property Value by Mortgage Status in University at Buffalo
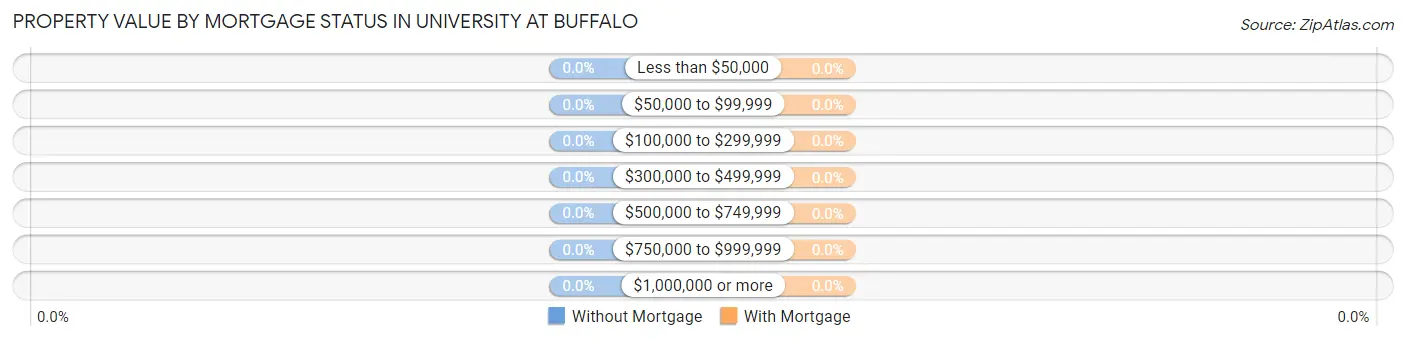
| Property Value | Without Mortgage | With Mortgage |
| Less than $50,000 | 0 (0.0%) | 0 (0.0%) |
| $50,000 to $99,999 | 0 (0.0%) | 0 (0.0%) |
| $100,000 to $299,999 | 0 (0.0%) | 0 (0.0%) |
| $300,000 to $499,999 | 0 (0.0%) | 0 (0.0%) |
| $500,000 to $749,999 | 0 (0.0%) | 0 (0.0%) |
| $750,000 to $999,999 | 0 (0.0%) | 0 (0.0%) |
| $1,000,000 or more | 0 (0.0%) | 0 (0.0%) |
| Total | 0 (0.0%) | 0 (0.0%) |
Household Income by Mortgage Status in University at Buffalo
| Household Income | Without Mortgage | With Mortgage |
| Less than $10,000 | 0 (0.0%) | 0 (0.0%) |
| $10,000 to $24,999 | 0 (0.0%) | 0 (0.0%) |
| $25,000 to $34,999 | 0 (0.0%) | 0 (0.0%) |
| $35,000 to $49,999 | 0 (0.0%) | 0 (0.0%) |
| $50,000 to $74,999 | 0 (0.0%) | 0 (0.0%) |
| $75,000 to $99,999 | 0 (0.0%) | 0 (0.0%) |
| $100,000 to $149,999 | 0 (0.0%) | 0 (0.0%) |
| $150,000 or more | 0 (0.0%) | 0 (0.0%) |
| Total | 0 (0.0%) | 0 (0.0%) |
Property Value to Household Income Ratio in University at Buffalo
| Value-to-Income Ratio | Without Mortgage | With Mortgage |
| Less than 2.0x | 0 (0.0%) | 0 (0.0%) |
| 2.0x to 2.9x | 0 (0.0%) | 0 (0.0%) |
| 3.0x to 3.9x | 0 (0.0%) | 0 (0.0%) |
| 4.0x or more | 0 (0.0%) | 0 (0.0%) |
| Total | 0 (0.0%) | 0 (0.0%) |
Real Estate Taxes by Mortgage Status in University at Buffalo
| Property Taxes | Without Mortgage | With Mortgage |
| Less than $800 | 0 (0.0%) | 0 (0.0%) |
| $800 to $1,499 | 0 (0.0%) | 0 (0.0%) |
| $800 to $1,499 | 0 (0.0%) | 0 (0.0%) |
| Total | 0 (0.0%) | 0 (0.0%) |
Health & Disability in University at Buffalo
Health Insurance Coverage by Age in University at Buffalo
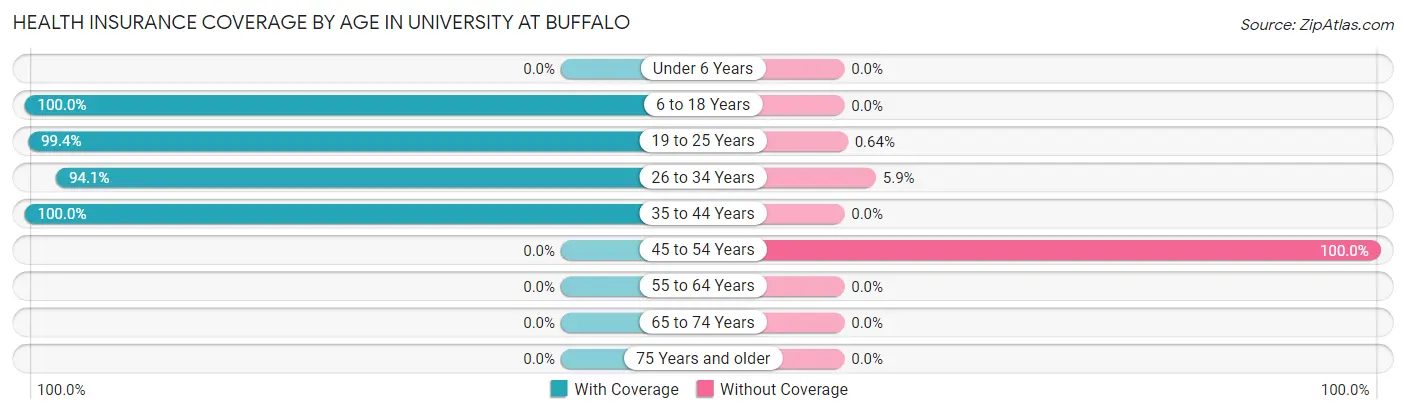
| Age Bracket | With Coverage | Without Coverage |
| Under 6 Years | 0 (0.0%) | 0 (0.0%) |
| 6 to 18 Years | 2,624 (100.0%) | 0 (0.0%) |
| 19 to 25 Years | 3,270 (99.4%) | 21 (0.6%) |
| 26 to 34 Years | 112 (94.1%) | 7 (5.9%) |
| 35 to 44 Years | 17 (100.0%) | 0 (0.0%) |
| 45 to 54 Years | 0 (0.0%) | 137 (100.0%) |
| 55 to 64 Years | 0 (0.0%) | 0 (0.0%) |
| 65 to 74 Years | 0 (0.0%) | 0 (0.0%) |
| 75 Years and older | 0 (0.0%) | 0 (0.0%) |
| Total | 6,023 (97.3%) | 165 (2.7%) |
Health Insurance Coverage by Citizenship Status in University at Buffalo
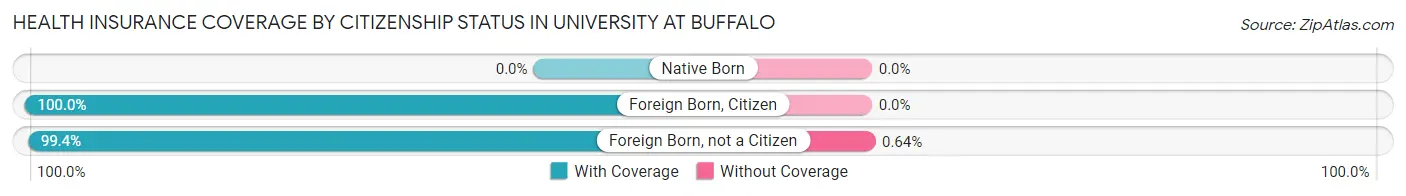
| Citizenship Status | With Coverage | Without Coverage |
| Native Born | 0 (0.0%) | 0 (0.0%) |
| Foreign Born, Citizen | 2,624 (100.0%) | 0 (0.0%) |
| Foreign Born, not a Citizen | 3,270 (99.4%) | 21 (0.6%) |
Health Insurance Coverage by Household Income in University at Buffalo
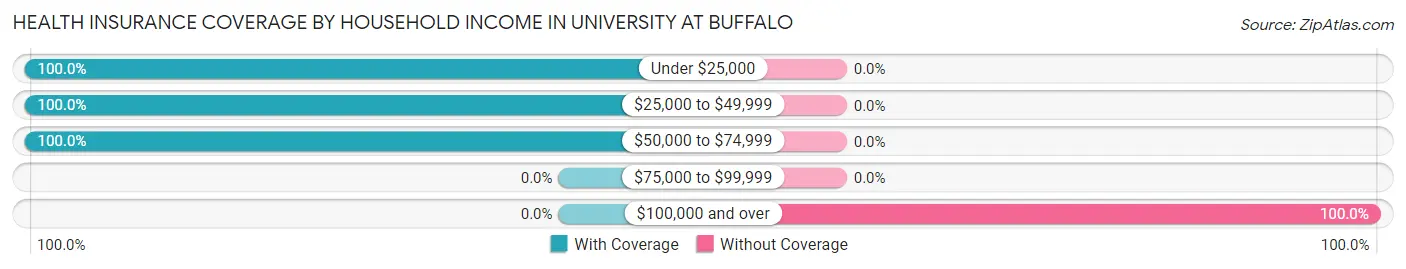
| Household Income | With Coverage | Without Coverage |
| Under $25,000 | 98 (100.0%) | 0 (0.0%) |
| $25,000 to $49,999 | 13 (100.0%) | 0 (0.0%) |
| $50,000 to $74,999 | 36 (100.0%) | 0 (0.0%) |
| $75,000 to $99,999 | 0 (0.0%) | 0 (0.0%) |
| $100,000 and over | 0 (0.0%) | 137 (100.0%) |
Public vs Private Health Insurance Coverage by Age in University at Buffalo
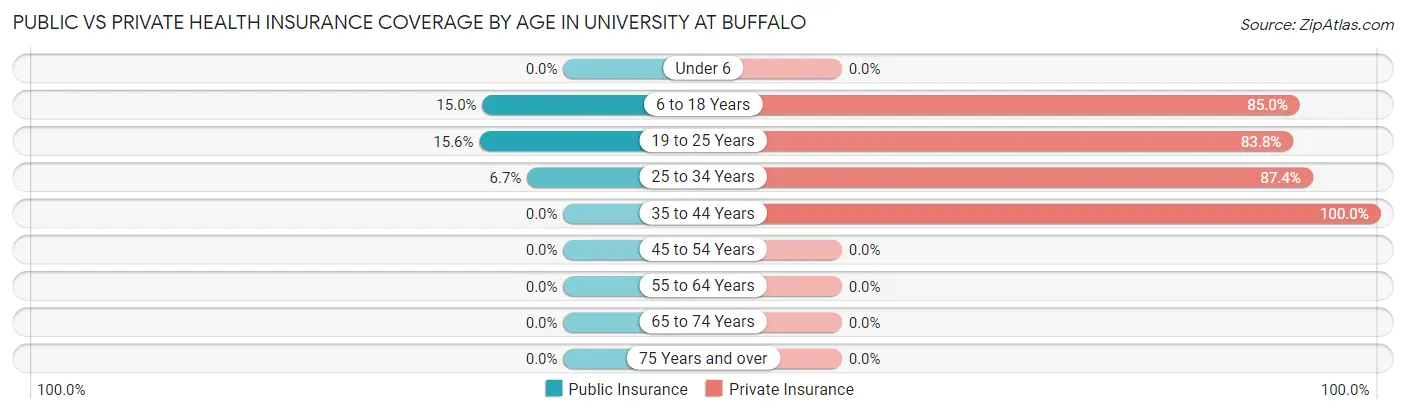
| Age Bracket | Public Insurance | Private Insurance |
| Under 6 | 0 (0.0%) | 0 (0.0%) |
| 6 to 18 Years | 394 (15.0%) | 2,230 (85.0%) |
| 19 to 25 Years | 513 (15.6%) | 2,757 (83.8%) |
| 25 to 34 Years | 8 (6.7%) | 104 (87.4%) |
| 35 to 44 Years | 0 (0.0%) | 17 (100.0%) |
| 45 to 54 Years | 0 (0.0%) | 0 (0.0%) |
| 55 to 64 Years | 0 (0.0%) | 0 (0.0%) |
| 65 to 74 Years | 0 (0.0%) | 0 (0.0%) |
| 75 Years and over | 0 (0.0%) | 0 (0.0%) |
| Total | 915 (14.8%) | 5,108 (82.6%) |
Disability Status by Sex by Age in University at Buffalo
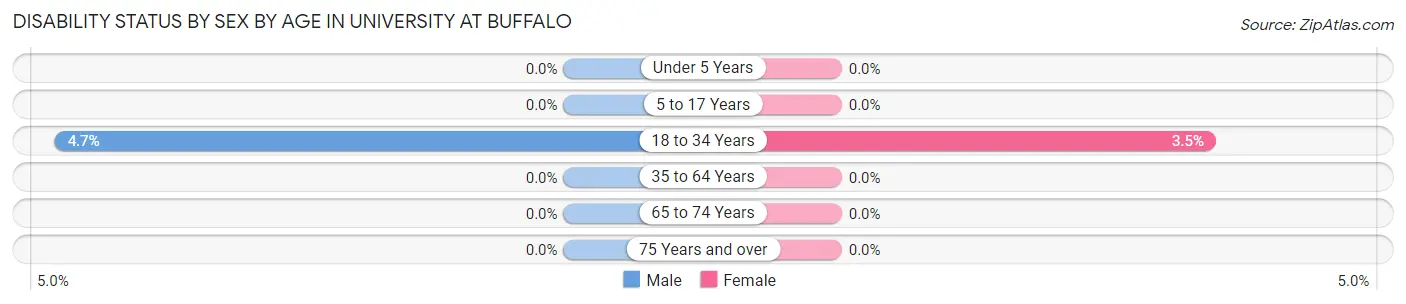
| Age Bracket | Male | Female |
| Under 5 Years | 0 (0.0%) | 0 (0.0%) |
| 5 to 17 Years | 0 (0.0%) | 0 (0.0%) |
| 18 to 34 Years | 145 (4.7%) | 94 (3.5%) |
| 35 to 64 Years | 0 (0.0%) | 0 (0.0%) |
| 65 to 74 Years | 0 (0.0%) | 0 (0.0%) |
| 75 Years and over | 0 (0.0%) | 0 (0.0%) |
Disability Class by Sex by Age in University at Buffalo
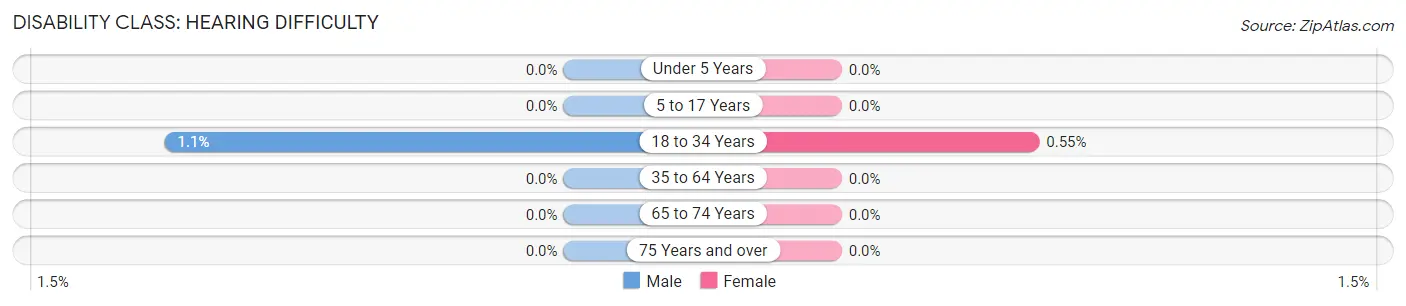
Disability Class: Hearing Difficulty
| Age Bracket | Male | Female |
| Under 5 Years | 0 (0.0%) | 0 (0.0%) |
| 5 to 17 Years | 0 (0.0%) | 0 (0.0%) |
| 18 to 34 Years | 34 (1.1%) | 15 (0.5%) |
| 35 to 64 Years | 0 (0.0%) | 0 (0.0%) |
| 65 to 74 Years | 0 (0.0%) | 0 (0.0%) |
| 75 Years and over | 0 (0.0%) | 0 (0.0%) |
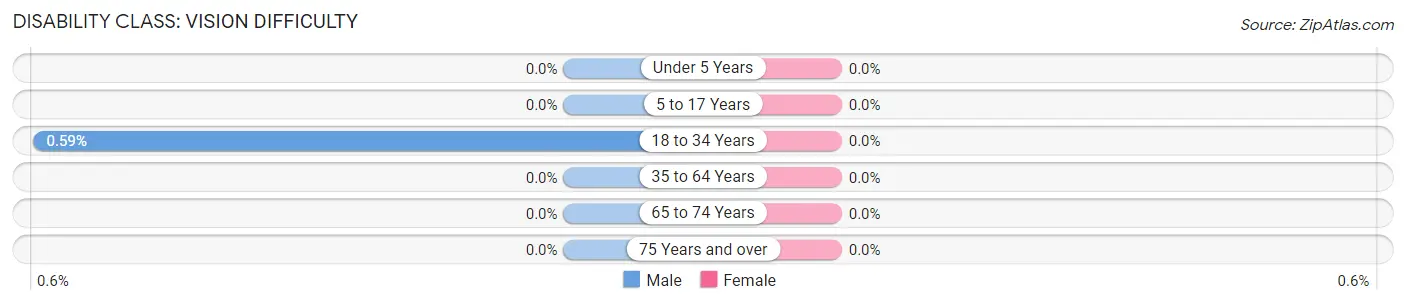
Disability Class: Vision Difficulty
| Age Bracket | Male | Female |
| Under 5 Years | 0 (0.0%) | 0 (0.0%) |
| 5 to 17 Years | 0 (0.0%) | 0 (0.0%) |
| 18 to 34 Years | 18 (0.6%) | 0 (0.0%) |
| 35 to 64 Years | 0 (0.0%) | 0 (0.0%) |
| 65 to 74 Years | 0 (0.0%) | 0 (0.0%) |
| 75 Years and over | 0 (0.0%) | 0 (0.0%) |
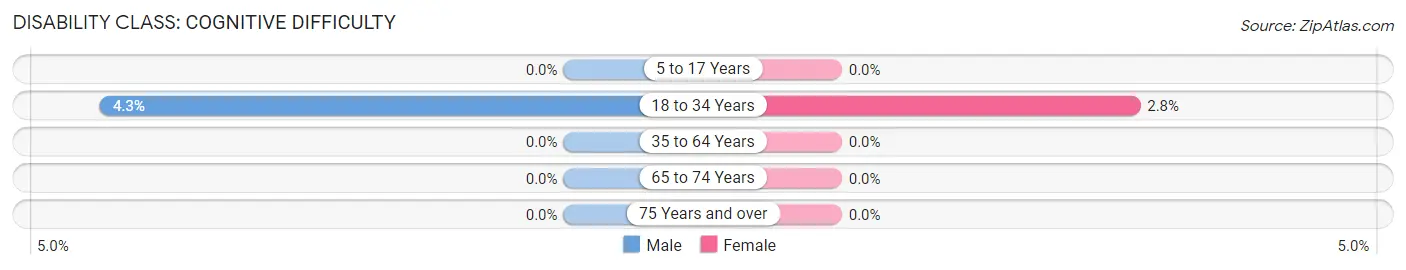
Disability Class: Cognitive Difficulty
| Age Bracket | Male | Female |
| 5 to 17 Years | 0 (0.0%) | 0 (0.0%) |
| 18 to 34 Years | 132 (4.3%) | 75 (2.8%) |
| 35 to 64 Years | 0 (0.0%) | 0 (0.0%) |
| 65 to 74 Years | 0 (0.0%) | 0 (0.0%) |
| 75 Years and over | 0 (0.0%) | 0 (0.0%) |
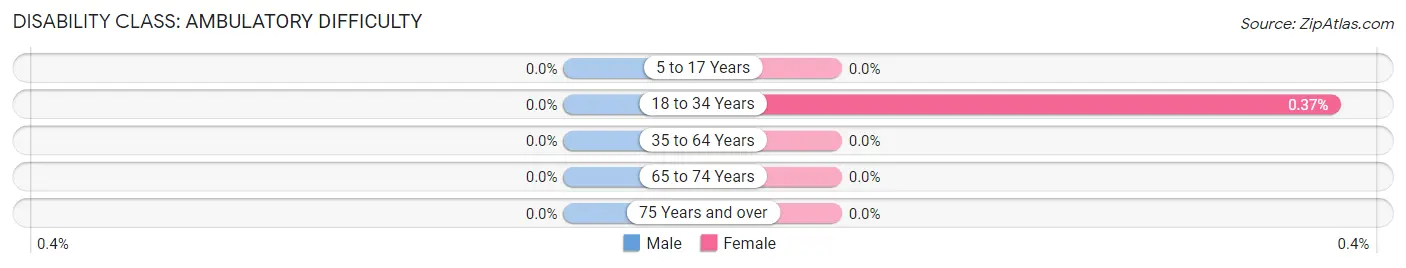
Disability Class: Ambulatory Difficulty
| Age Bracket | Male | Female |
| 5 to 17 Years | 0 (0.0%) | 0 (0.0%) |
| 18 to 34 Years | 0 (0.0%) | 10 (0.4%) |
| 35 to 64 Years | 0 (0.0%) | 0 (0.0%) |
| 65 to 74 Years | 0 (0.0%) | 0 (0.0%) |
| 75 Years and over | 0 (0.0%) | 0 (0.0%) |
Disability Class: Self-Care Difficulty

| Age Bracket | Male | Female |
| 5 to 17 Years | 0 (0.0%) | 0 (0.0%) |
| 18 to 34 Years | 0 (0.0%) | 0 (0.0%) |
| 35 to 64 Years | 0 (0.0%) | 0 (0.0%) |
| 65 to 74 Years | 0 (0.0%) | 0 (0.0%) |
| 75 Years and over | 0 (0.0%) | 0 (0.0%) |
Technology Access in University at Buffalo
Computing Device Access in University at Buffalo
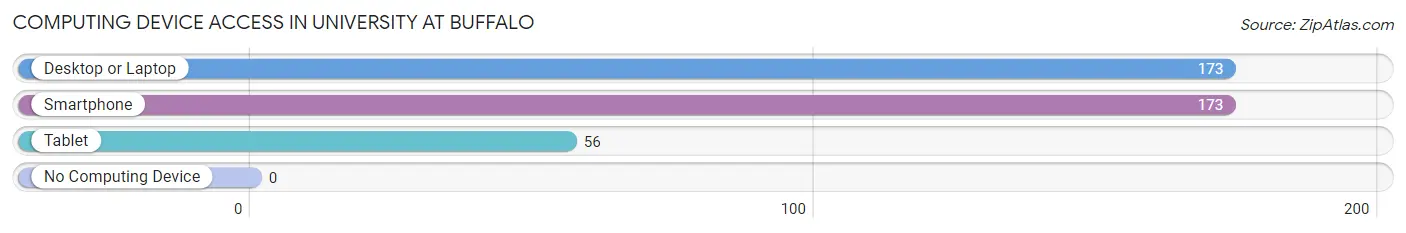
| Device Type | # Households | % Households |
| Desktop or Laptop | 173 | 100.0% |
| Smartphone | 173 | 100.0% |
| Tablet | 56 | 32.4% |
| No Computing Device | 0 | 0.0% |
| Total | 173 | 100.0% |
Internet Access in University at Buffalo
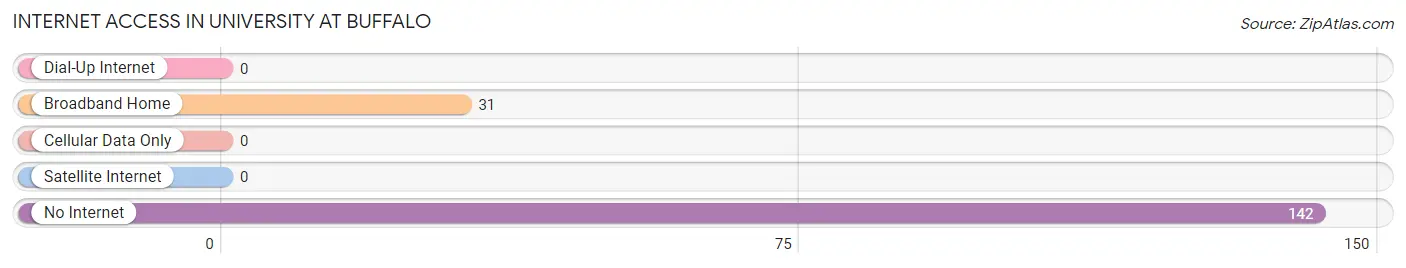
| Internet Type | # Households | % Households |
| Dial-Up Internet | 0 | 0.0% |
| Broadband Home | 31 | 17.9% |
| Cellular Data Only | 0 | 0.0% |
| Satellite Internet | 0 | 0.0% |
| No Internet | 142 | 82.1% |
| Total | 173 | 100.0% |
University at Buffalo Summary
University at Buffalo, NY is a public research university located in Buffalo, New York. It is the largest university in the State University of New York (SUNY) system and the second largest university in the state of New York. The university was founded in 1846 as a private medical college and was later acquired by the State University of New York in 1962. The university is composed of three campuses: the North Campus, the South Campus, and the Downtown Campus.
History
The University at Buffalo was founded in 1846 as a private medical college, the University of Buffalo. It was the first medical school in the state of New York and the first university in the state to be chartered by the State Legislature. The university was initially located in downtown Buffalo and was later moved to its current location on the North Campus in 1891. In 1962, the university was acquired by the State University of New York and became part of the SUNY system.
Geography
The University at Buffalo is located in Buffalo, New York, which is situated in the western part of the state. The university is located on the North Campus, which is located on the northern edge of the city. The South Campus is located on the south side of the city, and the Downtown Campus is located in the heart of downtown Buffalo. The university is surrounded by a variety of neighborhoods, including Allentown, Elmwood Village, and University Heights.
Economy
The University at Buffalo is a major economic driver in the Buffalo region. The university is the largest employer in the city, with over 10,000 faculty and staff. The university also has a significant economic impact on the region, with an estimated $1.2 billion in economic activity generated annually. The university also contributes to the local economy through research and development, technology transfer, and the purchase of goods and services.
Demographics
The University at Buffalo has a diverse student body, with students from all over the world. As of fall 2020, the university had a total enrollment of over 30,000 students. The student body is composed of approximately 57% female and 43% male students. The university also has a large international student population, with over 4,000 international students from over 100 countries. The university also has a large population of students from underrepresented minority groups, with over 10% of the student body identifying as African American, Hispanic, or Native American.
Common Questions
What is Per Capita Income in University at Buffalo?
Per Capita income in University at Buffalo is $7,160.
What is Income or Wage Gap in University at Buffalo?
Income or Wage Gap in University at Buffalo is 9.9%.
Women in University at Buffalo earn 90.1 cents for every dollar earned by a man.
What is Inequality or Gini Index in University at Buffalo?
Inequality or Gini Index in University at Buffalo is 0.46.
What is the Total Population of University at Buffalo?
Total Population of University at Buffalo is 6,189.
What is the Total Male Population of University at Buffalo?
Total Male Population of University at Buffalo is 3,222.
What is the Total Female Population of University at Buffalo?
Total Female Population of University at Buffalo is 2,967.
What is the Ratio of Males per 100 Females in University at Buffalo?
There are 108.59 Males per 100 Females in University at Buffalo.
What is the Ratio of Females per 100 Males in University at Buffalo?
There are 92.09 Females per 100 Males in University at Buffalo.
What is the Median Population Age in University at Buffalo?
Median Population Age in University at Buffalo is 19.3 Years.
What is the Average Family Size in University at Buffalo
Average Family Size in University at Buffalo is 2.2 People.
What is the Average Household Size in University at Buffalo
Average Household Size in University at Buffalo is 1.6 People.
How Large is the Labor Force in University at Buffalo?
There are 1,318 People in the Labor Forcein in University at Buffalo.
What is the Percentage of People in the Labor Force in University at Buffalo?
21.3% of People are in the Labor Force in University at Buffalo.
What is the Unemployment Rate in University at Buffalo?
Unemployment Rate in University at Buffalo is 2.1%.