Zip Codes with the Highest Percentage of Population Employed in Food Preparation & Serving in Elmira, NY
RELATED REPORTS & OPTIONS
Food Preparation & Serving
Elmira
Compare Zip Codes
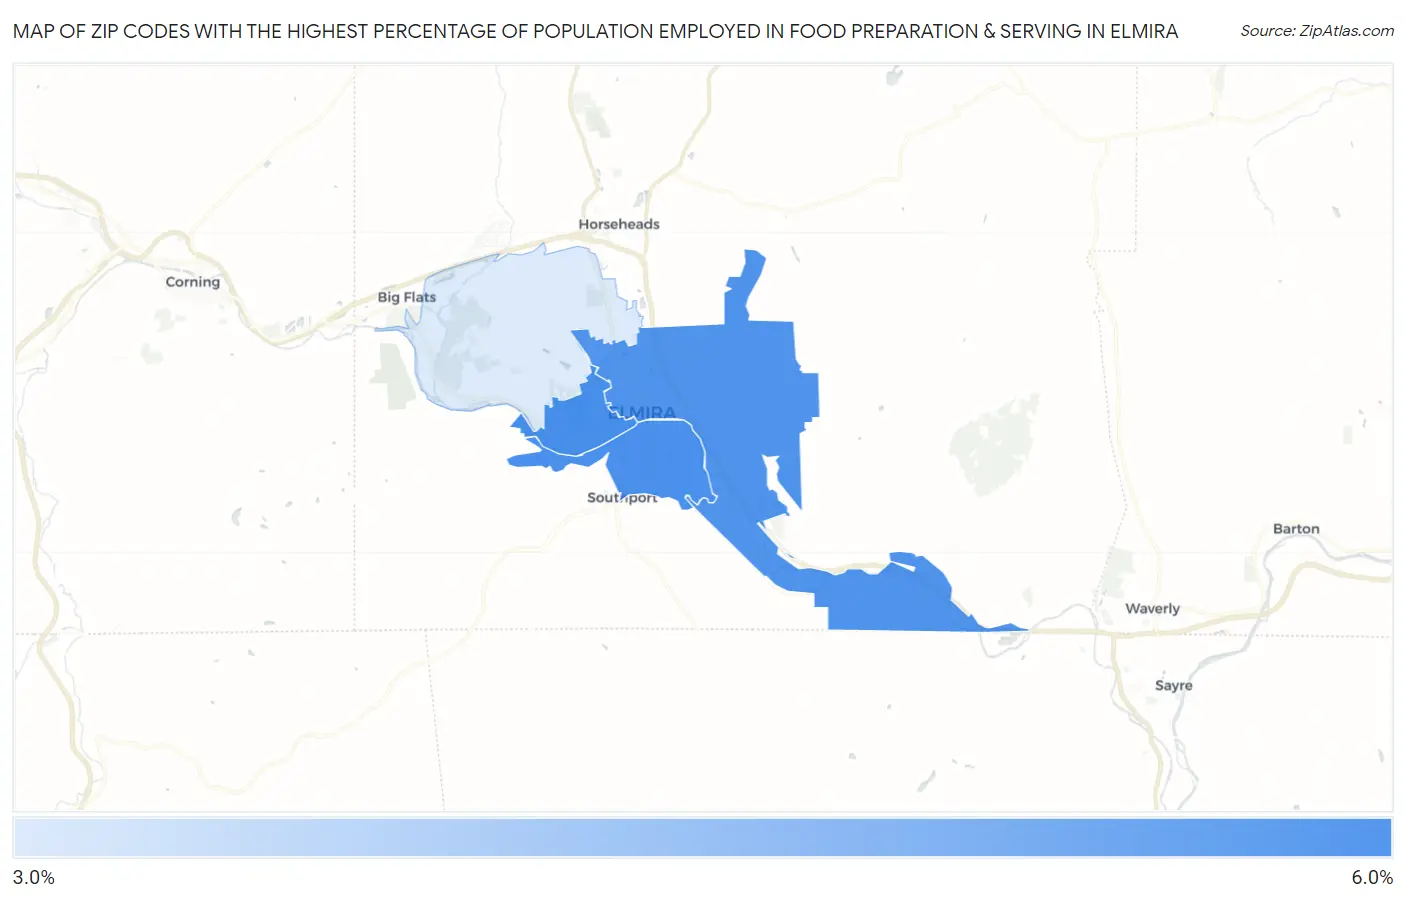
Map of Zip Codes with the Highest Percentage of Population Employed in Food Preparation & Serving in Elmira
3.1%
5.9%
Zip Codes with the Highest Percentage of Population Employed in Food Preparation & Serving in Elmira, NY
| Zip Code | % Employed | vs State | vs National | |
| 1. | 14905 | 5.9% | 4.8%(+1.06)#473 | 5.3%(+0.588)#9,770 |
| 2. | 14904 | 5.8% | 4.8%(+1.01)#485 | 5.3%(+0.536)#9,963 |
| 3. | 14901 | 5.7% | 4.8%(+0.899)#509 | 5.3%(+0.428)#10,280 |
| 4. | 14903 | 3.1% | 4.8%(-1.68)#1,067 | 5.3%(-2.15)#20,746 |
1
Common Questions
What are the Top 3 Zip Codes with the Highest Percentage of Population Employed in Food Preparation & Serving in Elmira, NY?
Top 3 Zip Codes with the Highest Percentage of Population Employed in Food Preparation & Serving in Elmira, NY are:
What zip code has the Highest Percentage of Population Employed in Food Preparation & Serving in Elmira, NY?
14905 has the Highest Percentage of Population Employed in Food Preparation & Serving in Elmira, NY with 5.9%.
What is the Percentage of Population Employed in Food Preparation & Serving in Elmira, NY?
Percentage of Population Employed in Food Preparation & Serving in Elmira is 4.8%.
What is the Percentage of Population Employed in Food Preparation & Serving in New York?
Percentage of Population Employed in Food Preparation & Serving in New York is 4.8%.
What is the Percentage of Population Employed in Food Preparation & Serving in the United States?
Percentage of Population Employed in Food Preparation & Serving in the United States is 5.3%.