Zip Codes with the Highest Percentage of Population Employed in Food Preparation & Serving in Bronx, NY
RELATED REPORTS & OPTIONS
Food Preparation & Serving
Bronx
Compare Zip Codes
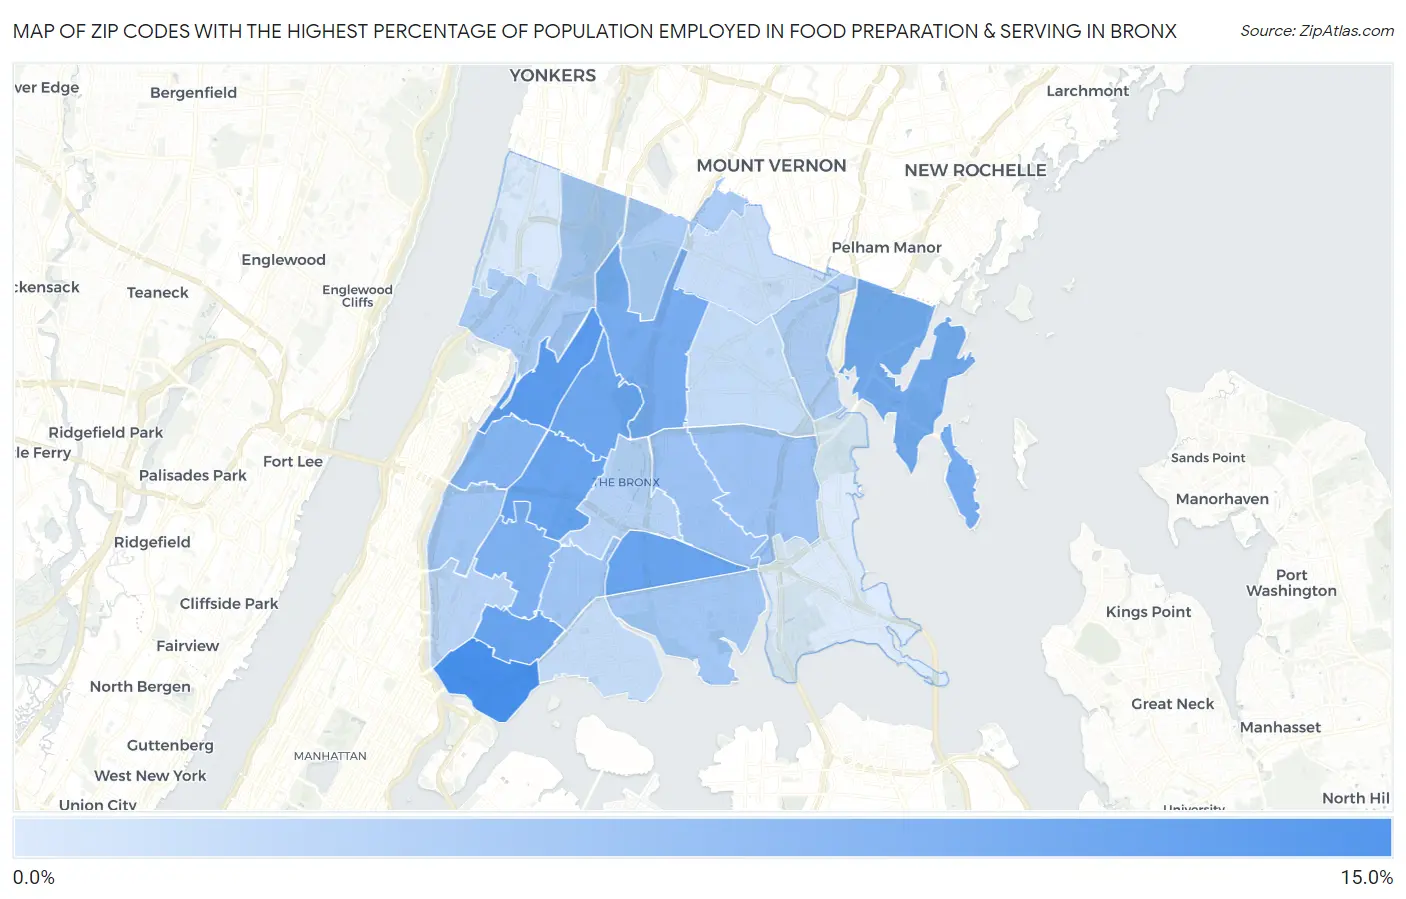
Map of Zip Codes with the Highest Percentage of Population Employed in Food Preparation & Serving in Bronx
2.8%
10.7%
Zip Codes with the Highest Percentage of Population Employed in Food Preparation & Serving in Bronx, NY
| Zip Code | % Employed | vs State | vs National | |
| 1. | 10454 | 10.7% | 4.8%(+5.91)#114 | 5.3%(+5.44)#2,191 |
| 2. | 10468 | 9.7% | 4.8%(+4.89)#145 | 5.3%(+4.42)#2,881 |
| 3. | 10472 | 8.9% | 4.8%(+4.08)#177 | 5.3%(+3.61)#3,626 |
| 4. | 10457 | 8.9% | 4.8%(+4.04)#179 | 5.3%(+3.57)#3,663 |
| 5. | 10455 | 8.8% | 4.8%(+3.99)#182 | 5.3%(+3.52)#3,721 |
| 6. | 10458 | 8.6% | 4.8%(+3.75)#204 | 5.3%(+3.28)#4,008 |
| 7. | 10464 | 8.1% | 4.8%(+3.33)#226 | 5.3%(+2.86)#4,523 |
| 8. | 10467 | 8.1% | 4.8%(+3.28)#229 | 5.3%(+2.80)#4,585 |
| 9. | 10456 | 7.7% | 4.8%(+2.87)#259 | 5.3%(+2.40)#5,234 |
| 10. | 10453 | 7.5% | 4.8%(+2.65)#278 | 5.3%(+2.18)#5,621 |
| 11. | 10462 | 6.3% | 4.8%(+1.49)#416 | 5.3%(+1.02)#8,406 |
| 12. | 10461 | 6.1% | 4.8%(+1.32)#431 | 5.3%(+0.845)#8,928 |
| 13. | 10459 | 5.9% | 4.8%(+1.13)#462 | 5.3%(+0.658)#9,525 |
| 14. | 10452 | 5.9% | 4.8%(+1.06)#472 | 5.3%(+0.594)#9,758 |
| 15. | 10473 | 5.7% | 4.8%(+0.912)#507 | 5.3%(+0.442)#10,253 |
| 16. | 10463 | 5.5% | 4.8%(+0.640)#542 | 5.3%(+0.170)#11,199 |
| 17. | 10470 | 5.3% | 4.8%(+0.528)#560 | 5.3%(+0.058)#11,602 |
| 18. | 10475 | 5.3% | 4.8%(+0.465)#567 | 5.3%(-0.005)#11,835 |
| 19. | 10460 | 4.8% | 4.8%(+0.029)#648 | 5.3%(-0.441)#13,587 |
| 20. | 10451 | 4.7% | 4.8%(-0.160)#689 | 5.3%(-0.631)#14,347 |
| 21. | 10469 | 4.1% | 4.8%(-0.731)#837 | 5.3%(-1.20)#16,774 |
| 22. | 10474 | 4.1% | 4.8%(-0.736)#838 | 5.3%(-1.21)#16,797 |
| 23. | 10466 | 3.9% | 4.8%(-0.886)#877 | 5.3%(-1.36)#17,408 |
| 24. | 10471 | 3.1% | 4.8%(-1.73)#1,079 | 5.3%(-2.20)#20,913 |
| 25. | 10465 | 2.8% | 4.8%(-2.00)#1,152 | 5.3%(-2.47)#22,025 |
1
Common Questions
What are the Top 10 Zip Codes with the Highest Percentage of Population Employed in Food Preparation & Serving in Bronx, NY?
Top 10 Zip Codes with the Highest Percentage of Population Employed in Food Preparation & Serving in Bronx, NY are:
What zip code has the Highest Percentage of Population Employed in Food Preparation & Serving in Bronx, NY?
10454 has the Highest Percentage of Population Employed in Food Preparation & Serving in Bronx, NY with 10.7%.
What is the Percentage of Population Employed in Food Preparation & Serving in New York?
Percentage of Population Employed in Food Preparation & Serving in New York is 4.8%.
What is the Percentage of Population Employed in Food Preparation & Serving in the United States?
Percentage of Population Employed in Food Preparation & Serving in the United States is 5.3%.