Cities with the Largest Subsaharan African Community in New York
RELATED REPORTS & OPTIONS
Subsaharan African
New York
Compare Cities
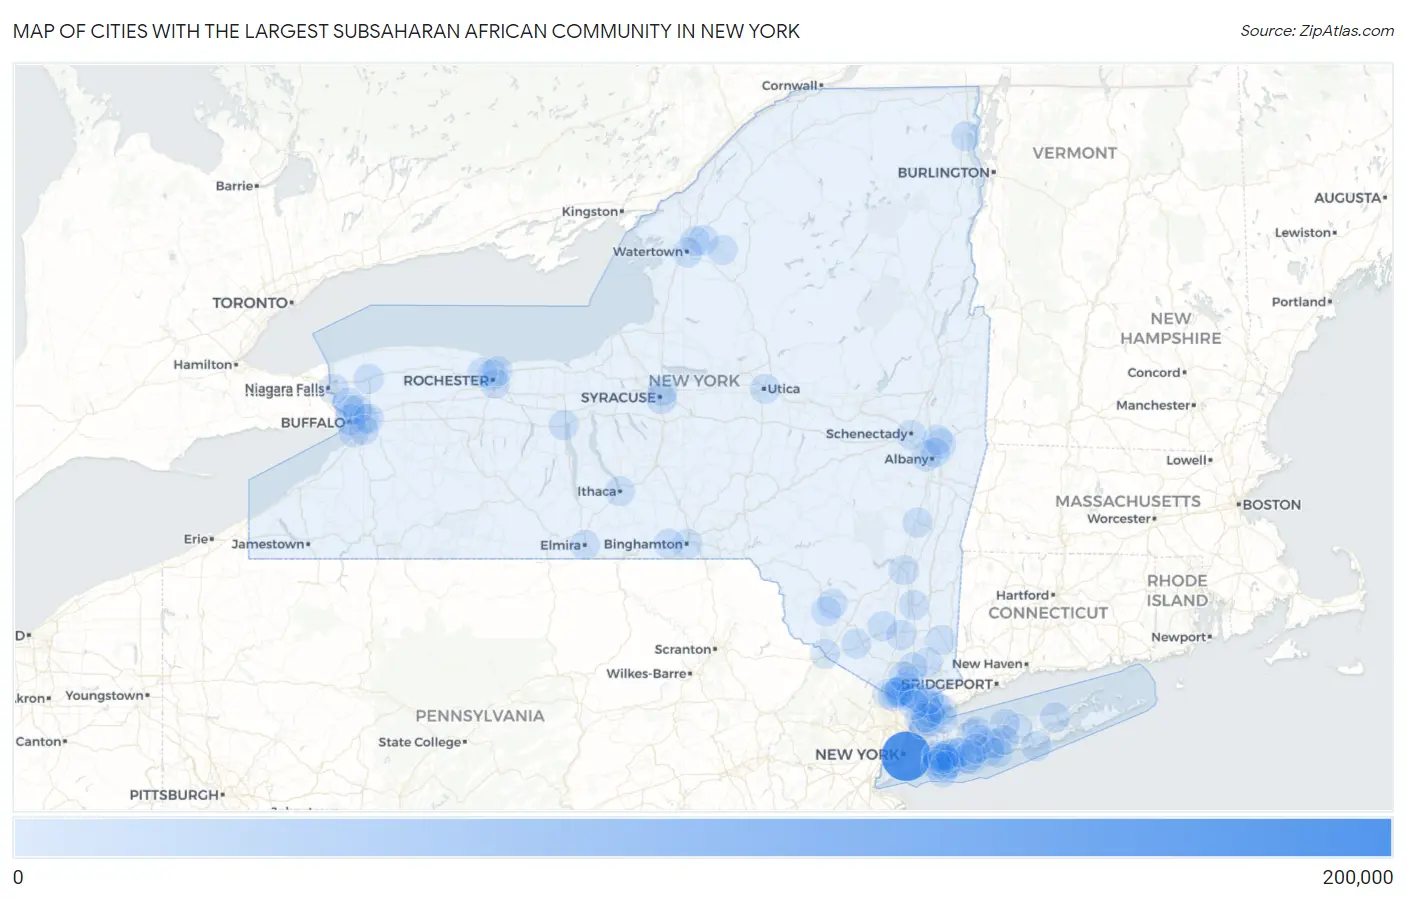
Map of Cities with the Largest Subsaharan African Community in New York
0
200,000
Cities with the Largest Subsaharan African Community in New York
| City | Subsaharan African | vs State | vs National | |
| 1. | New York | 199,409 | 285,149(69.93%)#1 | 4,023,199(4.96%)#1 |
| 2. | Buffalo | 7,768 | 285,149(2.72%)#2 | 4,023,199(0.19%)#58 |
| 3. | Yonkers | 5,812 | 285,149(2.04%)#3 | 4,023,199(0.14%)#83 |
| 4. | Syracuse | 5,549 | 285,149(1.95%)#4 | 4,023,199(0.14%)#87 |
| 5. | Rochester | 4,682 | 285,149(1.64%)#5 | 4,023,199(0.12%)#104 |
| 6. | Mount Vernon | 2,849 | 285,149(1.00%)#6 | 4,023,199(0.07%)#201 |
| 7. | Albany | 2,458 | 285,149(0.86%)#7 | 4,023,199(0.06%)#242 |
| 8. | New Rochelle | 1,586 | 285,149(0.56%)#8 | 4,023,199(0.04%)#384 |
| 9. | Brentwood | 1,358 | 285,149(0.48%)#9 | 4,023,199(0.03%)#458 |
| 10. | Utica | 1,119 | 285,149(0.39%)#10 | 4,023,199(0.03%)#531 |
| 11. | Fort Drum | 1,049 | 285,149(0.37%)#11 | 4,023,199(0.03%)#568 |
| 12. | Coram | 872 | 285,149(0.31%)#12 | 4,023,199(0.02%)#657 |
| 13. | Schenectady | 870 | 285,149(0.31%)#13 | 4,023,199(0.02%)#659 |
| 14. | Cheektowaga | 781 | 285,149(0.27%)#14 | 4,023,199(0.02%)#739 |
| 15. | Elmont | 781 | 285,149(0.27%)#15 | 4,023,199(0.02%)#740 |
| 16. | Troy | 688 | 285,149(0.24%)#16 | 4,023,199(0.02%)#822 |
| 17. | Valley Stream | 673 | 285,149(0.24%)#17 | 4,023,199(0.02%)#838 |
| 18. | Hempstead | 647 | 285,149(0.23%)#18 | 4,023,199(0.02%)#877 |
| 19. | White Plains | 634 | 285,149(0.22%)#19 | 4,023,199(0.02%)#894 |
| 20. | Tonawanda | 621 | 285,149(0.22%)#20 | 4,023,199(0.02%)#909 |
| 21. | Baldwin | 621 | 285,149(0.22%)#21 | 4,023,199(0.02%)#910 |
| 22. | Binghamton | 619 | 285,149(0.22%)#22 | 4,023,199(0.02%)#916 |
| 23. | Freeport | 616 | 285,149(0.22%)#23 | 4,023,199(0.02%)#921 |
| 24. | Niagara Falls | 611 | 285,149(0.21%)#24 | 4,023,199(0.02%)#930 |
| 25. | Harrison | 567 | 285,149(0.20%)#25 | 4,023,199(0.01%)#988 |
| 26. | Central Islip | 533 | 285,149(0.19%)#26 | 4,023,199(0.01%)#1,038 |
| 27. | Long Beach | 502 | 285,149(0.18%)#27 | 4,023,199(0.01%)#1,081 |
| 28. | Watertown | 498 | 285,149(0.17%)#28 | 4,023,199(0.01%)#1,089 |
| 29. | North Valley Stream | 487 | 285,149(0.17%)#29 | 4,023,199(0.01%)#1,103 |
| 30. | Mastic Beach | 471 | 285,149(0.17%)#30 | 4,023,199(0.01%)#1,142 |
| 31. | Brighton | 436 | 285,149(0.15%)#31 | 4,023,199(0.01%)#1,223 |
| 32. | New City | 423 | 285,149(0.15%)#32 | 4,023,199(0.01%)#1,253 |
| 33. | Ithaca | 402 | 285,149(0.14%)#33 | 4,023,199(0.01%)#1,292 |
| 34. | Huntington Station | 387 | 285,149(0.14%)#34 | 4,023,199(0.01%)#1,334 |
| 35. | East Meadow | 381 | 285,149(0.13%)#35 | 4,023,199(0.01%)#1,353 |
| 36. | Nanuet | 374 | 285,149(0.13%)#36 | 4,023,199(0.01%)#1,368 |
| 37. | Eggertsville | 370 | 285,149(0.13%)#37 | 4,023,199(0.01%)#1,378 |
| 38. | Dix Hills | 369 | 285,149(0.13%)#38 | 4,023,199(0.01%)#1,379 |
| 39. | Uniondale | 347 | 285,149(0.12%)#39 | 4,023,199(0.01%)#1,429 |
| 40. | Amityville | 347 | 285,149(0.12%)#40 | 4,023,199(0.01%)#1,431 |
| 41. | Riverhead | 336 | 285,149(0.12%)#41 | 4,023,199(0.01%)#1,464 |
| 42. | Lockport | 320 | 285,149(0.11%)#42 | 4,023,199(0.01%)#1,521 |
| 43. | Bay Shore | 316 | 285,149(0.11%)#43 | 4,023,199(0.01%)#1,528 |
| 44. | Calcium | 314 | 285,149(0.11%)#44 | 4,023,199(0.01%)#1,537 |
| 45. | Middletown | 312 | 285,149(0.11%)#45 | 4,023,199(0.01%)#1,545 |
| 46. | Kenmore | 309 | 285,149(0.11%)#46 | 4,023,199(0.01%)#1,551 |
| 47. | Newburgh | 303 | 285,149(0.11%)#47 | 4,023,199(0.01%)#1,569 |
| 48. | Irondequoit | 298 | 285,149(0.10%)#48 | 4,023,199(0.01%)#1,585 |
| 49. | Greenlawn | 291 | 285,149(0.10%)#49 | 4,023,199(0.01%)#1,605 |
| 50. | Elmsford | 287 | 285,149(0.10%)#50 | 4,023,199(0.01%)#1,622 |
| 51. | Suffern | 278 | 285,149(0.10%)#51 | 4,023,199(0.01%)#1,655 |
| 52. | Walden | 276 | 285,149(0.10%)#52 | 4,023,199(0.01%)#1,666 |
| 53. | Roosevelt | 272 | 285,149(0.10%)#53 | 4,023,199(0.01%)#1,682 |
| 54. | Rye | 268 | 285,149(0.09%)#54 | 4,023,199(0.01%)#1,697 |
| 55. | East Islip | 261 | 285,149(0.09%)#55 | 4,023,199(0.01%)#1,721 |
| 56. | Spring Valley | 260 | 285,149(0.09%)#56 | 4,023,199(0.01%)#1,726 |
| 57. | Haverstraw | 253 | 285,149(0.09%)#57 | 4,023,199(0.01%)#1,762 |
| 58. | Roessleville | 252 | 285,149(0.09%)#58 | 4,023,199(0.01%)#1,767 |
| 59. | East Massapequa | 248 | 285,149(0.09%)#59 | 4,023,199(0.01%)#1,785 |
| 60. | Lackawanna | 244 | 285,149(0.09%)#60 | 4,023,199(0.01%)#1,799 |
| 61. | Cohoes | 243 | 285,149(0.09%)#61 | 4,023,199(0.01%)#1,805 |
| 62. | Jefferson Valley Yorktown | 238 | 285,149(0.08%)#62 | 4,023,199(0.01%)#1,830 |
| 63. | West Hempstead | 232 | 285,149(0.08%)#63 | 4,023,199(0.01%)#1,862 |
| 64. | Elmira | 229 | 285,149(0.08%)#64 | 4,023,199(0.01%)#1,872 |
| 65. | Monsey | 222 | 285,149(0.08%)#65 | 4,023,199(0.01%)#1,922 |
| 66. | Airmont | 222 | 285,149(0.08%)#66 | 4,023,199(0.01%)#1,925 |
| 67. | Plattsburgh | 221 | 285,149(0.08%)#67 | 4,023,199(0.01%)#1,931 |
| 68. | Stony Brook University | 218 | 285,149(0.08%)#68 | 4,023,199(0.01%)#1,949 |
| 69. | Carthage | 211 | 285,149(0.07%)#69 | 4,023,199(0.01%)#1,996 |
| 70. | Scarsdale | 205 | 285,149(0.07%)#70 | 4,023,199(0.01%)#2,024 |
| 71. | Jefferson Heights | 199 | 285,149(0.07%)#71 | 4,023,199(0.00%)#2,061 |
| 72. | Menands | 197 | 285,149(0.07%)#72 | 4,023,199(0.00%)#2,072 |
| 73. | Port Chester | 196 | 285,149(0.07%)#73 | 4,023,199(0.00%)#2,078 |
| 74. | Valley Cottage | 196 | 285,149(0.07%)#74 | 4,023,199(0.00%)#2,081 |
| 75. | Levittown | 192 | 285,149(0.07%)#75 | 4,023,199(0.00%)#2,112 |
| 76. | North Amityville | 192 | 285,149(0.07%)#76 | 4,023,199(0.00%)#2,116 |
| 77. | Woodmere | 188 | 285,149(0.07%)#77 | 4,023,199(0.00%)#2,137 |
| 78. | Lake Carmel | 187 | 285,149(0.07%)#78 | 4,023,199(0.00%)#2,149 |
| 79. | Geneva | 185 | 285,149(0.06%)#79 | 4,023,199(0.00%)#2,161 |
| 80. | Hillcrest | 185 | 285,149(0.06%)#80 | 4,023,199(0.00%)#2,163 |
| 81. | South Fallsburg | 181 | 285,149(0.06%)#81 | 4,023,199(0.00%)#2,204 |
| 82. | Peekskill | 176 | 285,149(0.06%)#82 | 4,023,199(0.00%)#2,234 |
| 83. | Eastchester | 173 | 285,149(0.06%)#83 | 4,023,199(0.00%)#2,260 |
| 84. | Endicott | 173 | 285,149(0.06%)#84 | 4,023,199(0.00%)#2,264 |
| 85. | Poughkeepsie | 170 | 285,149(0.06%)#85 | 4,023,199(0.00%)#2,281 |
| 86. | Greece | 162 | 285,149(0.06%)#86 | 4,023,199(0.00%)#2,346 |
| 87. | Stony Point | 159 | 285,149(0.06%)#87 | 4,023,199(0.00%)#2,376 |
| 88. | Lyncourt | 158 | 285,149(0.06%)#88 | 4,023,199(0.00%)#2,386 |
| 89. | Kingston | 157 | 285,149(0.06%)#89 | 4,023,199(0.00%)#2,394 |
| 90. | Nyack | 155 | 285,149(0.05%)#90 | 4,023,199(0.00%)#2,419 |
| 91. | Oceanside | 154 | 285,149(0.05%)#91 | 4,023,199(0.00%)#2,421 |
| 92. | Ronkonkoma | 152 | 285,149(0.05%)#92 | 4,023,199(0.00%)#2,438 |
| 93. | Valhalla | 143 | 285,149(0.05%)#93 | 4,023,199(0.00%)#2,536 |
| 94. | Monticello | 142 | 285,149(0.05%)#94 | 4,023,199(0.00%)#2,550 |
| 95. | Lakeview | 134 | 285,149(0.05%)#95 | 4,023,199(0.00%)#2,635 |
| 96. | Depew | 132 | 285,149(0.05%)#96 | 4,023,199(0.00%)#2,648 |
| 97. | West Seneca | 130 | 285,149(0.05%)#97 | 4,023,199(0.00%)#2,671 |
| 98. | Port Jervis | 129 | 285,149(0.05%)#98 | 4,023,199(0.00%)#2,694 |
| 99. | Piermont | 126 | 285,149(0.04%)#99 | 4,023,199(0.00%)#2,732 |
| 100. | Wyandanch | 122 | 285,149(0.04%)#100 | 4,023,199(0.00%)#2,775 |
Common Questions
What are the Top 10 Cities with the Largest Subsaharan African Community in New York?
Top 10 Cities with the Largest Subsaharan African Community in New York are:
#1
199,409
#2
7,768
#3
5,812
#4
5,549
#5
4,682
#6
2,849
#7
2,458
#8
1,586
#9
1,358
#10
1,119
What city has the Largest Subsaharan African Community in New York?
New York has the Largest Subsaharan African Community in New York with 199,409.
What is the Total Subsaharan African Population in the State of New York?
Total Subsaharan African Population in New York is 285,149.
What is the Total Subsaharan African Population in the United States?
Total Subsaharan African Population in the United States is 4,023,199.