Cities with the Largest Puerto Rican Community in New York
RELATED REPORTS & OPTIONS
Puerto Rican
New York
Compare Cities
Map of Cities with the Largest Puerto Rican Community in New York
0
800,000
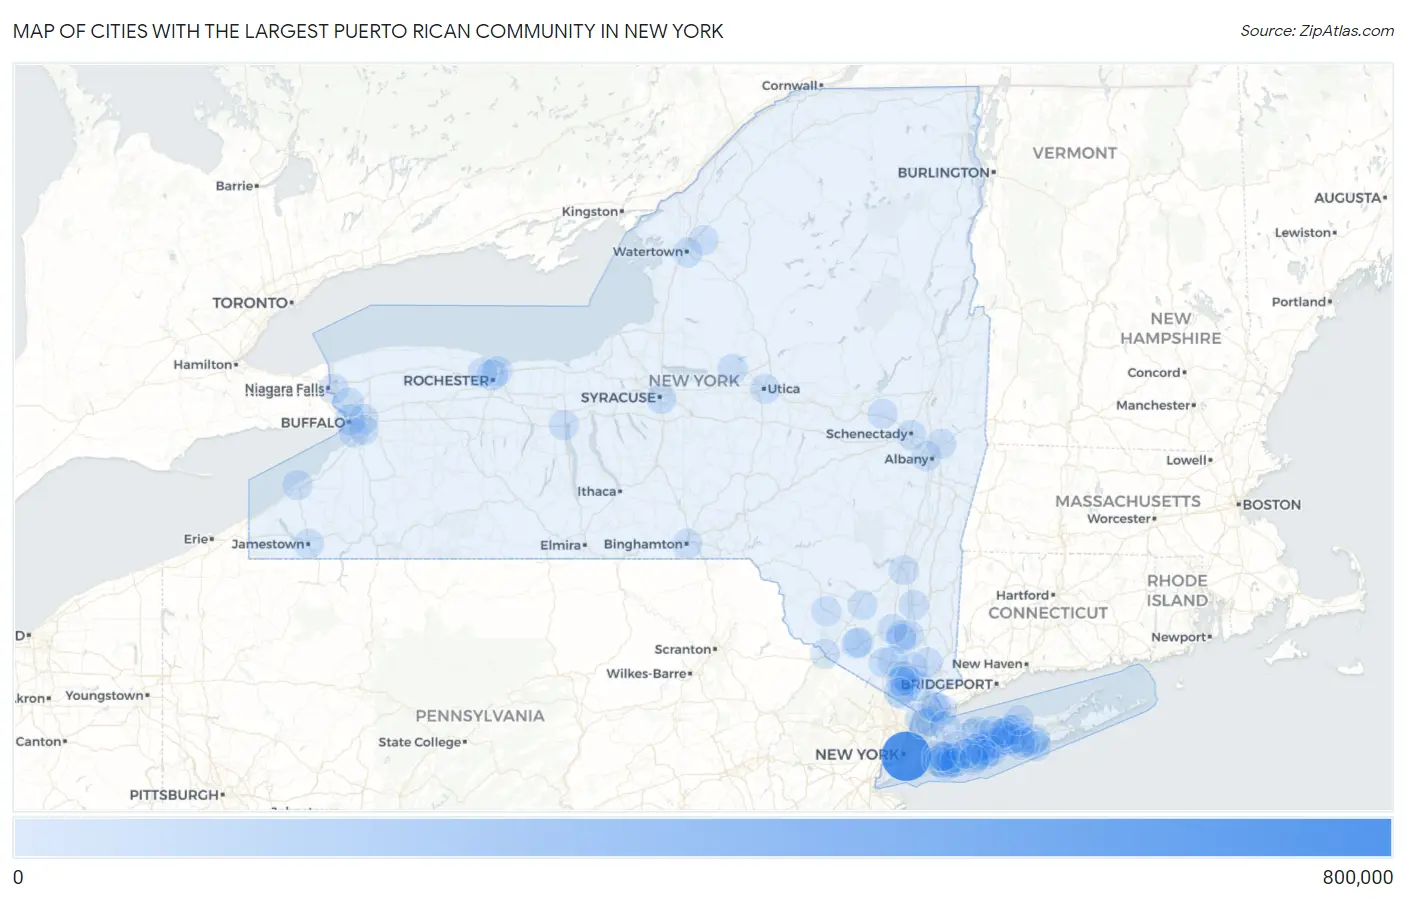
Cities with the Largest Puerto Rican Community in New York
| City | Puerto Rican | vs State | vs National | |
| 1. | New York | 645,158 | 1,068,303(60.39%)#1 | 5,902,402(10.93%)#1 |
| 2. | Rochester | 30,916 | 1,068,303(2.89%)#2 | 5,902,402(0.52%)#22 |
| 3. | Buffalo | 24,857 | 1,068,303(2.33%)#3 | 5,902,402(0.42%)#31 |
| 4. | Yonkers | 17,964 | 1,068,303(1.68%)#4 | 5,902,402(0.30%)#42 |
| 5. | Syracuse | 8,084 | 1,068,303(0.76%)#5 | 5,902,402(0.14%)#114 |
| 6. | Brentwood | 7,110 | 1,068,303(0.67%)#6 | 5,902,402(0.12%)#129 |
| 7. | Coram | 4,900 | 1,068,303(0.46%)#7 | 5,902,402(0.08%)#182 |
| 8. | Amsterdam | 4,736 | 1,068,303(0.44%)#8 | 5,902,402(0.08%)#192 |
| 9. | Schenectady | 4,597 | 1,068,303(0.43%)#9 | 5,902,402(0.08%)#200 |
| 10. | New Rochelle | 4,588 | 1,068,303(0.43%)#10 | 5,902,402(0.08%)#201 |
| 11. | Utica | 4,350 | 1,068,303(0.41%)#11 | 5,902,402(0.07%)#205 |
| 12. | Middletown | 4,312 | 1,068,303(0.40%)#12 | 5,902,402(0.07%)#209 |
| 13. | Mount Vernon | 3,926 | 1,068,303(0.37%)#13 | 5,902,402(0.07%)#231 |
| 14. | Albany | 3,697 | 1,068,303(0.35%)#14 | 5,902,402(0.06%)#243 |
| 15. | Irondequoit | 3,506 | 1,068,303(0.33%)#15 | 5,902,402(0.06%)#261 |
| 16. | Bay Shore | 3,249 | 1,068,303(0.30%)#16 | 5,902,402(0.06%)#285 |
| 17. | Central Islip | 3,156 | 1,068,303(0.30%)#17 | 5,902,402(0.05%)#300 |
| 18. | Newburgh | 2,987 | 1,068,303(0.28%)#18 | 5,902,402(0.05%)#317 |
| 19. | Troy | 2,931 | 1,068,303(0.27%)#19 | 5,902,402(0.05%)#320 |
| 20. | Dunkirk | 2,830 | 1,068,303(0.26%)#20 | 5,902,402(0.05%)#336 |
| 21. | Jamestown | 2,735 | 1,068,303(0.26%)#21 | 5,902,402(0.05%)#346 |
| 22. | White Plains | 2,331 | 1,068,303(0.22%)#22 | 5,902,402(0.04%)#413 |
| 23. | Shirley | 2,330 | 1,068,303(0.22%)#23 | 5,902,402(0.04%)#414 |
| 24. | Deer Park | 2,280 | 1,068,303(0.21%)#24 | 5,902,402(0.04%)#418 |
| 25. | Levittown | 2,161 | 1,068,303(0.20%)#25 | 5,902,402(0.04%)#438 |
| 26. | Cheektowaga | 2,123 | 1,068,303(0.20%)#26 | 5,902,402(0.04%)#445 |
| 27. | Binghamton | 2,093 | 1,068,303(0.20%)#27 | 5,902,402(0.04%)#456 |
| 28. | Woodbury | 1,987 | 1,068,303(0.19%)#28 | 5,902,402(0.03%)#479 |
| 29. | Poughkeepsie | 1,981 | 1,068,303(0.19%)#29 | 5,902,402(0.03%)#481 |
| 30. | Elmont | 1,928 | 1,068,303(0.18%)#30 | 5,902,402(0.03%)#494 |
| 31. | Peekskill | 1,922 | 1,068,303(0.18%)#31 | 5,902,402(0.03%)#496 |
| 32. | West Babylon | 1,842 | 1,068,303(0.17%)#32 | 5,902,402(0.03%)#512 |
| 33. | Ossining | 1,820 | 1,068,303(0.17%)#33 | 5,902,402(0.03%)#520 |
| 34. | Port Chester | 1,797 | 1,068,303(0.17%)#34 | 5,902,402(0.03%)#525 |
| 35. | Centereach | 1,767 | 1,068,303(0.17%)#35 | 5,902,402(0.03%)#533 |
| 36. | Niagara Falls | 1,721 | 1,068,303(0.16%)#36 | 5,902,402(0.03%)#543 |
| 37. | Ronkonkoma | 1,718 | 1,068,303(0.16%)#37 | 5,902,402(0.03%)#544 |
| 38. | Holbrook | 1,693 | 1,068,303(0.16%)#38 | 5,902,402(0.03%)#555 |
| 39. | New City | 1,663 | 1,068,303(0.16%)#39 | 5,902,402(0.03%)#563 |
| 40. | North Bay Shore | 1,617 | 1,068,303(0.15%)#40 | 5,902,402(0.03%)#574 |
| 41. | West Haverstraw | 1,612 | 1,068,303(0.15%)#41 | 5,902,402(0.03%)#579 |
| 42. | Selden | 1,611 | 1,068,303(0.15%)#42 | 5,902,402(0.03%)#580 |
| 43. | Hempstead | 1,586 | 1,068,303(0.15%)#43 | 5,902,402(0.03%)#594 |
| 44. | Lake Ronkonkoma | 1,548 | 1,068,303(0.14%)#44 | 5,902,402(0.03%)#604 |
| 45. | Valley Stream | 1,536 | 1,068,303(0.14%)#45 | 5,902,402(0.03%)#612 |
| 46. | Freeport | 1,526 | 1,068,303(0.14%)#46 | 5,902,402(0.03%)#613 |
| 47. | Medford | 1,425 | 1,068,303(0.13%)#47 | 5,902,402(0.02%)#645 |
| 48. | Monticello | 1,412 | 1,068,303(0.13%)#48 | 5,902,402(0.02%)#652 |
| 49. | Fort Drum | 1,390 | 1,068,303(0.13%)#49 | 5,902,402(0.02%)#660 |
| 50. | Geneva | 1,386 | 1,068,303(0.13%)#50 | 5,902,402(0.02%)#663 |
| 51. | Monroe | 1,380 | 1,068,303(0.13%)#51 | 5,902,402(0.02%)#666 |
| 52. | Beacon | 1,352 | 1,068,303(0.13%)#52 | 5,902,402(0.02%)#675 |
| 53. | Oceanside | 1,332 | 1,068,303(0.12%)#53 | 5,902,402(0.02%)#683 |
| 54. | New Windsor | 1,316 | 1,068,303(0.12%)#54 | 5,902,402(0.02%)#693 |
| 55. | Holtsville | 1,312 | 1,068,303(0.12%)#55 | 5,902,402(0.02%)#696 |
| 56. | Nanuet | 1,310 | 1,068,303(0.12%)#56 | 5,902,402(0.02%)#698 |
| 57. | Orange Lake | 1,291 | 1,068,303(0.12%)#57 | 5,902,402(0.02%)#703 |
| 58. | Mechanicstown | 1,288 | 1,068,303(0.12%)#58 | 5,902,402(0.02%)#704 |
| 59. | Mastic | 1,284 | 1,068,303(0.12%)#59 | 5,902,402(0.02%)#707 |
| 60. | Baldwin | 1,262 | 1,068,303(0.12%)#60 | 5,902,402(0.02%)#716 |
| 61. | Lynbrook | 1,255 | 1,068,303(0.12%)#61 | 5,902,402(0.02%)#722 |
| 62. | Harrison | 1,230 | 1,068,303(0.12%)#62 | 5,902,402(0.02%)#735 |
| 63. | Greece | 1,226 | 1,068,303(0.11%)#63 | 5,902,402(0.02%)#736 |
| 64. | Huntington Station | 1,194 | 1,068,303(0.11%)#64 | 5,902,402(0.02%)#751 |
| 65. | Commack | 1,160 | 1,068,303(0.11%)#65 | 5,902,402(0.02%)#770 |
| 66. | Mastic Beach | 1,160 | 1,068,303(0.11%)#66 | 5,902,402(0.02%)#771 |
| 67. | Stony Point | 1,158 | 1,068,303(0.11%)#67 | 5,902,402(0.02%)#776 |
| 68. | Rome | 1,155 | 1,068,303(0.11%)#68 | 5,902,402(0.02%)#778 |
| 69. | East Patchogue | 1,145 | 1,068,303(0.11%)#69 | 5,902,402(0.02%)#785 |
| 70. | Haverstraw | 1,139 | 1,068,303(0.11%)#70 | 5,902,402(0.02%)#791 |
| 71. | North Bellmore | 1,128 | 1,068,303(0.11%)#71 | 5,902,402(0.02%)#795 |
| 72. | Roosevelt | 1,110 | 1,068,303(0.10%)#72 | 5,902,402(0.02%)#810 |
| 73. | Islip | 1,108 | 1,068,303(0.10%)#73 | 5,902,402(0.02%)#812 |
| 74. | Hicksville | 1,072 | 1,068,303(0.10%)#74 | 5,902,402(0.02%)#833 |
| 75. | Greenlawn | 1,057 | 1,068,303(0.10%)#75 | 5,902,402(0.02%)#846 |
| 76. | Franklin Square | 1,046 | 1,068,303(0.10%)#76 | 5,902,402(0.02%)#853 |
| 77. | Mount Ivy | 1,025 | 1,068,303(0.10%)#77 | 5,902,402(0.02%)#867 |
| 78. | Tonawanda | 992 | 1,068,303(0.09%)#78 | 5,902,402(0.02%)#886 |
| 79. | Lindenhurst | 984 | 1,068,303(0.09%)#79 | 5,902,402(0.02%)#897 |
| 80. | Ellenville | 980 | 1,068,303(0.09%)#80 | 5,902,402(0.02%)#900 |
| 81. | Spring Valley | 951 | 1,068,303(0.09%)#81 | 5,902,402(0.02%)#930 |
| 82. | Port Jervis | 948 | 1,068,303(0.09%)#82 | 5,902,402(0.02%)#935 |
| 83. | Glen Cove | 946 | 1,068,303(0.09%)#83 | 5,902,402(0.02%)#936 |
| 84. | Lackawanna | 941 | 1,068,303(0.09%)#84 | 5,902,402(0.02%)#942 |
| 85. | Smithtown | 938 | 1,068,303(0.09%)#85 | 5,902,402(0.02%)#945 |
| 86. | Lake Grove | 931 | 1,068,303(0.09%)#86 | 5,902,402(0.02%)#952 |
| 87. | Wyandanch | 919 | 1,068,303(0.09%)#87 | 5,902,402(0.02%)#966 |
| 88. | Kingston | 917 | 1,068,303(0.09%)#88 | 5,902,402(0.02%)#969 |
| 89. | North Babylon | 912 | 1,068,303(0.09%)#89 | 5,902,402(0.02%)#973 |
| 90. | North Bellport | 900 | 1,068,303(0.08%)#90 | 5,902,402(0.02%)#981 |
| 91. | West Islip | 897 | 1,068,303(0.08%)#91 | 5,902,402(0.02%)#983 |
| 92. | Merrick | 892 | 1,068,303(0.08%)#92 | 5,902,402(0.02%)#989 |
| 93. | Watertown | 879 | 1,068,303(0.08%)#93 | 5,902,402(0.01%)#997 |
| 94. | West Hempstead | 877 | 1,068,303(0.08%)#94 | 5,902,402(0.01%)#1,000 |
| 95. | Copiague | 873 | 1,068,303(0.08%)#95 | 5,902,402(0.01%)#1,009 |
| 96. | West Seneca | 866 | 1,068,303(0.08%)#96 | 5,902,402(0.01%)#1,015 |
| 97. | Nesconset | 835 | 1,068,303(0.08%)#97 | 5,902,402(0.01%)#1,044 |
| 98. | Jefferson Valley Yorktown | 832 | 1,068,303(0.08%)#98 | 5,902,402(0.01%)#1,049 |
| 99. | South Farmingdale | 825 | 1,068,303(0.08%)#99 | 5,902,402(0.01%)#1,057 |
| 100. | Miller Place | 817 | 1,068,303(0.08%)#100 | 5,902,402(0.01%)#1,061 |
Common Questions
What are the Top 10 Cities with the Largest Puerto Rican Community in New York?
Top 10 Cities with the Largest Puerto Rican Community in New York are:
#1
645,158
#2
30,916
#3
24,857
#4
17,964
#5
8,084
#6
7,110
#7
4,900
#8
4,736
#9
4,597
#10
4,588
What city has the Largest Puerto Rican Community in New York?
New York has the Largest Puerto Rican Community in New York with 645,158.
What is the Total Puerto Rican Population in the State of New York?
Total Puerto Rican Population in New York is 1,068,303.
What is the Total Puerto Rican Population in the United States?
Total Puerto Rican Population in the United States is 5,902,402.