Zip Codes with the Highest Percentage of Population Employed in Food Preparation & Serving in Brooklyn, NY
RELATED REPORTS & OPTIONS
Food Preparation & Serving
Brooklyn
Compare Zip Codes
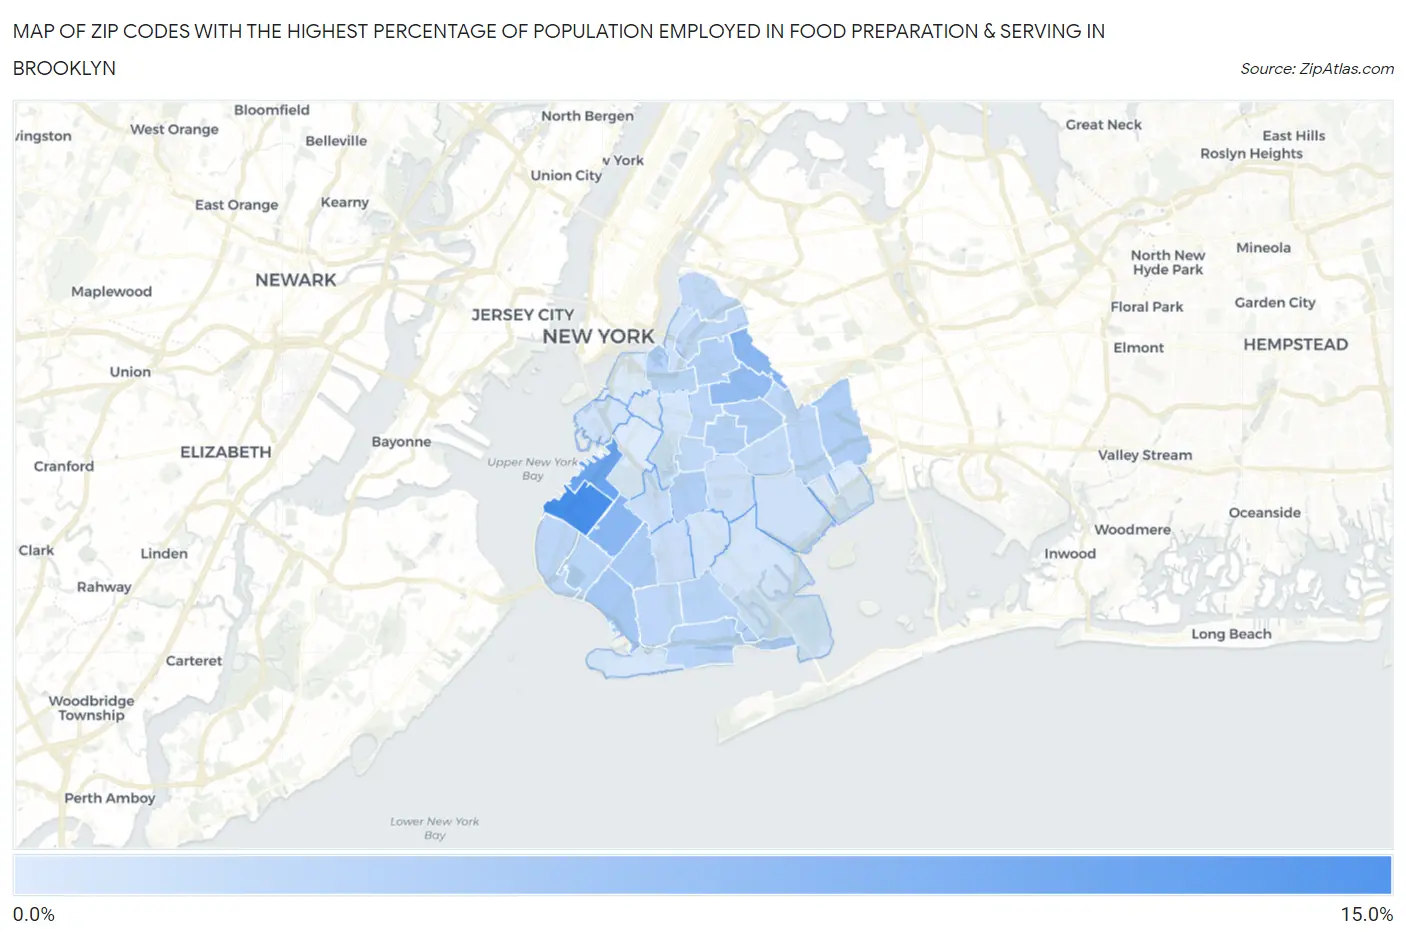
Map of Zip Codes with the Highest Percentage of Population Employed in Food Preparation & Serving in Brooklyn
1.8%
14.5%
Zip Codes with the Highest Percentage of Population Employed in Food Preparation & Serving in Brooklyn, NY
| Zip Code | % Employed | vs State | vs National | |
| 1. | 11220 | 14.5% | 4.8%(+9.65)#56 | 5.3%(+9.18)#1,066 |
| 2. | 11232 | 11.2% | 4.8%(+6.39)#105 | 5.3%(+5.92)#1,959 |
| 3. | 11237 | 8.7% | 4.8%(+3.89)#194 | 5.3%(+3.42)#3,844 |
| 4. | 11219 | 8.6% | 4.8%(+3.79)#202 | 5.3%(+3.32)#3,966 |
| 5. | 11221 | 7.8% | 4.8%(+2.99)#248 | 5.3%(+2.52)#5,039 |
| 6. | 11214 | 6.1% | 4.8%(+1.26)#437 | 5.3%(+0.786)#9,109 |
| 7. | 11204 | 5.8% | 4.8%(+0.997)#486 | 5.3%(+0.526)#9,991 |
| 8. | 11233 | 5.6% | 4.8%(+0.742)#529 | 5.3%(+0.272)#10,848 |
| 9. | 11226 | 5.5% | 4.8%(+0.646)#540 | 5.3%(+0.176)#11,177 |
| 10. | 11208 | 5.4% | 4.8%(+0.579)#556 | 5.3%(+0.109)#11,424 |
| 11. | 11206 | 5.2% | 4.8%(+0.351)#589 | 5.3%(-0.120)#12,292 |
| 12. | 11213 | 5.0% | 4.8%(+0.195)#615 | 5.3%(-0.275)#12,904 |
| 13. | 11235 | 4.6% | 4.8%(-0.243)#720 | 5.3%(-0.713)#14,729 |
| 14. | 11228 | 4.6% | 4.8%(-0.254)#726 | 5.3%(-0.724)#14,777 |
| 15. | 11229 | 4.6% | 4.8%(-0.256)#727 | 5.3%(-0.727)#14,792 |
| 16. | 11205 | 4.5% | 4.8%(-0.284)#733 | 5.3%(-0.754)#14,890 |
| 17. | 11216 | 4.5% | 4.8%(-0.343)#746 | 5.3%(-0.813)#15,133 |
| 18. | 11207 | 4.4% | 4.8%(-0.392)#759 | 5.3%(-0.863)#15,321 |
| 19. | 11209 | 4.4% | 4.8%(-0.402)#762 | 5.3%(-0.873)#15,354 |
| 20. | 11223 | 4.3% | 4.8%(-0.508)#789 | 5.3%(-0.979)#15,864 |
| 21. | 11211 | 4.2% | 4.8%(-0.637)#813 | 5.3%(-1.11)#16,411 |
| 22. | 11225 | 4.0% | 4.8%(-0.814)#857 | 5.3%(-1.28)#17,118 |
| 23. | 11222 | 4.0% | 4.8%(-0.854)#867 | 5.3%(-1.32)#17,274 |
| 24. | 11212 | 3.8% | 4.8%(-1.03)#907 | 5.3%(-1.50)#17,995 |
| 25. | 11218 | 3.5% | 4.8%(-1.34)#975 | 5.3%(-1.81)#19,295 |
| 26. | 11230 | 3.2% | 4.8%(-1.59)#1,041 | 5.3%(-2.06)#20,389 |
| 27. | 11203 | 3.1% | 4.8%(-1.68)#1,060 | 5.3%(-2.15)#20,708 |
| 28. | 11249 | 2.9% | 4.8%(-1.90)#1,120 | 5.3%(-2.37)#21,556 |
| 29. | 11236 | 2.8% | 4.8%(-1.97)#1,141 | 5.3%(-2.44)#21,895 |
| 30. | 11231 | 2.7% | 4.8%(-2.12)#1,183 | 5.3%(-2.60)#22,451 |
| 31. | 11210 | 2.6% | 4.8%(-2.25)#1,207 | 5.3%(-2.72)#22,931 |
| 32. | 11238 | 2.5% | 4.8%(-2.27)#1,210 | 5.3%(-2.74)#22,981 |
| 33. | 11234 | 2.5% | 4.8%(-2.31)#1,224 | 5.3%(-2.78)#23,148 |
| 34. | 11224 | 2.4% | 4.8%(-2.38)#1,236 | 5.3%(-2.85)#23,358 |
| 35. | 11217 | 2.0% | 4.8%(-2.86)#1,325 | 5.3%(-3.33)#24,823 |
| 36. | 11239 | 1.9% | 4.8%(-2.91)#1,340 | 5.3%(-3.38)#24,988 |
| 37. | 11201 | 1.9% | 4.8%(-2.94)#1,345 | 5.3%(-3.41)#25,078 |
| 38. | 11215 | 1.8% | 4.8%(-2.99)#1,354 | 5.3%(-3.46)#25,202 |
1
Common Questions
What are the Top 10 Zip Codes with the Highest Percentage of Population Employed in Food Preparation & Serving in Brooklyn, NY?
Top 10 Zip Codes with the Highest Percentage of Population Employed in Food Preparation & Serving in Brooklyn, NY are:
What zip code has the Highest Percentage of Population Employed in Food Preparation & Serving in Brooklyn, NY?
11220 has the Highest Percentage of Population Employed in Food Preparation & Serving in Brooklyn, NY with 14.5%.
What is the Percentage of Population Employed in Food Preparation & Serving in New York?
Percentage of Population Employed in Food Preparation & Serving in New York is 4.8%.
What is the Percentage of Population Employed in Food Preparation & Serving in the United States?
Percentage of Population Employed in Food Preparation & Serving in the United States is 5.3%.