Cities with the Highest Percentage of French American Indian Population in New York

RELATED REPORTS & OPTIONS

French American Indian
Population
Families and Households
Female Fertility
Female Fertility (Unmarried)
Race (Community Size)
Race (Percentage)
Ancestry (Community Size)
AfghanAfricanAlaska NativeAlaskan AthabascanAlbanianAleutAlsatianAmericanApacheArabArapahoArgentineanArmenianAssyrian / Chaldean / SyriacAustralianAustrianBahamianBangladeshiBarbadianBasqueBelgianBelizeanBermudanBhutaneseBlackfeetBolivianBrazilianBritishBritish West IndianBulgarianBurmeseCajunCambodianCanadianCape VerdeanCarpatho RusynCelticCentral AmericanCentral American IndianCherokeeCheyenneChickasawChileanChineseChippewaChoctawColombianColvilleComancheCosta RicanCreeCreekCroatianCrowCubanCypriotCzechCzechoslovakianDanishDelawareDominicanDutchDutch West IndianEastern EuropeanEcuadorianEgyptianEnglishEstonianEthiopianEuropeanFijianFilipinoFinnishFrenchFrench American IndianFrench CanadianGermanGerman RussianGhanaianGreekGuamanian / ChamorroGuatemalanGuyaneseHaitianHmongHonduranHopiHoumaHungarianIcelanderIndian (Asian)IndonesianInupiatIranianIraqiIrishIroquoisIsraeliItalianJamaicanJapaneseJordanianKenyanKiowaKoreanLaotianLatvianLebaneseLiberianLithuanianLumbeeLuxembourgerMacedonianMalaysianMalteseMarshalleseMenomineeMexicanMexican American IndianMongolianMoroccanNative HawaiianNavajoNepaleseNew ZealanderNicaraguanNigerianNorthern EuropeanNorwegianOkinawanOsageOttawaPaiutePakistaniPalestinianPanamanianParaguayanPennsylvania GermanPeruvianPimaPolishPortuguesePotawatomiPuebloPuerto RicanPuget Sound SalishRomanianRussianSalvadoranSamoanScandinavianScotch-IrishScottishSeminoleSenegaleseSerbianShoshoneSierra LeoneanSiouxSlavicSlovakSloveneSomaliSouth AfricanSouth AmericanSouth American IndianSoviet UnionSpaniardSpanishSpanish AmericanSpanish American IndianSri LankanSubsaharan AfricanSudaneseSwedishSwissSyrianTaiwaneseThaiTlingit-HaidaTohono O'OdhamTonganTrinidadian and TobagonianTsimshianTurkishU.S. Virgin IslanderUgandanUkrainianUruguayanUteVenezuelanVietnameseWelshWest IndianYakamaYaquiYugoslavianYumanYup'ikZimbabwean
Ancestry (Percentage)
AfghanAfricanAlaska NativeAlaskan AthabascanAlbanianAleutAlsatianAmericanApacheArabArapahoArgentineanArmenianAssyrian / Chaldean / SyriacAustralianAustrianBahamianBangladeshiBarbadianBasqueBelgianBelizeanBermudanBhutaneseBlackfeetBolivianBrazilianBritishBritish West IndianBulgarianBurmeseCajunCambodianCanadianCape VerdeanCarpatho RusynCelticCentral AmericanCentral American IndianCherokeeCheyenneChickasawChileanChineseChippewaChoctawColombianColvilleComancheCosta RicanCreeCreekCroatianCrowCubanCypriotCzechCzechoslovakianDanishDelawareDominicanDutchDutch West IndianEastern EuropeanEcuadorianEgyptianEnglishEstonianEthiopianEuropeanFijianFilipinoFinnishFrenchFrench American IndianFrench CanadianGermanGerman RussianGhanaianGreekGuamanian / ChamorroGuatemalanGuyaneseHaitianHmongHonduranHopiHoumaHungarianIcelanderIndian (Asian)IndonesianInupiatIranianIraqiIrishIroquoisIsraeliItalianJamaicanJapaneseJordanianKenyanKiowaKoreanLaotianLatvianLebaneseLiberianLithuanianLumbeeLuxembourgerMacedonianMalaysianMalteseMarshalleseMenomineeMexicanMexican American IndianMongolianMoroccanNative HawaiianNavajoNepaleseNew ZealanderNicaraguanNigerianNorthern EuropeanNorwegianOkinawanOsageOttawaPaiutePakistaniPalestinianPanamanianParaguayanPennsylvania GermanPeruvianPimaPolishPortuguesePotawatomiPuebloPuerto RicanPuget Sound SalishRomanianRussianSalvadoranSamoanScandinavianScotch-IrishScottishSeminoleSenegaleseSerbianShoshoneSierra LeoneanSiouxSlavicSlovakSloveneSomaliSouth AfricanSouth AmericanSouth American IndianSoviet UnionSpaniardSpanishSpanish AmericanSpanish American IndianSri LankanSubsaharan AfricanSudaneseSwedishSwissSyrianTaiwaneseThaiTlingit-HaidaTohono O'OdhamTonganTrinidadian and TobagonianTsimshianTurkishU.S. Virgin IslanderUgandanUkrainianUruguayanUteVenezuelanVietnameseWelshWest IndianYakamaYaquiYugoslavianYumanYup'ikZimbabwean
Immigrant Origin (Total)
AfghanistanAfricaAlbaniaArgentinaArmeniaAsiaAustraliaAustriaAzoresBahamasBangladeshBarbadosBelarusBelgiumBelizeBoliviaBosnia and HerzegovinaBrazilBulgariaBurma / MyanmarCabo VerdeCambodiaCameroonCanadaCaribbeanCentral AmericaChileChinaColombiaCongoCosta RicaCroatiaCubaCzechoslovakiaDenmarkDominicaDominican RepublicEastern AfricaEastern AsiaEastern EuropeEcuadorEgyptEl SalvadorEnglandEritreaEthiopiaEuropeFijiFranceGermanyGhanaGreeceGrenadaGuatemalaGuyanaHaitiHondurasHong KongHungaryIndiaIndonesiaIranIraqIrelandIsraelItalyJamaicaJapanJordanKazakhstanKenyaKoreaKuwaitLaosLatin AmericaLatviaLebanonLiberiaLithuaniaMalaysiaMexicoMicronesiaMiddle AfricaMoldovaMoroccoNepalNetherlandsNicaraguaNigeriaNorth MacedoniaNorthern AfricaNorthern EuropeNorwayOceaniaPakistanPanamaPeruPhilippinesPolandPortugalRomaniaRussiaSaudi ArabiaScotlandSenegalSerbiaSierra LeoneSingaporeSomaliaSouth AfricaSouth AmericaSouth Central AsiaSouth Eastern AsiaSouthern EuropeSpainSri LankaSt. Vincent and the GrenadinesSudanSwedenSwitzerlandSyriaTaiwanThailandTrinidad and TobagoTurkeyUgandaUkraineUruguayUzbekistanVenezuelaVietnamWest IndiesWestern AfricaWestern AsiaWestern EuropeYemenZaireZimbabwe
Immigrant Origin (Percentage)
AfghanistanAfricaAlbaniaArgentinaArmeniaAsiaAustraliaAustriaAzoresBahamasBangladeshBarbadosBelarusBelgiumBelizeBoliviaBosnia and HerzegovinaBrazilBulgariaBurma / MyanmarCabo VerdeCambodiaCameroonCanadaCaribbeanCentral AmericaChileChinaColombiaCongoCosta RicaCroatiaCubaCzechoslovakiaDenmarkDominicaDominican RepublicEastern AfricaEastern AsiaEastern EuropeEcuadorEgyptEl SalvadorEnglandEritreaEthiopiaEuropeFijiFranceGermanyGhanaGreeceGrenadaGuatemalaGuyanaHaitiHondurasHong KongHungaryIndiaIndonesiaIranIraqIrelandIsraelItalyJamaicaJapanJordanKazakhstanKenyaKoreaKuwaitLaosLatin AmericaLatviaLebanonLiberiaLithuaniaMalaysiaMexicoMicronesiaMiddle AfricaMoldovaMoroccoNepalNetherlandsNicaraguaNigeriaNorth MacedoniaNorthern AfricaNorthern EuropeNorwayOceaniaPakistanPanamaPeruPhilippinesPolandPortugalRomaniaRussiaSaudi ArabiaScotlandSenegalSerbiaSierra LeoneSingaporeSomaliaSouth AfricaSouth AmericaSouth Central AsiaSouth Eastern AsiaSouthern EuropeSpainSri LankaSt. Vincent and the GrenadinesSudanSwedenSwitzerlandSyriaTaiwanThailandTrinidad and TobagoTurkeyUgandaUkraineUruguayUzbekistanVenezuelaVietnamWest IndiesWestern AfricaWestern AsiaWestern EuropeYemenZaireZimbabwe
Income
Income (Families)
Income (Households)
Poverty
Poverty (Families)
Unemployment
Employment Occupations
Employment Industries
Employer Class
Commute Time
Commute Means
School Enrollment
Education by Degree Field
Occupancy
Finances
Physical Characteristics
New York
Compare Cities
Comparison Subject

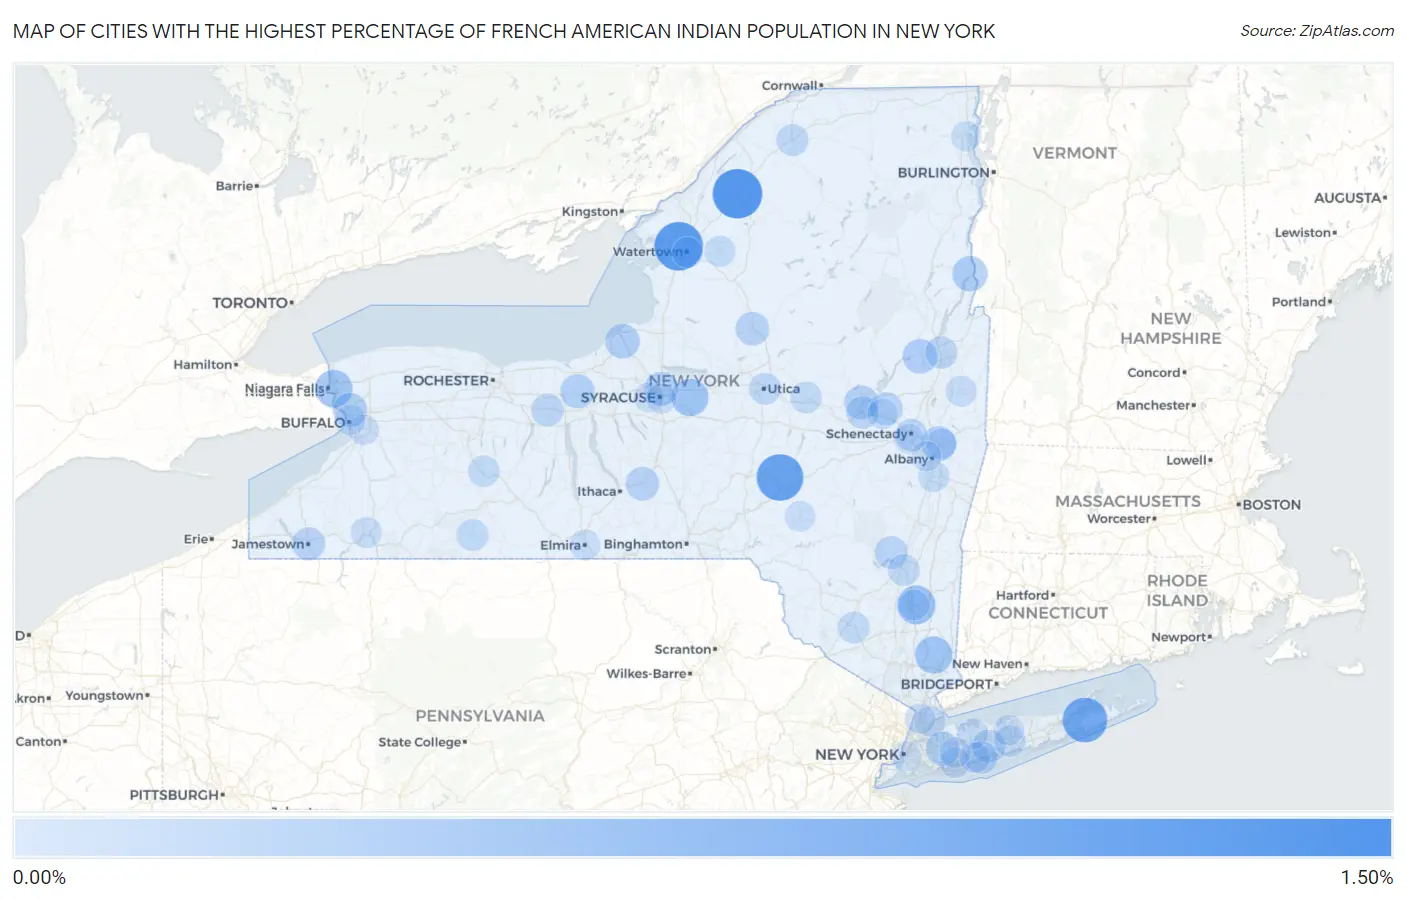
Map of Cities with the Highest Percentage of French American Indian Population in New York

0.00%
1.50%
Cities with the Highest Percentage of French American Indian Population in New York Map

Cities with the Highest Percentage of French American Indian Population in New York

City French American Indian vs State vs National
1.Akwesasne1.38%0.011%(+1.37)#10.010%(+1.37)#68
2.Gouverneur1.26%0.011%(+1.25)#20.010%(+1.25)#75
3.Brownville1.19%0.011%(+1.18)#30.010%(+1.18)#81
4.Laurens1.08%0.011%(+1.06)#40.010%(+1.07)#92
5.North Sea0.94%0.011%(+0.931)#50.010%(+0.931)#102
6.Arlington0.54%0.011%(+0.530)#60.010%(+0.530)#181
7.Niagara Falls0.47%0.011%(+0.461)#70.010%(+0.462)#201
8.Mahopac0.46%0.011%(+0.445)#80.010%(+0.446)#208
9.Chittenango0.45%0.011%(+0.439)#90.010%(+0.440)#209
10.Ticonderoga0.32%0.011%(+0.313)#100.010%(+0.314)#273
11.Green Island0.30%0.011%(+0.292)#110.010%(+0.293)#285
12.Hadley0.28%0.011%(+0.269)#120.010%(+0.270)#303
13.Minetto0.28%0.011%(+0.269)#130.010%(+0.270)#304
14.Clyde0.26%0.011%(+0.245)#140.010%(+0.246)#324
15.Kenmore0.25%0.011%(+0.240)#150.010%(+0.241)#331
16.Garden City Park0.24%0.011%(+0.233)#160.010%(+0.234)#339
17.Johnstown0.24%0.011%(+0.232)#170.010%(+0.233)#340
18.Mattydale0.24%0.011%(+0.229)#180.010%(+0.230)#342
19.Dryden0.22%0.011%(+0.207)#190.010%(+0.208)#370
20.Boonville0.21%0.011%(+0.198)#200.010%(+0.199)#380
21.Jamestown0.18%0.011%(+0.167)#210.010%(+0.168)#415
22.Woodstock0.17%0.011%(+0.163)#220.010%(+0.164)#425
23.Hagaman0.17%0.011%(+0.162)#230.010%(+0.163)#428
24.North Bay Shore0.17%0.011%(+0.158)#240.010%(+0.158)#432
25.Fultonville0.15%0.011%(+0.138)#250.010%(+0.139)#453
26.Clifton Springs0.15%0.011%(+0.136)#260.010%(+0.137)#457
27.Babylon0.14%0.011%(+0.129)#270.010%(+0.129)#471
28.Schenectady0.14%0.011%(+0.125)#280.010%(+0.126)#477
29.Glens Falls North0.13%0.011%(+0.122)#290.010%(+0.123)#482
30.Potsdam0.12%0.011%(+0.106)#300.010%(+0.107)#513
31.Roessleville0.11%0.011%(+0.101)#310.010%(+0.102)#522
32.Utica0.11%0.011%(+0.097)#320.010%(+0.098)#531
33.Bloomingburg0.10%0.011%(+0.093)#330.010%(+0.094)#540
34.Kingston0.100%0.011%(+0.089)#340.010%(+0.090)#550
35.Andover0.098%0.011%(+0.087)#350.010%(+0.088)#553
36.Little Falls0.087%0.011%(+0.076)#360.010%(+0.077)#578
37.Dansville0.084%0.011%(+0.073)#370.010%(+0.074)#586
38.Holbrook0.081%0.011%(+0.070)#380.010%(+0.071)#593
39.Castleton On Hudson0.068%0.011%(+0.057)#390.010%(+0.057)#635
40.West Carthage0.061%0.011%(+0.050)#400.010%(+0.051)#662
41.Greenwich0.055%0.011%(+0.044)#410.010%(+0.045)#685
42.Salamanca0.051%0.011%(+0.040)#420.010%(+0.041)#705
43.Huntington Station0.046%0.011%(+0.035)#430.010%(+0.036)#722
44.Poughkeepsie0.041%0.011%(+0.030)#440.010%(+0.031)#743
45.Watertown0.036%0.011%(+0.025)#450.010%(+0.026)#776
46.Centereach0.034%0.011%(+0.024)#460.010%(+0.024)#788
47.Merrick0.033%0.011%(+0.022)#470.010%(+0.023)#797
48.Delhi0.032%0.011%(+0.021)#480.010%(+0.022)#806
49.Elmira0.030%0.011%(+0.019)#490.010%(+0.020)#819
50.New Rochelle0.025%0.011%(+0.014)#500.010%(+0.015)#865
51.West Seneca0.024%0.011%(+0.013)#510.010%(+0.014)#869
52.Buffalo0.023%0.011%(+0.013)#520.010%(+0.013)#872
53.Lindenhurst0.022%0.011%(+0.011)#530.010%(+0.012)#884
54.Amsterdam0.022%0.011%(+0.011)#540.010%(+0.012)#885
55.Yonkers0.020%0.011%(+0.010)#550.010%(+0.010)#901
56.Troy0.018%0.011%(+0.007)#560.010%(+0.007)#928
57.East Meadow0.016%0.011%(+0.005)#570.010%(+0.006)#935
58.Plattsburgh0.015%0.011%(+0.004)#580.010%(+0.005)#944
59.Fairmount0.010%0.011%(-0.001)#590.010%(-0.000)#1,004
60.Rotterdam0.0088%0.011%(-0.002)#600.010%(-0.001)#1,020
61.Albany0.0050%0.011%(-0.006)#610.010%(-0.005)#1,076
62.Syracuse0.0048%0.011%(-0.006)#620.010%(-0.005)#1,081
63.New York0.0023%0.011%(-0.009)#630.010%(-0.008)#1,134

Common Questions

What are the Top 10 Cities with the Highest Percentage of French American Indian Population in New York?
Top 10 Cities with the Highest Percentage of French American Indian Population in New York are:
#1
1.26%
#2
1.19%
#3
1.08%
#4
0.94%
#5
0.54%
#6
0.47%
#7
0.46%
#8
0.45%
#9
0.32%
#10
0.30%
What city has the Highest Percentage of French American Indian Population in New York?
Gouverneur has the Highest Percentage of French American Indian Population in New York with 1.26%.
What is the Percentage of French American Indian Population in the State of New York?
Percentage of French American Indian Population in New York is 0.011%.
What is the Percentage of French American Indian Population in the United States?
Percentage of French American Indian Population in the United States is 0.010%.