SUNY Oswego, NY Map & Demographics
SUNY Oswego Map
SUNY Oswego Overview
$8,002
PER CAPITA INCOME
0.9%
WAGE / INCOME GAP [ % ]
99.1¢/ $1
WAGE / INCOME GAP [ $ ]
3,338
TOTAL POPULATION
1,708
MALE POPULATION
1,630
FEMALE POPULATION
104.79
MALES / 100 FEMALES
95.43
FEMALES / 100 MALES
19.4
MEDIAN AGE
1,399
LABOR FORCE [ PEOPLE ]
41.9%
PERCENT IN LABOR FORCE
23.8%
UNEMPLOYMENT RATE
Income in SUNY Oswego
Income Overview in SUNY Oswego
| Characteristic | Number | Measure |
| Per Capita Income | 3,338 | $8,002 |
| Median Family Income | 0 | $0 |
| Mean Family Income | 0 | $0 |
| Median Household Income | 11 | $0 |
| Mean Household Income | 11 | $0 |
| Income Deficit | 0 | $0 |
| Wage / Income Gap (%) | 3,338 | 0.90% |
| Wage / Income Gap ($) | 3,338 | 99.10¢ per $1 |
| Gini / Inequality Index | 3,338 | 0.00 |
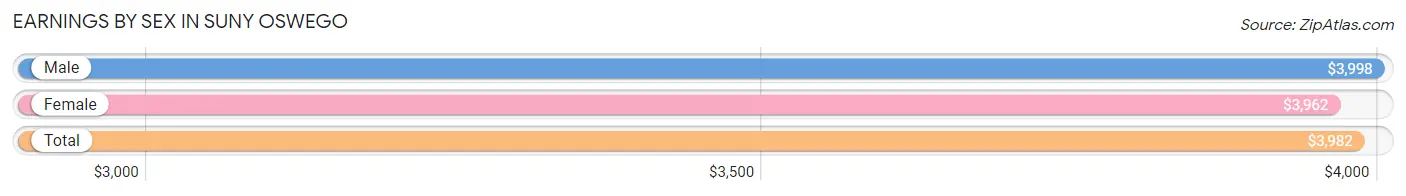
Earnings by Sex in SUNY Oswego
Average Earnings in SUNY Oswego are $3,982, $3,998 for men and $3,962 for women, a difference of 0.9%.
| Sex | Number | Average Earnings |
| Male | 1,408 (49.6%) | $3,998 |
| Female | 1,432 (50.4%) | $3,962 |
| Total | 2,840 (100.0%) | $3,982 |
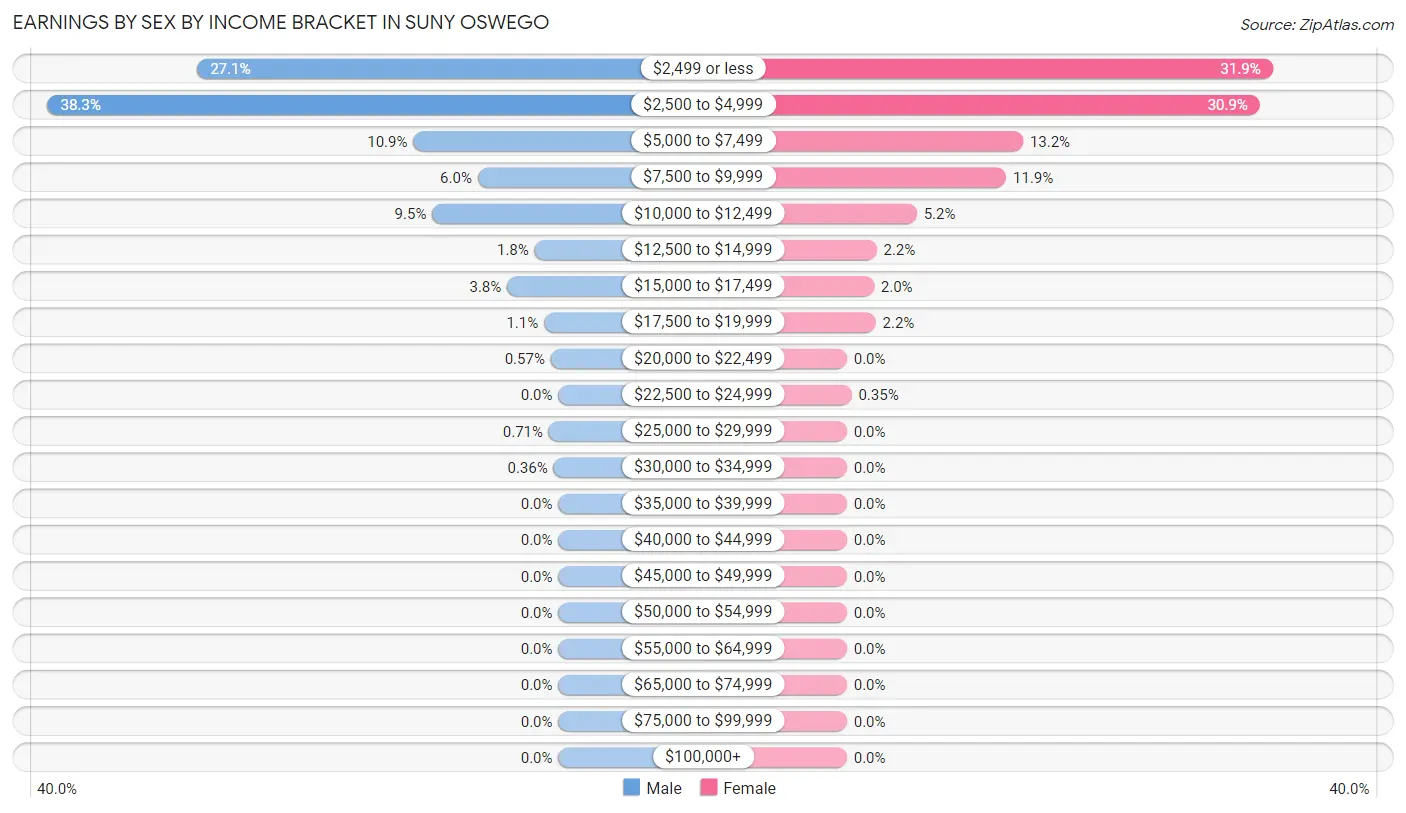
Earnings by Sex by Income Bracket in SUNY Oswego
The most common earnings brackets in SUNY Oswego are $2,500 to $4,999 for men (539 | 38.3%) and $2,499 or less for women (457 | 31.9%).
| Income | Male | Female |
| $2,499 or less | 381 (27.1%) | 457 (31.9%) |
| $2,500 to $4,999 | 539 (38.3%) | 443 (30.9%) |
| $5,000 to $7,499 | 153 (10.9%) | 189 (13.2%) |
| $7,500 to $9,999 | 85 (6.0%) | 171 (11.9%) |
| $10,000 to $12,499 | 133 (9.5%) | 75 (5.2%) |
| $12,500 to $14,999 | 25 (1.8%) | 32 (2.2%) |
| $15,000 to $17,499 | 54 (3.8%) | 29 (2.0%) |
| $17,500 to $19,999 | 15 (1.1%) | 31 (2.2%) |
| $20,000 to $22,499 | 8 (0.6%) | 0 (0.0%) |
| $22,500 to $24,999 | 0 (0.0%) | 5 (0.4%) |
| $25,000 to $29,999 | 10 (0.7%) | 0 (0.0%) |
| $30,000 to $34,999 | 5 (0.4%) | 0 (0.0%) |
| $35,000 to $39,999 | 0 (0.0%) | 0 (0.0%) |
| $40,000 to $44,999 | 0 (0.0%) | 0 (0.0%) |
| $45,000 to $49,999 | 0 (0.0%) | 0 (0.0%) |
| $50,000 to $54,999 | 0 (0.0%) | 0 (0.0%) |
| $55,000 to $64,999 | 0 (0.0%) | 0 (0.0%) |
| $65,000 to $74,999 | 0 (0.0%) | 0 (0.0%) |
| $75,000 to $99,999 | 0 (0.0%) | 0 (0.0%) |
| $100,000+ | 0 (0.0%) | 0 (0.0%) |
| Total | 1,408 (100.0%) | 1,432 (100.0%) |
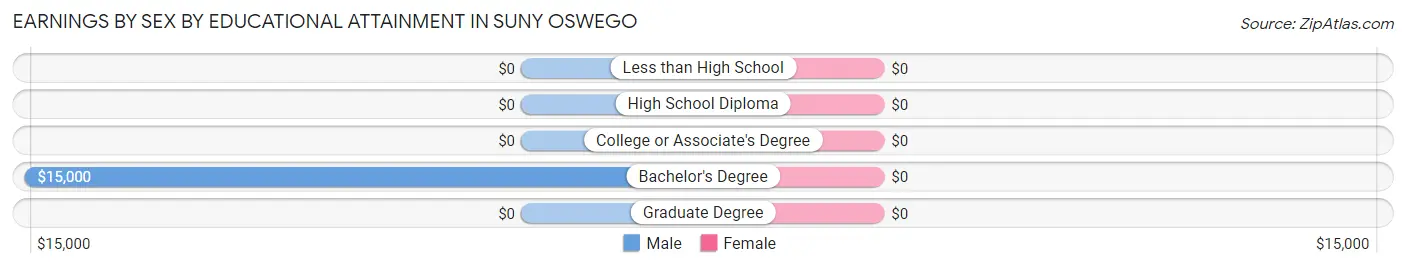
Earnings by Sex by Educational Attainment in SUNY Oswego
| Educational Attainment | Male Income | Female Income |
| Less than High School | - | - |
| High School Diploma | - | - |
| College or Associate's Degree | - | - |
| Bachelor's Degree | $15,000 | $0 |
| Graduate Degree | - | - |
| Total | - | - |
Family Income in SUNY Oswego
Family Income Brackets in SUNY Oswego
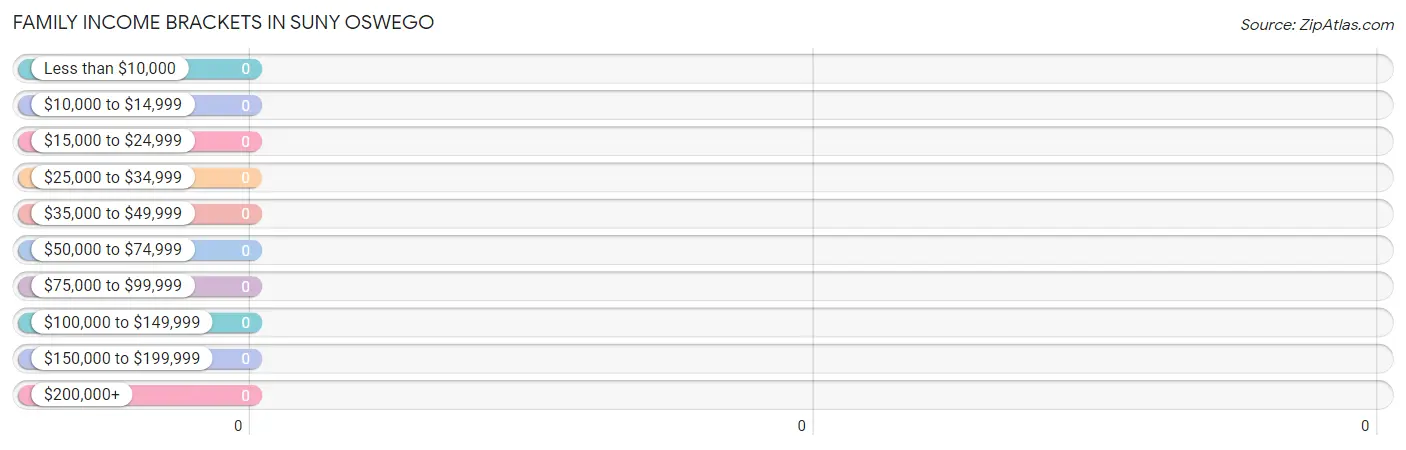
| Income Bracket | # Families | % Families |
| Less than $10,000 | 0 | 0.0% |
| $10,000 to $14,999 | 0 | 0.0% |
| $15,000 to $24,999 | 0 | 0.0% |
| $25,000 to $34,999 | 0 | 0.0% |
| $35,000 to $49,999 | 0 | 0.0% |
| $50,000 to $74,999 | 0 | 0.0% |
| $75,000 to $99,999 | 0 | 0.0% |
| $100,000 to $149,999 | 0 | 0.0% |
| $150,000 to $199,999 | 0 | 0.0% |
| $200,000+ | 0 | 0.0% |
Family Income by Famaliy Size in SUNY Oswego
| Income Bracket | # Families | Median Income |
| 2-Person Families | 0 (0.0%) | $0 |
| 3-Person Families | 0 (0.0%) | $0 |
| 4-Person Families | 0 (0.0%) | $0 |
| 5-Person Families | 0 (0.0%) | $0 |
| 6-Person Families | 0 (0.0%) | $0 |
| 7+ Person Families | 0 (0.0%) | $0 |
| Total | 0 (0.0%) | $0 |
Family Income by Number of Earners in SUNY Oswego
| Number of Earners | # Families | Median Income |
| No Earners | 0 (0.0%) | $0 |
| 1 Earner | 0 (0.0%) | $0 |
| 2 Earners | 0 (0.0%) | $0 |
| 3+ Earners | 0 (0.0%) | $0 |
| Total | 0 (0.0%) | $0 |
Household Income in SUNY Oswego
Household Income Brackets in SUNY Oswego
With 11 households falling in the category, the $15,000 to $24,999 income range is the most frequent in SUNY Oswego, accounting for 100.0% of all households.
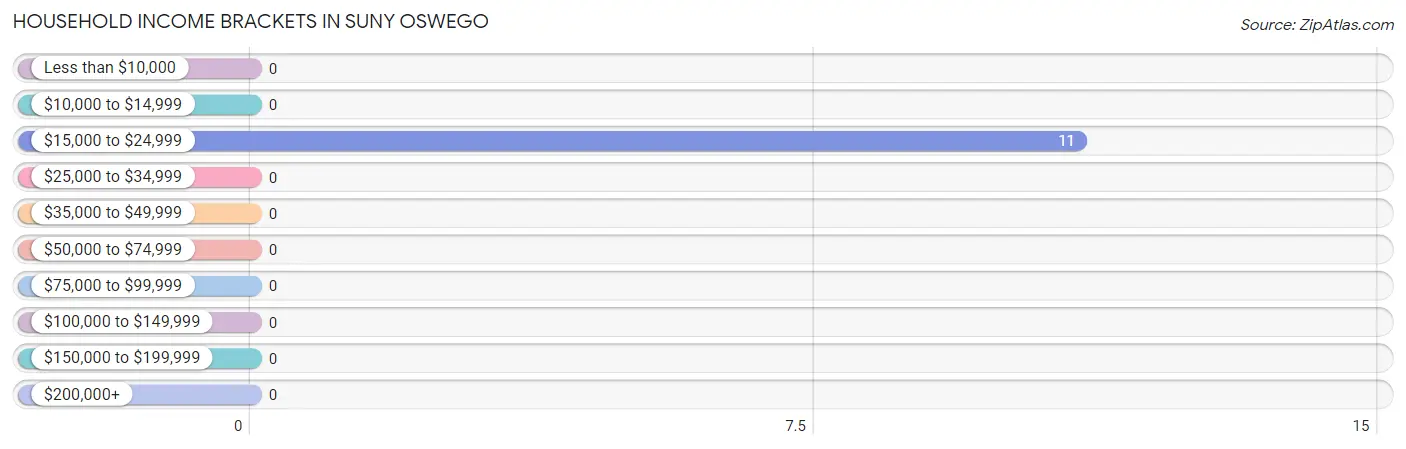
| Income Bracket | # Households | % Households |
| Less than $10,000 | 0 | 0.0% |
| $10,000 to $14,999 | 0 | 0.0% |
| $15,000 to $24,999 | 11 | 100.0% |
| $25,000 to $34,999 | 0 | 0.0% |
| $35,000 to $49,999 | 0 | 0.0% |
| $50,000 to $74,999 | 0 | 0.0% |
| $75,000 to $99,999 | 0 | 0.0% |
| $100,000 to $149,999 | 0 | 0.0% |
| $150,000 to $199,999 | 0 | 0.0% |
| $200,000+ | 0 | 0.0% |
Household Income by Householder Age in SUNY Oswego
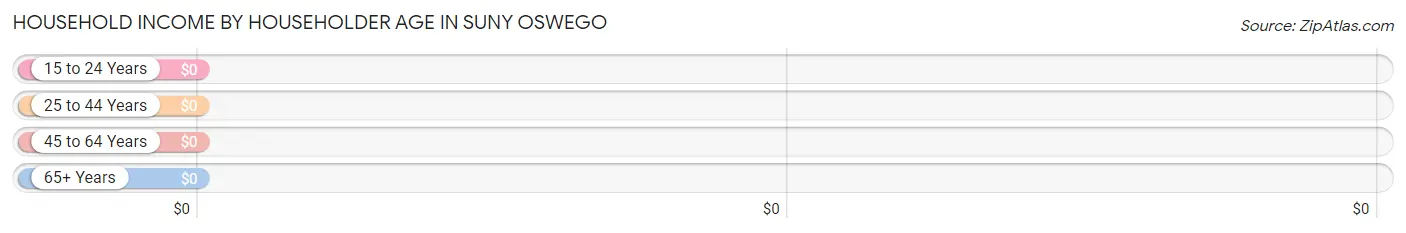
| Income Bracket | # Households | Median Income |
| 15 to 24 Years | 0 (0.0%) | $0 |
| 25 to 44 Years | 11 (100.0%) | $0 |
| 45 to 64 Years | 0 (0.0%) | $0 |
| 65+ Years | 0 (0.0%) | $0 |
| Total | 11 (100.0%) | $0 |
Poverty in SUNY Oswego
Income Below Poverty by Sex and Age in SUNY Oswego
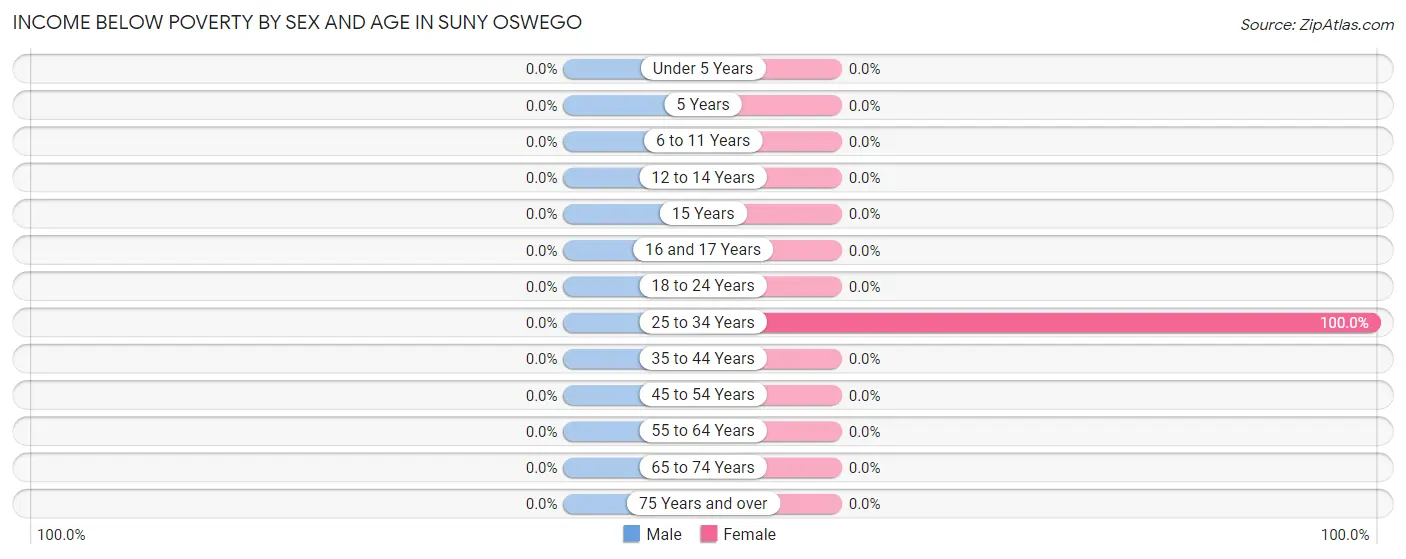
| Age Bracket | Male | Female |
| Under 5 Years | 0 (0.0%) | 0 (0.0%) |
| 5 Years | 0 (0.0%) | 0 (0.0%) |
| 6 to 11 Years | 0 (0.0%) | 0 (0.0%) |
| 12 to 14 Years | 0 (0.0%) | 0 (0.0%) |
| 15 Years | 0 (0.0%) | 0 (0.0%) |
| 16 and 17 Years | 0 (0.0%) | 0 (0.0%) |
| 18 to 24 Years | 0 (0.0%) | 0 (0.0%) |
| 25 to 34 Years | 0 (0.0%) | 11 (100.0%) |
| 35 to 44 Years | 0 (0.0%) | 0 (0.0%) |
| 45 to 54 Years | 0 (0.0%) | 0 (0.0%) |
| 55 to 64 Years | 0 (0.0%) | 0 (0.0%) |
| 65 to 74 Years | 0 (0.0%) | 0 (0.0%) |
| 75 Years and over | 0 (0.0%) | 0 (0.0%) |
| Total | 0 (0.0%) | 11 (100.0%) |
Income Above Poverty by Sex and Age in SUNY Oswego
| Age Bracket | Male | Female |
| Under 5 Years | 0 (0.0%) | 0 (0.0%) |
| 5 Years | 0 (0.0%) | 0 (0.0%) |
| 6 to 11 Years | 0 (0.0%) | 0 (0.0%) |
| 12 to 14 Years | 0 (0.0%) | 0 (0.0%) |
| 15 Years | 0 (0.0%) | 0 (0.0%) |
| 16 and 17 Years | 0 (0.0%) | 0 (0.0%) |
| 18 to 24 Years | 0 (0.0%) | 0 (0.0%) |
| 25 to 34 Years | 0 (0.0%) | 0 (0.0%) |
| 35 to 44 Years | 0 (0.0%) | 0 (0.0%) |
| 45 to 54 Years | 0 (0.0%) | 0 (0.0%) |
| 55 to 64 Years | 0 (0.0%) | 0 (0.0%) |
| 65 to 74 Years | 0 (0.0%) | 0 (0.0%) |
| 75 Years and over | 0 (0.0%) | 0 (0.0%) |
| Total | 0 (0.0%) | 0 (0.0%) |
Income Below Poverty Among Married-Couple Families in SUNY Oswego
| Children | Above Poverty | Below Poverty |
| No Children | 0 (0.0%) | 0 (0.0%) |
| 1 or 2 Children | 0 (0.0%) | 0 (0.0%) |
| 3 or 4 Children | 0 (0.0%) | 0 (0.0%) |
| 5 or more Children | 0 (0.0%) | 0 (0.0%) |
| Total | 0 (0.0%) | 0 (0.0%) |
Income Below Poverty Among Single-Parent Households in SUNY Oswego
| Children | Single Father | Single Mother |
| No Children | 0 (0.0%) | 0 (0.0%) |
| 1 or 2 Children | 0 (0.0%) | 0 (0.0%) |
| 3 or 4 Children | 0 (0.0%) | 0 (0.0%) |
| 5 or more Children | 0 (0.0%) | 0 (0.0%) |
| Total | 0 (0.0%) | 0 (0.0%) |
Income Below Poverty Among Married-Couple vs Single-Parent Households in SUNY Oswego
| Children | Married-Couple Families | Single-Parent Households |
| No Children | 0 (0.0%) | 0 (0.0%) |
| 1 or 2 Children | 0 (0.0%) | 0 (0.0%) |
| 3 or 4 Children | 0 (0.0%) | 0 (0.0%) |
| 5 or more Children | 0 (0.0%) | 0 (0.0%) |
| Total | 0 (0.0%) | 0 (0.0%) |
Race in SUNY Oswego
The most populous races in SUNY Oswego are White / Caucasian (2,246 | 67.3%), Hispanic or Latino (730 | 21.9%), and Black / African American (559 | 16.8%).
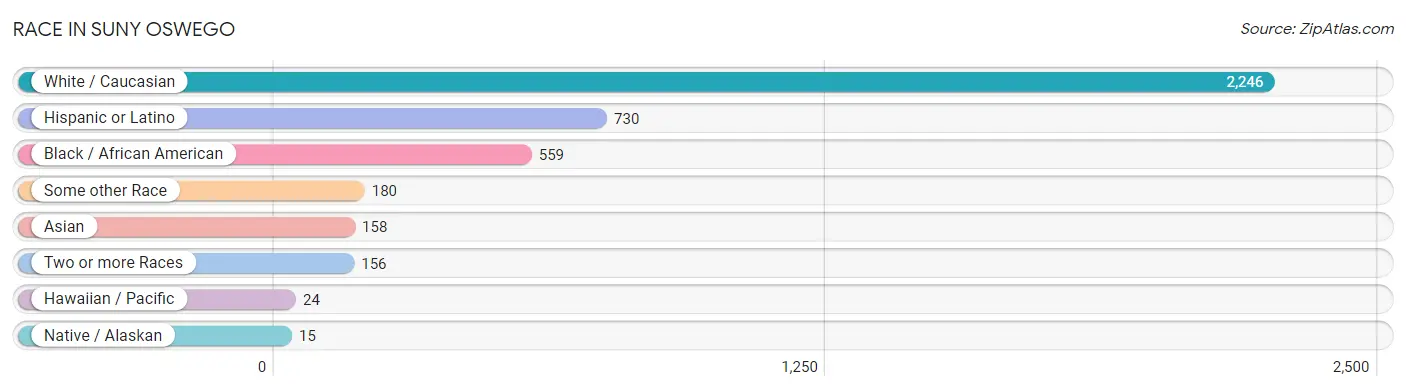
| Race | # Population | % Population |
| Asian | 158 | 4.7% |
| Black / African American | 559 | 16.8% |
| Hawaiian / Pacific | 24 | 0.7% |
| Hispanic or Latino | 730 | 21.9% |
| Native / Alaskan | 15 | 0.4% |
| White / Caucasian | 2,246 | 67.3% |
| Two or more Races | 156 | 4.7% |
| Some other Race | 180 | 5.4% |
| Total | 3,338 | 100.0% |
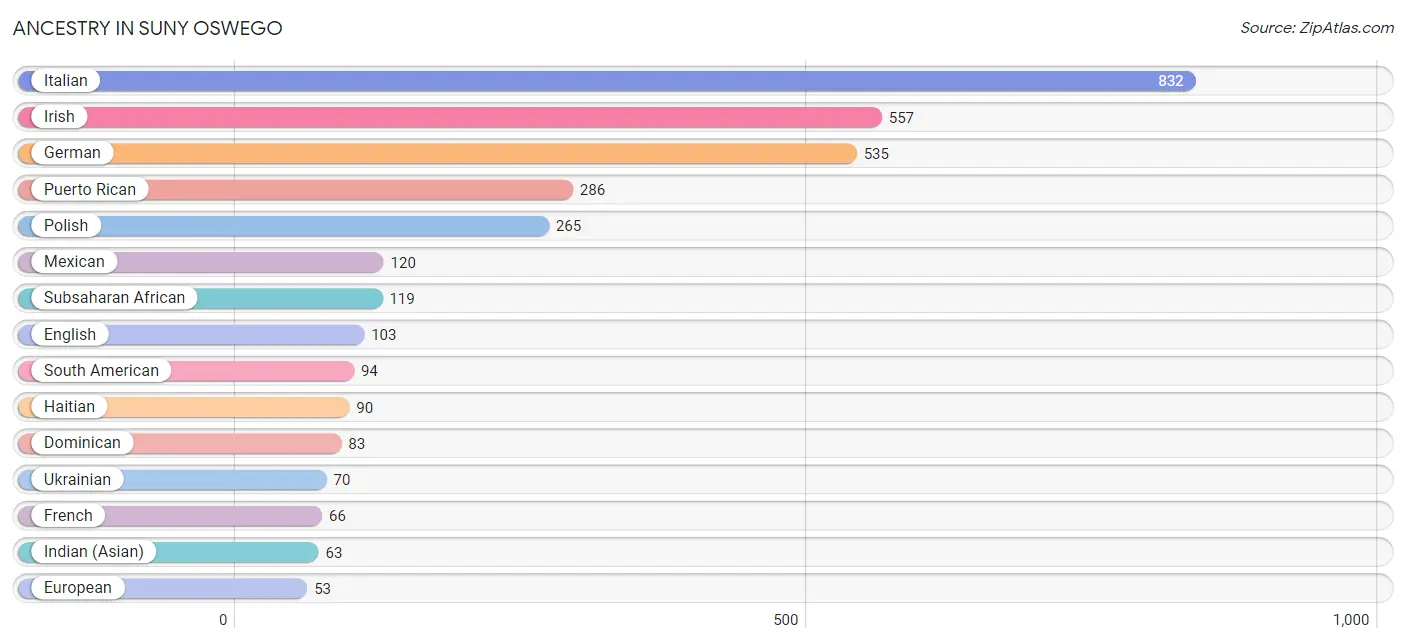
Ancestry in SUNY Oswego
The most populous ancestries reported in SUNY Oswego are Italian (832 | 24.9%), Irish (557 | 16.7%), German (535 | 16.0%), Puerto Rican (286 | 8.6%), and Polish (265 | 7.9%), together accounting for 74.2% of all SUNY Oswego residents.
| Ancestry | # Population | % Population |
| African | 44 | 1.3% |
| American | 19 | 0.6% |
| Armenian | 8 | 0.2% |
| Austrian | 49 | 1.5% |
| Barbadian | 10 | 0.3% |
| Bhutanese | 7 | 0.2% |
| Bolivian | 7 | 0.2% |
| Brazilian | 7 | 0.2% |
| British | 20 | 0.6% |
| Burmese | 6 | 0.2% |
| Canadian | 14 | 0.4% |
| Central American | 49 | 1.5% |
| Chilean | 22 | 0.7% |
| Colombian | 24 | 0.7% |
| Costa Rican | 14 | 0.4% |
| Cuban | 45 | 1.3% |
| Dominican | 83 | 2.5% |
| Dutch | 38 | 1.1% |
| Eastern European | 16 | 0.5% |
| Ecuadorian | 34 | 1.0% |
| English | 103 | 3.1% |
| Ethiopian | 7 | 0.2% |
| European | 53 | 1.6% |
| French | 66 | 2.0% |
| German | 535 | 16.0% |
| Ghanaian | 40 | 1.2% |
| Greek | 17 | 0.5% |
| Guatemalan | 13 | 0.4% |
| Haitian | 90 | 2.7% |
| Hungarian | 18 | 0.5% |
| Indian (Asian) | 63 | 1.9% |
| Iranian | 7 | 0.2% |
| Irish | 557 | 16.7% |
| Iroquois | 10 | 0.3% |
| Israeli | 12 | 0.4% |
| Italian | 832 | 24.9% |
| Jamaican | 51 | 1.5% |
| Korean | 14 | 0.4% |
| Latvian | 13 | 0.4% |
| Maltese | 8 | 0.2% |
| Mexican | 120 | 3.6% |
| Native Hawaiian | 10 | 0.3% |
| Nigerian | 20 | 0.6% |
| Northern European | 5 | 0.2% |
| Norwegian | 24 | 0.7% |
| Panamanian | 15 | 0.4% |
| Peruvian | 7 | 0.2% |
| Polish | 265 | 7.9% |
| Puerto Rican | 286 | 8.6% |
| Russian | 49 | 1.5% |
| Salvadoran | 7 | 0.2% |
| Scandinavian | 15 | 0.4% |
| Scottish | 26 | 0.8% |
| Slovak | 6 | 0.2% |
| South American | 94 | 2.8% |
| Spaniard | 26 | 0.8% |
| Spanish | 15 | 0.4% |
| Sri Lankan | 38 | 1.1% |
| Subsaharan African | 119 | 3.6% |
| Swedish | 16 | 0.5% |
| Swiss | 9 | 0.3% |
| Thai | 19 | 0.6% |
| Trinidadian and Tobagonian | 9 | 0.3% |
| Ukrainian | 70 | 2.1% |
| Vietnamese | 6 | 0.2% |
| West Indian | 17 | 0.5% | View All 66 Rows |
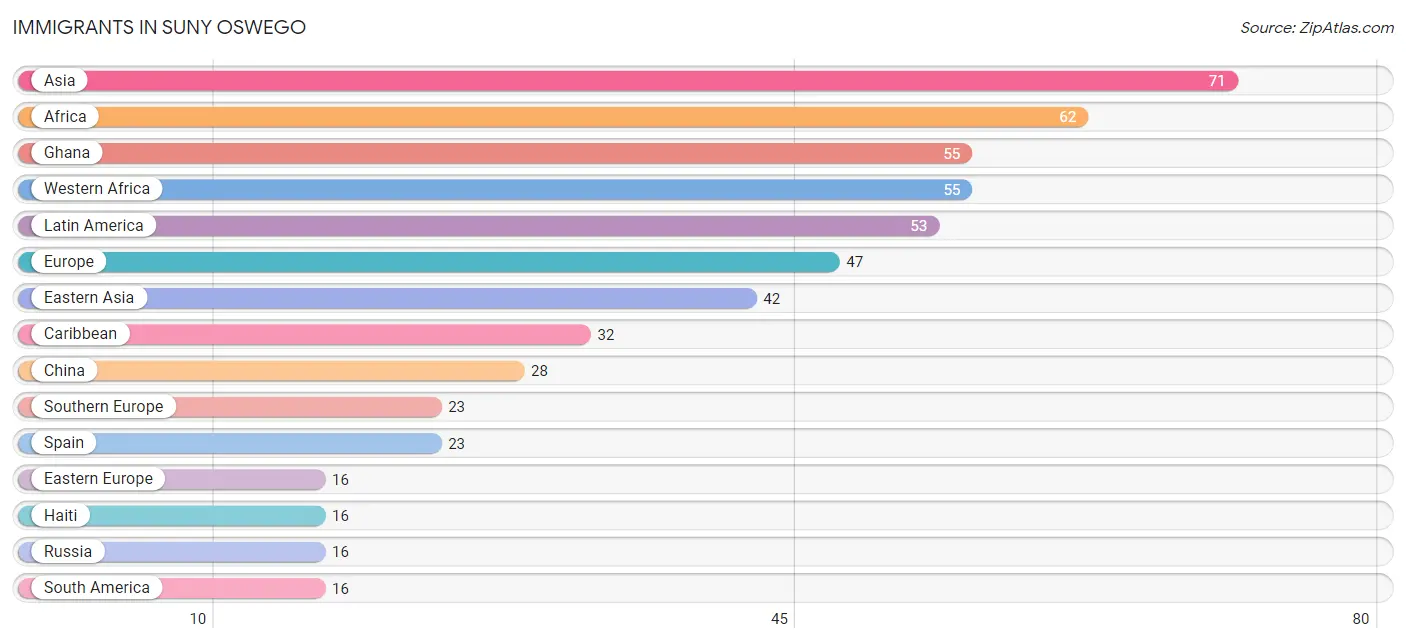
Immigrants in SUNY Oswego
The most numerous immigrant groups reported in SUNY Oswego came from Asia (71 | 2.1%), Africa (62 | 1.9%), Ghana (55 | 1.7%), Western Africa (55 | 1.7%), and Latin America (53 | 1.6%), together accounting for 8.9% of all SUNY Oswego residents.
| Immigration Origin | # Population | % Population |
| Africa | 62 | 1.9% |
| Asia | 71 | 2.1% |
| Brazil | 7 | 0.2% |
| Caribbean | 32 | 1.0% |
| Central America | 5 | 0.2% |
| China | 28 | 0.8% |
| Colombia | 9 | 0.3% |
| Dominican Republic | 9 | 0.3% |
| Eastern Africa | 7 | 0.2% |
| Eastern Asia | 42 | 1.3% |
| Eastern Europe | 16 | 0.5% |
| Europe | 47 | 1.4% |
| France | 8 | 0.2% |
| Ghana | 55 | 1.7% |
| Guatemala | 5 | 0.2% |
| Haiti | 16 | 0.5% |
| Hong Kong | 7 | 0.2% |
| India | 12 | 0.4% |
| Israel | 5 | 0.2% |
| Jamaica | 7 | 0.2% |
| Japan | 7 | 0.2% |
| Korea | 7 | 0.2% |
| Latin America | 53 | 1.6% |
| Oceania | 7 | 0.2% |
| Russia | 16 | 0.5% |
| Saudi Arabia | 5 | 0.2% |
| South America | 16 | 0.5% |
| South Central Asia | 12 | 0.4% |
| South Eastern Asia | 7 | 0.2% |
| Southern Europe | 23 | 0.7% |
| Spain | 23 | 0.7% |
| Vietnam | 7 | 0.2% |
| Western Africa | 55 | 1.7% |
| Western Asia | 10 | 0.3% |
| Western Europe | 8 | 0.2% |
| Zimbabwe | 7 | 0.2% | View All 36 Rows |
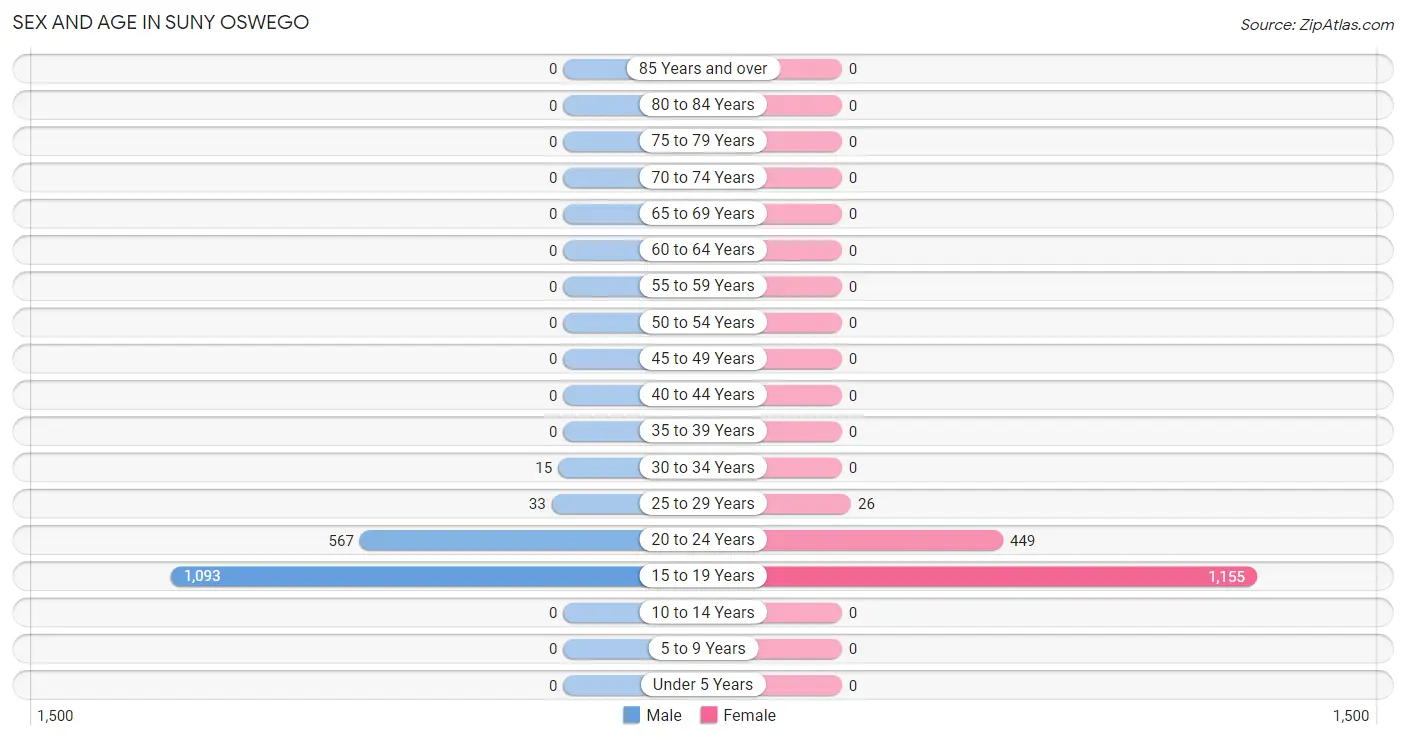
Sex and Age in SUNY Oswego
Sex and Age in SUNY Oswego
The most populous age groups in SUNY Oswego are 15 to 19 Years (1,093 | 64.0%) for men and 15 to 19 Years (1,155 | 70.9%) for women.
| Age Bracket | Male | Female |
| Under 5 Years | 0 (0.0%) | 0 (0.0%) |
| 5 to 9 Years | 0 (0.0%) | 0 (0.0%) |
| 10 to 14 Years | 0 (0.0%) | 0 (0.0%) |
| 15 to 19 Years | 1,093 (64.0%) | 1,155 (70.9%) |
| 20 to 24 Years | 567 (33.2%) | 449 (27.6%) |
| 25 to 29 Years | 33 (1.9%) | 26 (1.6%) |
| 30 to 34 Years | 15 (0.9%) | 0 (0.0%) |
| 35 to 39 Years | 0 (0.0%) | 0 (0.0%) |
| 40 to 44 Years | 0 (0.0%) | 0 (0.0%) |
| 45 to 49 Years | 0 (0.0%) | 0 (0.0%) |
| 50 to 54 Years | 0 (0.0%) | 0 (0.0%) |
| 55 to 59 Years | 0 (0.0%) | 0 (0.0%) |
| 60 to 64 Years | 0 (0.0%) | 0 (0.0%) |
| 65 to 69 Years | 0 (0.0%) | 0 (0.0%) |
| 70 to 74 Years | 0 (0.0%) | 0 (0.0%) |
| 75 to 79 Years | 0 (0.0%) | 0 (0.0%) |
| 80 to 84 Years | 0 (0.0%) | 0 (0.0%) |
| 85 Years and over | 0 (0.0%) | 0 (0.0%) |
| Total | 1,708 (100.0%) | 1,630 (100.0%) |
Families and Households in SUNY Oswego
Median Family Size in SUNY Oswego
| Family Type | # Families | Family Size |
| Married-Couple | 0 (0.0%) | - |
| Single Male/Father | 0 (0.0%) | - |
| Single Female/Mother | 0 (0.0%) | - |
| Total Families | 0 (0.0%) | - |
Median Household Size in SUNY Oswego
| Household Type | # Households | Household Size |
| Married-Couple | 0 (0.0%) | - |
| Single Male/Father | 0 (0.0%) | - |
| Single Female/Mother | 0 (0.0%) | - |
| Non-family | 11 (100.0%) | - |
| Total Households | 11 (100.0%) | - |
Household Size by Marriage Status in SUNY Oswego
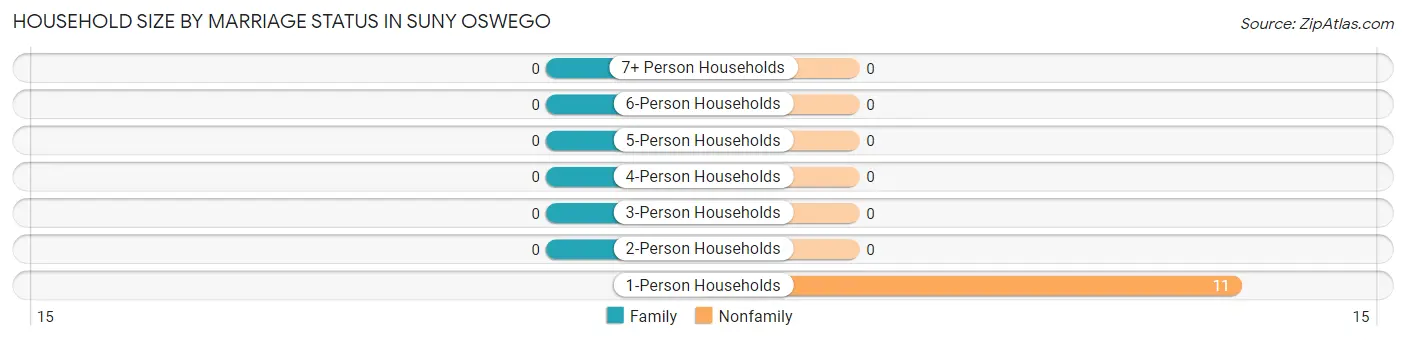
| Household Size | Family Households | Nonfamily Households |
| 1-Person Households | - | 11 (100.0%) |
| 2-Person Households | 0 (0.0%) | 0 (0.0%) |
| 3-Person Households | 0 (0.0%) | 0 (0.0%) |
| 4-Person Households | 0 (0.0%) | 0 (0.0%) |
| 5-Person Households | 0 (0.0%) | 0 (0.0%) |
| 6-Person Households | 0 (0.0%) | 0 (0.0%) |
| 7+ Person Households | 0 (0.0%) | 0 (0.0%) |
| Total | 0 (0.0%) | 11 (100.0%) |
Female Fertility in SUNY Oswego
Fertility by Age in SUNY Oswego
| Age Bracket | Women with Births | Births / 1,000 Women |
| 15 to 19 years | 0 (0.0%) | 0.0 |
| 20 to 34 years | 0 (0.0%) | 0.0 |
| 35 to 50 years | 0 (0.0%) | 0.0 |
| Total | 0 (0.0%) | 0.0 |
Fertility by Age by Marriage Status in SUNY Oswego
| Age Bracket | Married | Unmarried |
| 15 to 19 years | 0 (0.0%) | 0 (0.0%) |
| 20 to 34 years | 0 (0.0%) | 0 (0.0%) |
| 35 to 50 years | 0 (0.0%) | 0 (0.0%) |
| Total | 0 (0.0%) | 0 (0.0%) |
Fertility by Education in SUNY Oswego
| Educational Attainment | Women with Births | Births / 1,000 Women |
| Less than High School | 0 (0.0%) | 0.0 |
| High School Diploma | 0 (0.0%) | 0.0 |
| College or Associate's Degree | 0 (0.0%) | 0.0 |
| Bachelor's Degree | 0 (0.0%) | 0.0 |
| Graduate Degree | 0 (0.0%) | 0.0 |
| Total | 0 (0.0%) | 0.0 |
Fertility by Education by Marriage Status in SUNY Oswego
| Educational Attainment | Married | Unmarried |
| Less than High School | 0 (0.0%) | 0 (0.0%) |
| High School Diploma | 0 (0.0%) | 0 (0.0%) |
| College or Associate's Degree | 0 (0.0%) | 0 (0.0%) |
| Bachelor's Degree | 0 (0.0%) | 0 (0.0%) |
| Graduate Degree | 0 (0.0%) | 0 (0.0%) |
| Total | 0 (0.0%) | 0 (0.0%) |
Employment Characteristics in SUNY Oswego
Employment by Class of Employer in SUNY Oswego
Among the 839 employed individuals in SUNY Oswego, private company employees (282 | 33.6%), state government employees (275 | 32.8%), and not-for-profit organizations (269 | 32.1%) make up the most common classes of employment.
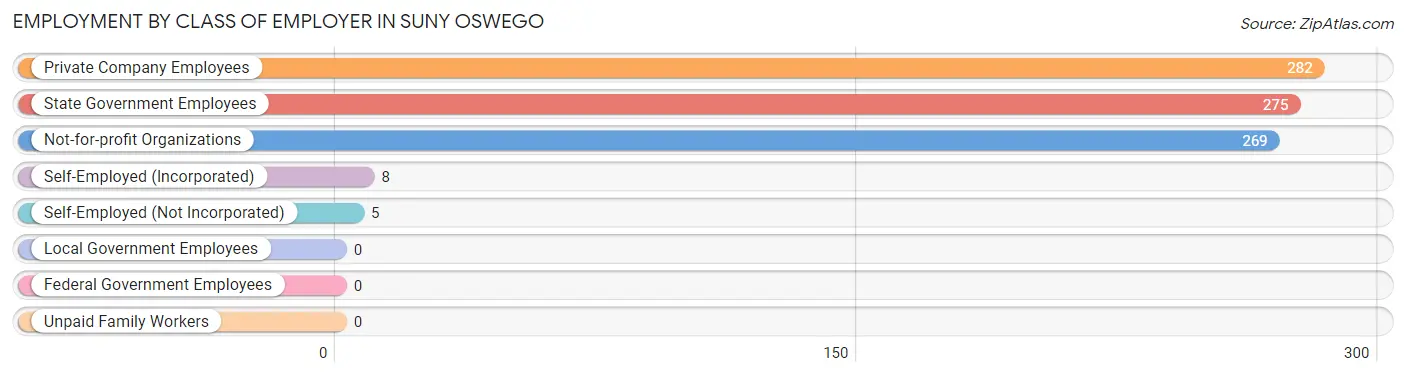
| Employer Class | # Employees | % Employees |
| Private Company Employees | 282 | 33.6% |
| Self-Employed (Incorporated) | 8 | 0.9% |
| Self-Employed (Not Incorporated) | 5 | 0.6% |
| Not-for-profit Organizations | 269 | 32.1% |
| Local Government Employees | 0 | 0.0% |
| State Government Employees | 275 | 32.8% |
| Federal Government Employees | 0 | 0.0% |
| Unpaid Family Workers | 0 | 0.0% |
| Total | 839 | 100.0% |
Employment Status by Age in SUNY Oswego
According to the labor force statistics for SUNY Oswego, out of the total population over 16 years of age (3,338), 41.9% or 1,399 individuals are in the labor force, with 23.8% or 333 of them unemployed. The age group with the highest labor force participation rate is 30 to 34 years, with 100.0% or 15 individuals in the labor force. Within the labor force, the 16 to 19 years age range has the highest percentage of unemployed individuals, with 28.3% or 238 of them being unemployed.
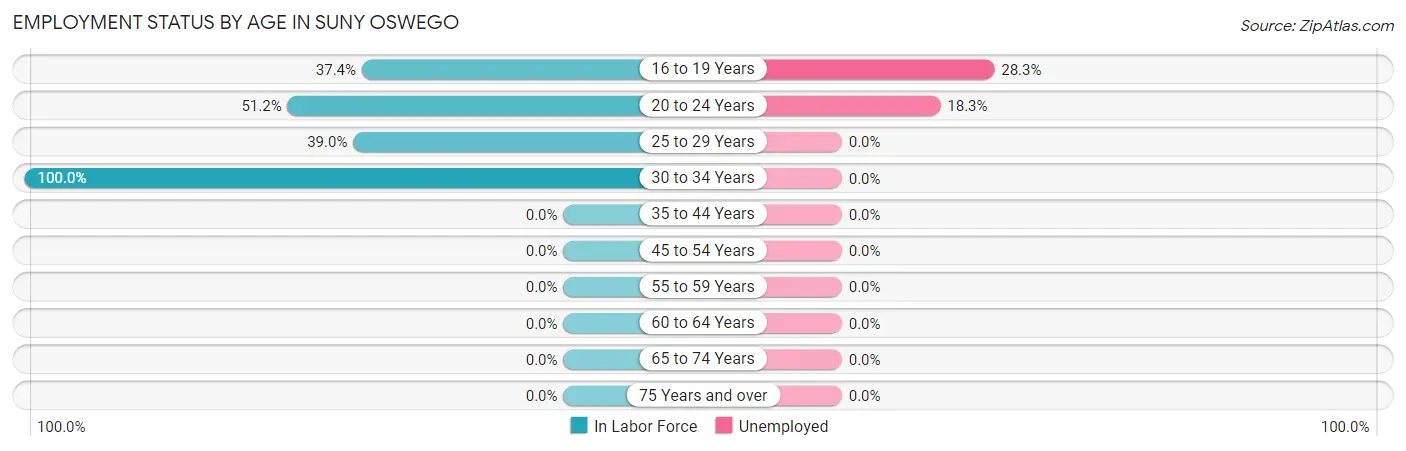
| Age Bracket | In Labor Force | Unemployed |
| 16 to 19 Years | 841 (37.4%) | 238 (28.3%) |
| 20 to 24 Years | 520 (51.2%) | 95 (18.3%) |
| 25 to 29 Years | 23 (39.0%) | 0 (0.0%) |
| 30 to 34 Years | 15 (100.0%) | 0 (0.0%) |
| 35 to 44 Years | 0 (0.0%) | 0 (0.0%) |
| 45 to 54 Years | 0 (0.0%) | 0 (0.0%) |
| 55 to 59 Years | 0 (0.0%) | 0 (0.0%) |
| 60 to 64 Years | 0 (0.0%) | 0 (0.0%) |
| 65 to 74 Years | 0 (0.0%) | 0 (0.0%) |
| 75 Years and over | 0 (0.0%) | 0 (0.0%) |
| Total | 1,399 (41.9%) | 333 (23.8%) |
Employment Status by Educational Attainment in SUNY Oswego
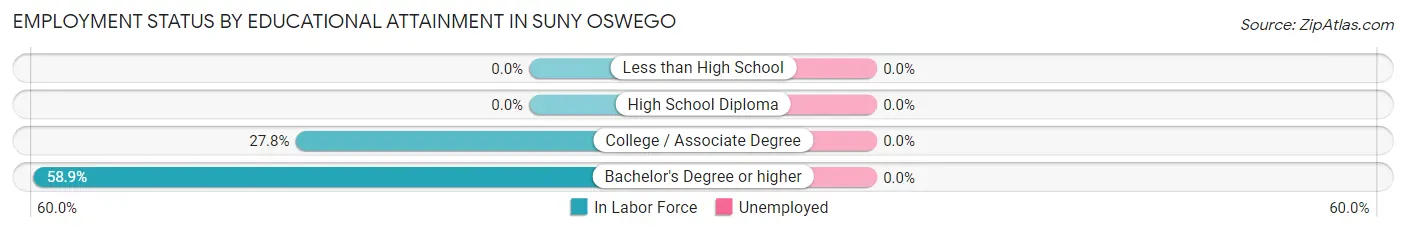
| Educational Attainment | In Labor Force | Unemployed |
| Less than High School | 0 (0.0%) | 0 (0.0%) |
| High School Diploma | 0 (0.0%) | 0 (0.0%) |
| College / Associate Degree | 5 (27.8%) | 0 (0.0%) |
| Bachelor's Degree or higher | 33 (58.9%) | 0 (0.0%) |
| Total | 38 (51.4%) | 0 (0.0%) |
Employment Occupations by Sex in SUNY Oswego
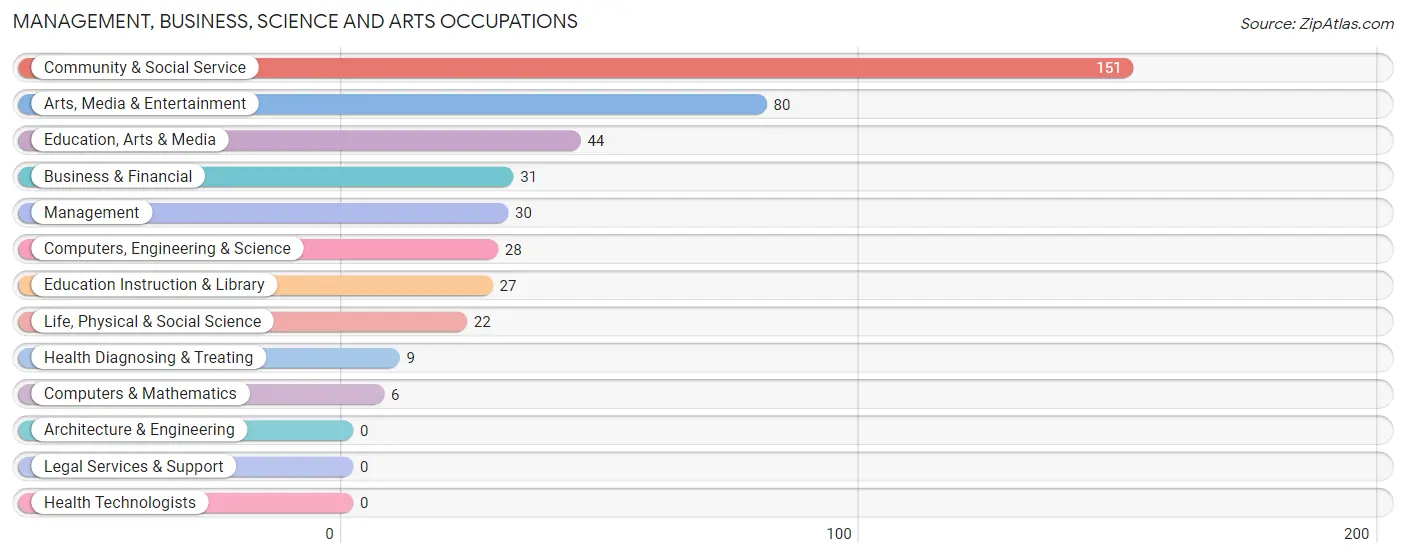
Management, Business, Science and Arts Occupations
The most common Management, Business, Science and Arts occupations in SUNY Oswego are Community & Social Service (151 | 14.2%), Arts, Media & Entertainment (80 | 7.5%), Education, Arts & Media (44 | 4.1%), Business & Financial (31 | 2.9%), and Management (30 | 2.8%).
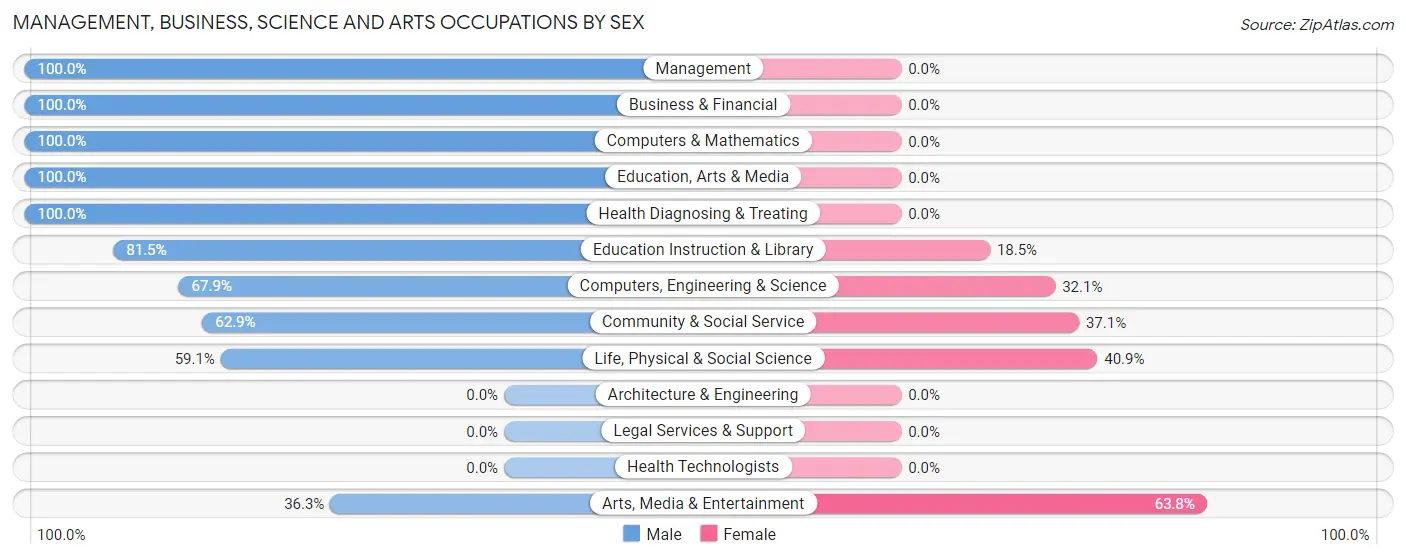
Management, Business, Science and Arts Occupations by Sex
Within the Management, Business, Science and Arts occupations in SUNY Oswego, the most male-oriented occupations are Management (100.0%), Business & Financial (100.0%), and Computers & Mathematics (100.0%), while the most female-oriented occupations are Arts, Media & Entertainment (63.7%), Life, Physical & Social Science (40.9%), and Community & Social Service (37.1%).
| Occupation | Male | Female |
| Management | 30 (100.0%) | 0 (0.0%) |
| Business & Financial | 31 (100.0%) | 0 (0.0%) |
| Computers, Engineering & Science | 19 (67.9%) | 9 (32.1%) |
| Computers & Mathematics | 6 (100.0%) | 0 (0.0%) |
| Architecture & Engineering | 0 (0.0%) | 0 (0.0%) |
| Life, Physical & Social Science | 13 (59.1%) | 9 (40.9%) |
| Community & Social Service | 95 (62.9%) | 56 (37.1%) |
| Education, Arts & Media | 44 (100.0%) | 0 (0.0%) |
| Legal Services & Support | 0 (0.0%) | 0 (0.0%) |
| Education Instruction & Library | 22 (81.5%) | 5 (18.5%) |
| Arts, Media & Entertainment | 29 (36.2%) | 51 (63.7%) |
| Health Diagnosing & Treating | 9 (100.0%) | 0 (0.0%) |
| Health Technologists | 0 (0.0%) | 0 (0.0%) |
| Total (Category) | 184 (73.9%) | 65 (26.1%) |
| Total (Overall) | 531 (49.8%) | 535 (50.2%) |
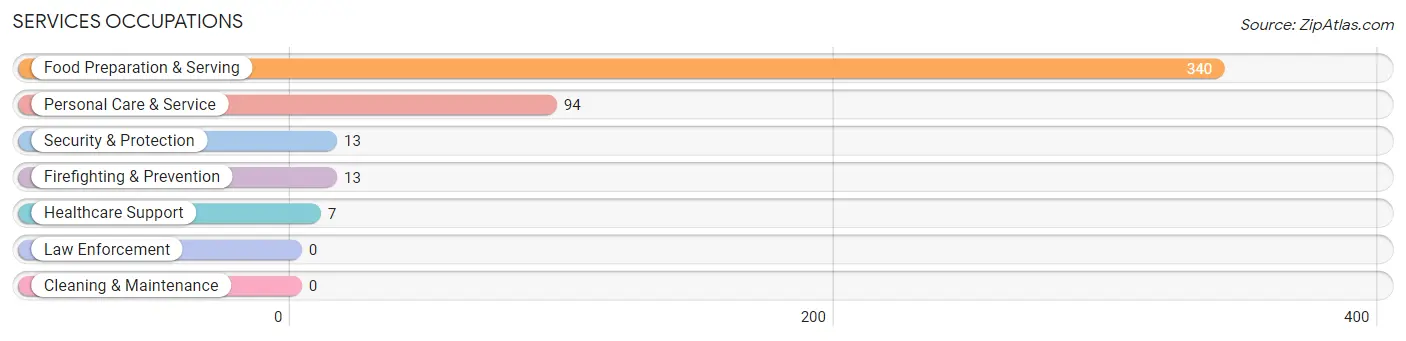
Services Occupations
The most common Services occupations in SUNY Oswego are Food Preparation & Serving (340 | 31.9%), Personal Care & Service (94 | 8.8%), Security & Protection (13 | 1.2%), Firefighting & Prevention (13 | 1.2%), and Healthcare Support (7 | 0.7%).
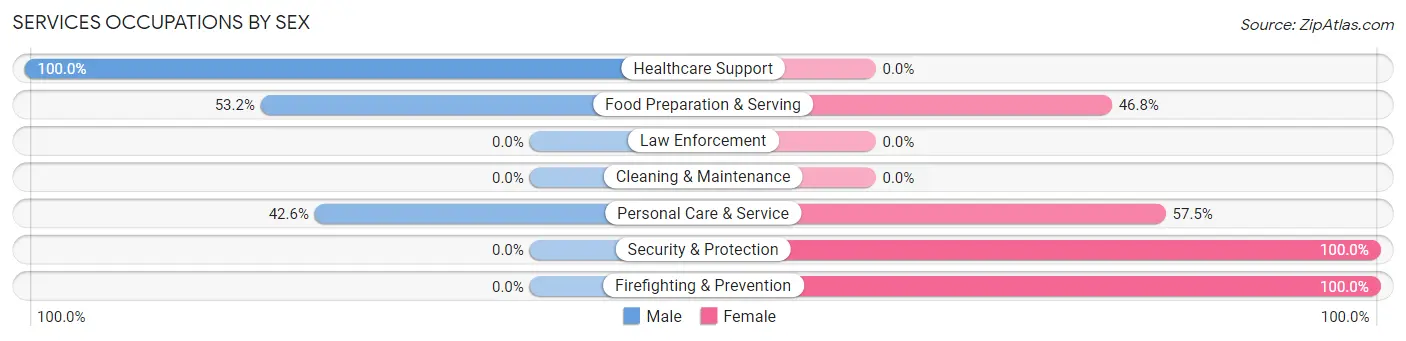
Services Occupations by Sex
Within the Services occupations in SUNY Oswego, the most male-oriented occupations are Healthcare Support (100.0%), Food Preparation & Serving (53.2%), and Personal Care & Service (42.5%), while the most female-oriented occupations are Security & Protection (100.0%), Firefighting & Prevention (100.0%), and Personal Care & Service (57.5%).
| Occupation | Male | Female |
| Healthcare Support | 7 (100.0%) | 0 (0.0%) |
| Security & Protection | 0 (0.0%) | 13 (100.0%) |
| Firefighting & Prevention | 0 (0.0%) | 13 (100.0%) |
| Law Enforcement | 0 (0.0%) | 0 (0.0%) |
| Food Preparation & Serving | 181 (53.2%) | 159 (46.8%) |
| Cleaning & Maintenance | 0 (0.0%) | 0 (0.0%) |
| Personal Care & Service | 40 (42.5%) | 54 (57.5%) |
| Total (Category) | 228 (50.2%) | 226 (49.8%) |
| Total (Overall) | 531 (49.8%) | 535 (50.2%) |
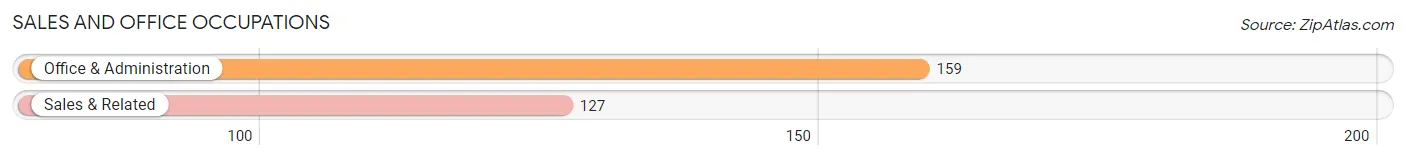
Sales and Office Occupations
The most common Sales and Office occupations in SUNY Oswego are Office & Administration (159 | 14.9%), and Sales & Related (127 | 11.9%).
Sales and Office Occupations by Sex
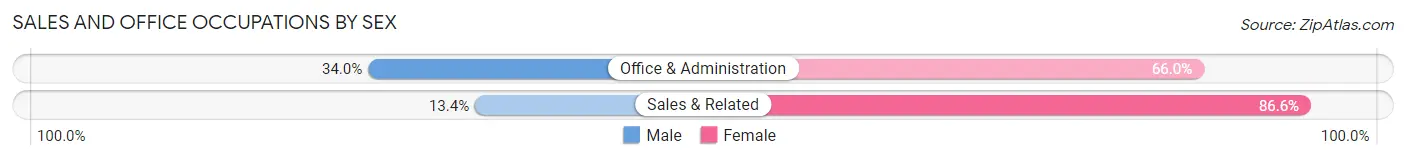
| Occupation | Male | Female |
| Sales & Related | 17 (13.4%) | 110 (86.6%) |
| Office & Administration | 54 (34.0%) | 105 (66.0%) |
| Total (Category) | 71 (24.8%) | 215 (75.2%) |
| Total (Overall) | 531 (49.8%) | 535 (50.2%) |
Natural Resources, Construction and Maintenance Occupations
Natural Resources, Construction and Maintenance Occupations by Sex
| Occupation | Male | Female |
| Farming, Fishing & Forestry | 0 (0.0%) | 0 (0.0%) |
| Construction & Extraction | 0 (0.0%) | 0 (0.0%) |
| Installation, Maintenance & Repair | 0 (0.0%) | 0 (0.0%) |
| Total (Category) | 0 (0.0%) | 0 (0.0%) |
| Total (Overall) | 531 (49.8%) | 535 (50.2%) |
Production, Transportation and Moving Occupations
The most common Production, Transportation and Moving occupations in SUNY Oswego are , and Material Moving (77 | 7.2%).
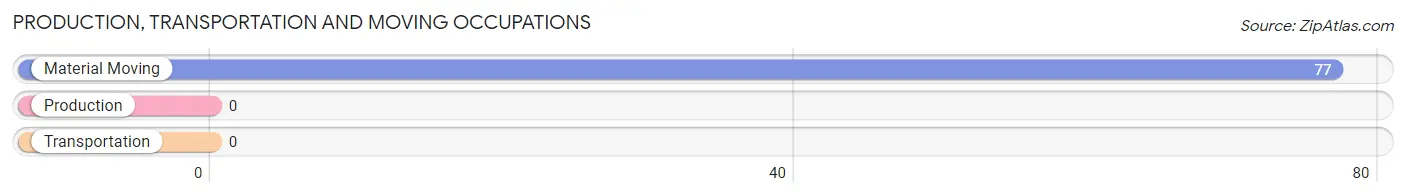
Production, Transportation and Moving Occupations by Sex
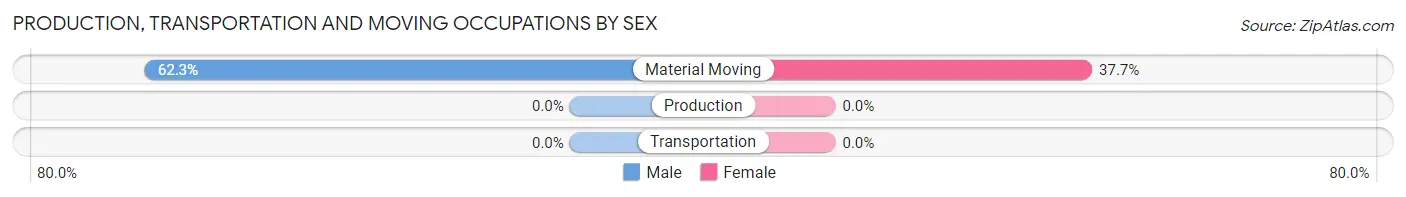
| Occupation | Male | Female |
| Production | 0 (0.0%) | 0 (0.0%) |
| Transportation | 0 (0.0%) | 0 (0.0%) |
| Material Moving | 48 (62.3%) | 29 (37.7%) |
| Total (Category) | 48 (62.3%) | 29 (37.7%) |
| Total (Overall) | 531 (49.8%) | 535 (50.2%) |
Employment Industries by Sex in SUNY Oswego
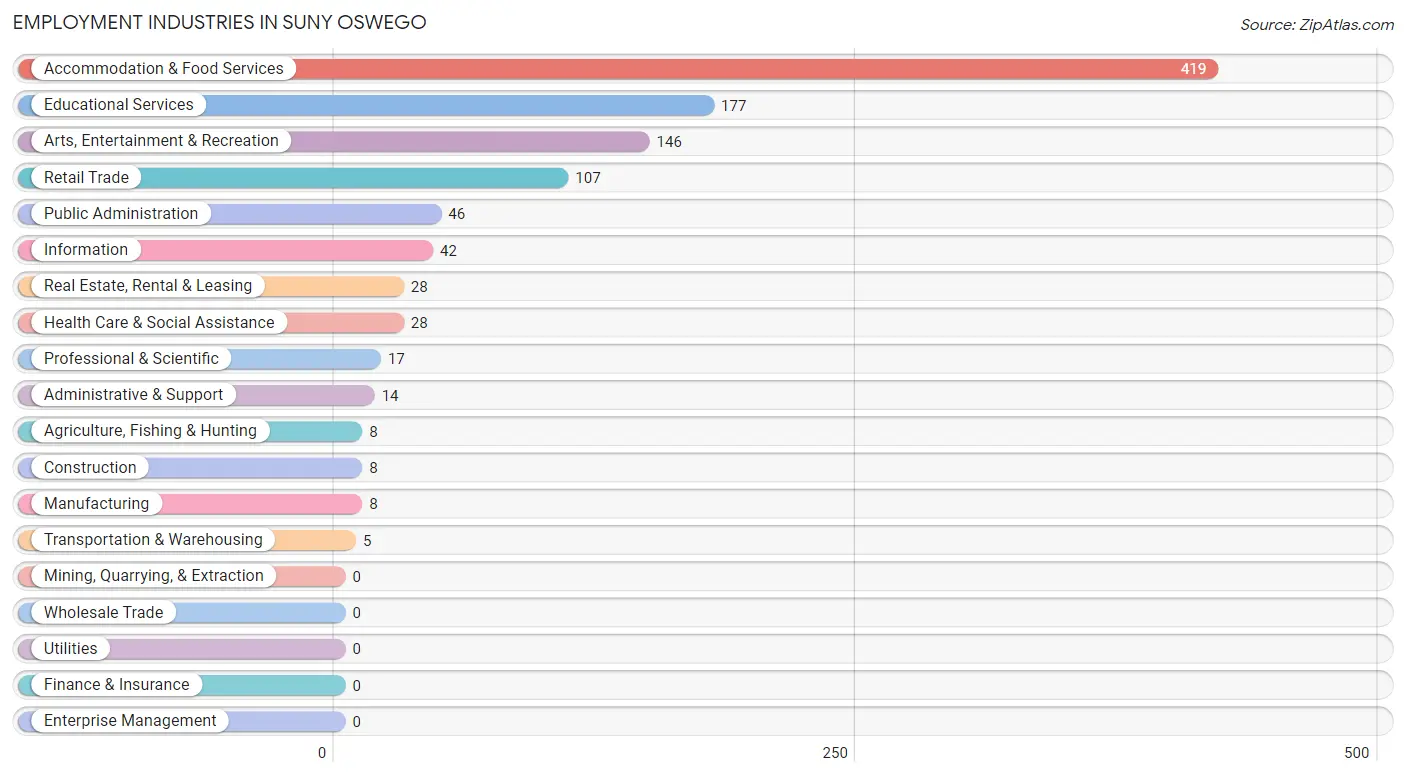
Employment Industries in SUNY Oswego
The major employment industries in SUNY Oswego include Accommodation & Food Services (419 | 39.3%), Educational Services (177 | 16.6%), Arts, Entertainment & Recreation (146 | 13.7%), Retail Trade (107 | 10.0%), and Public Administration (46 | 4.3%).
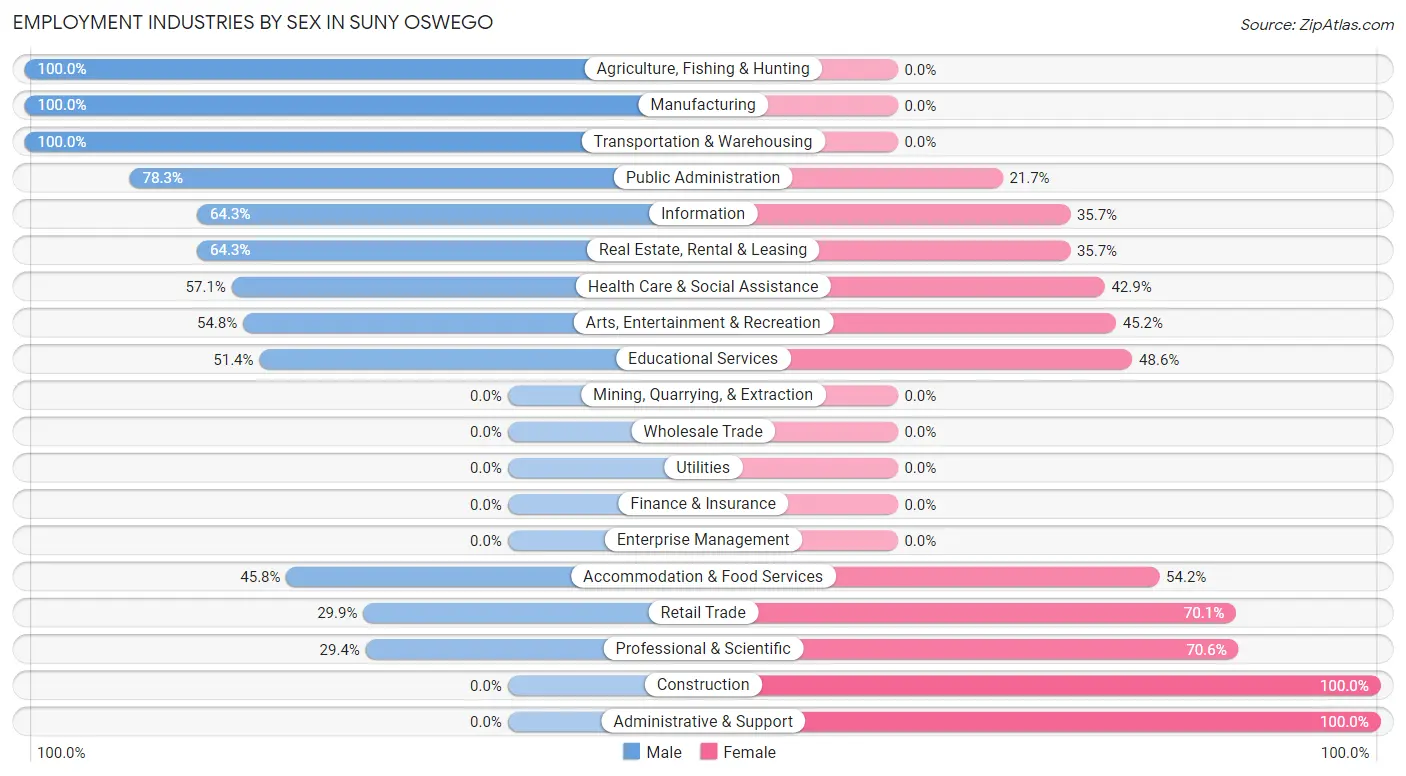
Employment Industries by Sex in SUNY Oswego
The SUNY Oswego industries that see more men than women are Agriculture, Fishing & Hunting (100.0%), Manufacturing (100.0%), and Transportation & Warehousing (100.0%), whereas the industries that tend to have a higher number of women are Construction (100.0%), Administrative & Support (100.0%), and Professional & Scientific (70.6%).
| Industry | Male | Female |
| Agriculture, Fishing & Hunting | 8 (100.0%) | 0 (0.0%) |
| Mining, Quarrying, & Extraction | 0 (0.0%) | 0 (0.0%) |
| Construction | 0 (0.0%) | 8 (100.0%) |
| Manufacturing | 8 (100.0%) | 0 (0.0%) |
| Wholesale Trade | 0 (0.0%) | 0 (0.0%) |
| Retail Trade | 32 (29.9%) | 75 (70.1%) |
| Transportation & Warehousing | 5 (100.0%) | 0 (0.0%) |
| Utilities | 0 (0.0%) | 0 (0.0%) |
| Information | 27 (64.3%) | 15 (35.7%) |
| Finance & Insurance | 0 (0.0%) | 0 (0.0%) |
| Real Estate, Rental & Leasing | 18 (64.3%) | 10 (35.7%) |
| Professional & Scientific | 5 (29.4%) | 12 (70.6%) |
| Enterprise Management | 0 (0.0%) | 0 (0.0%) |
| Administrative & Support | 0 (0.0%) | 14 (100.0%) |
| Educational Services | 91 (51.4%) | 86 (48.6%) |
| Health Care & Social Assistance | 16 (57.1%) | 12 (42.9%) |
| Arts, Entertainment & Recreation | 80 (54.8%) | 66 (45.2%) |
| Accommodation & Food Services | 192 (45.8%) | 227 (54.2%) |
| Public Administration | 36 (78.3%) | 10 (21.7%) |
| Total | 531 (49.8%) | 535 (50.2%) |
Education in SUNY Oswego
School Enrollment in SUNY Oswego
The most common levels of schooling among the 3,319 students in SUNY Oswego are college / undergraduate (3,282 | 98.9%), and graduate / professional (37 | 1.1%).
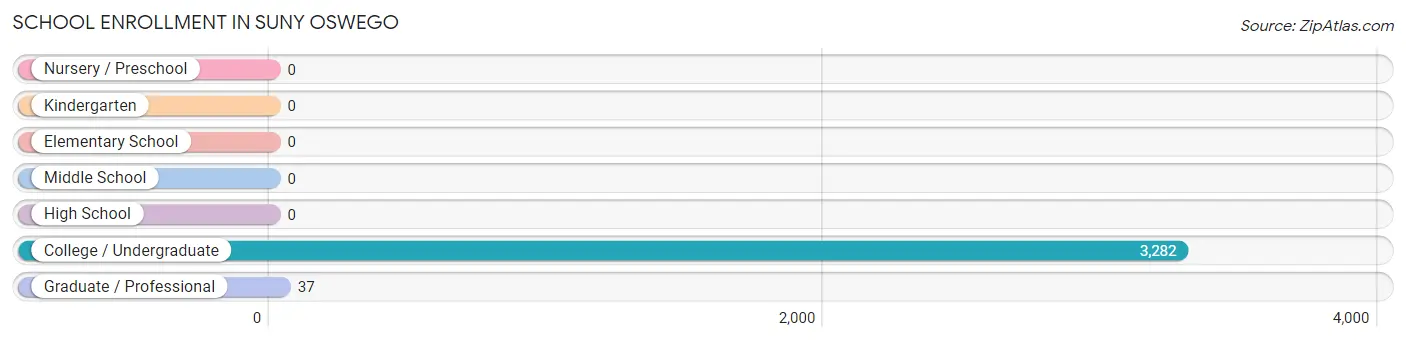
| School Level | # Students | % Students |
| Nursery / Preschool | 0 | 0.0% |
| Kindergarten | 0 | 0.0% |
| Elementary School | 0 | 0.0% |
| Middle School | 0 | 0.0% |
| High School | 0 | 0.0% |
| College / Undergraduate | 3,282 | 98.9% |
| Graduate / Professional | 37 | 1.1% |
| Total | 3,319 | 100.0% |
School Enrollment by Age by Funding Source in SUNY Oswego
Out of a total of 3,319 students who are enrolled in schools in SUNY Oswego, 272 (8.2%) attend a private institution, while the remaining 3,047 (91.8%) are enrolled in public schools. The age group of 25 to 34 year olds has the highest likelihood of being enrolled in private schools, with 22 (40.0% in the age bracket) enrolled. Conversely, the age group of 15 to 17 year olds has the lowest likelihood of being enrolled in a private school, with 47 (100.0% in the age bracket) attending a public institution.
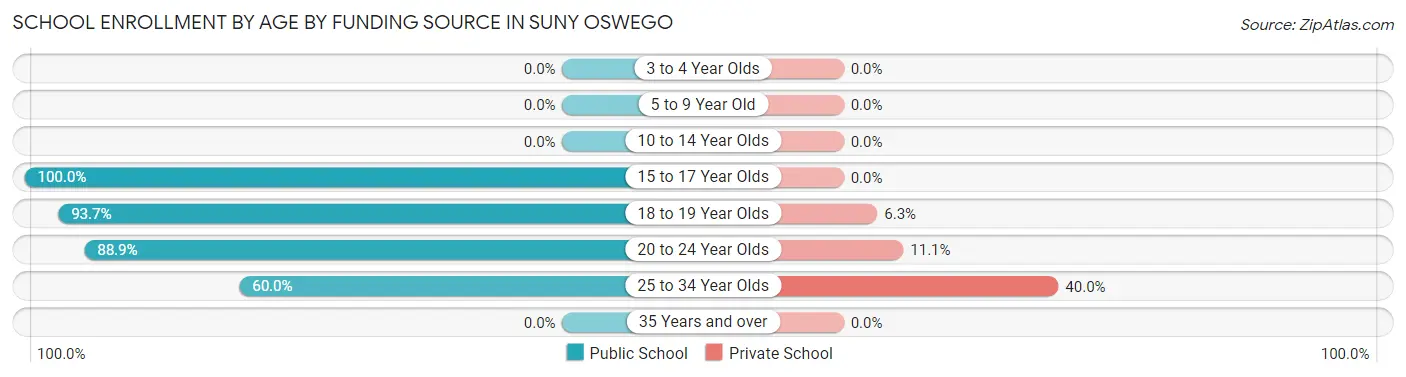
| Age Bracket | Public School | Private School |
| 3 to 4 Year Olds | 0 (0.0%) | 0 (0.0%) |
| 5 to 9 Year Old | 0 (0.0%) | 0 (0.0%) |
| 10 to 14 Year Olds | 0 (0.0%) | 0 (0.0%) |
| 15 to 17 Year Olds | 47 (100.0%) | 0 (0.0%) |
| 18 to 19 Year Olds | 2,063 (93.7%) | 138 (6.3%) |
| 20 to 24 Year Olds | 903 (88.9%) | 113 (11.1%) |
| 25 to 34 Year Olds | 33 (60.0%) | 22 (40.0%) |
| 35 Years and over | 0 (0.0%) | 0 (0.0%) |
| Total | 3,047 (91.8%) | 272 (8.2%) |
Educational Attainment by Field of Study in SUNY Oswego
Arts & humanities (23 | 41.1%), computers & mathematics (11 | 19.6%), visual & performing arts (8 | 14.3%), business (7 | 12.5%), and communications (7 | 12.5%) are the most common fields of study among 56 individuals in SUNY Oswego who have obtained a bachelor's degree or higher.
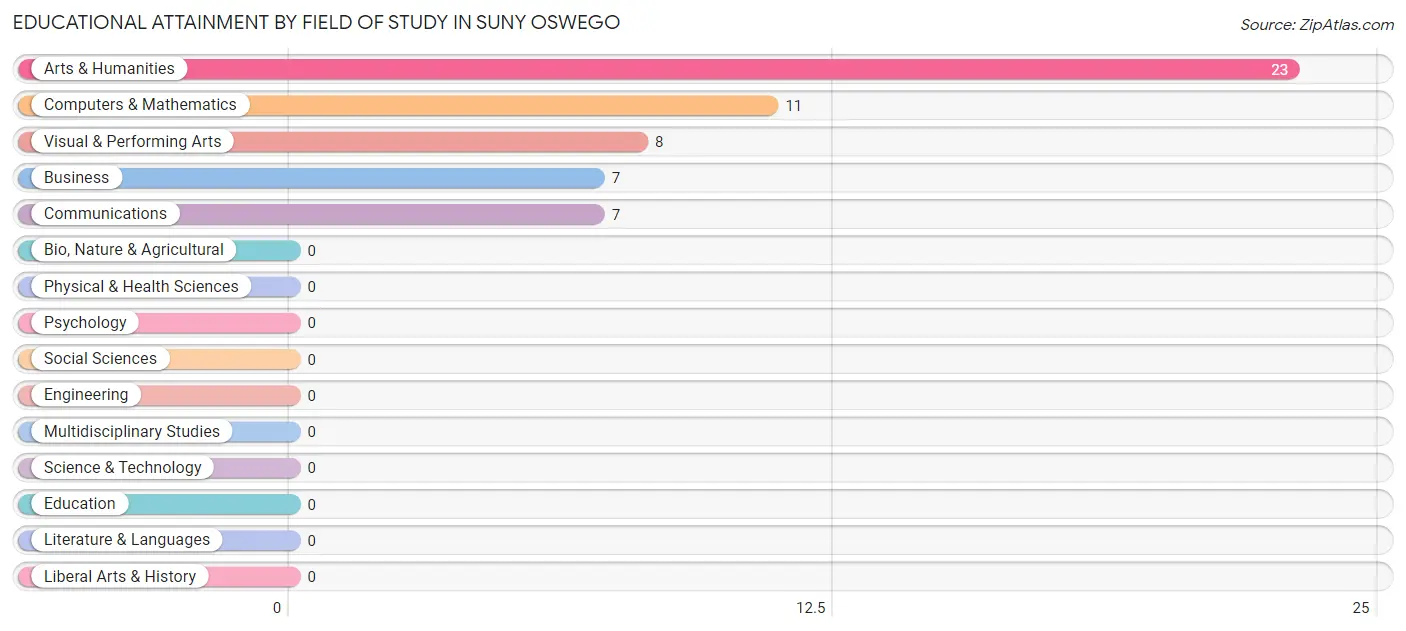
| Field of Study | # Graduates | % Graduates |
| Computers & Mathematics | 11 | 19.6% |
| Bio, Nature & Agricultural | 0 | 0.0% |
| Physical & Health Sciences | 0 | 0.0% |
| Psychology | 0 | 0.0% |
| Social Sciences | 0 | 0.0% |
| Engineering | 0 | 0.0% |
| Multidisciplinary Studies | 0 | 0.0% |
| Science & Technology | 0 | 0.0% |
| Business | 7 | 12.5% |
| Education | 0 | 0.0% |
| Literature & Languages | 0 | 0.0% |
| Liberal Arts & History | 0 | 0.0% |
| Visual & Performing Arts | 8 | 14.3% |
| Communications | 7 | 12.5% |
| Arts & Humanities | 23 | 41.1% |
| Total | 56 | 100.0% |
Transportation & Commute in SUNY Oswego
Vehicle Availability by Sex in SUNY Oswego
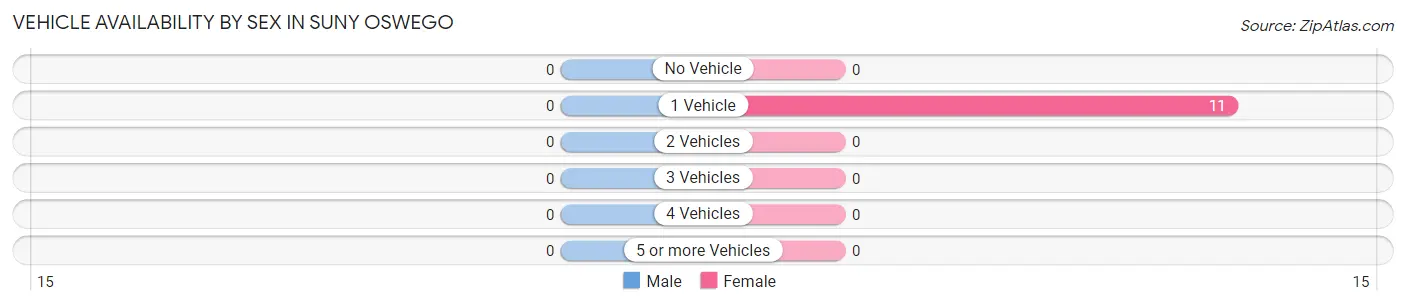
| Vehicles Available | Male | Female |
| No Vehicle | 0 (0.0%) | 0 (0.0%) |
| 1 Vehicle | 0 (0.0%) | 11 (100.0%) |
| 2 Vehicles | 0 (0.0%) | 0 (0.0%) |
| 3 Vehicles | 0 (0.0%) | 0 (0.0%) |
| 4 Vehicles | 0 (0.0%) | 0 (0.0%) |
| 5 or more Vehicles | 0 (0.0%) | 0 (0.0%) |
| Total | 0 (0.0%) | 11 (100.0%) |
Commute Time in SUNY Oswego
The most frequently occuring commute durations in SUNY Oswego are 5 to 9 minutes (290 commuters, 39.5%), less than 5 minutes (182 commuters, 24.8%), and 10 to 14 minutes (140 commuters, 19.1%).
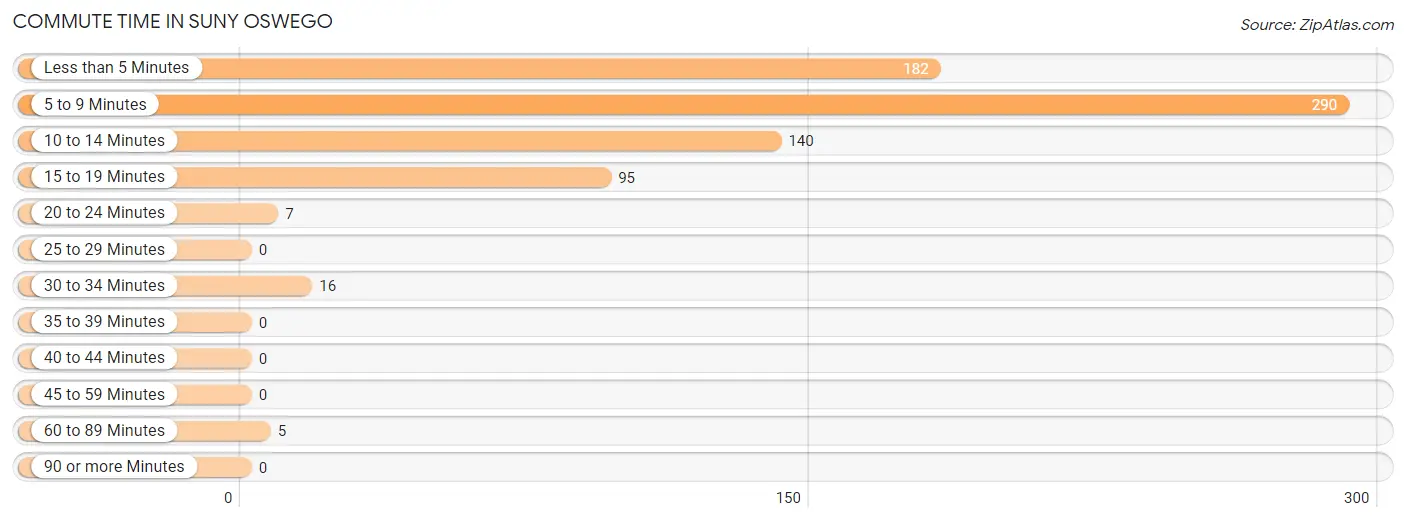
| Commute Time | # Commuters | % Commuters |
| Less than 5 Minutes | 182 | 24.8% |
| 5 to 9 Minutes | 290 | 39.5% |
| 10 to 14 Minutes | 140 | 19.1% |
| 15 to 19 Minutes | 95 | 12.9% |
| 20 to 24 Minutes | 7 | 0.9% |
| 25 to 29 Minutes | 0 | 0.0% |
| 30 to 34 Minutes | 16 | 2.2% |
| 35 to 39 Minutes | 0 | 0.0% |
| 40 to 44 Minutes | 0 | 0.0% |
| 45 to 59 Minutes | 0 | 0.0% |
| 60 to 89 Minutes | 5 | 0.7% |
| 90 or more Minutes | 0 | 0.0% |
Commute Time by Sex in SUNY Oswego
The most common commute times in SUNY Oswego are 5 to 9 minutes (187 commuters, 57.5%) for males and less than 5 minutes (142 commuters, 34.6%) for females.
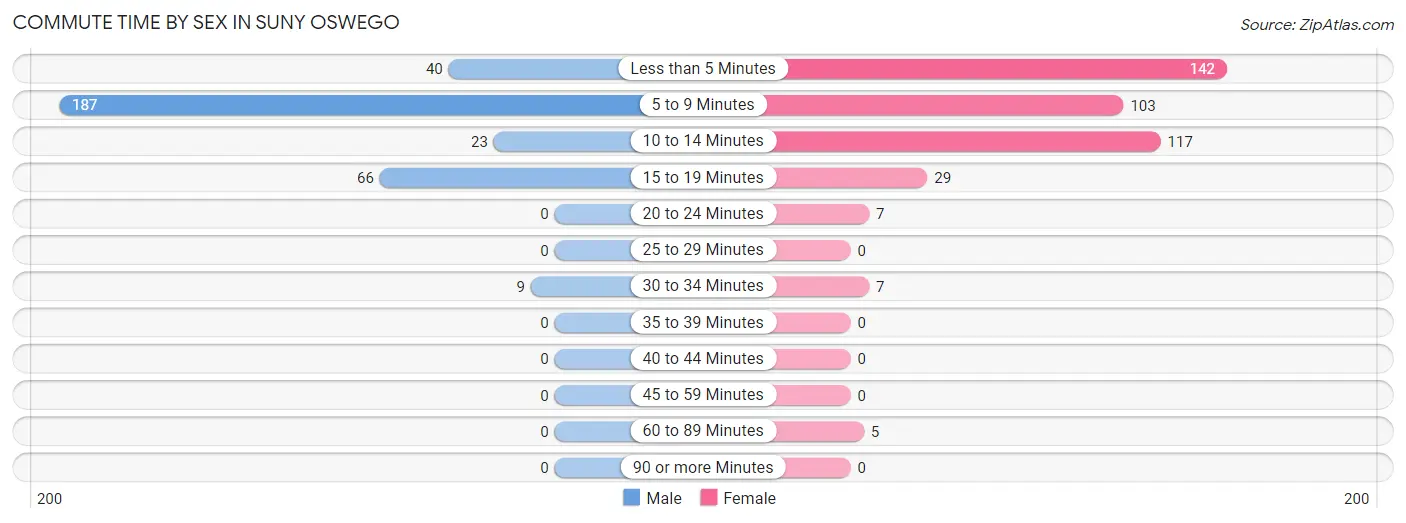
| Commute Time | Male | Female |
| Less than 5 Minutes | 40 (12.3%) | 142 (34.6%) |
| 5 to 9 Minutes | 187 (57.5%) | 103 (25.1%) |
| 10 to 14 Minutes | 23 (7.1%) | 117 (28.5%) |
| 15 to 19 Minutes | 66 (20.3%) | 29 (7.1%) |
| 20 to 24 Minutes | 0 (0.0%) | 7 (1.7%) |
| 25 to 29 Minutes | 0 (0.0%) | 0 (0.0%) |
| 30 to 34 Minutes | 9 (2.8%) | 7 (1.7%) |
| 35 to 39 Minutes | 0 (0.0%) | 0 (0.0%) |
| 40 to 44 Minutes | 0 (0.0%) | 0 (0.0%) |
| 45 to 59 Minutes | 0 (0.0%) | 0 (0.0%) |
| 60 to 89 Minutes | 0 (0.0%) | 5 (1.2%) |
| 90 or more Minutes | 0 (0.0%) | 0 (0.0%) |
Time of Departure to Work by Sex in SUNY Oswego
The most frequent times of departure to work in SUNY Oswego are 4:00 PM to 11:59 PM (125, 38.5%) for males and 4:00 PM to 11:59 PM (127, 31.0%) for females.
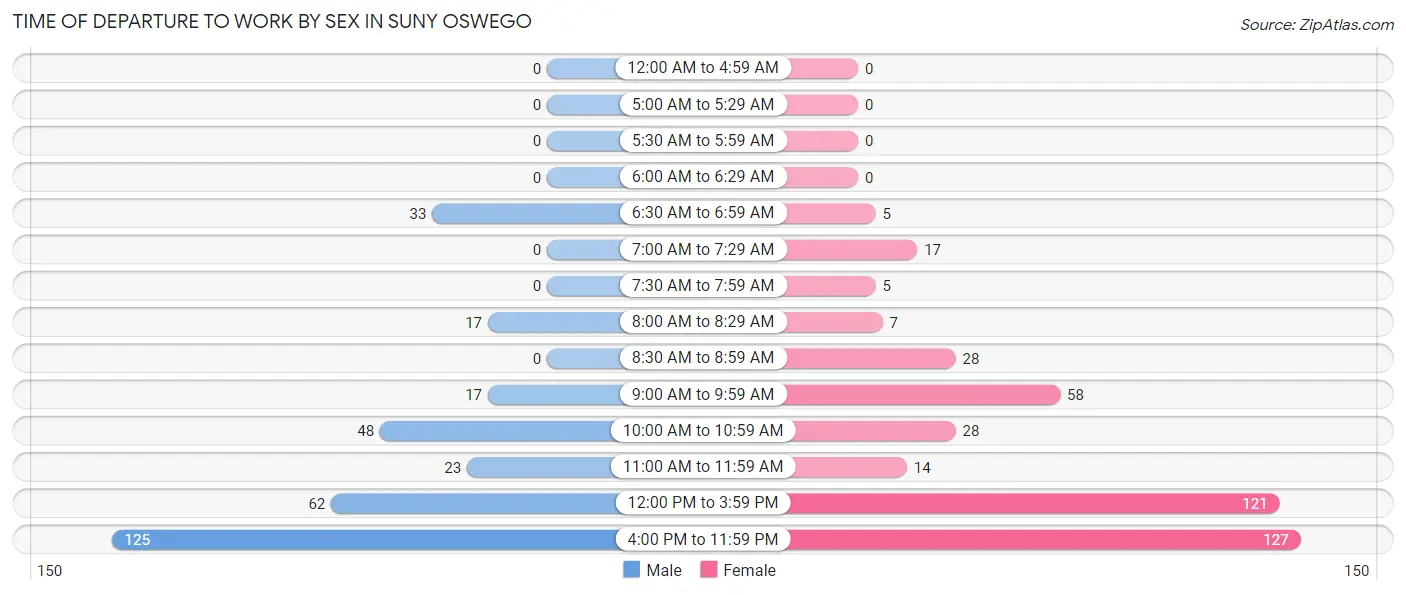
| Time of Departure | Male | Female |
| 12:00 AM to 4:59 AM | 0 (0.0%) | 0 (0.0%) |
| 5:00 AM to 5:29 AM | 0 (0.0%) | 0 (0.0%) |
| 5:30 AM to 5:59 AM | 0 (0.0%) | 0 (0.0%) |
| 6:00 AM to 6:29 AM | 0 (0.0%) | 0 (0.0%) |
| 6:30 AM to 6:59 AM | 33 (10.2%) | 5 (1.2%) |
| 7:00 AM to 7:29 AM | 0 (0.0%) | 17 (4.2%) |
| 7:30 AM to 7:59 AM | 0 (0.0%) | 5 (1.2%) |
| 8:00 AM to 8:29 AM | 17 (5.2%) | 7 (1.7%) |
| 8:30 AM to 8:59 AM | 0 (0.0%) | 28 (6.8%) |
| 9:00 AM to 9:59 AM | 17 (5.2%) | 58 (14.1%) |
| 10:00 AM to 10:59 AM | 48 (14.8%) | 28 (6.8%) |
| 11:00 AM to 11:59 AM | 23 (7.1%) | 14 (3.4%) |
| 12:00 PM to 3:59 PM | 62 (19.1%) | 121 (29.5%) |
| 4:00 PM to 11:59 PM | 125 (38.5%) | 127 (31.0%) |
| Total | 325 (100.0%) | 410 (100.0%) |
Housing Occupancy in SUNY Oswego
Occupancy by Ownership in SUNY Oswego
Of the total 11 dwellings in SUNY Oswego, owner-occupied units account for 0 (0.0%), while renter-occupied units make up 11 (100.0%).
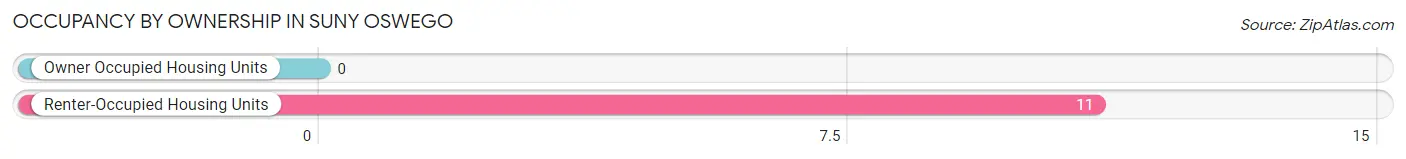
| Occupancy | # Housing Units | % Housing Units |
| Owner Occupied Housing Units | 0 | 0.0% |
| Renter-Occupied Housing Units | 11 | 100.0% |
| Total Occupied Housing Units | 11 | 100.0% |
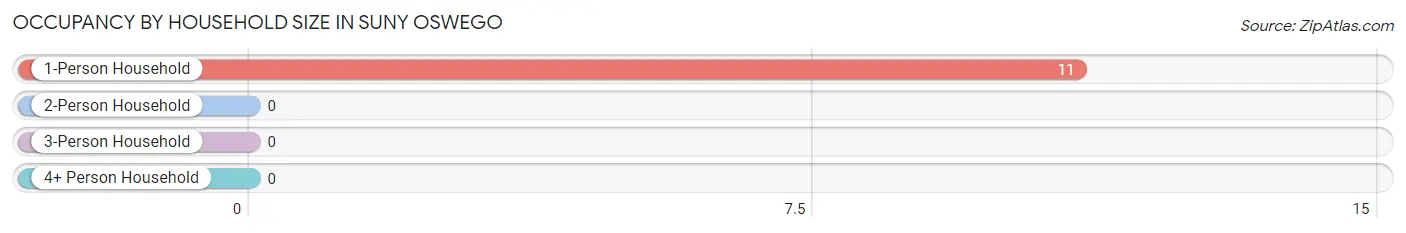
Occupancy by Household Size in SUNY Oswego
| Household Size | # Housing Units | % Housing Units |
| 1-Person Household | 11 | 100.0% |
| 2-Person Household | 0 | 0.0% |
| 3-Person Household | 0 | 0.0% |
| 4+ Person Household | 0 | 0.0% |
| Total Housing Units | 11 | 100.0% |
Occupancy by Ownership by Household Size in SUNY Oswego
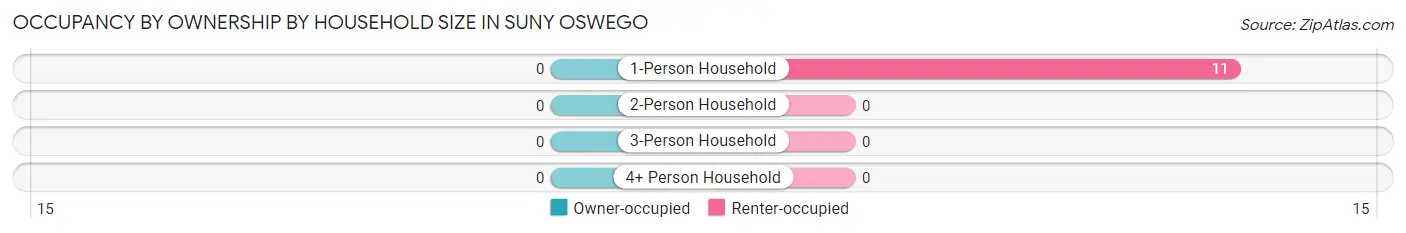
| Household Size | Owner-occupied | Renter-occupied |
| 1-Person Household | 0 (0.0%) | 11 (100.0%) |
| 2-Person Household | 0 (0.0%) | 0 (0.0%) |
| 3-Person Household | 0 (0.0%) | 0 (0.0%) |
| 4+ Person Household | 0 (0.0%) | 0 (0.0%) |
| Total Housing Units | 0 (0.0%) | 11 (100.0%) |
Occupancy by Educational Attainment in SUNY Oswego
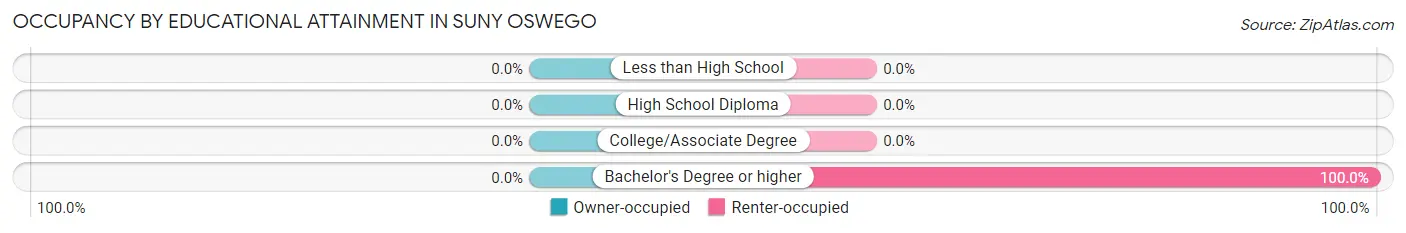
| Household Size | Owner-occupied | Renter-occupied |
| Less than High School | 0 (0.0%) | 0 (0.0%) |
| High School Diploma | 0 (0.0%) | 0 (0.0%) |
| College/Associate Degree | 0 (0.0%) | 0 (0.0%) |
| Bachelor's Degree or higher | 0 (0.0%) | 11 (100.0%) |
Occupancy by Age of Householder in SUNY Oswego
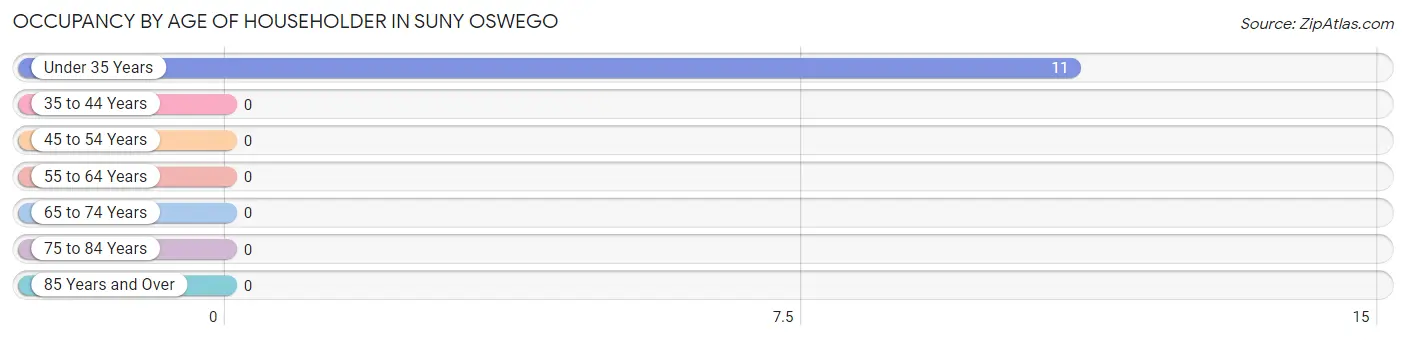
| Age Bracket | # Households | % Households |
| Under 35 Years | 11 | 100.0% |
| 35 to 44 Years | 0 | 0.0% |
| 45 to 54 Years | 0 | 0.0% |
| 55 to 64 Years | 0 | 0.0% |
| 65 to 74 Years | 0 | 0.0% |
| 75 to 84 Years | 0 | 0.0% |
| 85 Years and Over | 0 | 0.0% |
| Total | 11 | 100.0% |
Housing Finances in SUNY Oswego
Median Income by Occupancy in SUNY Oswego
| Occupancy Type | # Households | Median Income |
| Owner-Occupied | 0 (0.0%) | $0 |
| Renter-Occupied | 11 (100.0%) | $0 |
| Average | 11 (100.0%) | $0 |
Occupancy by Householder Income Bracket in SUNY Oswego
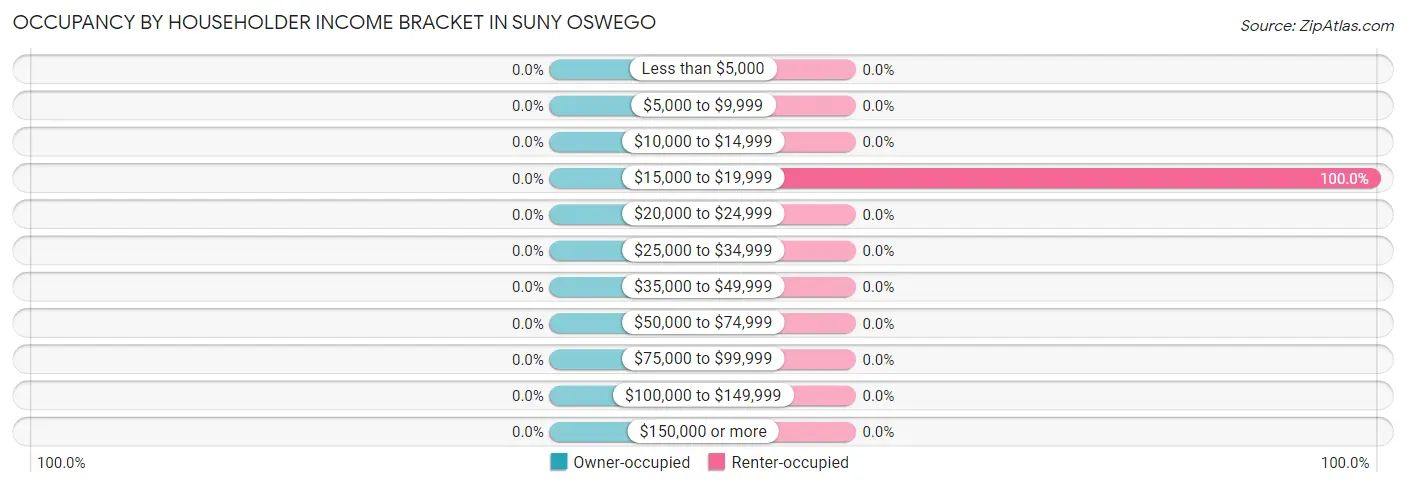
| Income Bracket | Owner-occupied | Renter-occupied |
| Less than $5,000 | 0 (0.0%) | 0 (0.0%) |
| $5,000 to $9,999 | 0 (0.0%) | 0 (0.0%) |
| $10,000 to $14,999 | 0 (0.0%) | 0 (0.0%) |
| $15,000 to $19,999 | 0 (0.0%) | 11 (100.0%) |
| $20,000 to $24,999 | 0 (0.0%) | 0 (0.0%) |
| $25,000 to $34,999 | 0 (0.0%) | 0 (0.0%) |
| $35,000 to $49,999 | 0 (0.0%) | 0 (0.0%) |
| $50,000 to $74,999 | 0 (0.0%) | 0 (0.0%) |
| $75,000 to $99,999 | 0 (0.0%) | 0 (0.0%) |
| $100,000 to $149,999 | 0 (0.0%) | 0 (0.0%) |
| $150,000 or more | 0 (0.0%) | 0 (0.0%) |
| Total | 0 (0.0%) | 11 (100.0%) |
Monthly Housing Cost Tiers in SUNY Oswego
| Monthly Cost | Owner-occupied | Renter-occupied |
| Less than $300 | 0 (0.0%) | 0 (0.0%) |
| $300 to $499 | 0 (0.0%) | 0 (0.0%) |
| $500 to $799 | 0 (0.0%) | 0 (0.0%) |
| $800 to $999 | 0 (0.0%) | 0 (0.0%) |
| $1,000 to $1,499 | 0 (0.0%) | 0 (0.0%) |
| $1,500 to $1,999 | 0 (0.0%) | 0 (0.0%) |
| $2,000 to $2,499 | 0 (0.0%) | 0 (0.0%) |
| $2,500 to $2,999 | 0 (0.0%) | 0 (0.0%) |
| $3,000 or more | 0 (0.0%) | 0 (0.0%) |
| Total | 0 (0.0%) | 11 (100.0%) |
Physical Housing Characteristics in SUNY Oswego
Housing Structures in SUNY Oswego
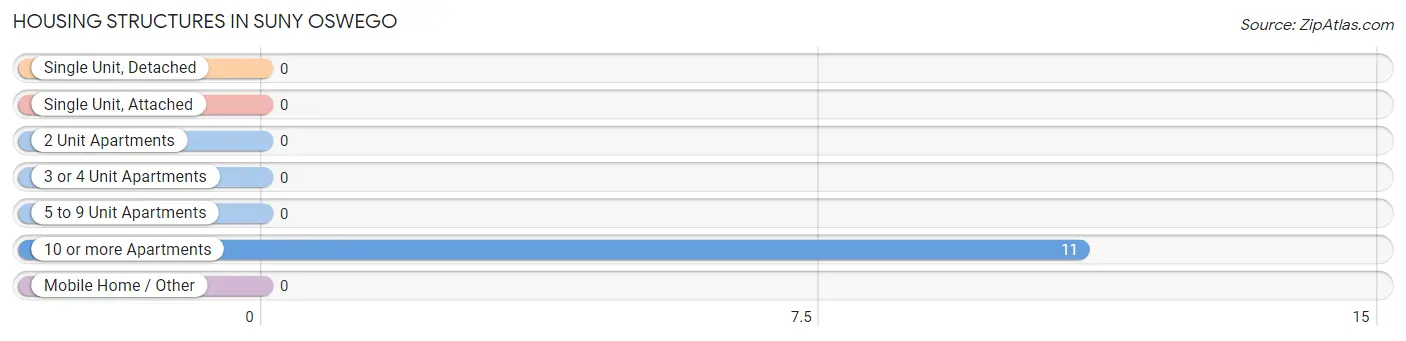
| Structure Type | # Housing Units | % Housing Units |
| Single Unit, Detached | 0 | 0.0% |
| Single Unit, Attached | 0 | 0.0% |
| 2 Unit Apartments | 0 | 0.0% |
| 3 or 4 Unit Apartments | 0 | 0.0% |
| 5 to 9 Unit Apartments | 0 | 0.0% |
| 10 or more Apartments | 11 | 100.0% |
| Mobile Home / Other | 0 | 0.0% |
| Total | 11 | 100.0% |
Housing Structures by Occupancy in SUNY Oswego
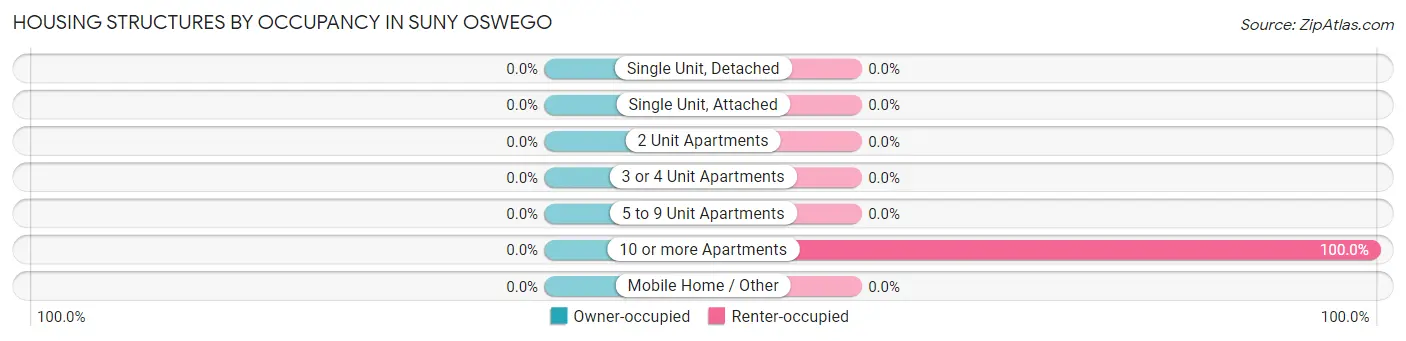
| Structure Type | Owner-occupied | Renter-occupied |
| Single Unit, Detached | 0 (0.0%) | 0 (0.0%) |
| Single Unit, Attached | 0 (0.0%) | 0 (0.0%) |
| 2 Unit Apartments | 0 (0.0%) | 0 (0.0%) |
| 3 or 4 Unit Apartments | 0 (0.0%) | 0 (0.0%) |
| 5 to 9 Unit Apartments | 0 (0.0%) | 0 (0.0%) |
| 10 or more Apartments | 0 (0.0%) | 11 (100.0%) |
| Mobile Home / Other | 0 (0.0%) | 0 (0.0%) |
| Total | 0 (0.0%) | 11 (100.0%) |
Housing Structures by Number of Rooms in SUNY Oswego
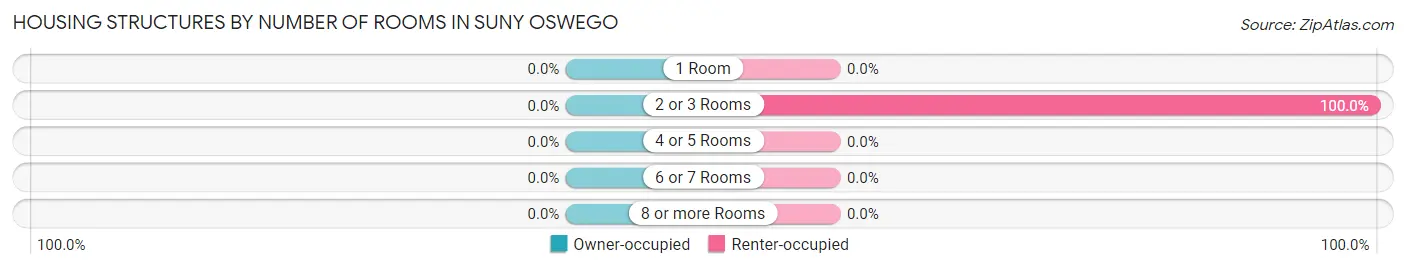
| Number of Rooms | Owner-occupied | Renter-occupied |
| 1 Room | 0 (0.0%) | 0 (0.0%) |
| 2 or 3 Rooms | 0 (0.0%) | 11 (100.0%) |
| 4 or 5 Rooms | 0 (0.0%) | 0 (0.0%) |
| 6 or 7 Rooms | 0 (0.0%) | 0 (0.0%) |
| 8 or more Rooms | 0 (0.0%) | 0 (0.0%) |
| Total | 0 (0.0%) | 11 (100.0%) |
Housing Structure by Heating Type in SUNY Oswego
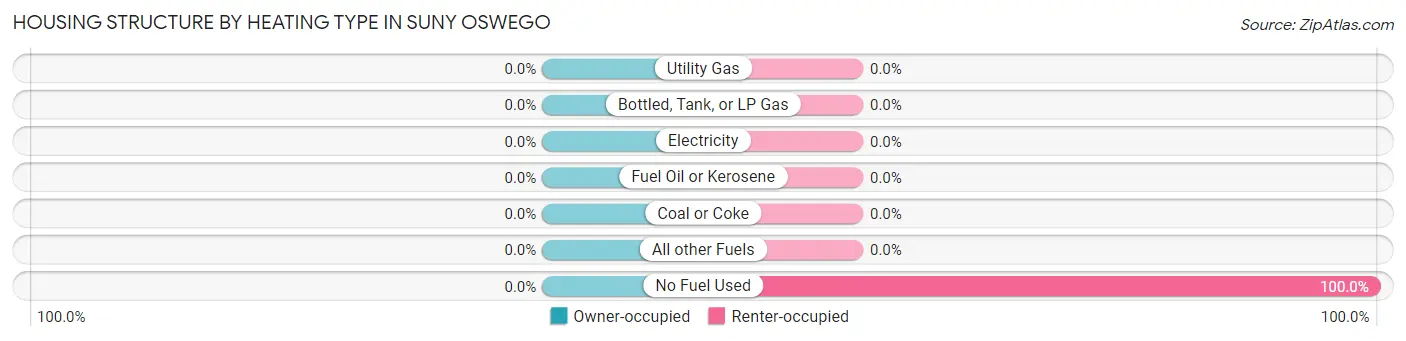
| Heating Type | Owner-occupied | Renter-occupied |
| Utility Gas | 0 (0.0%) | 0 (0.0%) |
| Bottled, Tank, or LP Gas | 0 (0.0%) | 0 (0.0%) |
| Electricity | 0 (0.0%) | 0 (0.0%) |
| Fuel Oil or Kerosene | 0 (0.0%) | 0 (0.0%) |
| Coal or Coke | 0 (0.0%) | 0 (0.0%) |
| All other Fuels | 0 (0.0%) | 0 (0.0%) |
| No Fuel Used | 0 (0.0%) | 11 (100.0%) |
| Total | 0 (0.0%) | 11 (100.0%) |
Household Vehicle Usage in SUNY Oswego
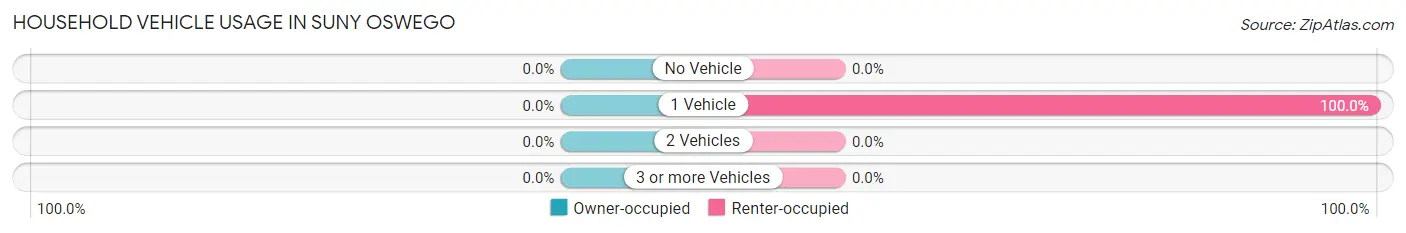
| Vehicles per Household | Owner-occupied | Renter-occupied |
| No Vehicle | 0 (0.0%) | 0 (0.0%) |
| 1 Vehicle | 0 (0.0%) | 11 (100.0%) |
| 2 Vehicles | 0 (0.0%) | 0 (0.0%) |
| 3 or more Vehicles | 0 (0.0%) | 0 (0.0%) |
| Total | 0 (0.0%) | 11 (100.0%) |
Real Estate & Mortgages in SUNY Oswego
Real Estate and Mortgage Overview in SUNY Oswego
| Characteristic | Without Mortgage | With Mortgage |
| Housing Units | 0 | 0 |
| Median Property Value | - | - |
| Median Household Income | - | - |
| Monthly Housing Costs | - | - |
| Real Estate Taxes | - | - |
Property Value by Mortgage Status in SUNY Oswego
| Property Value | Without Mortgage | With Mortgage |
| Less than $50,000 | 0 (0.0%) | 0 (0.0%) |
| $50,000 to $99,999 | 0 (0.0%) | 0 (0.0%) |
| $100,000 to $299,999 | 0 (0.0%) | 0 (0.0%) |
| $300,000 to $499,999 | 0 (0.0%) | 0 (0.0%) |
| $500,000 to $749,999 | 0 (0.0%) | 0 (0.0%) |
| $750,000 to $999,999 | 0 (0.0%) | 0 (0.0%) |
| $1,000,000 or more | 0 (0.0%) | 0 (0.0%) |
| Total | 0 (0.0%) | 0 (0.0%) |
Household Income by Mortgage Status in SUNY Oswego
| Household Income | Without Mortgage | With Mortgage |
| Less than $10,000 | 0 (0.0%) | 0 (0.0%) |
| $10,000 to $24,999 | 0 (0.0%) | 0 (0.0%) |
| $25,000 to $34,999 | 0 (0.0%) | 0 (0.0%) |
| $35,000 to $49,999 | 0 (0.0%) | 0 (0.0%) |
| $50,000 to $74,999 | 0 (0.0%) | 0 (0.0%) |
| $75,000 to $99,999 | 0 (0.0%) | 0 (0.0%) |
| $100,000 to $149,999 | 0 (0.0%) | 0 (0.0%) |
| $150,000 or more | 0 (0.0%) | 0 (0.0%) |
| Total | 0 (0.0%) | 0 (0.0%) |
Property Value to Household Income Ratio in SUNY Oswego
| Value-to-Income Ratio | Without Mortgage | With Mortgage |
| Less than 2.0x | 0 (0.0%) | 0 (0.0%) |
| 2.0x to 2.9x | 0 (0.0%) | 0 (0.0%) |
| 3.0x to 3.9x | 0 (0.0%) | 0 (0.0%) |
| 4.0x or more | 0 (0.0%) | 0 (0.0%) |
| Total | 0 (0.0%) | 0 (0.0%) |
Real Estate Taxes by Mortgage Status in SUNY Oswego
| Property Taxes | Without Mortgage | With Mortgage |
| Less than $800 | 0 (0.0%) | 0 (0.0%) |
| $800 to $1,499 | 0 (0.0%) | 0 (0.0%) |
| $800 to $1,499 | 0 (0.0%) | 0 (0.0%) |
| Total | 0 (0.0%) | 0 (0.0%) |
Health & Disability in SUNY Oswego
Health Insurance Coverage by Age in SUNY Oswego
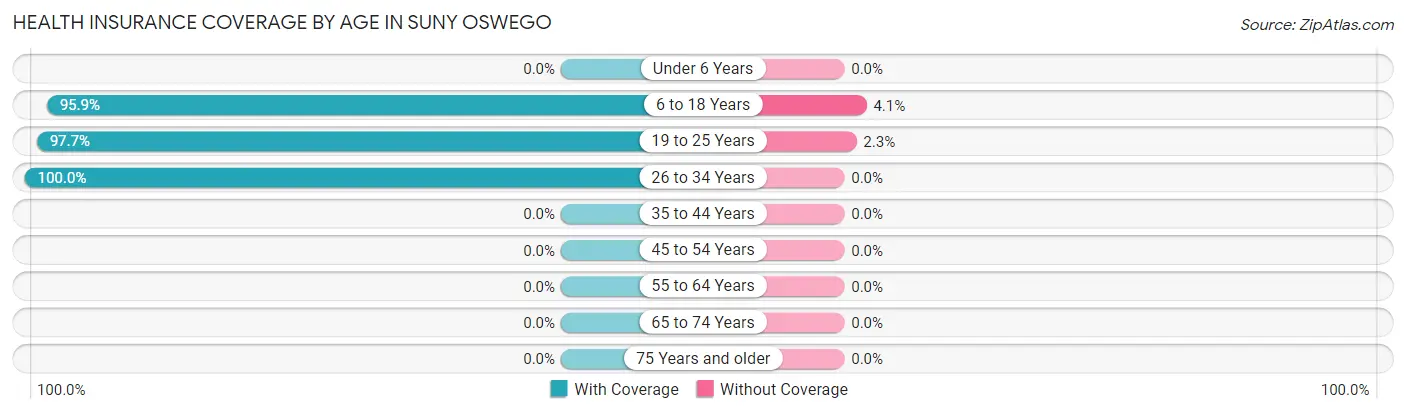
| Age Bracket | With Coverage | Without Coverage |
| Under 6 Years | 0 (0.0%) | 0 (0.0%) |
| 6 to 18 Years | 1,277 (95.9%) | 55 (4.1%) |
| 19 to 25 Years | 1,901 (97.7%) | 44 (2.3%) |
| 26 to 34 Years | 61 (100.0%) | 0 (0.0%) |
| 35 to 44 Years | 0 (0.0%) | 0 (0.0%) |
| 45 to 54 Years | 0 (0.0%) | 0 (0.0%) |
| 55 to 64 Years | 0 (0.0%) | 0 (0.0%) |
| 65 to 74 Years | 0 (0.0%) | 0 (0.0%) |
| 75 Years and older | 0 (0.0%) | 0 (0.0%) |
| Total | 3,239 (97.0%) | 99 (3.0%) |
Health Insurance Coverage by Citizenship Status in SUNY Oswego
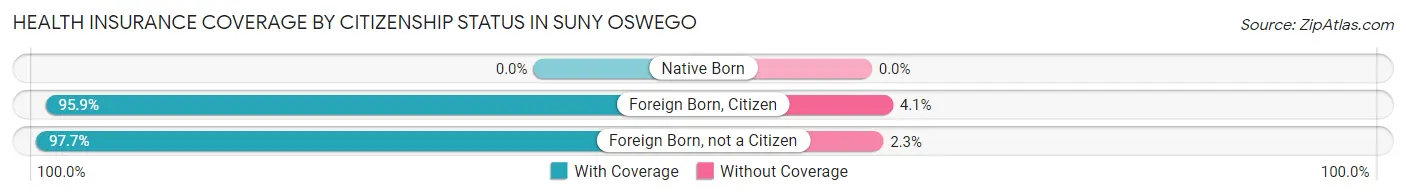
| Citizenship Status | With Coverage | Without Coverage |
| Native Born | 0 (0.0%) | 0 (0.0%) |
| Foreign Born, Citizen | 1,277 (95.9%) | 55 (4.1%) |
| Foreign Born, not a Citizen | 1,901 (97.7%) | 44 (2.3%) |
Health Insurance Coverage by Household Income in SUNY Oswego
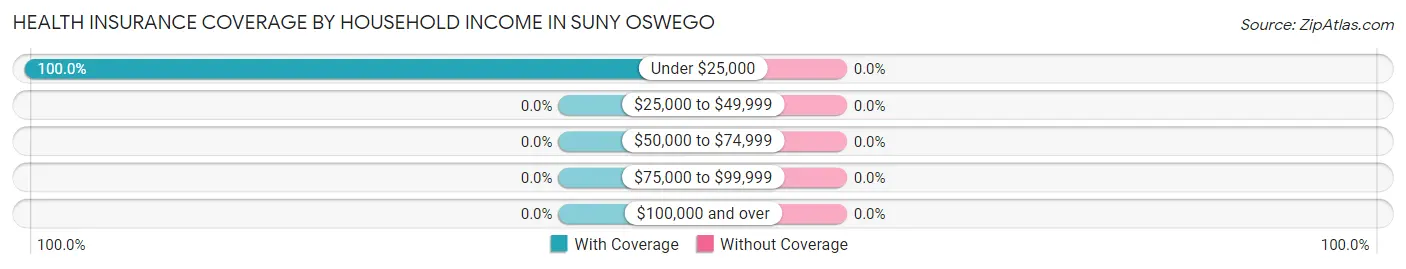
| Household Income | With Coverage | Without Coverage |
| Under $25,000 | 11 (100.0%) | 0 (0.0%) |
| $25,000 to $49,999 | 0 (0.0%) | 0 (0.0%) |
| $50,000 to $74,999 | 0 (0.0%) | 0 (0.0%) |
| $75,000 to $99,999 | 0 (0.0%) | 0 (0.0%) |
| $100,000 and over | 0 (0.0%) | 0 (0.0%) |
Public vs Private Health Insurance Coverage by Age in SUNY Oswego
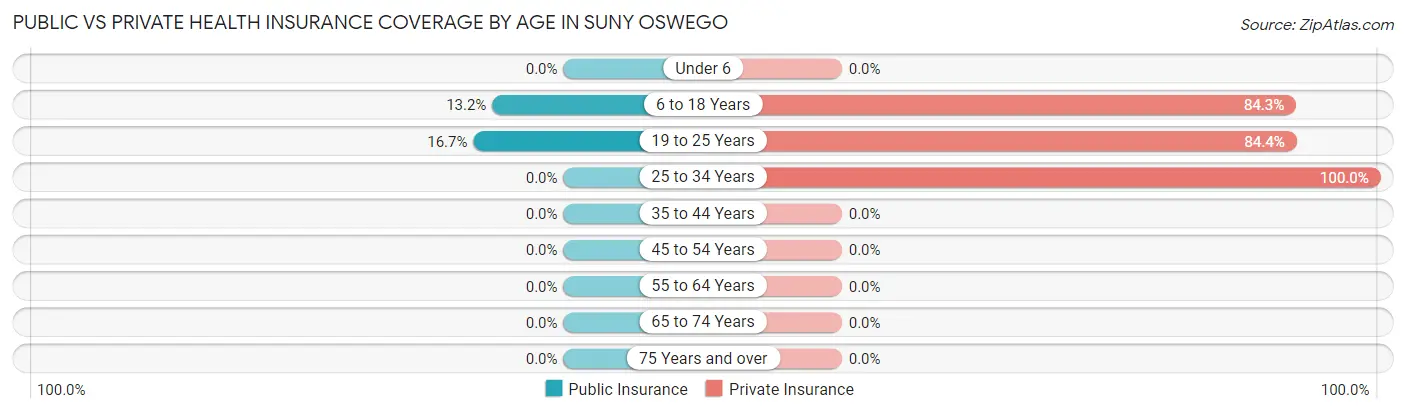
| Age Bracket | Public Insurance | Private Insurance |
| Under 6 | 0 (0.0%) | 0 (0.0%) |
| 6 to 18 Years | 176 (13.2%) | 1,123 (84.3%) |
| 19 to 25 Years | 325 (16.7%) | 1,642 (84.4%) |
| 25 to 34 Years | 0 (0.0%) | 61 (100.0%) |
| 35 to 44 Years | 0 (0.0%) | 0 (0.0%) |
| 45 to 54 Years | 0 (0.0%) | 0 (0.0%) |
| 55 to 64 Years | 0 (0.0%) | 0 (0.0%) |
| 65 to 74 Years | 0 (0.0%) | 0 (0.0%) |
| 75 Years and over | 0 (0.0%) | 0 (0.0%) |
| Total | 501 (15.0%) | 2,826 (84.7%) |
Disability Status by Sex by Age in SUNY Oswego
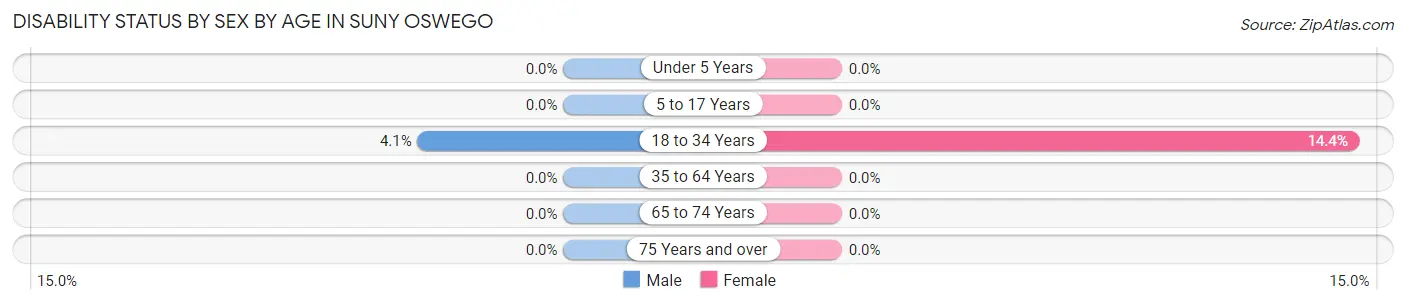
| Age Bracket | Male | Female |
| Under 5 Years | 0 (0.0%) | 0 (0.0%) |
| 5 to 17 Years | 0 (0.0%) | 0 (0.0%) |
| 18 to 34 Years | 68 (4.1%) | 233 (14.4%) |
| 35 to 64 Years | 0 (0.0%) | 0 (0.0%) |
| 65 to 74 Years | 0 (0.0%) | 0 (0.0%) |
| 75 Years and over | 0 (0.0%) | 0 (0.0%) |
Disability Class by Sex by Age in SUNY Oswego
Disability Class: Hearing Difficulty
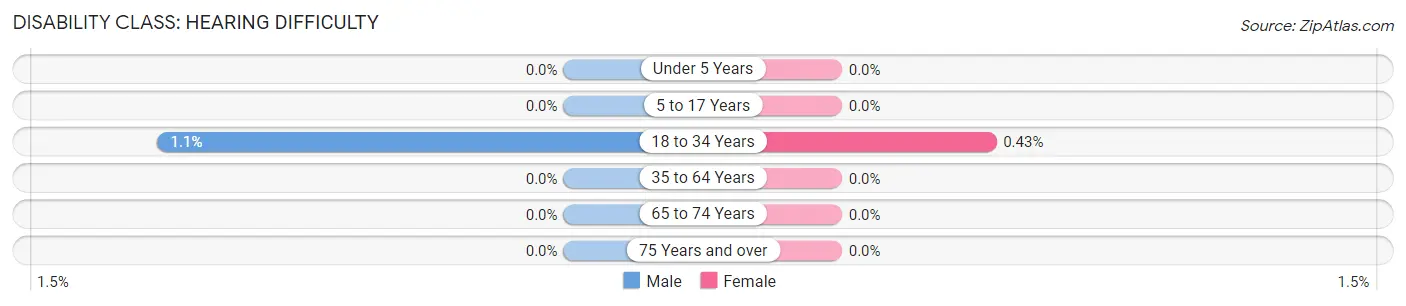
| Age Bracket | Male | Female |
| Under 5 Years | 0 (0.0%) | 0 (0.0%) |
| 5 to 17 Years | 0 (0.0%) | 0 (0.0%) |
| 18 to 34 Years | 19 (1.1%) | 7 (0.4%) |
| 35 to 64 Years | 0 (0.0%) | 0 (0.0%) |
| 65 to 74 Years | 0 (0.0%) | 0 (0.0%) |
| 75 Years and over | 0 (0.0%) | 0 (0.0%) |
Disability Class: Vision Difficulty
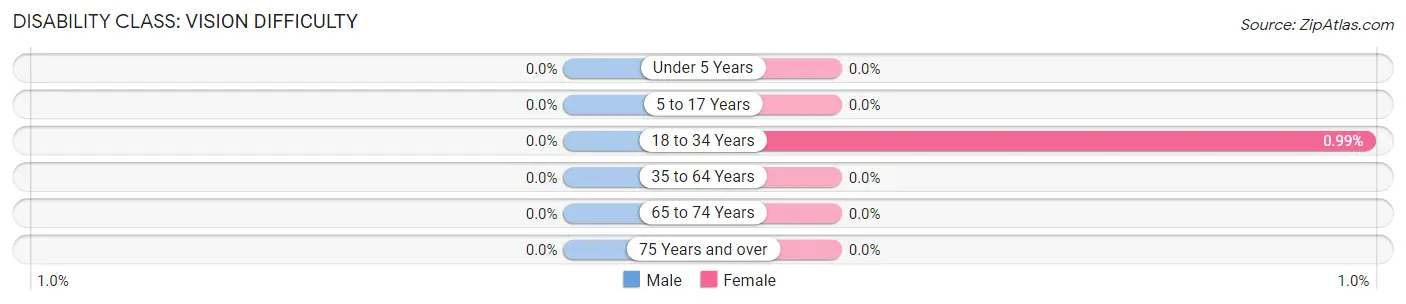
| Age Bracket | Male | Female |
| Under 5 Years | 0 (0.0%) | 0 (0.0%) |
| 5 to 17 Years | 0 (0.0%) | 0 (0.0%) |
| 18 to 34 Years | 0 (0.0%) | 16 (1.0%) |
| 35 to 64 Years | 0 (0.0%) | 0 (0.0%) |
| 65 to 74 Years | 0 (0.0%) | 0 (0.0%) |
| 75 Years and over | 0 (0.0%) | 0 (0.0%) |
Disability Class: Cognitive Difficulty
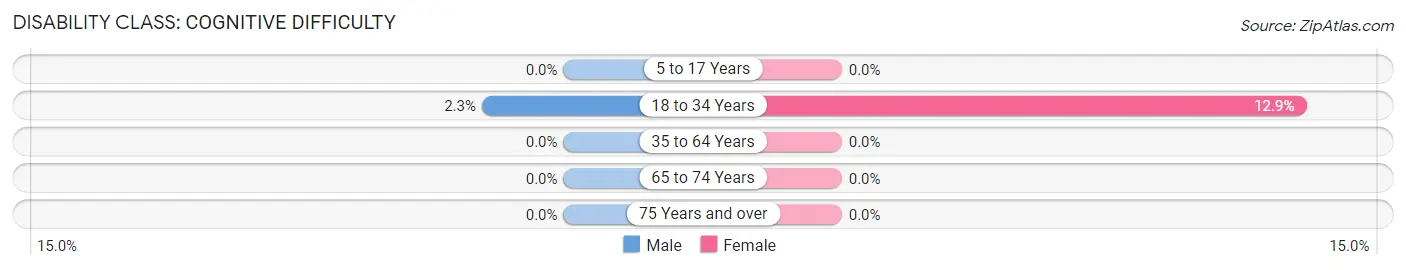
| Age Bracket | Male | Female |
| 5 to 17 Years | 0 (0.0%) | 0 (0.0%) |
| 18 to 34 Years | 38 (2.3%) | 209 (12.9%) |
| 35 to 64 Years | 0 (0.0%) | 0 (0.0%) |
| 65 to 74 Years | 0 (0.0%) | 0 (0.0%) |
| 75 Years and over | 0 (0.0%) | 0 (0.0%) |
Disability Class: Ambulatory Difficulty
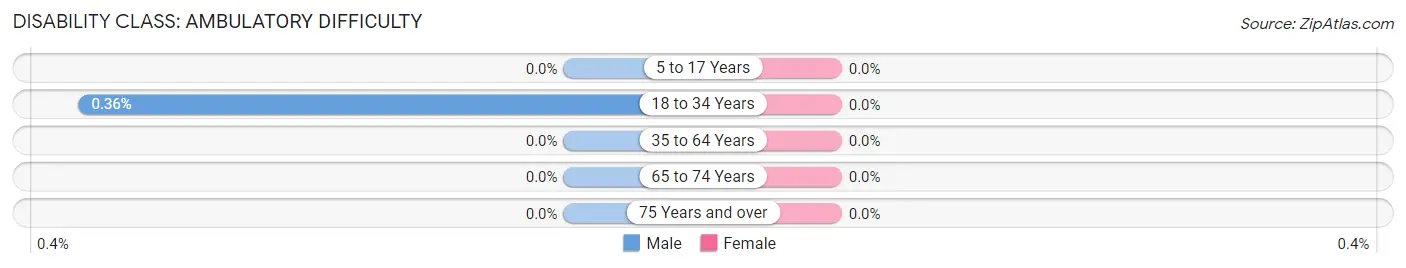
| Age Bracket | Male | Female |
| 5 to 17 Years | 0 (0.0%) | 0 (0.0%) |
| 18 to 34 Years | 6 (0.4%) | 0 (0.0%) |
| 35 to 64 Years | 0 (0.0%) | 0 (0.0%) |
| 65 to 74 Years | 0 (0.0%) | 0 (0.0%) |
| 75 Years and over | 0 (0.0%) | 0 (0.0%) |
Disability Class: Self-Care Difficulty
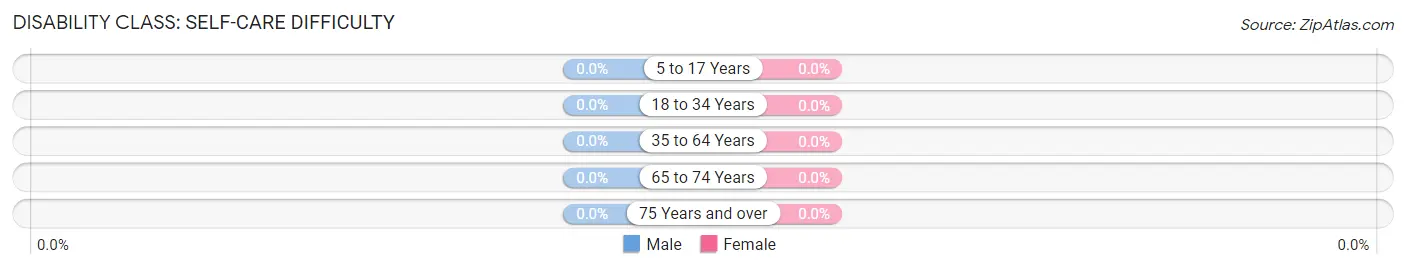
| Age Bracket | Male | Female |
| 5 to 17 Years | 0 (0.0%) | 0 (0.0%) |
| 18 to 34 Years | 0 (0.0%) | 0 (0.0%) |
| 35 to 64 Years | 0 (0.0%) | 0 (0.0%) |
| 65 to 74 Years | 0 (0.0%) | 0 (0.0%) |
| 75 Years and over | 0 (0.0%) | 0 (0.0%) |
Technology Access in SUNY Oswego
Computing Device Access in SUNY Oswego
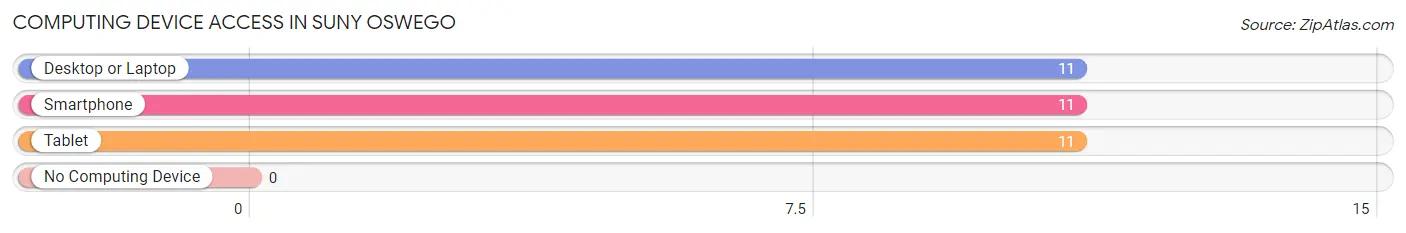
| Device Type | # Households | % Households |
| Desktop or Laptop | 11 | 100.0% |
| Smartphone | 11 | 100.0% |
| Tablet | 11 | 100.0% |
| No Computing Device | 0 | 0.0% |
| Total | 11 | 100.0% |
Internet Access in SUNY Oswego
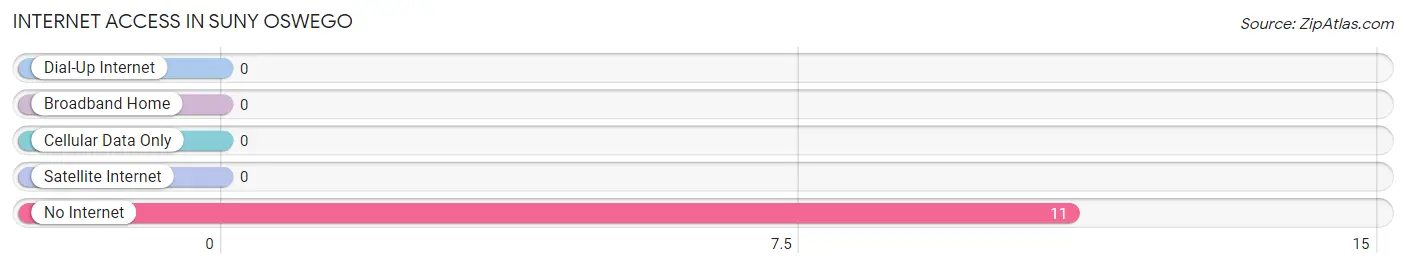
| Internet Type | # Households | % Households |
| Dial-Up Internet | 0 | 0.0% |
| Broadband Home | 0 | 0.0% |
| Cellular Data Only | 0 | 0.0% |
| Satellite Internet | 0 | 0.0% |
| No Internet | 11 | 100.0% |
| Total | 11 | 100.0% |
SUNY Oswego Summary
Suny Oswego, NY is a small city located in Oswego County, New York. It is situated on the eastern shore of Lake Ontario, approximately 30 miles north of Syracuse. The city has a population of approximately 18,000 people and is the county seat of Oswego County.
History
The area that is now Suny Oswego was originally inhabited by the Iroquois Native American tribe. The first European settlers arrived in the area in the late 1700s and established a trading post. The area was later incorporated as the village of Oswego in 1828. In 1848, the village was reincorporated as the city of Oswego.
In the late 1800s, the city of Oswego experienced a period of rapid growth and development. The city was home to several industries, including a paper mill, a steel mill, and a shipbuilding yard. The city also became a major port on Lake Ontario, and the Oswego Canal was constructed to connect the city to the Erie Canal.
In 1948, the State University of New York (SUNY) established a campus in Oswego. The campus was initially known as the Oswego State Teachers College, but it was later renamed the State University of New York at Oswego. The university has since grown to become one of the largest universities in the state.
Geography
Suny Oswego is located in Oswego County, New York. The city is situated on the eastern shore of Lake Ontario, approximately 30 miles north of Syracuse. The city is bordered by the towns of Scriba to the north, Granby to the east, and Oswego to the south. The city is also located near the Oswego River, which flows into Lake Ontario.
The city has a total area of 8.2 square miles, of which 7.9 square miles is land and 0.3 square miles is water. The city is located at an elevation of approximately 250 feet above sea level.
Economy
Suny Oswego is home to several major employers, including the State University of New York at Oswego, Oswego Health, and Novelis. The city is also home to several small businesses, including restaurants, retail stores, and professional services.
The city is also home to several manufacturing companies, including Oswego Industries, which produces aluminum products, and Oswego Plastics, which produces plastic products. The city is also home to several agricultural businesses, including dairy farms and fruit orchards.
Demographics
As of the 2010 census, Suny Oswego had a population of 18,142 people. The racial makeup of the city was 90.2% White, 4.2% African American, 0.7% Native American, 1.7% Asian, 0.1% Pacific Islander, and 2.1% from other races. Hispanic or Latino of any race were 4.3% of the population.
The median household income in Suny Oswego was $41,945, and the median family income was $50,945. The per capita income for the city was $20,945. Approximately 16.2% of the population was below the poverty line.
Common Questions
What is Per Capita Income in SUNY Oswego?
Per Capita income in SUNY Oswego is $8,002.
What is Income or Wage Gap in SUNY Oswego?
Income or Wage Gap in SUNY Oswego is 0.9%.
Women in SUNY Oswego earn 99.1 cents for every dollar earned by a man.
What is the Total Population of SUNY Oswego?
Total Population of SUNY Oswego is 3,338.
What is the Total Male Population of SUNY Oswego?
Total Male Population of SUNY Oswego is 1,708.
What is the Total Female Population of SUNY Oswego?
Total Female Population of SUNY Oswego is 1,630.
What is the Ratio of Males per 100 Females in SUNY Oswego?
There are 104.79 Males per 100 Females in SUNY Oswego.
What is the Ratio of Females per 100 Males in SUNY Oswego?
There are 95.43 Females per 100 Males in SUNY Oswego.
What is the Median Population Age in SUNY Oswego?
Median Population Age in SUNY Oswego is 19.4 Years.
How Large is the Labor Force in SUNY Oswego?
There are 1,399 People in the Labor Forcein in SUNY Oswego.
What is the Percentage of People in the Labor Force in SUNY Oswego?
41.9% of People are in the Labor Force in SUNY Oswego.
What is the Unemployment Rate in SUNY Oswego?
Unemployment Rate in SUNY Oswego is 23.8%.