Oneonta, NY Map & Demographics
Oneonta Map
Oneonta Overview
$27,061
PER CAPITA INCOME
$80,802
AVG FAMILY INCOME
$62,188
AVG HOUSEHOLD INCOME
67.6%
WAGE / INCOME GAP [ % ]
32.4¢/ $1
WAGE / INCOME GAP [ $ ]
0.45
INEQUALITY / GINI INDEX
14,097
TOTAL POPULATION
6,685
MALE POPULATION
7,412
FEMALE POPULATION
90.19
MALES / 100 FEMALES
110.88
FEMALES / 100 MALES
22.7
MEDIAN AGE
2.5
AVG FAMILY SIZE
2.1
AVG HOUSEHOLD SIZE
6,714
LABOR FORCE [ PEOPLE ]
51.9%
PERCENT IN LABOR FORCE
3.6%
UNEMPLOYMENT RATE
Oneonta Zip Codes
Oneonta Area Codes
Income in Oneonta
Income Overview in Oneonta
Per Capita Income in Oneonta is $27,061, while median incomes of families and households are $80,802 and $62,188 respectively.
| Characteristic | Number | Measure |
| Per Capita Income | 14,097 | $27,061 |
| Median Family Income | 2,233 | $80,802 |
| Mean Family Income | 2,233 | $98,633 |
| Median Household Income | 4,495 | $62,188 |
| Mean Household Income | 4,495 | $75,667 |
| Income Deficit | 2,233 | $0 |
| Wage / Income Gap (%) | 14,097 | 67.62% |
| Wage / Income Gap ($) | 14,097 | 32.38¢ per $1 |
| Gini / Inequality Index | 14,097 | 0.45 |
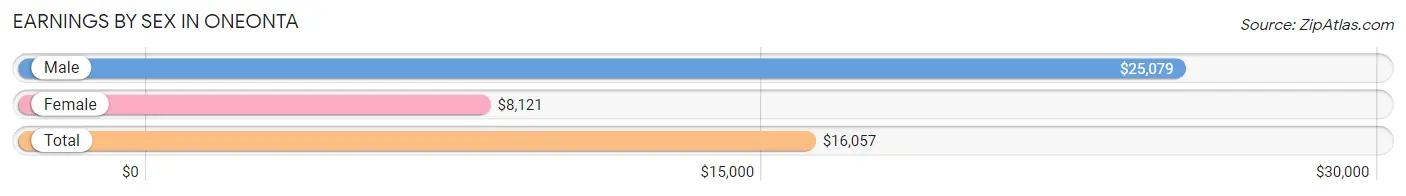
Earnings by Sex in Oneonta
Average Earnings in Oneonta are $16,057, $25,079 for men and $8,121 for women, a difference of 67.6%.
| Sex | Number | Average Earnings |
| Male | 4,311 (47.8%) | $25,079 |
| Female | 4,698 (52.1%) | $8,121 |
| Total | 9,009 (100.0%) | $16,057 |
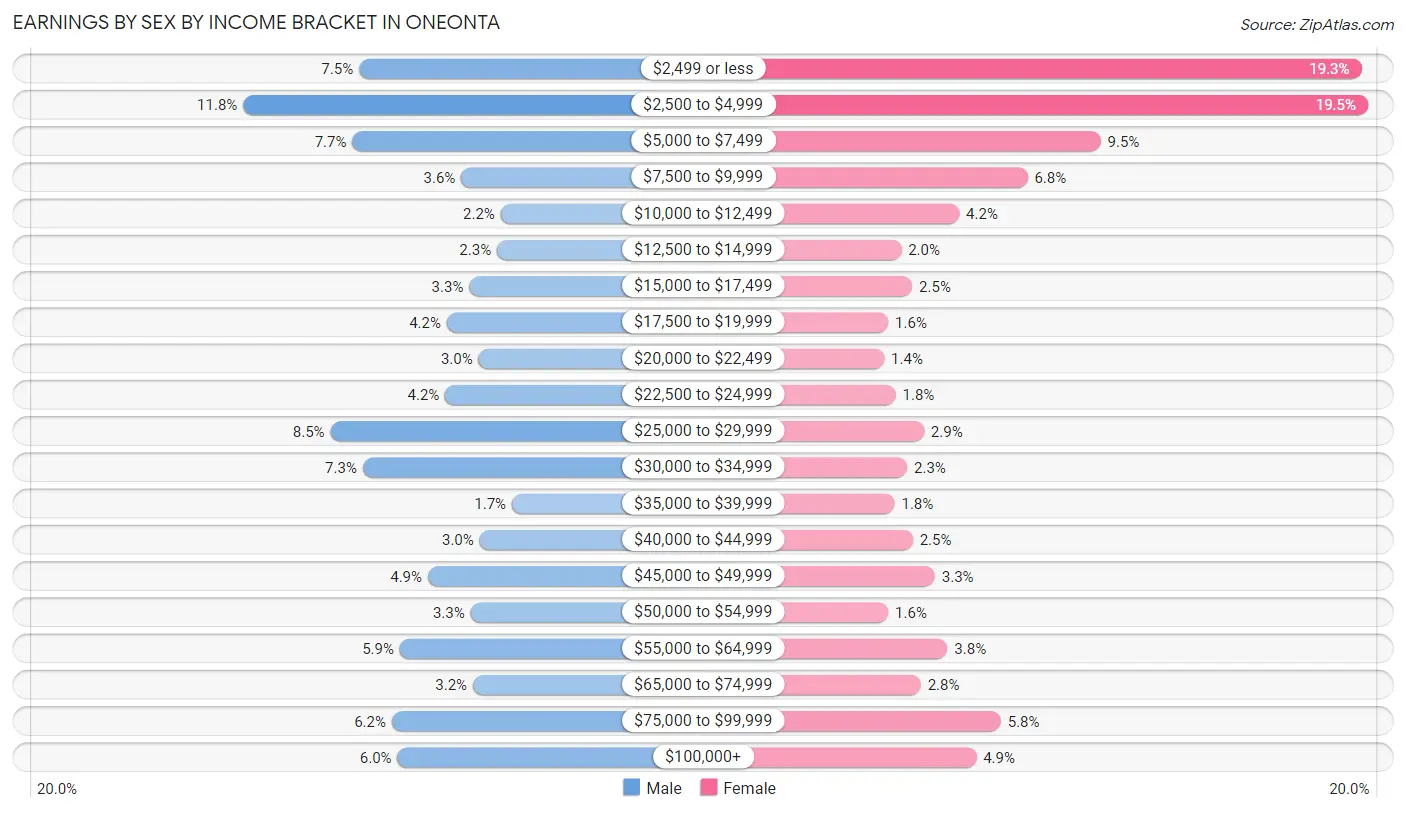
Earnings by Sex by Income Bracket in Oneonta
The most common earnings brackets in Oneonta are $2,500 to $4,999 for men (509 | 11.8%) and $2,500 to $4,999 for women (917 | 19.5%).
| Income | Male | Female |
| $2,499 or less | 322 (7.5%) | 906 (19.3%) |
| $2,500 to $4,999 | 509 (11.8%) | 917 (19.5%) |
| $5,000 to $7,499 | 333 (7.7%) | 447 (9.5%) |
| $7,500 to $9,999 | 157 (3.6%) | 318 (6.8%) |
| $10,000 to $12,499 | 93 (2.2%) | 198 (4.2%) |
| $12,500 to $14,999 | 99 (2.3%) | 96 (2.0%) |
| $15,000 to $17,499 | 144 (3.3%) | 115 (2.5%) |
| $17,500 to $19,999 | 180 (4.2%) | 73 (1.5%) |
| $20,000 to $22,499 | 129 (3.0%) | 66 (1.4%) |
| $22,500 to $24,999 | 183 (4.2%) | 86 (1.8%) |
| $25,000 to $29,999 | 368 (8.5%) | 136 (2.9%) |
| $30,000 to $34,999 | 316 (7.3%) | 106 (2.3%) |
| $35,000 to $39,999 | 75 (1.7%) | 84 (1.8%) |
| $40,000 to $44,999 | 127 (2.9%) | 116 (2.5%) |
| $45,000 to $49,999 | 211 (4.9%) | 155 (3.3%) |
| $50,000 to $54,999 | 142 (3.3%) | 73 (1.5%) |
| $55,000 to $64,999 | 256 (5.9%) | 177 (3.8%) |
| $65,000 to $74,999 | 138 (3.2%) | 130 (2.8%) |
| $75,000 to $99,999 | 269 (6.2%) | 271 (5.8%) |
| $100,000+ | 260 (6.0%) | 228 (4.9%) |
| Total | 4,311 (100.0%) | 4,698 (100.0%) |
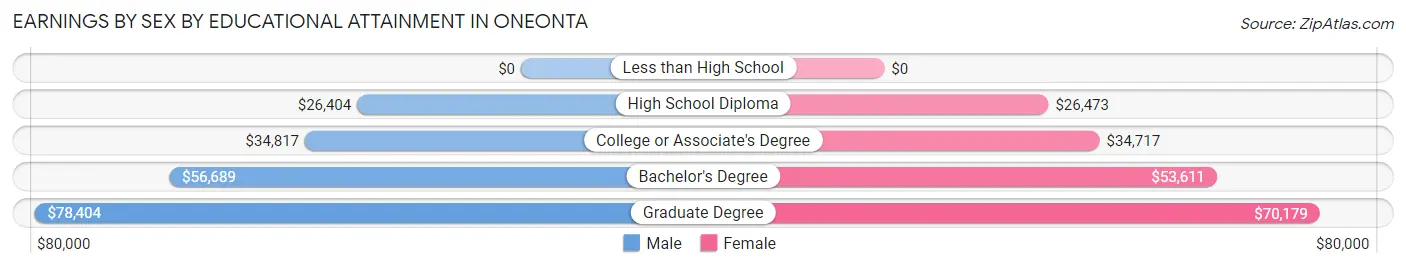
Earnings by Sex by Educational Attainment in Oneonta
Average earnings in Oneonta are $45,201 for men and $46,389 for women, a difference of 2.6%. Men with an educational attainment of graduate degree enjoy the highest average annual earnings of $78,404, while those with high school diploma education earn the least with $26,404. Women with an educational attainment of graduate degree earn the most with the average annual earnings of $70,179, while those with high school diploma education have the smallest earnings of $26,473.
| Educational Attainment | Male Income | Female Income |
| Less than High School | - | - |
| High School Diploma | $26,404 | $26,473 |
| College or Associate's Degree | $34,817 | $34,717 |
| Bachelor's Degree | $56,689 | $53,611 |
| Graduate Degree | $78,404 | $70,179 |
| Total | $45,201 | $46,389 |
Family Income in Oneonta
Family Income Brackets in Oneonta
According to the Oneonta family income data, there are 462 families falling into the $100,000 to $149,999 income range, which is the most common income bracket and makes up 20.7% of all families. Conversely, the $10,000 to $14,999 income bracket is the least frequent group with only 38 families (1.7%) belonging to this category.
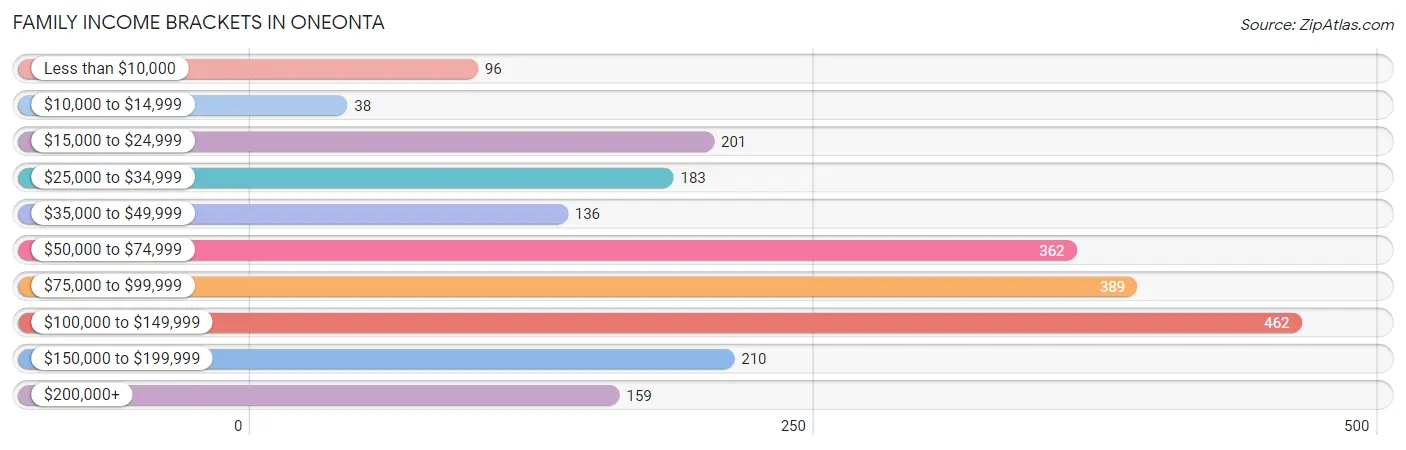
| Income Bracket | # Families | % Families |
| Less than $10,000 | 96 | 4.3% |
| $10,000 to $14,999 | 38 | 1.7% |
| $15,000 to $24,999 | 201 | 9.0% |
| $25,000 to $34,999 | 183 | 8.2% |
| $35,000 to $49,999 | 136 | 6.1% |
| $50,000 to $74,999 | 362 | 16.2% |
| $75,000 to $99,999 | 389 | 17.4% |
| $100,000 to $149,999 | 462 | 20.7% |
| $150,000 to $199,999 | 210 | 9.4% |
| $200,000+ | 159 | 7.1% |
Family Income by Famaliy Size in Oneonta
3-person families (422 | 18.9%) account for the highest median family income in Oneonta with $101,522 per family, while 2-person families (1,501 | 67.2%) have the highest median income of $34,820 per family member.
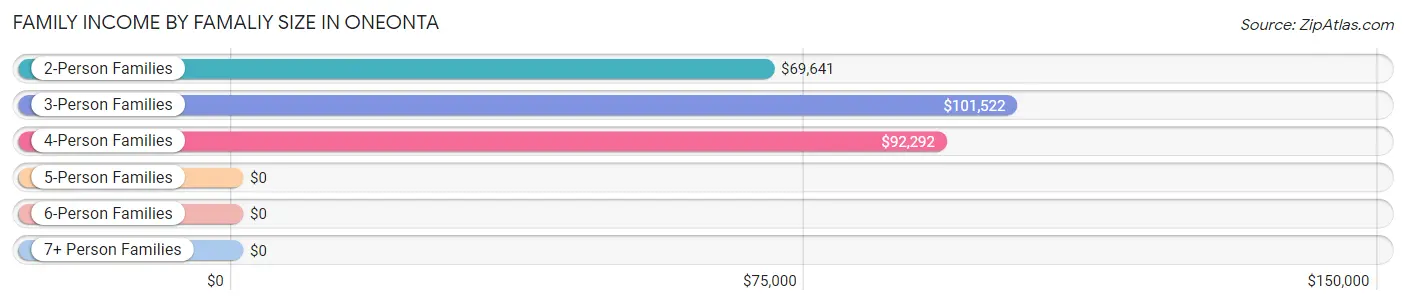
| Income Bracket | # Families | Median Income |
| 2-Person Families | 1,501 (67.2%) | $69,641 |
| 3-Person Families | 422 (18.9%) | $101,522 |
| 4-Person Families | 258 (11.6%) | $92,292 |
| 5-Person Families | 27 (1.2%) | $0 |
| 6-Person Families | 15 (0.7%) | $0 |
| 7+ Person Families | 10 (0.4%) | $0 |
| Total | 2,233 (100.0%) | $80,802 |
Family Income by Number of Earners in Oneonta
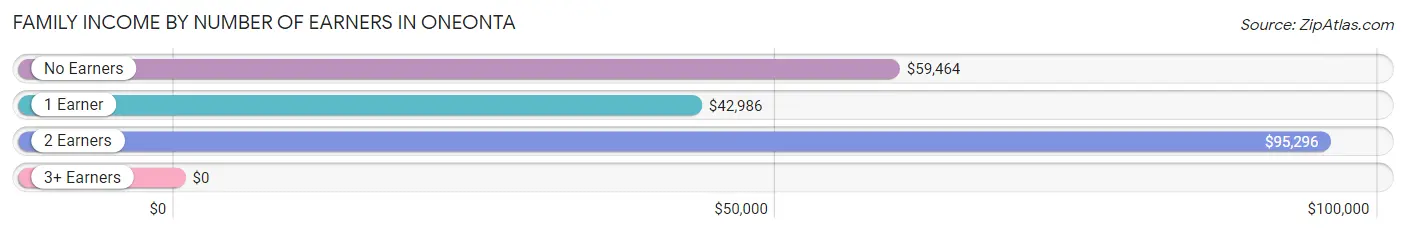
| Number of Earners | # Families | Median Income |
| No Earners | 375 (16.8%) | $59,464 |
| 1 Earner | 869 (38.9%) | $42,986 |
| 2 Earners | 891 (39.9%) | $95,296 |
| 3+ Earners | 98 (4.4%) | $0 |
| Total | 2,233 (100.0%) | $80,802 |
Household Income in Oneonta
Household Income Brackets in Oneonta
With 890 households falling in the category, the $50,000 to $74,999 income range is the most frequent in Oneonta, accounting for 19.8% of all households. In contrast, only 171 households (3.8%) fall into the $200,000+ income bracket, making it the least populous group.
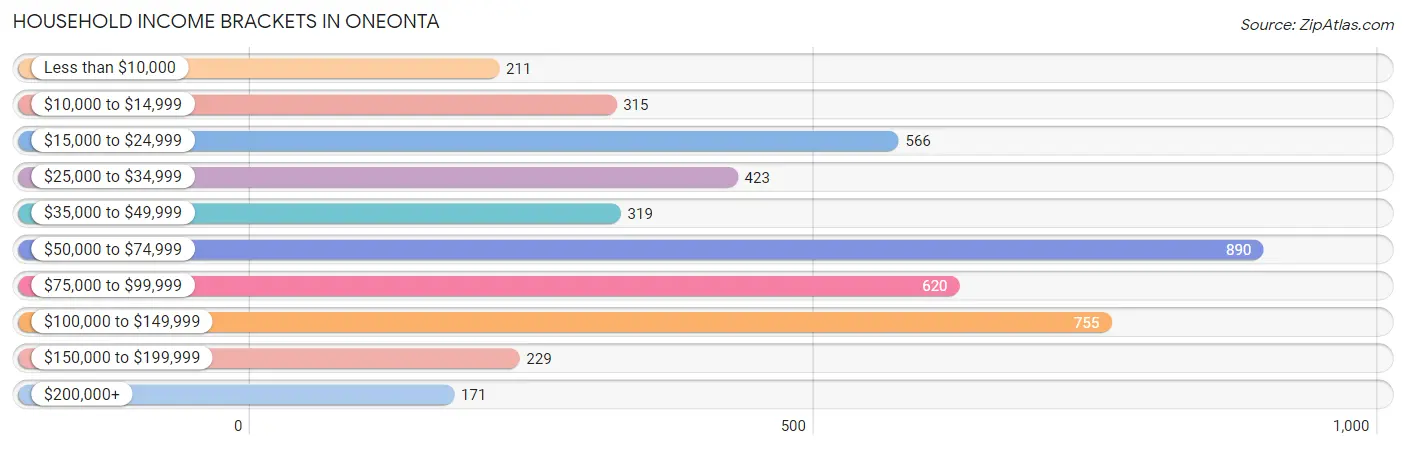
| Income Bracket | # Households | % Households |
| Less than $10,000 | 211 | 4.7% |
| $10,000 to $14,999 | 315 | 7.0% |
| $15,000 to $24,999 | 566 | 12.6% |
| $25,000 to $34,999 | 423 | 9.4% |
| $35,000 to $49,999 | 319 | 7.1% |
| $50,000 to $74,999 | 890 | 19.8% |
| $75,000 to $99,999 | 620 | 13.8% |
| $100,000 to $149,999 | 755 | 16.8% |
| $150,000 to $199,999 | 229 | 5.1% |
| $200,000+ | 171 | 3.8% |
Household Income by Householder Age in Oneonta
The median household income in Oneonta is $62,188, with the highest median household income of $87,622 found in the 45 to 64 years age bracket for the primary householder. A total of 1,330 households (29.6%) fall into this category. Meanwhile, the 15 to 24 years age bracket for the primary householder has the lowest median household income of $28,699, with 604 households (13.4%) in this group.
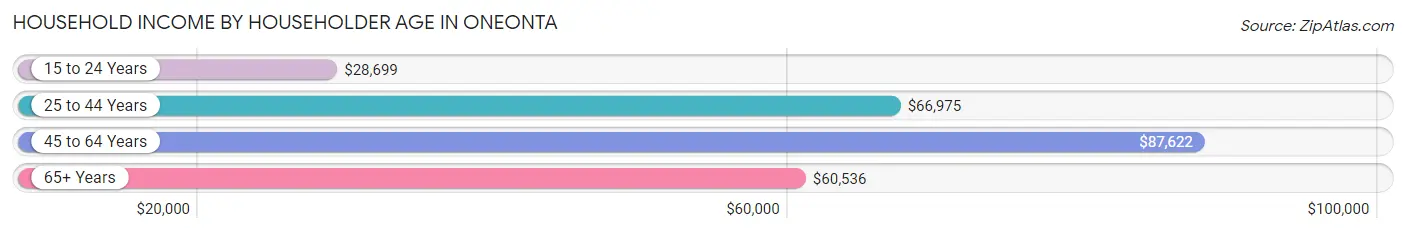
| Income Bracket | # Households | Median Income |
| 15 to 24 Years | 604 (13.4%) | $28,699 |
| 25 to 44 Years | 1,337 (29.7%) | $66,975 |
| 45 to 64 Years | 1,330 (29.6%) | $87,622 |
| 65+ Years | 1,224 (27.2%) | $60,536 |
| Total | 4,495 (100.0%) | $62,188 |
Poverty in Oneonta
Income Below Poverty by Sex and Age in Oneonta
With 13.5% poverty level for males and 27.0% for females among the residents of Oneonta, under 5 year old males and 18 to 24 year old females are the most vulnerable to poverty, with 129 males (41.6%) and 861 females (80.6%) in their respective age groups living below the poverty level.
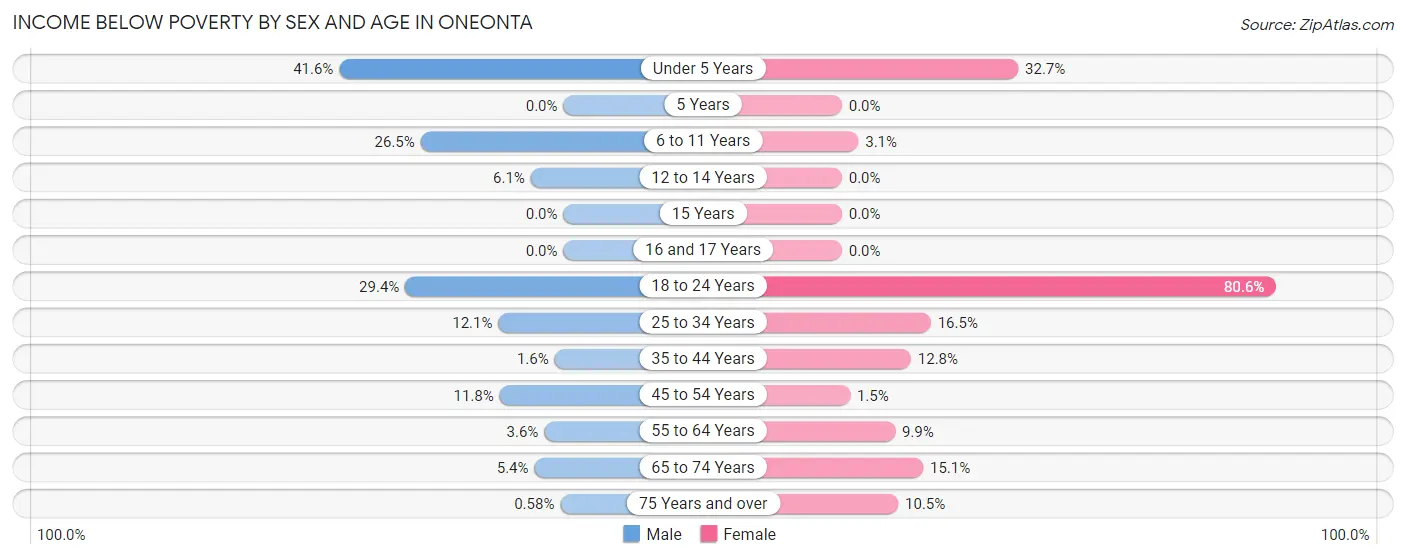
| Age Bracket | Male | Female |
| Under 5 Years | 129 (41.6%) | 36 (32.7%) |
| 5 Years | 0 (0.0%) | 0 (0.0%) |
| 6 to 11 Years | 31 (26.5%) | 6 (3.1%) |
| 12 to 14 Years | 15 (6.1%) | 0 (0.0%) |
| 15 Years | 0 (0.0%) | 0 (0.0%) |
| 16 and 17 Years | 0 (0.0%) | 0 (0.0%) |
| 18 to 24 Years | 271 (29.4%) | 861 (80.6%) |
| 25 to 34 Years | 112 (12.1%) | 71 (16.5%) |
| 35 to 44 Years | 8 (1.6%) | 65 (12.8%) |
| 45 to 54 Years | 63 (11.8%) | 7 (1.5%) |
| 55 to 64 Years | 18 (3.6%) | 62 (9.9%) |
| 65 to 74 Years | 30 (5.4%) | 98 (15.1%) |
| 75 Years and over | 2 (0.6%) | 37 (10.4%) |
| Total | 679 (13.5%) | 1,243 (27.0%) |
Income Above Poverty by Sex and Age in Oneonta
According to the poverty statistics in Oneonta, males aged 5 years and females aged 5 years are the age groups that are most secure financially, with 100.0% of males and 100.0% of females in these age groups living above the poverty line.
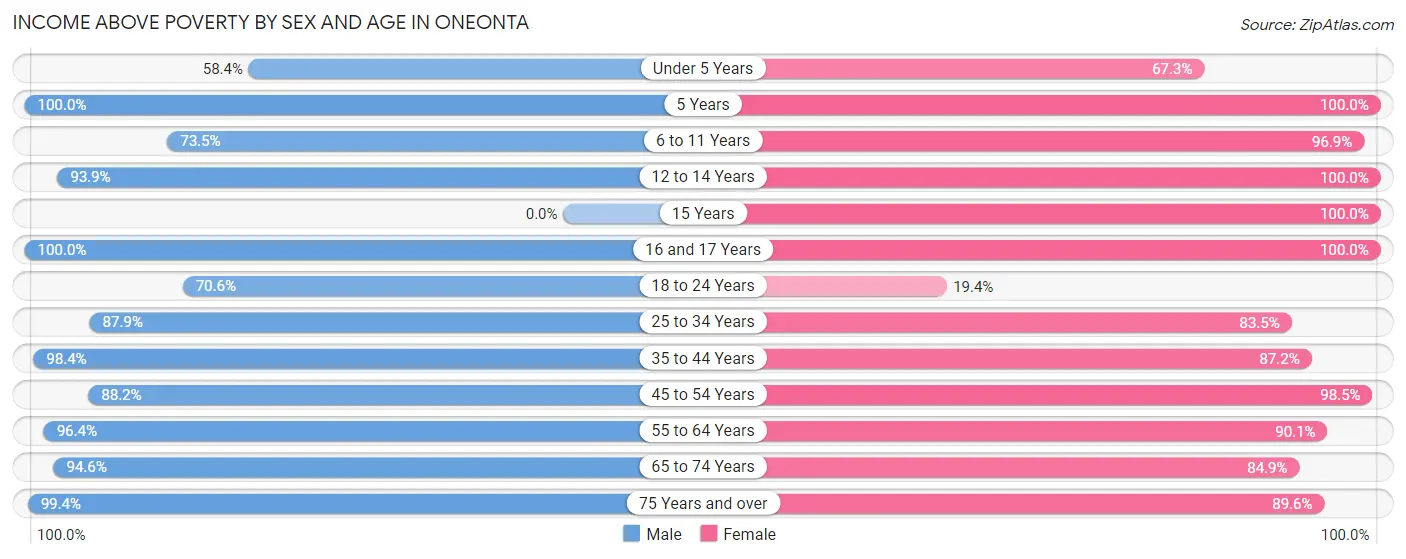
| Age Bracket | Male | Female |
| Under 5 Years | 181 (58.4%) | 74 (67.3%) |
| 5 Years | 14 (100.0%) | 11 (100.0%) |
| 6 to 11 Years | 86 (73.5%) | 190 (96.9%) |
| 12 to 14 Years | 232 (93.9%) | 78 (100.0%) |
| 15 Years | 0 (0.0%) | 58 (100.0%) |
| 16 and 17 Years | 53 (100.0%) | 53 (100.0%) |
| 18 to 24 Years | 652 (70.6%) | 207 (19.4%) |
| 25 to 34 Years | 816 (87.9%) | 359 (83.5%) |
| 35 to 44 Years | 481 (98.4%) | 442 (87.2%) |
| 45 to 54 Years | 469 (88.2%) | 454 (98.5%) |
| 55 to 64 Years | 488 (96.4%) | 566 (90.1%) |
| 65 to 74 Years | 528 (94.6%) | 552 (84.9%) |
| 75 Years and over | 341 (99.4%) | 317 (89.5%) |
| Total | 4,341 (86.5%) | 3,361 (73.0%) |
Income Below Poverty Among Married-Couple Families in Oneonta
The poverty statistics for married-couple families in Oneonta show that 2.7% or 41 of the total 1,495 families live below the poverty line. Families with 1 or 2 children have the highest poverty rate of 7.9%, comprising of 35 families. On the other hand, families with 3 or 4 children have the lowest poverty rate of 0.0%, which includes 0 families.
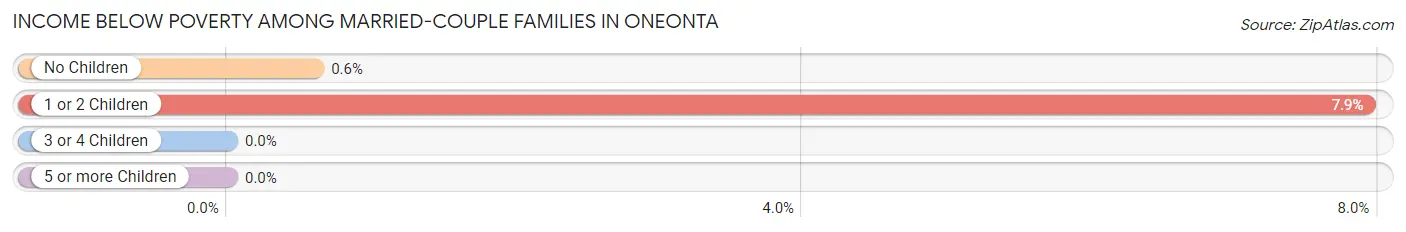
| Children | Above Poverty | Below Poverty |
| No Children | 995 (99.4%) | 6 (0.6%) |
| 1 or 2 Children | 407 (92.1%) | 35 (7.9%) |
| 3 or 4 Children | 42 (100.0%) | 0 (0.0%) |
| 5 or more Children | 10 (100.0%) | 0 (0.0%) |
| Total | 1,454 (97.3%) | 41 (2.7%) |
Income Below Poverty Among Single-Parent Households in Oneonta
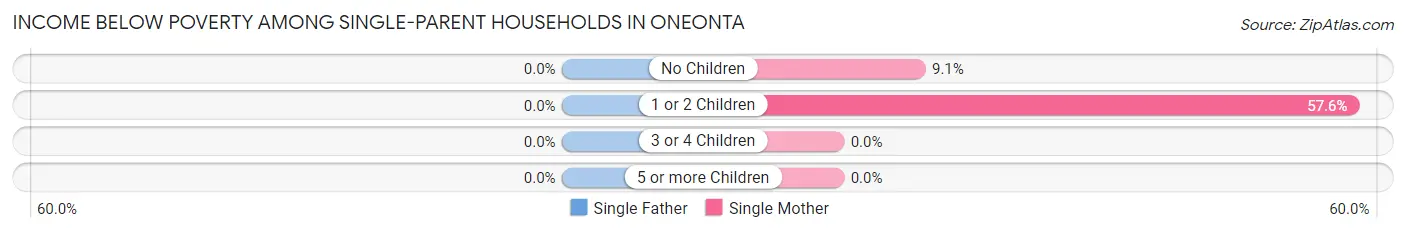
| Children | Single Father | Single Mother |
| No Children | 0 (0.0%) | 10 (9.1%) |
| 1 or 2 Children | 0 (0.0%) | 219 (57.6%) |
| 3 or 4 Children | 0 (0.0%) | 0 (0.0%) |
| 5 or more Children | 0 (0.0%) | 0 (0.0%) |
| Total | 0 (0.0%) | 229 (46.7%) |
Income Below Poverty Among Married-Couple vs Single-Parent Households in Oneonta
The poverty data for Oneonta shows that 41 of the married-couple family households (2.7%) and 229 of the single-parent households (31.0%) are living below the poverty level. Within the married-couple family households, those with 1 or 2 children have the highest poverty rate, with 35 households (7.9%) falling below the poverty line. Among the single-parent households, those with 1 or 2 children have the highest poverty rate, with 219 household (48.2%) living below poverty.
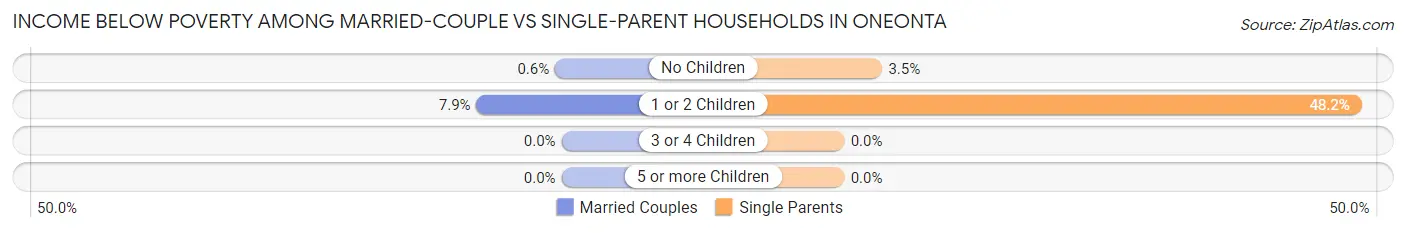
| Children | Married-Couple Families | Single-Parent Households |
| No Children | 6 (0.6%) | 10 (3.5%) |
| 1 or 2 Children | 35 (7.9%) | 219 (48.2%) |
| 3 or 4 Children | 0 (0.0%) | 0 (0.0%) |
| 5 or more Children | 0 (0.0%) | 0 (0.0%) |
| Total | 41 (2.7%) | 229 (31.0%) |
Race in Oneonta
The most populous races in Oneonta are White / Caucasian (11,680 | 82.9%), Hispanic or Latino (1,099 | 7.8%), and Black / African American (861 | 6.1%).
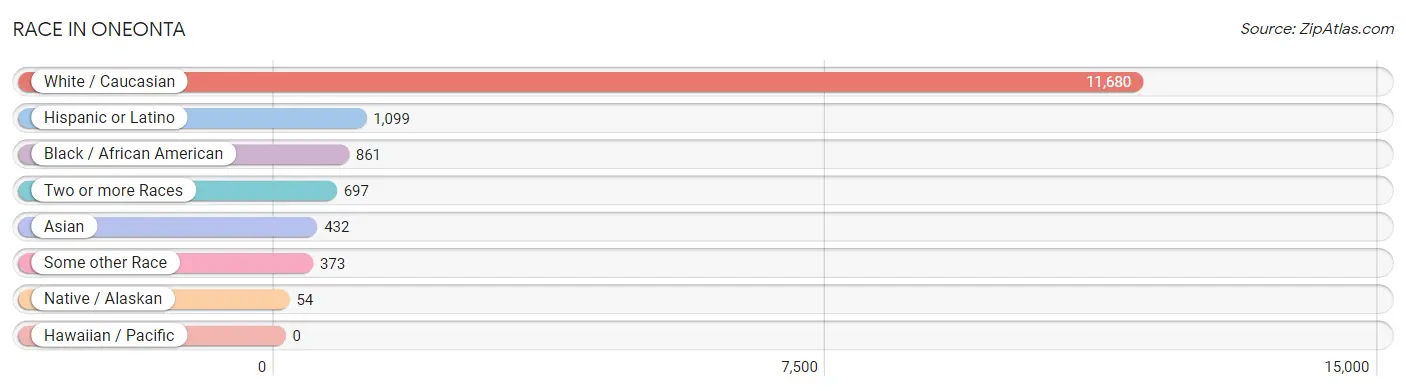
| Race | # Population | % Population |
| Asian | 432 | 3.1% |
| Black / African American | 861 | 6.1% |
| Hawaiian / Pacific | 0 | 0.0% |
| Hispanic or Latino | 1,099 | 7.8% |
| Native / Alaskan | 54 | 0.4% |
| White / Caucasian | 11,680 | 82.9% |
| Two or more Races | 697 | 4.9% |
| Some other Race | 373 | 2.6% |
| Total | 14,097 | 100.0% |
Ancestry in Oneonta
The most populous ancestries reported in Oneonta are Irish (2,462 | 17.5%), Italian (2,217 | 15.7%), German (2,015 | 14.3%), English (1,423 | 10.1%), and Polish (569 | 4.0%), together accounting for 61.6% of all Oneonta residents.
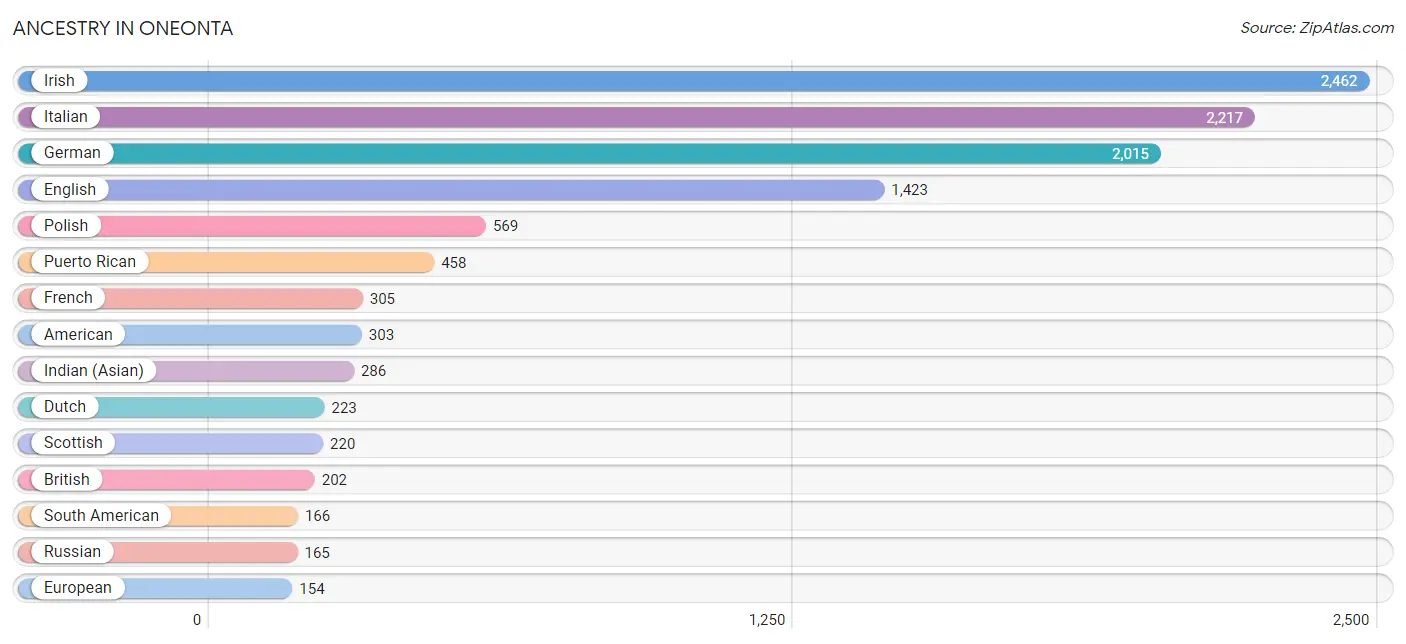
| Ancestry | # Population | % Population |
| African | 12 | 0.1% |
| Albanian | 47 | 0.3% |
| American | 303 | 2.1% |
| Arab | 86 | 0.6% |
| Austrian | 39 | 0.3% |
| Belgian | 9 | 0.1% |
| Bhutanese | 25 | 0.2% |
| Blackfeet | 3 | 0.0% |
| British | 202 | 1.4% |
| British West Indian | 32 | 0.2% |
| Burmese | 72 | 0.5% |
| Canadian | 21 | 0.2% |
| Central American | 23 | 0.2% |
| Central American Indian | 108 | 0.8% |
| Cherokee | 21 | 0.2% |
| Colombian | 57 | 0.4% |
| Croatian | 19 | 0.1% |
| Cuban | 12 | 0.1% |
| Czech | 24 | 0.2% |
| Danish | 65 | 0.5% |
| Dominican | 75 | 0.5% |
| Dutch | 223 | 1.6% |
| Eastern European | 51 | 0.4% |
| Ecuadorian | 88 | 0.6% |
| English | 1,423 | 10.1% |
| European | 154 | 1.1% |
| Finnish | 32 | 0.2% |
| French | 305 | 2.2% |
| French Canadian | 66 | 0.5% |
| German | 2,015 | 14.3% |
| Greek | 93 | 0.7% |
| Haitian | 40 | 0.3% |
| Hungarian | 75 | 0.5% |
| Icelander | 18 | 0.1% |
| Indian (Asian) | 286 | 2.0% |
| Iranian | 6 | 0.0% |
| Irish | 2,462 | 17.5% |
| Italian | 2,217 | 15.7% |
| Jamaican | 8 | 0.1% |
| Korean | 16 | 0.1% |
| Lebanese | 79 | 0.6% |
| Lithuanian | 5 | 0.0% |
| Maltese | 37 | 0.3% |
| Mexican | 87 | 0.6% |
| Nigerian | 20 | 0.1% |
| Norwegian | 136 | 1.0% |
| Pakistani | 3 | 0.0% |
| Palestinian | 7 | 0.1% |
| Pennsylvania German | 17 | 0.1% |
| Peruvian | 21 | 0.2% |
| Polish | 569 | 4.0% |
| Puerto Rican | 458 | 3.3% |
| Romanian | 14 | 0.1% |
| Russian | 165 | 1.2% |
| Salvadoran | 23 | 0.2% |
| Scandinavian | 106 | 0.7% |
| Scotch-Irish | 89 | 0.6% |
| Scottish | 220 | 1.6% |
| Serbian | 48 | 0.3% |
| Slavic | 11 | 0.1% |
| South American | 166 | 1.2% |
| Spaniard | 6 | 0.0% |
| Subsaharan African | 38 | 0.3% |
| Swedish | 120 | 0.9% |
| Swiss | 3 | 0.0% |
| Thai | 81 | 0.6% |
| Trinidadian and Tobagonian | 9 | 0.1% |
| Ukrainian | 60 | 0.4% |
| Welsh | 86 | 0.6% |
| West Indian | 24 | 0.2% |
| Yugoslavian | 6 | 0.0% | View All 71 Rows |
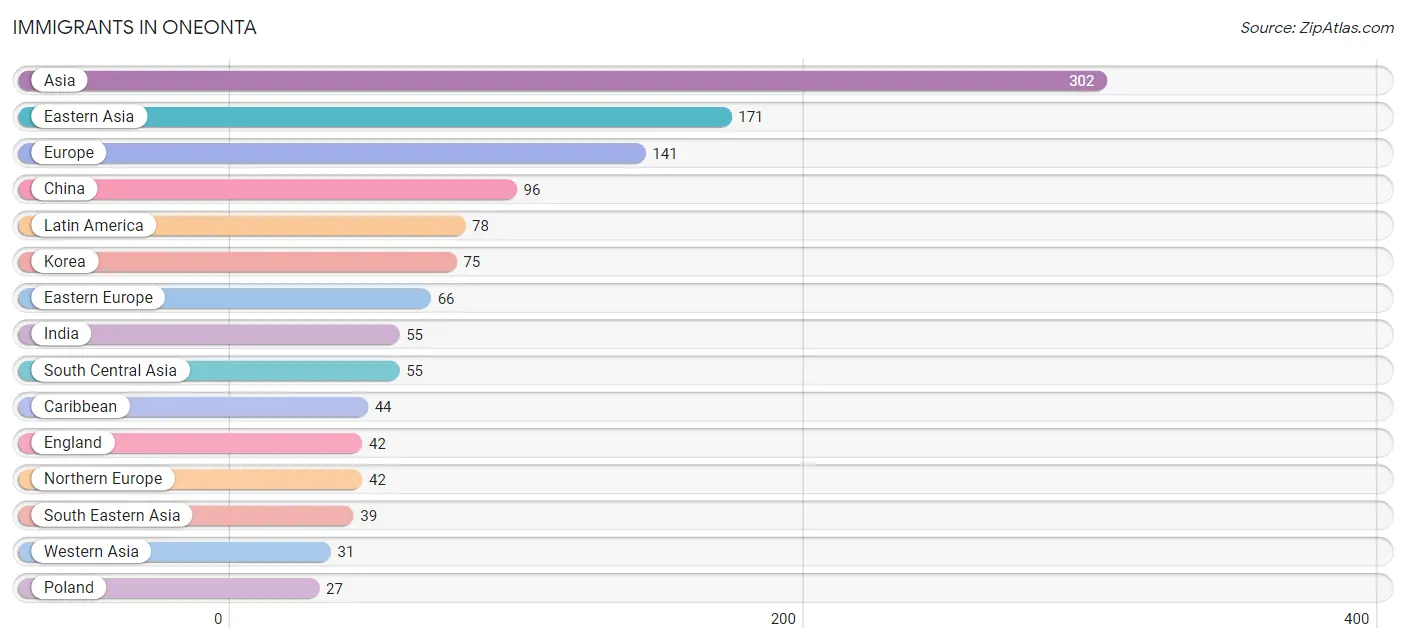
Immigrants in Oneonta
The most numerous immigrant groups reported in Oneonta came from Asia (302 | 2.1%), Eastern Asia (171 | 1.2%), Europe (141 | 1.0%), China (96 | 0.7%), and Latin America (78 | 0.5%), together accounting for 5.6% of all Oneonta residents.
| Immigration Origin | # Population | % Population |
| Africa | 9 | 0.1% |
| Asia | 302 | 2.1% |
| Canada | 21 | 0.2% |
| Caribbean | 44 | 0.3% |
| Central America | 25 | 0.2% |
| China | 96 | 0.7% |
| Cuba | 12 | 0.1% |
| Dominica | 24 | 0.2% |
| Eastern Asia | 171 | 1.2% |
| Eastern Europe | 66 | 0.5% |
| England | 42 | 0.3% |
| Europe | 141 | 1.0% |
| France | 10 | 0.1% |
| Germany | 14 | 0.1% |
| Greece | 9 | 0.1% |
| Hong Kong | 15 | 0.1% |
| India | 55 | 0.4% |
| Iraq | 18 | 0.1% |
| Jamaica | 8 | 0.1% |
| Korea | 75 | 0.5% |
| Latin America | 78 | 0.5% |
| Lebanon | 13 | 0.1% |
| Mexico | 25 | 0.2% |
| Northern Europe | 42 | 0.3% |
| Peru | 9 | 0.1% |
| Philippines | 16 | 0.1% |
| Poland | 27 | 0.2% |
| Serbia | 16 | 0.1% |
| Singapore | 20 | 0.1% |
| South America | 9 | 0.1% |
| South Central Asia | 55 | 0.4% |
| South Eastern Asia | 39 | 0.3% |
| Southern Europe | 9 | 0.1% |
| Thailand | 3 | 0.0% |
| Western Asia | 31 | 0.2% |
| Western Europe | 24 | 0.2% | View All 36 Rows |
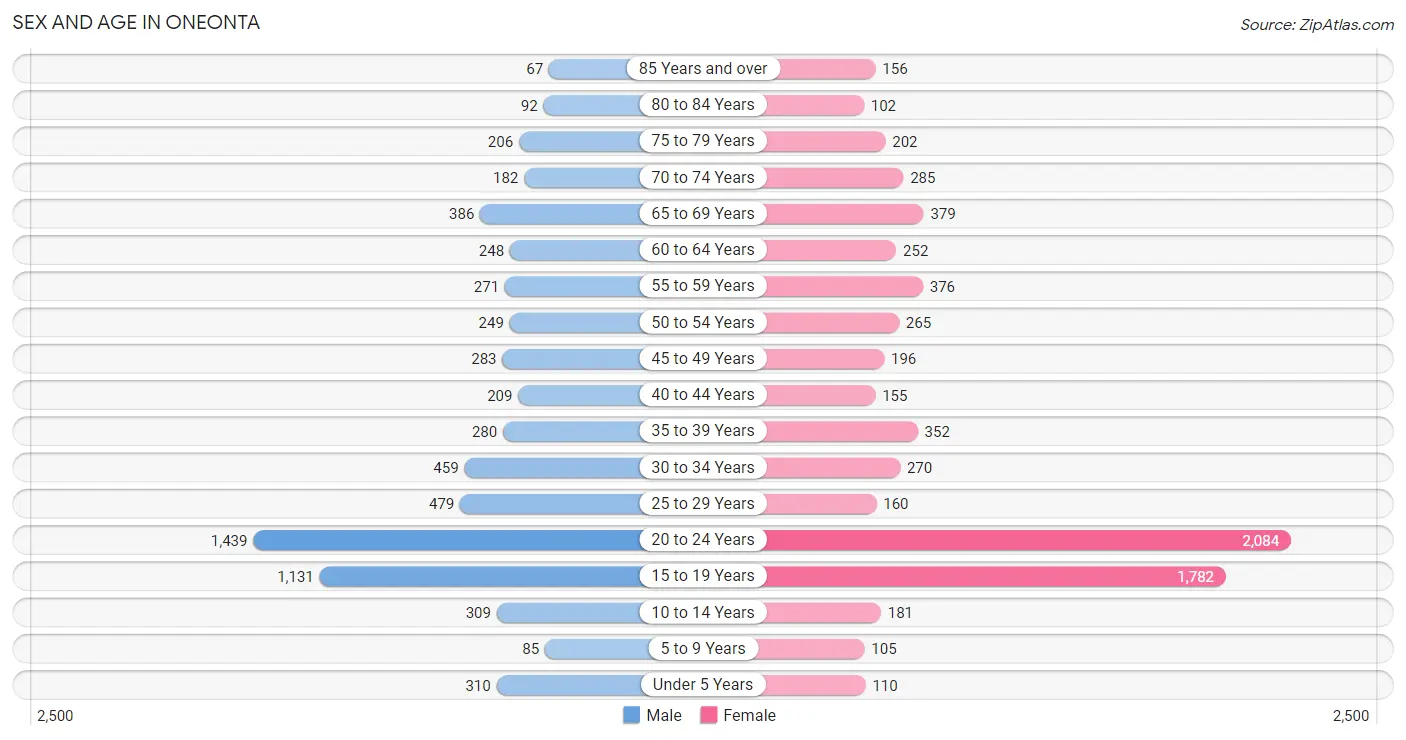
Sex and Age in Oneonta
Sex and Age in Oneonta
The most populous age groups in Oneonta are 20 to 24 Years (1,439 | 21.5%) for men and 20 to 24 Years (2,084 | 28.1%) for women.
| Age Bracket | Male | Female |
| Under 5 Years | 310 (4.6%) | 110 (1.5%) |
| 5 to 9 Years | 85 (1.3%) | 105 (1.4%) |
| 10 to 14 Years | 309 (4.6%) | 181 (2.4%) |
| 15 to 19 Years | 1,131 (16.9%) | 1,782 (24.0%) |
| 20 to 24 Years | 1,439 (21.5%) | 2,084 (28.1%) |
| 25 to 29 Years | 479 (7.2%) | 160 (2.2%) |
| 30 to 34 Years | 459 (6.9%) | 270 (3.6%) |
| 35 to 39 Years | 280 (4.2%) | 352 (4.8%) |
| 40 to 44 Years | 209 (3.1%) | 155 (2.1%) |
| 45 to 49 Years | 283 (4.2%) | 196 (2.6%) |
| 50 to 54 Years | 249 (3.7%) | 265 (3.6%) |
| 55 to 59 Years | 271 (4.1%) | 376 (5.1%) |
| 60 to 64 Years | 248 (3.7%) | 252 (3.4%) |
| 65 to 69 Years | 386 (5.8%) | 379 (5.1%) |
| 70 to 74 Years | 182 (2.7%) | 285 (3.8%) |
| 75 to 79 Years | 206 (3.1%) | 202 (2.7%) |
| 80 to 84 Years | 92 (1.4%) | 102 (1.4%) |
| 85 Years and over | 67 (1.0%) | 156 (2.1%) |
| Total | 6,685 (100.0%) | 7,412 (100.0%) |
Families and Households in Oneonta
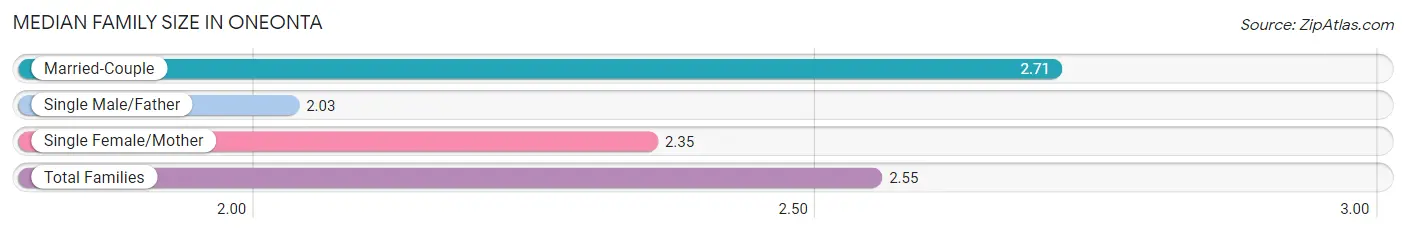
Median Family Size in Oneonta
The median family size in Oneonta is 2.55 persons per family, with married-couple families (1,495 | 66.9%) accounting for the largest median family size of 2.71 persons per family. On the other hand, single male/father families (248 | 11.1%) represent the smallest median family size with 2.03 persons per family.
| Family Type | # Families | Family Size |
| Married-Couple | 1,495 (66.9%) | 2.71 |
| Single Male/Father | 248 (11.1%) | 2.03 |
| Single Female/Mother | 490 (21.9%) | 2.35 |
| Total Families | 2,233 (100.0%) | 2.55 |
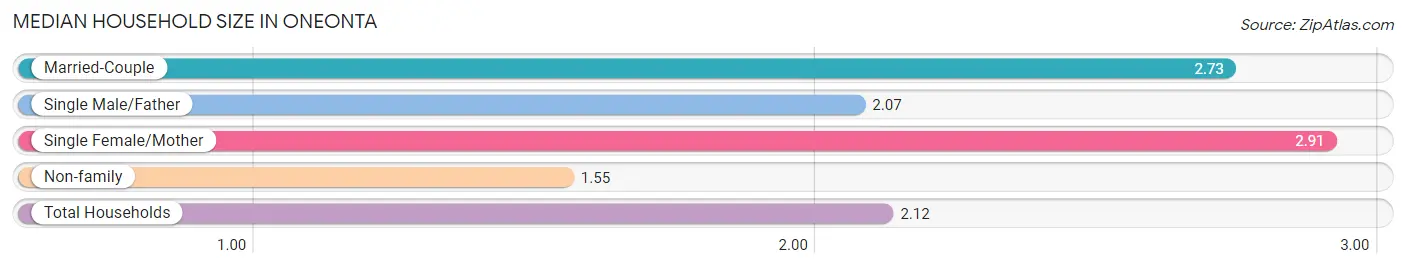
Median Household Size in Oneonta
The median household size in Oneonta is 2.12 persons per household, with single female/mother households (490 | 10.9%) accounting for the largest median household size of 2.91 persons per household. non-family households (2,262 | 50.3%) represent the smallest median household size with 1.55 persons per household.
| Household Type | # Households | Household Size |
| Married-Couple | 1,495 (33.3%) | 2.73 |
| Single Male/Father | 248 (5.5%) | 2.07 |
| Single Female/Mother | 490 (10.9%) | 2.91 |
| Non-family | 2,262 (50.3%) | 1.55 |
| Total Households | 4,495 (100.0%) | 2.12 |
Household Size by Marriage Status in Oneonta
Out of a total of 4,495 households in Oneonta, 2,233 (49.7%) are family households, while 2,262 (50.3%) are nonfamily households. The most numerous type of family households are 2-person households, comprising 1,258, and the most common type of nonfamily households are 1-person households, comprising 1,747.
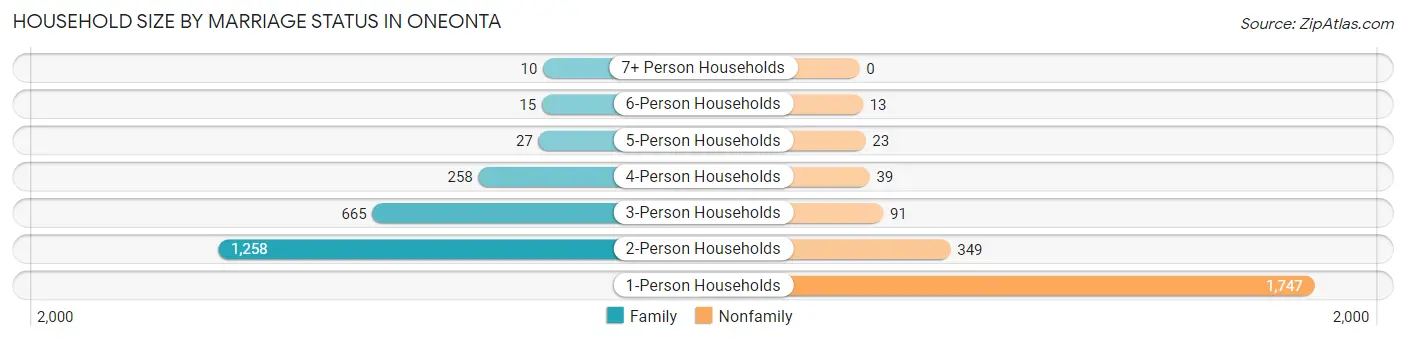
| Household Size | Family Households | Nonfamily Households |
| 1-Person Households | - | 1,747 (38.9%) |
| 2-Person Households | 1,258 (28.0%) | 349 (7.8%) |
| 3-Person Households | 665 (14.8%) | 91 (2.0%) |
| 4-Person Households | 258 (5.7%) | 39 (0.9%) |
| 5-Person Households | 27 (0.6%) | 23 (0.5%) |
| 6-Person Households | 15 (0.3%) | 13 (0.3%) |
| 7+ Person Households | 10 (0.2%) | 0 (0.0%) |
| Total | 2,233 (49.7%) | 2,262 (50.3%) |
Female Fertility in Oneonta
Fertility by Age in Oneonta
Average fertility rate in Oneonta is 35.0 births per 1,000 women. Women in the age bracket of 20 to 34 years have the highest fertility rate with 70.0 births per 1,000 women. Women in the age bracket of 20 to 34 years acount for 100.0% of all women with births.
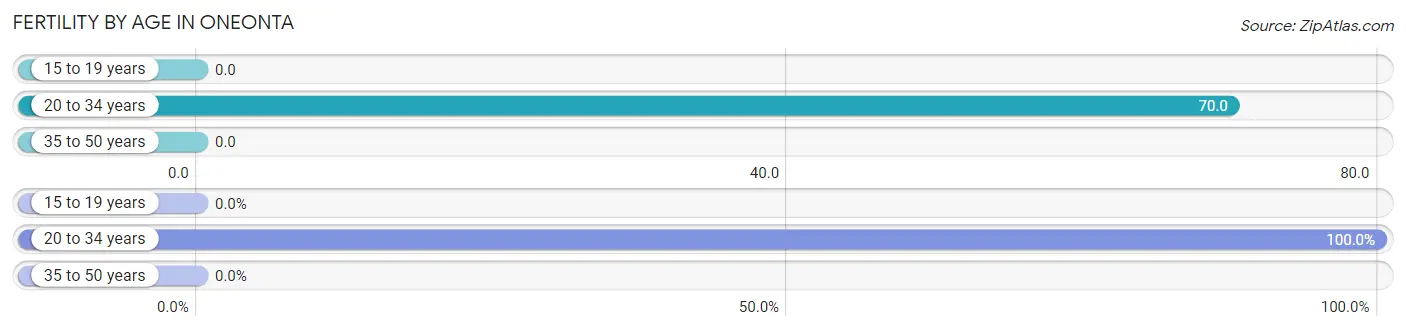
| Age Bracket | Women with Births | Births / 1,000 Women |
| 15 to 19 years | 0 (0.0%) | 0.0 |
| 20 to 34 years | 175 (100.0%) | 70.0 |
| 35 to 50 years | 0 (0.0%) | 0.0 |
| Total | 175 (100.0%) | 35.0 |
Fertility by Age by Marriage Status in Oneonta
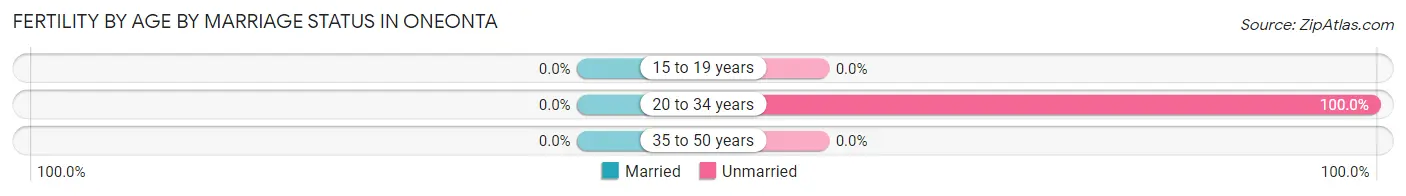
| Age Bracket | Married | Unmarried |
| 15 to 19 years | 0 (0.0%) | 0 (0.0%) |
| 20 to 34 years | 0 (0.0%) | 175 (100.0%) |
| 35 to 50 years | 0 (0.0%) | 0 (0.0%) |
| Total | 0 (0.0%) | 175 (100.0%) |
Fertility by Education in Oneonta
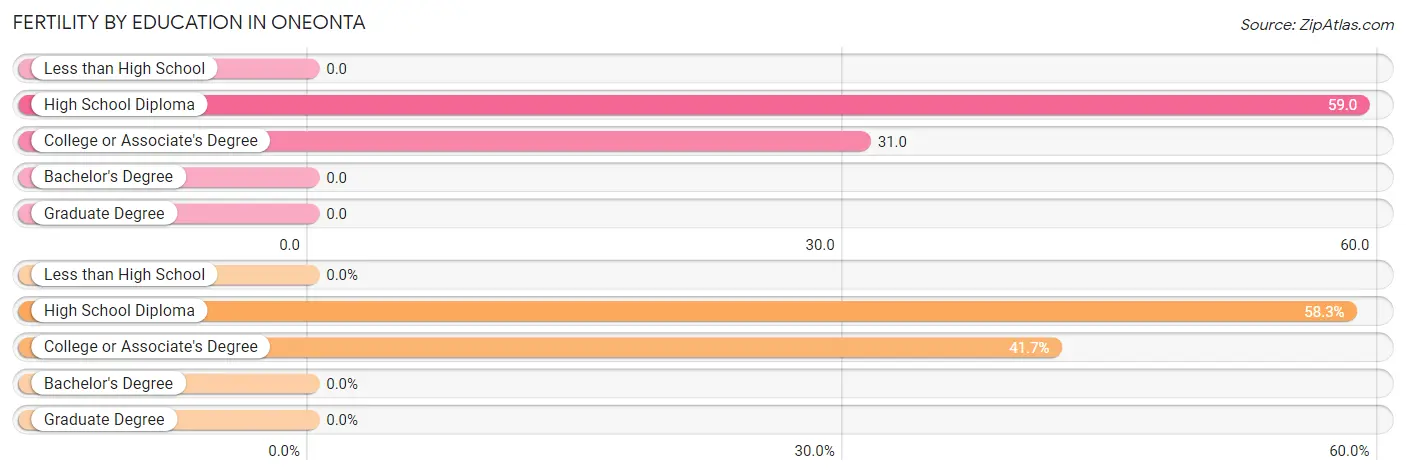
| Educational Attainment | Women with Births | Births / 1,000 Women |
| Less than High School | 0 (0.0%) | 0.0 |
| High School Diploma | 102 (58.3%) | 59.0 |
| College or Associate's Degree | 73 (41.7%) | 31.0 |
| Bachelor's Degree | 0 (0.0%) | 0.0 |
| Graduate Degree | 0 (0.0%) | 0.0 |
| Total | 175 (100.0%) | 35.0 |
Fertility by Education by Marriage Status in Oneonta
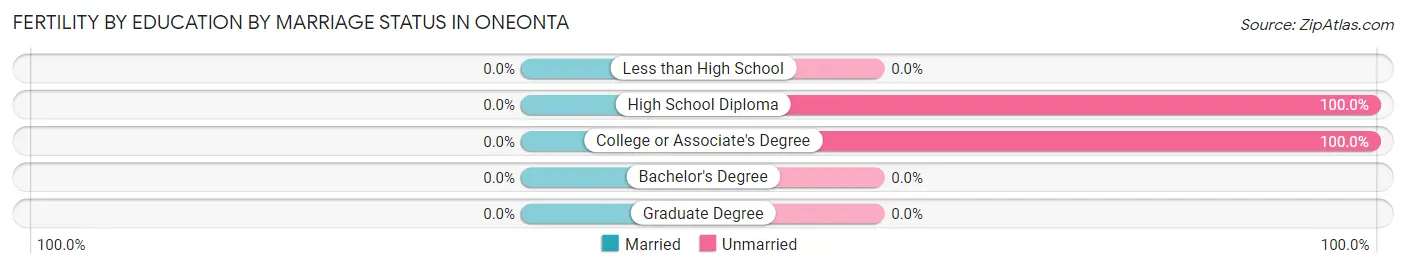
| Educational Attainment | Married | Unmarried |
| Less than High School | 0 (0.0%) | 0 (0.0%) |
| High School Diploma | 0 (0.0%) | 102 (100.0%) |
| College or Associate's Degree | 0 (0.0%) | 73 (100.0%) |
| Bachelor's Degree | 0 (0.0%) | 0 (0.0%) |
| Graduate Degree | 0 (0.0%) | 0 (0.0%) |
| Total | 0 (0.0%) | 175 (100.0%) |
Employment Characteristics in Oneonta
Employment by Class of Employer in Oneonta
Among the 6,252 employed individuals in Oneonta, private company employees (3,312 | 53.0%), not-for-profit organizations (1,149 | 18.4%), and state government employees (845 | 13.5%) make up the most common classes of employment.
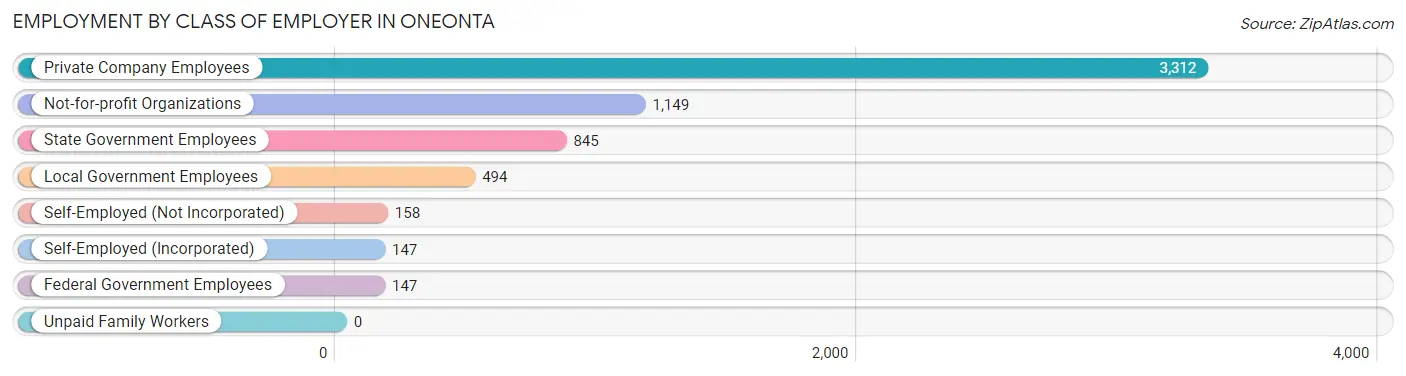
| Employer Class | # Employees | % Employees |
| Private Company Employees | 3,312 | 53.0% |
| Self-Employed (Incorporated) | 147 | 2.4% |
| Self-Employed (Not Incorporated) | 158 | 2.5% |
| Not-for-profit Organizations | 1,149 | 18.4% |
| Local Government Employees | 494 | 7.9% |
| State Government Employees | 845 | 13.5% |
| Federal Government Employees | 147 | 2.4% |
| Unpaid Family Workers | 0 | 0.0% |
| Total | 6,252 | 100.0% |
Employment Status by Age in Oneonta
According to the labor force statistics for Oneonta, out of the total population over 16 years of age (12,937), 51.9% or 6,714 individuals are in the labor force, with 3.6% or 242 of them unemployed. The age group with the highest labor force participation rate is 30 to 34 years, with 97.9% or 714 individuals in the labor force. Within the labor force, the 16 to 19 years age range has the highest percentage of unemployed individuals, with 13.2% or 96 of them being unemployed.
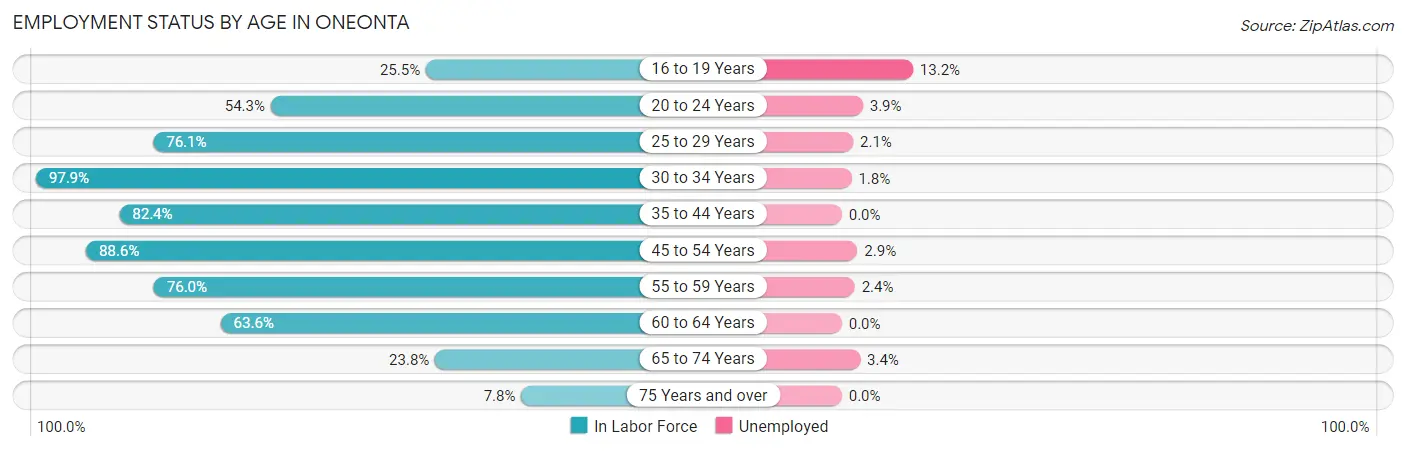
| Age Bracket | In Labor Force | Unemployed |
| 16 to 19 Years | 728 (25.5%) | 96 (13.2%) |
| 20 to 24 Years | 1,913 (54.3%) | 75 (3.9%) |
| 25 to 29 Years | 486 (76.1%) | 10 (2.1%) |
| 30 to 34 Years | 714 (97.9%) | 13 (1.8%) |
| 35 to 44 Years | 821 (82.4%) | 0 (0.0%) |
| 45 to 54 Years | 880 (88.6%) | 26 (2.9%) |
| 55 to 59 Years | 492 (76.0%) | 12 (2.4%) |
| 60 to 64 Years | 318 (63.6%) | 0 (0.0%) |
| 65 to 74 Years | 293 (23.8%) | 10 (3.4%) |
| 75 Years and over | 64 (7.8%) | 0 (0.0%) |
| Total | 6,714 (51.9%) | 242 (3.6%) |
Employment Status by Educational Attainment in Oneonta
According to labor force statistics for Oneonta, 82.4% of individuals (3,711) out of the total population between 25 and 64 years of age (4,504) are in the labor force, with 1.6% or 59 of them being unemployed. The group with the highest labor force participation rate are those with the educational attainment of college / associate degree, with 90.0% or 1,085 individuals in the labor force. Within the labor force, individuals with college / associate degree education have the highest percentage of unemployment, with 2.2% or 24 of them being unemployed.
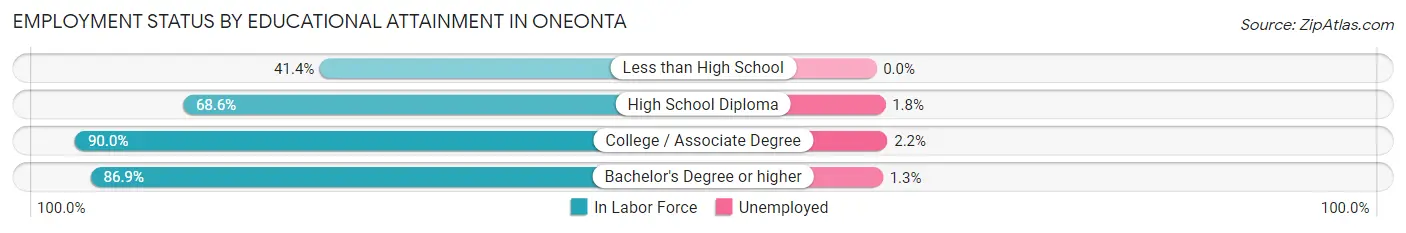
| Educational Attainment | In Labor Force | Unemployed |
| Less than High School | 84 (41.4%) | 0 (0.0%) |
| High School Diploma | 557 (68.6%) | 15 (1.8%) |
| College / Associate Degree | 1,085 (90.0%) | 27 (2.2%) |
| Bachelor's Degree or higher | 1,984 (86.9%) | 30 (1.3%) |
| Total | 3,711 (82.4%) | 72 (1.6%) |
Employment Occupations by Sex in Oneonta
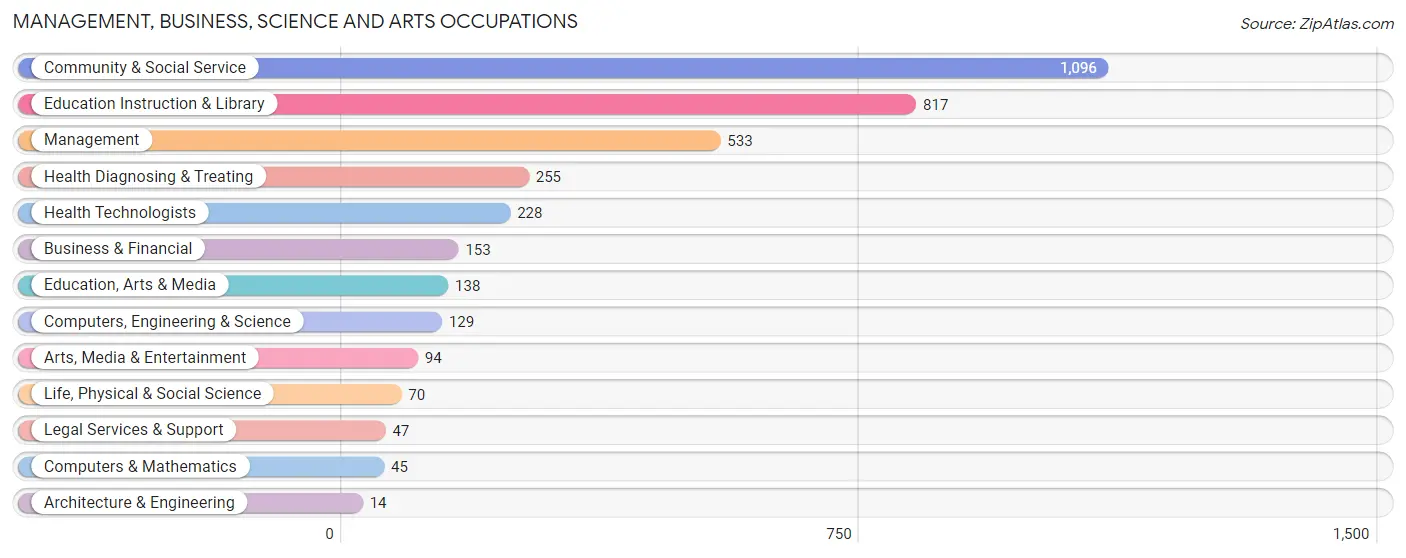
Management, Business, Science and Arts Occupations
The most common Management, Business, Science and Arts occupations in Oneonta are Community & Social Service (1,096 | 17.2%), Education Instruction & Library (817 | 12.8%), Management (533 | 8.4%), Health Diagnosing & Treating (255 | 4.0%), and Health Technologists (228 | 3.6%).
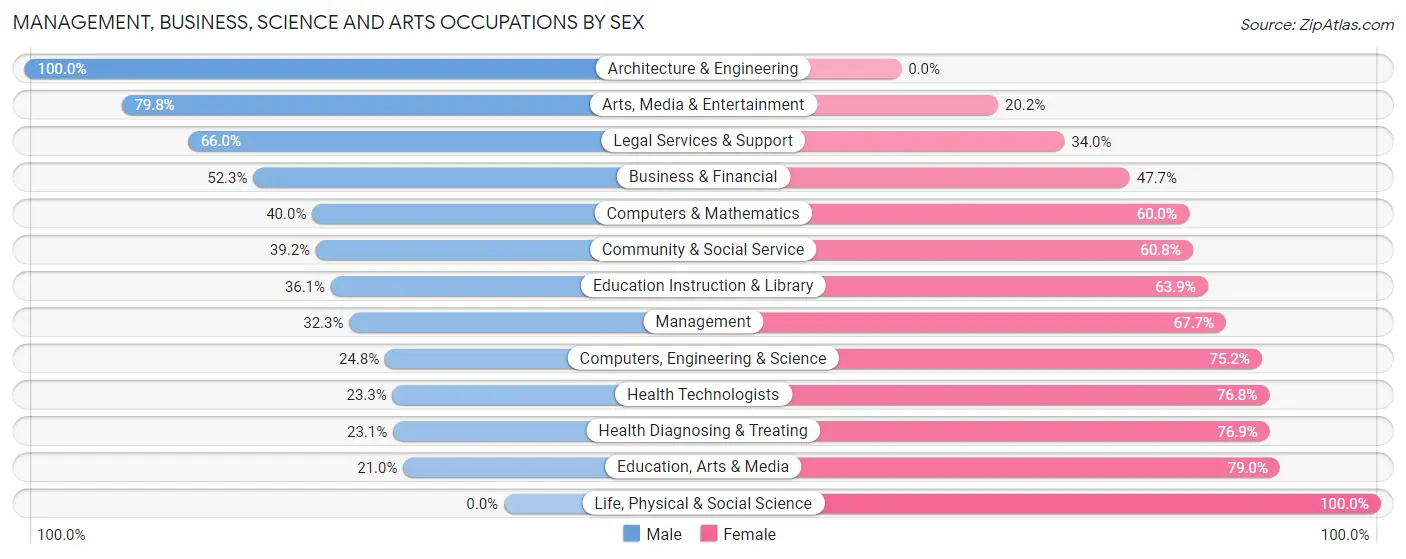
Management, Business, Science and Arts Occupations by Sex
Within the Management, Business, Science and Arts occupations in Oneonta, the most male-oriented occupations are Architecture & Engineering (100.0%), Arts, Media & Entertainment (79.8%), and Legal Services & Support (66.0%), while the most female-oriented occupations are Life, Physical & Social Science (100.0%), Education, Arts & Media (79.0%), and Health Diagnosing & Treating (76.9%).
| Occupation | Male | Female |
| Management | 172 (32.3%) | 361 (67.7%) |
| Business & Financial | 80 (52.3%) | 73 (47.7%) |
| Computers, Engineering & Science | 32 (24.8%) | 97 (75.2%) |
| Computers & Mathematics | 18 (40.0%) | 27 (60.0%) |
| Architecture & Engineering | 14 (100.0%) | 0 (0.0%) |
| Life, Physical & Social Science | 0 (0.0%) | 70 (100.0%) |
| Community & Social Service | 430 (39.2%) | 666 (60.8%) |
| Education, Arts & Media | 29 (21.0%) | 109 (79.0%) |
| Legal Services & Support | 31 (66.0%) | 16 (34.0%) |
| Education Instruction & Library | 295 (36.1%) | 522 (63.9%) |
| Arts, Media & Entertainment | 75 (79.8%) | 19 (20.2%) |
| Health Diagnosing & Treating | 59 (23.1%) | 196 (76.9%) |
| Health Technologists | 53 (23.3%) | 175 (76.7%) |
| Total (Category) | 773 (35.7%) | 1,393 (64.3%) |
| Total (Overall) | 3,231 (50.7%) | 3,136 (49.2%) |
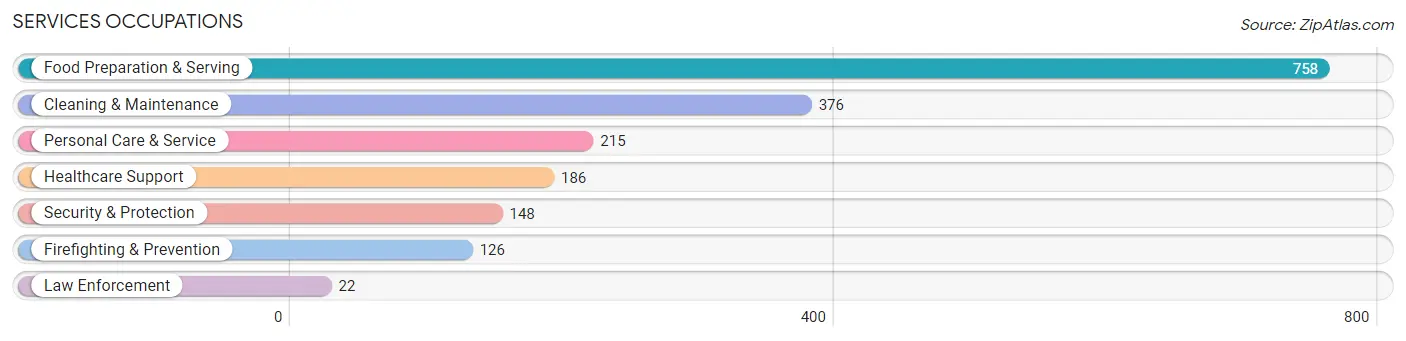
Services Occupations
The most common Services occupations in Oneonta are Food Preparation & Serving (758 | 11.9%), Cleaning & Maintenance (376 | 5.9%), Personal Care & Service (215 | 3.4%), Healthcare Support (186 | 2.9%), and Security & Protection (148 | 2.3%).
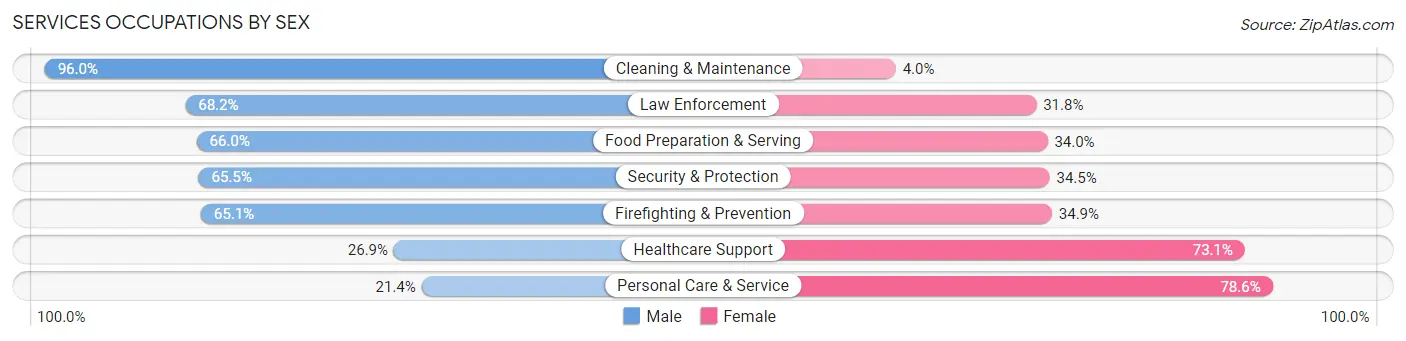
Services Occupations by Sex
Within the Services occupations in Oneonta, the most male-oriented occupations are Cleaning & Maintenance (96.0%), Law Enforcement (68.2%), and Food Preparation & Serving (66.0%), while the most female-oriented occupations are Personal Care & Service (78.6%), Healthcare Support (73.1%), and Firefighting & Prevention (34.9%).
| Occupation | Male | Female |
| Healthcare Support | 50 (26.9%) | 136 (73.1%) |
| Security & Protection | 97 (65.5%) | 51 (34.5%) |
| Firefighting & Prevention | 82 (65.1%) | 44 (34.9%) |
| Law Enforcement | 15 (68.2%) | 7 (31.8%) |
| Food Preparation & Serving | 500 (66.0%) | 258 (34.0%) |
| Cleaning & Maintenance | 361 (96.0%) | 15 (4.0%) |
| Personal Care & Service | 46 (21.4%) | 169 (78.6%) |
| Total (Category) | 1,054 (62.6%) | 629 (37.4%) |
| Total (Overall) | 3,231 (50.7%) | 3,136 (49.2%) |
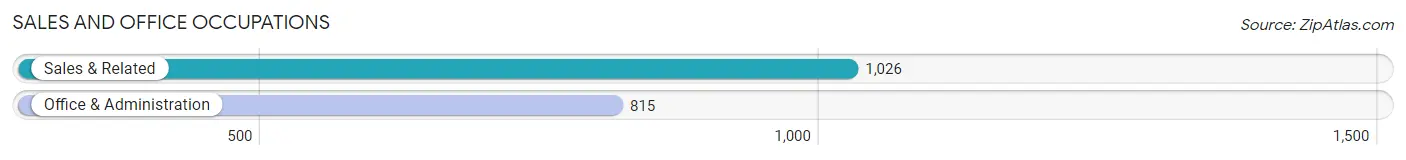
Sales and Office Occupations
The most common Sales and Office occupations in Oneonta are Sales & Related (1,026 | 16.1%), and Office & Administration (815 | 12.8%).
Sales and Office Occupations by Sex
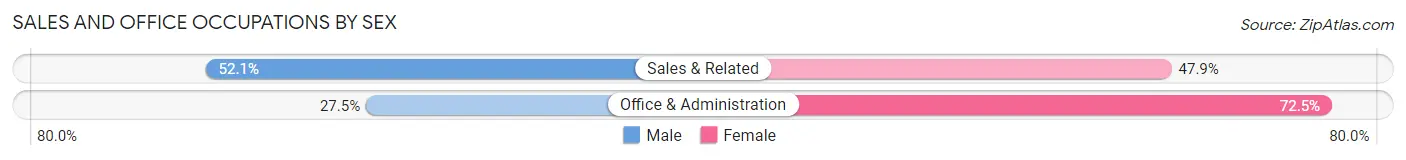
| Occupation | Male | Female |
| Sales & Related | 535 (52.1%) | 491 (47.9%) |
| Office & Administration | 224 (27.5%) | 591 (72.5%) |
| Total (Category) | 759 (41.2%) | 1,082 (58.8%) |
| Total (Overall) | 3,231 (50.7%) | 3,136 (49.2%) |
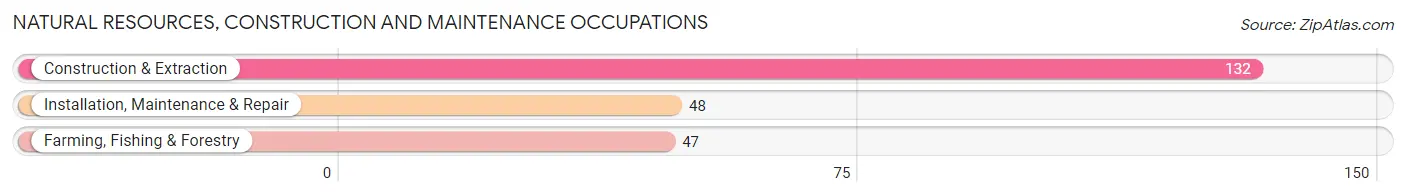
Natural Resources, Construction and Maintenance Occupations
The most common Natural Resources, Construction and Maintenance occupations in Oneonta are Construction & Extraction (132 | 2.1%), Installation, Maintenance & Repair (48 | 0.7%), and Farming, Fishing & Forestry (47 | 0.7%).
Natural Resources, Construction and Maintenance Occupations by Sex
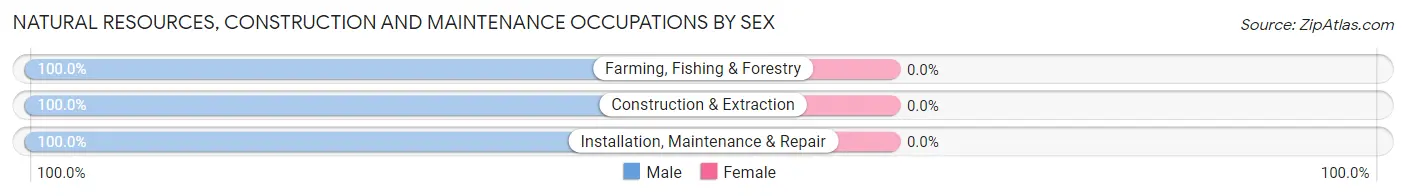
| Occupation | Male | Female |
| Farming, Fishing & Forestry | 47 (100.0%) | 0 (0.0%) |
| Construction & Extraction | 132 (100.0%) | 0 (0.0%) |
| Installation, Maintenance & Repair | 48 (100.0%) | 0 (0.0%) |
| Total (Category) | 227 (100.0%) | 0 (0.0%) |
| Total (Overall) | 3,231 (50.7%) | 3,136 (49.2%) |
Production, Transportation and Moving Occupations
The most common Production, Transportation and Moving occupations in Oneonta are Transportation (189 | 3.0%), Production (171 | 2.7%), and Material Moving (90 | 1.4%).
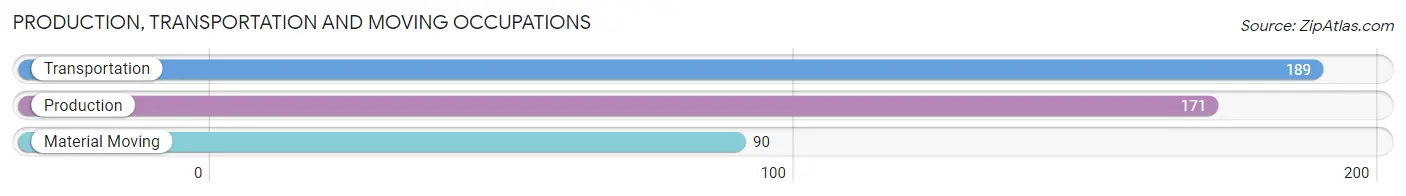
Production, Transportation and Moving Occupations by Sex

| Occupation | Male | Female |
| Production | 155 (90.6%) | 16 (9.4%) |
| Transportation | 189 (100.0%) | 0 (0.0%) |
| Material Moving | 74 (82.2%) | 16 (17.8%) |
| Total (Category) | 418 (92.9%) | 32 (7.1%) |
| Total (Overall) | 3,231 (50.7%) | 3,136 (49.2%) |
Employment Industries by Sex in Oneonta
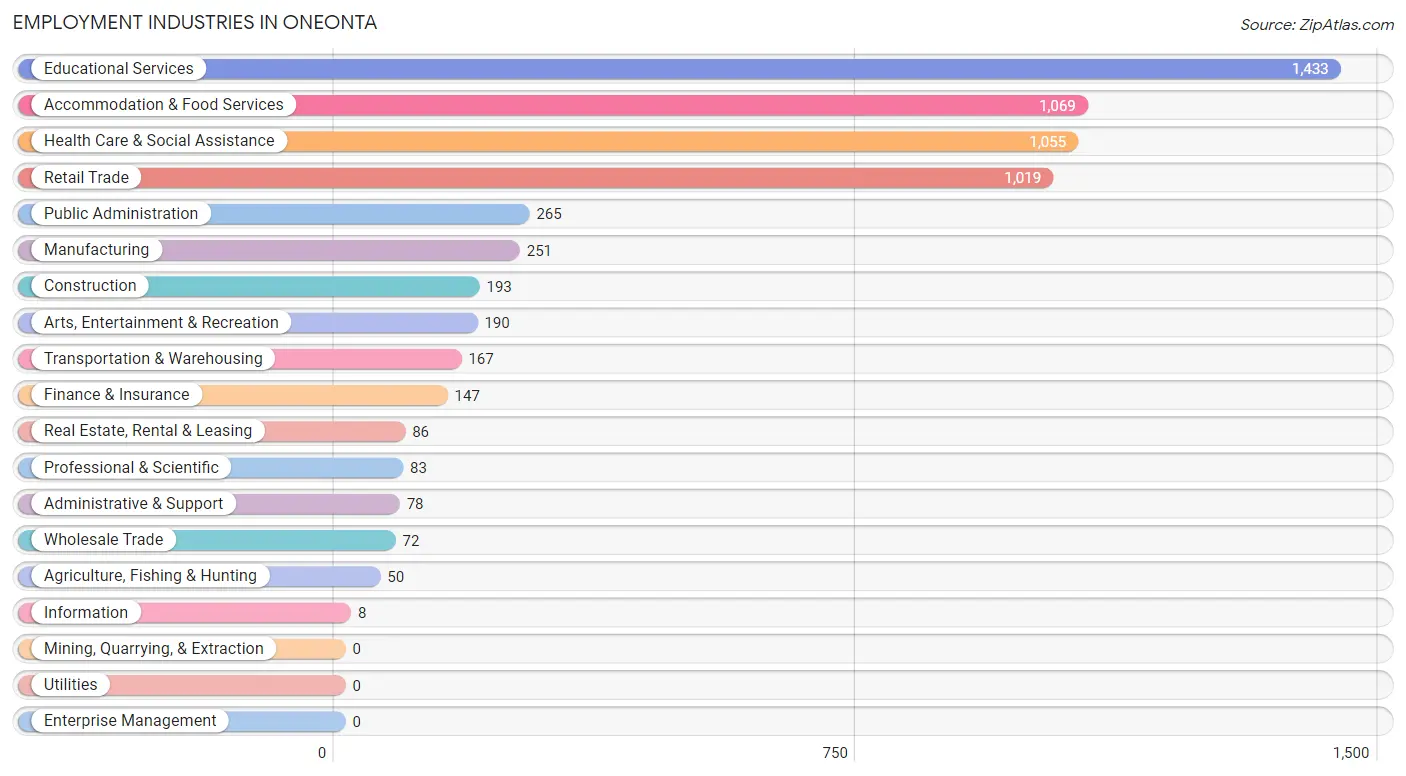
Employment Industries in Oneonta
The major employment industries in Oneonta include Educational Services (1,433 | 22.5%), Accommodation & Food Services (1,069 | 16.8%), Health Care & Social Assistance (1,055 | 16.6%), Retail Trade (1,019 | 16.0%), and Public Administration (265 | 4.2%).
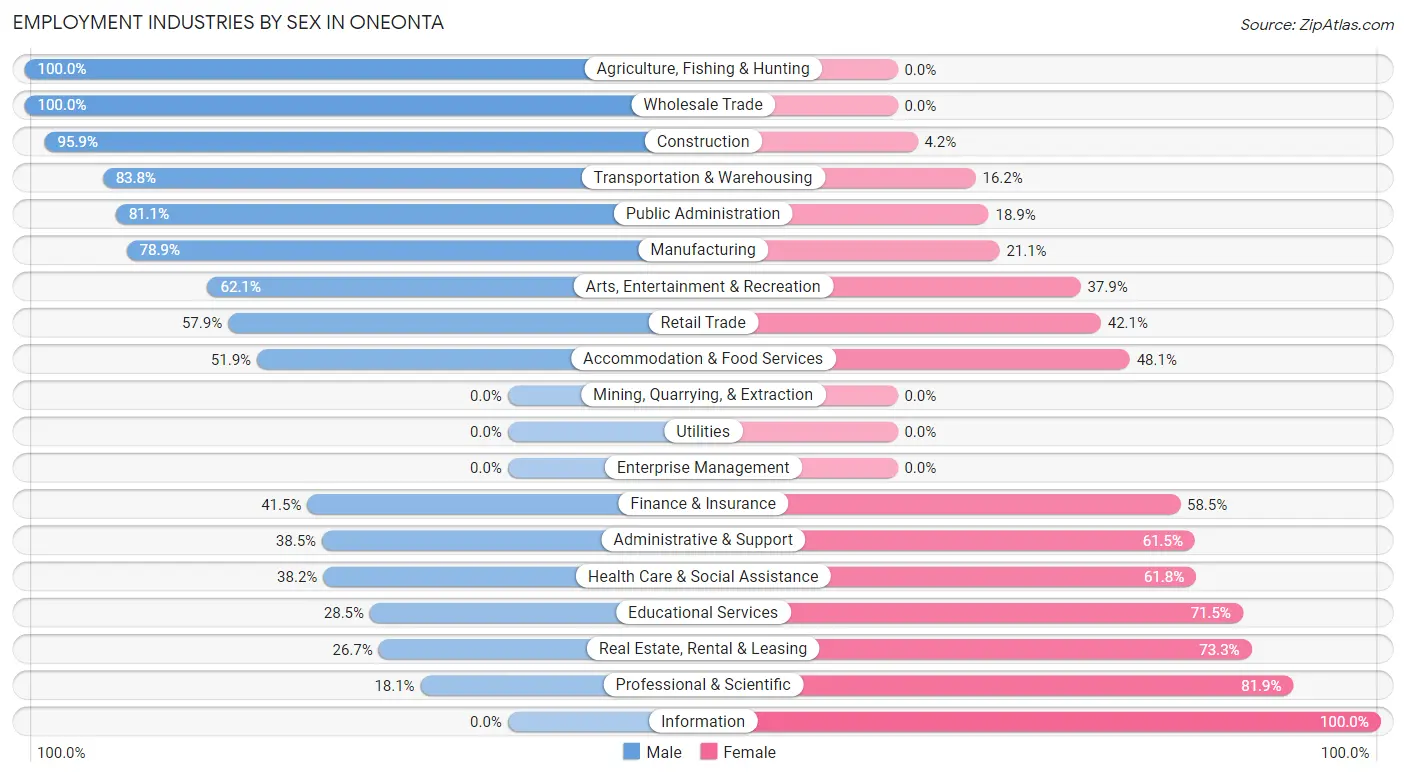
Employment Industries by Sex in Oneonta
The Oneonta industries that see more men than women are Agriculture, Fishing & Hunting (100.0%), Wholesale Trade (100.0%), and Construction (95.9%), whereas the industries that tend to have a higher number of women are Information (100.0%), Professional & Scientific (81.9%), and Real Estate, Rental & Leasing (73.3%).
| Industry | Male | Female |
| Agriculture, Fishing & Hunting | 50 (100.0%) | 0 (0.0%) |
| Mining, Quarrying, & Extraction | 0 (0.0%) | 0 (0.0%) |
| Construction | 185 (95.9%) | 8 (4.2%) |
| Manufacturing | 198 (78.9%) | 53 (21.1%) |
| Wholesale Trade | 72 (100.0%) | 0 (0.0%) |
| Retail Trade | 590 (57.9%) | 429 (42.1%) |
| Transportation & Warehousing | 140 (83.8%) | 27 (16.2%) |
| Utilities | 0 (0.0%) | 0 (0.0%) |
| Information | 0 (0.0%) | 8 (100.0%) |
| Finance & Insurance | 61 (41.5%) | 86 (58.5%) |
| Real Estate, Rental & Leasing | 23 (26.7%) | 63 (73.3%) |
| Professional & Scientific | 15 (18.1%) | 68 (81.9%) |
| Enterprise Management | 0 (0.0%) | 0 (0.0%) |
| Administrative & Support | 30 (38.5%) | 48 (61.5%) |
| Educational Services | 409 (28.5%) | 1,024 (71.5%) |
| Health Care & Social Assistance | 403 (38.2%) | 652 (61.8%) |
| Arts, Entertainment & Recreation | 118 (62.1%) | 72 (37.9%) |
| Accommodation & Food Services | 555 (51.9%) | 514 (48.1%) |
| Public Administration | 215 (81.1%) | 50 (18.9%) |
| Total | 3,231 (50.7%) | 3,136 (49.2%) |
Education in Oneonta
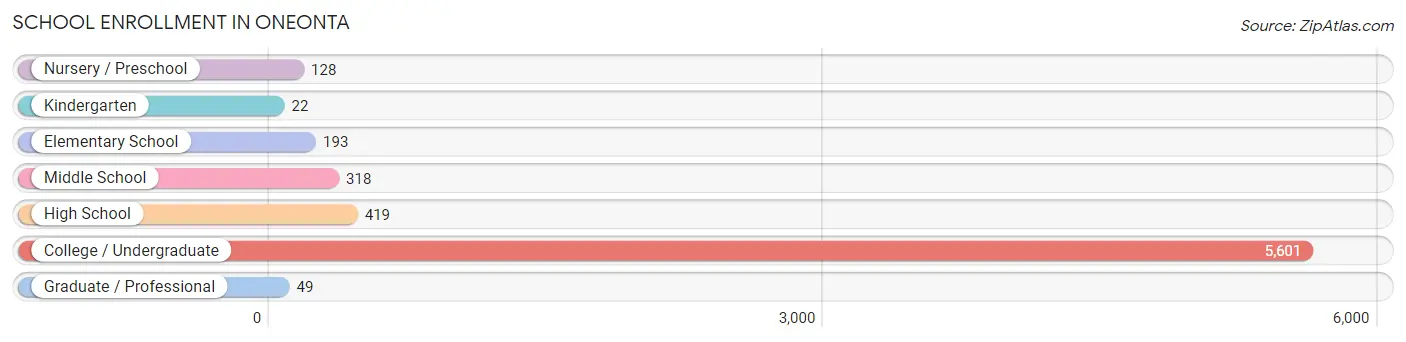
School Enrollment in Oneonta
The most common levels of schooling among the 6,730 students in Oneonta are college / undergraduate (5,601 | 83.2%), high school (419 | 6.2%), and middle school (318 | 4.7%).
| School Level | # Students | % Students |
| Nursery / Preschool | 128 | 1.9% |
| Kindergarten | 22 | 0.3% |
| Elementary School | 193 | 2.9% |
| Middle School | 318 | 4.7% |
| High School | 419 | 6.2% |
| College / Undergraduate | 5,601 | 83.2% |
| Graduate / Professional | 49 | 0.7% |
| Total | 6,730 | 100.0% |
School Enrollment by Age by Funding Source in Oneonta
Out of a total of 6,730 students who are enrolled in schools in Oneonta, 1,508 (22.4%) attend a private institution, while the remaining 5,222 (77.6%) are enrolled in public schools. The age group of 25 to 34 year olds has the highest likelihood of being enrolled in private schools, with 259 (73.4% in the age bracket) enrolled. Conversely, the age group of 10 to 14 year olds has the lowest likelihood of being enrolled in a private school, with 453 (98.7% in the age bracket) attending a public institution.
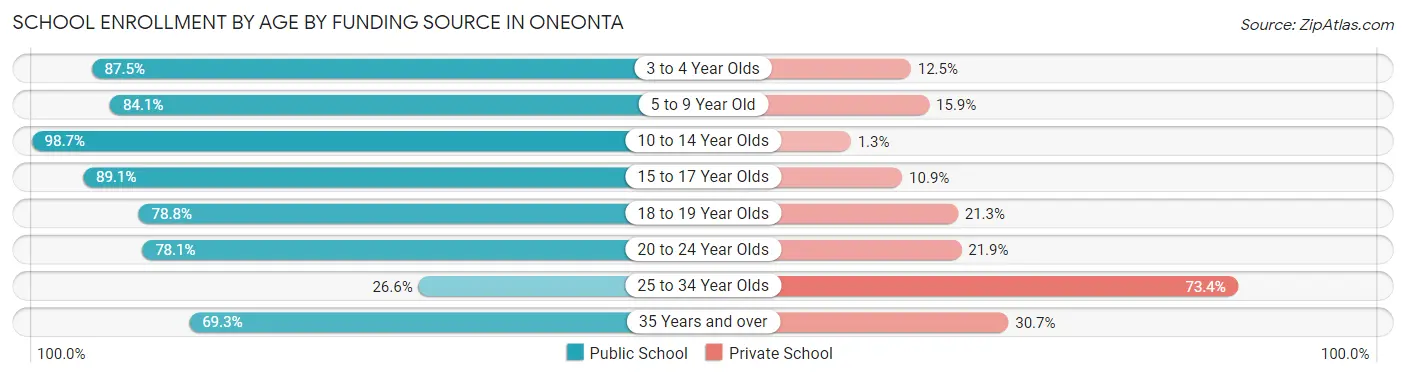
| Age Bracket | Public School | Private School |
| 3 to 4 Year Olds | 112 (87.5%) | 16 (12.5%) |
| 5 to 9 Year Old | 148 (84.1%) | 28 (15.9%) |
| 10 to 14 Year Olds | 453 (98.7%) | 6 (1.3%) |
| 15 to 17 Year Olds | 180 (89.1%) | 22 (10.9%) |
| 18 to 19 Year Olds | 2,097 (78.7%) | 566 (21.2%) |
| 20 to 24 Year Olds | 2,088 (78.1%) | 586 (21.9%) |
| 25 to 34 Year Olds | 94 (26.6%) | 259 (73.4%) |
| 35 Years and over | 52 (69.3%) | 23 (30.7%) |
| Total | 5,222 (77.6%) | 1,508 (22.4%) |
Educational Attainment by Field of Study in Oneonta
Education (622 | 17.8%), business (448 | 12.8%), social sciences (446 | 12.8%), visual & performing arts (302 | 8.6%), and science & technology (275 | 7.9%) are the most common fields of study among 3,496 individuals in Oneonta who have obtained a bachelor's degree or higher.
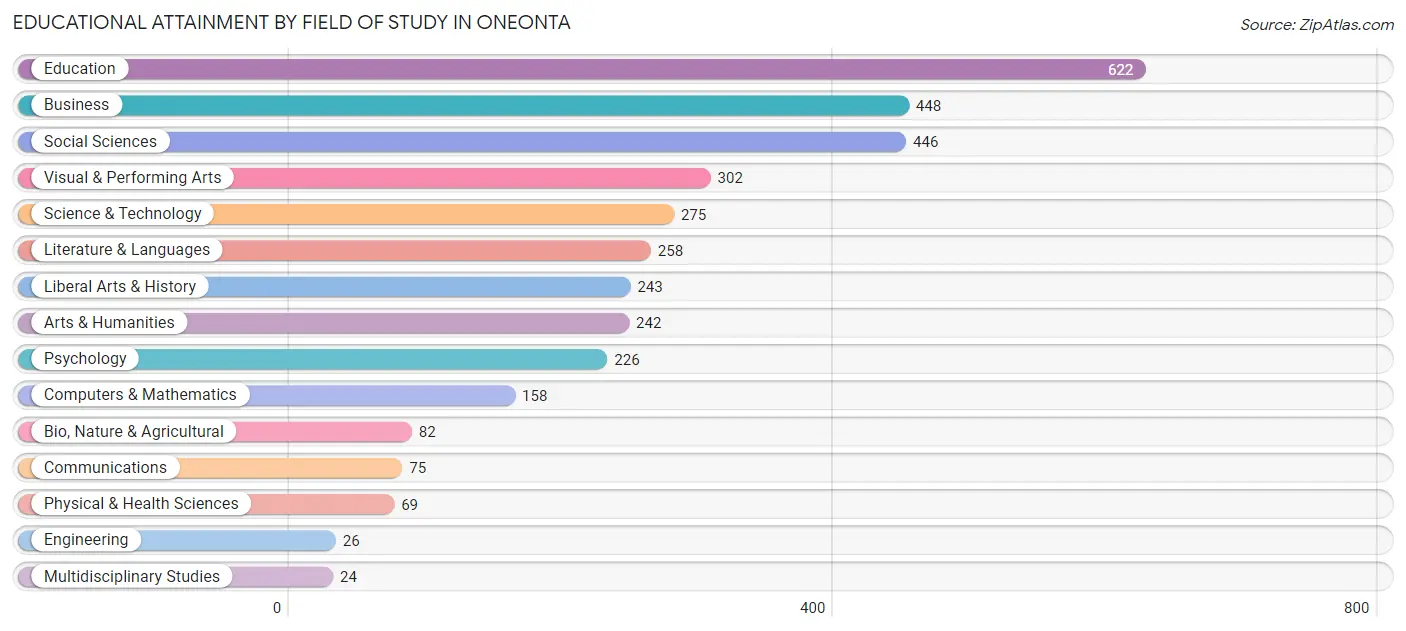
| Field of Study | # Graduates | % Graduates |
| Computers & Mathematics | 158 | 4.5% |
| Bio, Nature & Agricultural | 82 | 2.4% |
| Physical & Health Sciences | 69 | 2.0% |
| Psychology | 226 | 6.5% |
| Social Sciences | 446 | 12.8% |
| Engineering | 26 | 0.7% |
| Multidisciplinary Studies | 24 | 0.7% |
| Science & Technology | 275 | 7.9% |
| Business | 448 | 12.8% |
| Education | 622 | 17.8% |
| Literature & Languages | 258 | 7.4% |
| Liberal Arts & History | 243 | 7.0% |
| Visual & Performing Arts | 302 | 8.6% |
| Communications | 75 | 2.1% |
| Arts & Humanities | 242 | 6.9% |
| Total | 3,496 | 100.0% |
Transportation & Commute in Oneonta
Vehicle Availability by Sex in Oneonta
The most prevalent vehicle ownership categories in Oneonta are males with 1 vehicle (1,254, accounting for 42.6%) and females with 1 vehicle (869, making up 56.1%).
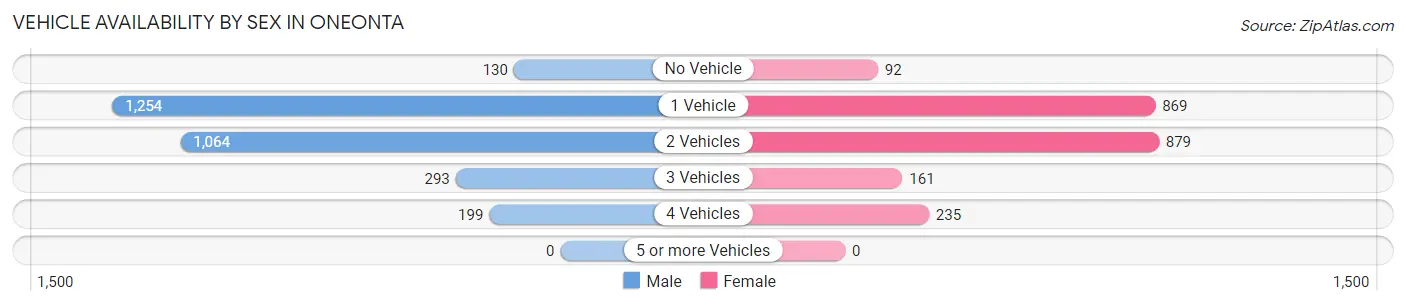
| Vehicles Available | Male | Female |
| No Vehicle | 130 (4.4%) | 92 (4.1%) |
| 1 Vehicle | 1,254 (42.6%) | 869 (38.9%) |
| 2 Vehicles | 1,064 (36.2%) | 879 (39.3%) |
| 3 Vehicles | 293 (10.0%) | 161 (7.2%) |
| 4 Vehicles | 199 (6.8%) | 235 (10.5%) |
| 5 or more Vehicles | 0 (0.0%) | 0 (0.0%) |
| Total | 2,940 (100.0%) | 2,236 (100.0%) |
Commute Time in Oneonta
The most frequently occuring commute durations in Oneonta are 5 to 9 minutes (2,371 commuters, 40.4%), 10 to 14 minutes (1,264 commuters, 21.5%), and 15 to 19 minutes (585 commuters, 10.0%).
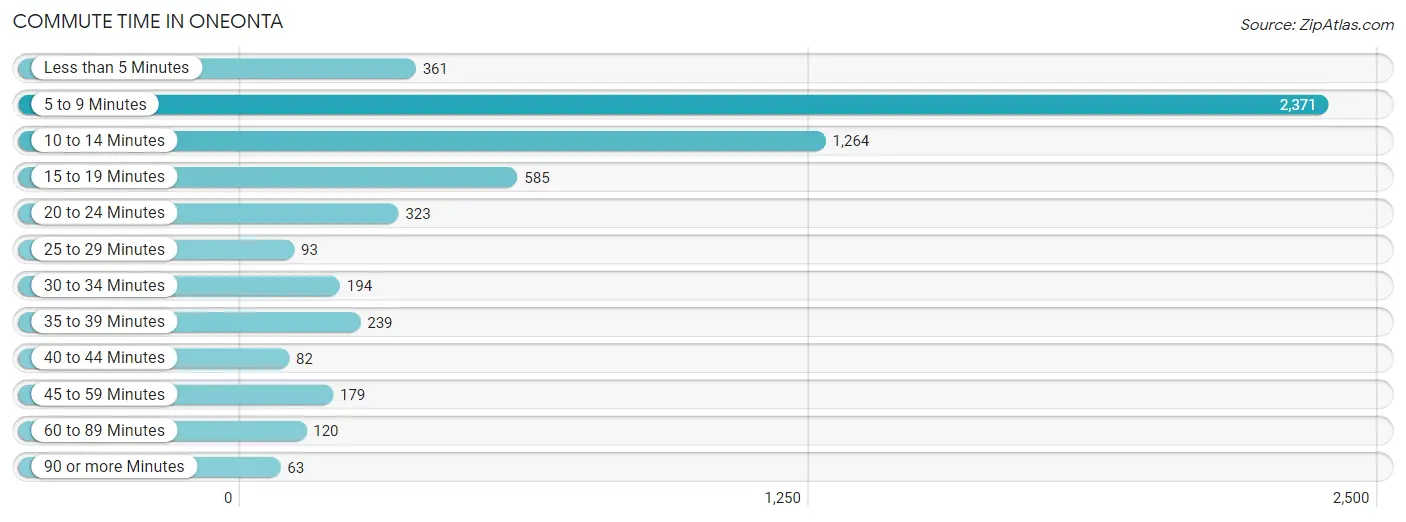
| Commute Time | # Commuters | % Commuters |
| Less than 5 Minutes | 361 | 6.1% |
| 5 to 9 Minutes | 2,371 | 40.4% |
| 10 to 14 Minutes | 1,264 | 21.5% |
| 15 to 19 Minutes | 585 | 10.0% |
| 20 to 24 Minutes | 323 | 5.5% |
| 25 to 29 Minutes | 93 | 1.6% |
| 30 to 34 Minutes | 194 | 3.3% |
| 35 to 39 Minutes | 239 | 4.1% |
| 40 to 44 Minutes | 82 | 1.4% |
| 45 to 59 Minutes | 179 | 3.0% |
| 60 to 89 Minutes | 120 | 2.0% |
| 90 or more Minutes | 63 | 1.1% |
Commute Time by Sex in Oneonta
The most common commute times in Oneonta are 5 to 9 minutes (1,314 commuters, 42.0%) for males and 5 to 9 minutes (1,057 commuters, 38.5%) for females.
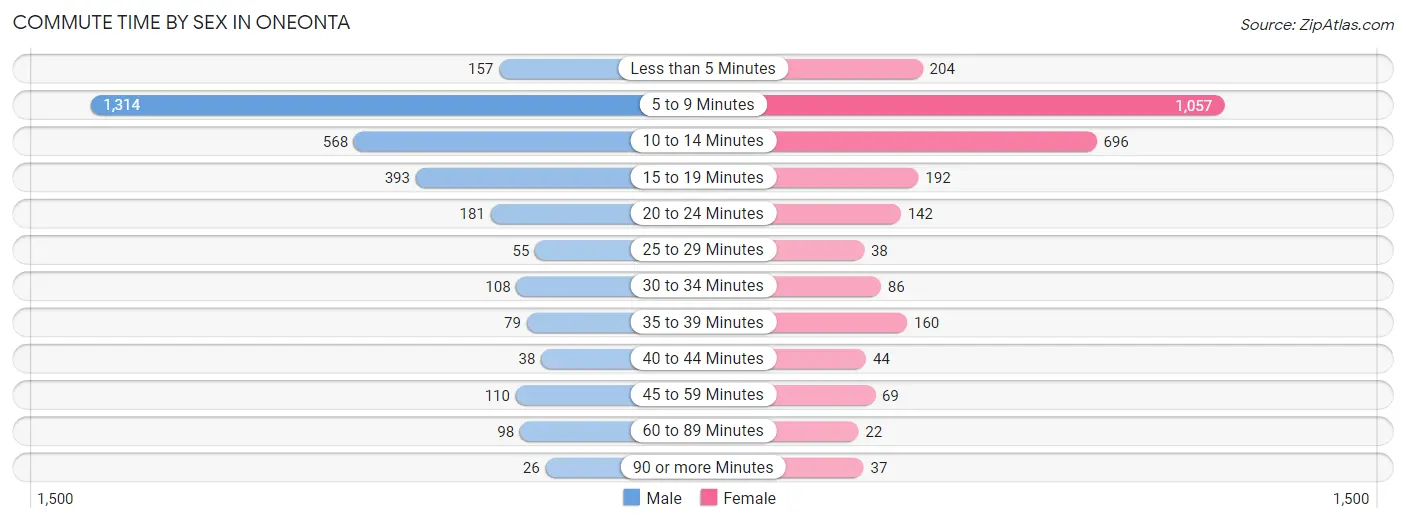
| Commute Time | Male | Female |
| Less than 5 Minutes | 157 (5.0%) | 204 (7.4%) |
| 5 to 9 Minutes | 1,314 (42.0%) | 1,057 (38.5%) |
| 10 to 14 Minutes | 568 (18.2%) | 696 (25.3%) |
| 15 to 19 Minutes | 393 (12.6%) | 192 (7.0%) |
| 20 to 24 Minutes | 181 (5.8%) | 142 (5.2%) |
| 25 to 29 Minutes | 55 (1.8%) | 38 (1.4%) |
| 30 to 34 Minutes | 108 (3.5%) | 86 (3.1%) |
| 35 to 39 Minutes | 79 (2.5%) | 160 (5.8%) |
| 40 to 44 Minutes | 38 (1.2%) | 44 (1.6%) |
| 45 to 59 Minutes | 110 (3.5%) | 69 (2.5%) |
| 60 to 89 Minutes | 98 (3.1%) | 22 (0.8%) |
| 90 or more Minutes | 26 (0.8%) | 37 (1.3%) |
Time of Departure to Work by Sex in Oneonta
The most frequent times of departure to work in Oneonta are 12:00 PM to 3:59 PM (867, 27.7%) for males and 7:30 AM to 7:59 AM (420, 15.3%) for females.
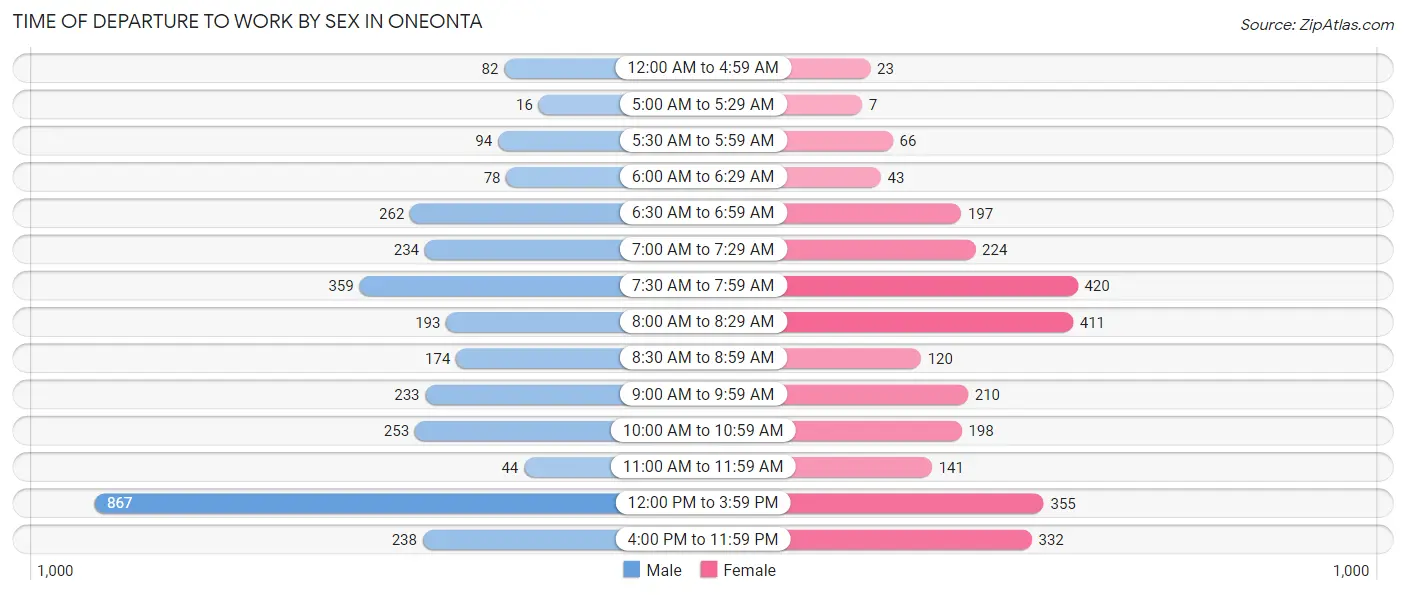
| Time of Departure | Male | Female |
| 12:00 AM to 4:59 AM | 82 (2.6%) | 23 (0.8%) |
| 5:00 AM to 5:29 AM | 16 (0.5%) | 7 (0.3%) |
| 5:30 AM to 5:59 AM | 94 (3.0%) | 66 (2.4%) |
| 6:00 AM to 6:29 AM | 78 (2.5%) | 43 (1.6%) |
| 6:30 AM to 6:59 AM | 262 (8.4%) | 197 (7.2%) |
| 7:00 AM to 7:29 AM | 234 (7.5%) | 224 (8.2%) |
| 7:30 AM to 7:59 AM | 359 (11.5%) | 420 (15.3%) |
| 8:00 AM to 8:29 AM | 193 (6.2%) | 411 (15.0%) |
| 8:30 AM to 8:59 AM | 174 (5.6%) | 120 (4.4%) |
| 9:00 AM to 9:59 AM | 233 (7.4%) | 210 (7.6%) |
| 10:00 AM to 10:59 AM | 253 (8.1%) | 198 (7.2%) |
| 11:00 AM to 11:59 AM | 44 (1.4%) | 141 (5.1%) |
| 12:00 PM to 3:59 PM | 867 (27.7%) | 355 (12.9%) |
| 4:00 PM to 11:59 PM | 238 (7.6%) | 332 (12.1%) |
| Total | 3,127 (100.0%) | 2,747 (100.0%) |
Housing Occupancy in Oneonta
Occupancy by Ownership in Oneonta
Of the total 4,495 dwellings in Oneonta, owner-occupied units account for 2,302 (51.2%), while renter-occupied units make up 2,193 (48.8%).
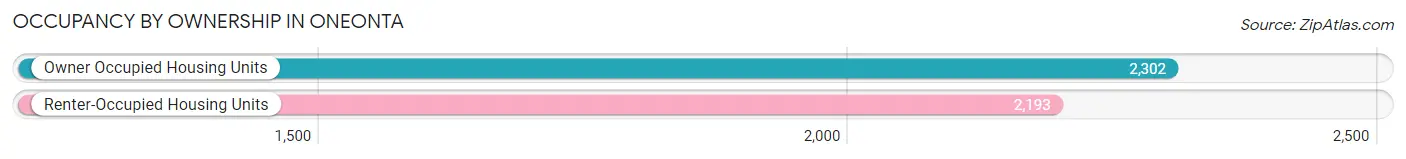
| Occupancy | # Housing Units | % Housing Units |
| Owner Occupied Housing Units | 2,302 | 51.2% |
| Renter-Occupied Housing Units | 2,193 | 48.8% |
| Total Occupied Housing Units | 4,495 | 100.0% |
Occupancy by Household Size in Oneonta
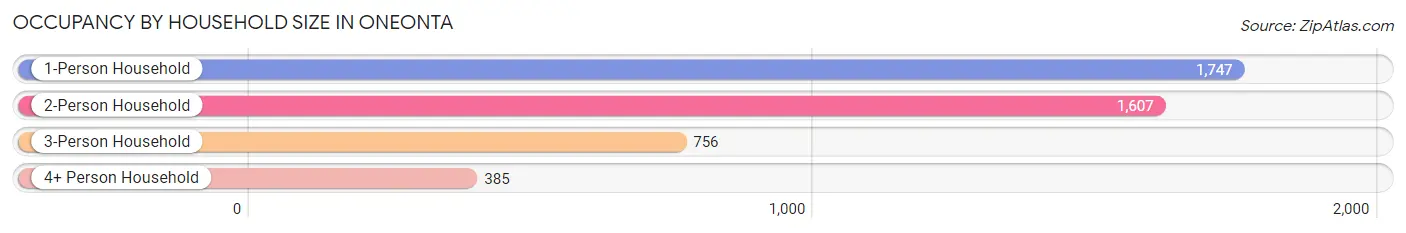
| Household Size | # Housing Units | % Housing Units |
| 1-Person Household | 1,747 | 38.9% |
| 2-Person Household | 1,607 | 35.7% |
| 3-Person Household | 756 | 16.8% |
| 4+ Person Household | 385 | 8.6% |
| Total Housing Units | 4,495 | 100.0% |
Occupancy by Ownership by Household Size in Oneonta
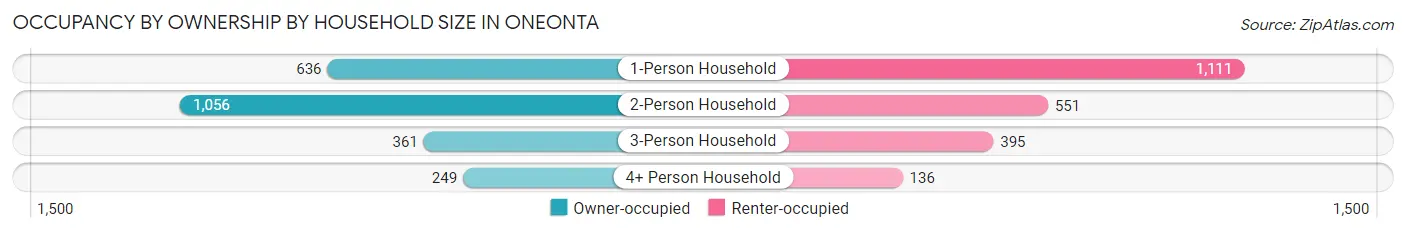
| Household Size | Owner-occupied | Renter-occupied |
| 1-Person Household | 636 (36.4%) | 1,111 (63.6%) |
| 2-Person Household | 1,056 (65.7%) | 551 (34.3%) |
| 3-Person Household | 361 (47.7%) | 395 (52.2%) |
| 4+ Person Household | 249 (64.7%) | 136 (35.3%) |
| Total Housing Units | 2,302 (51.2%) | 2,193 (48.8%) |
Occupancy by Educational Attainment in Oneonta
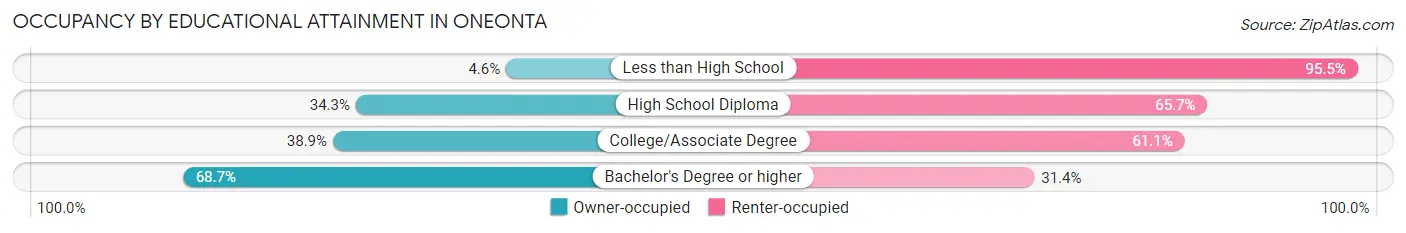
| Household Size | Owner-occupied | Renter-occupied |
| Less than High School | 8 (4.5%) | 168 (95.5%) |
| High School Diploma | 276 (34.3%) | 528 (65.7%) |
| College/Associate Degree | 516 (38.9%) | 811 (61.1%) |
| Bachelor's Degree or higher | 1,502 (68.6%) | 686 (31.4%) |
Occupancy by Age of Householder in Oneonta
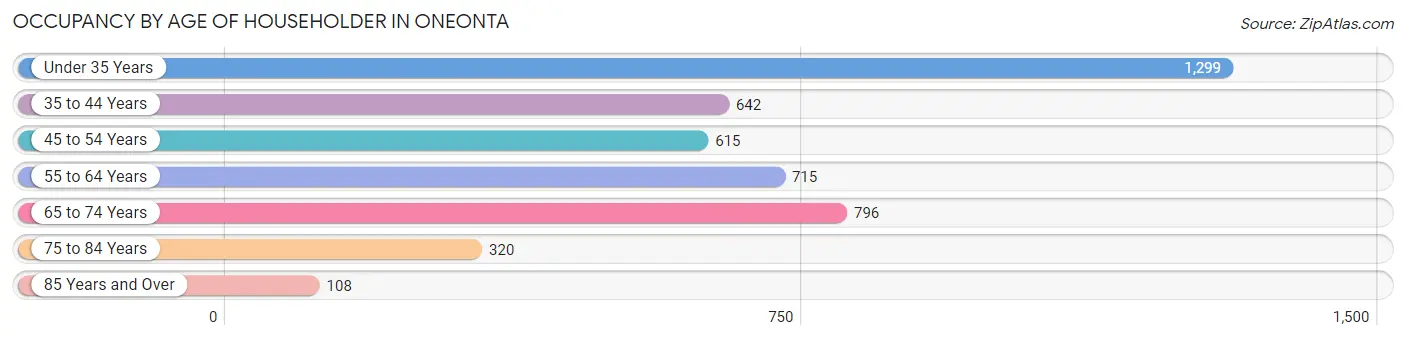
| Age Bracket | # Households | % Households |
| Under 35 Years | 1,299 | 28.9% |
| 35 to 44 Years | 642 | 14.3% |
| 45 to 54 Years | 615 | 13.7% |
| 55 to 64 Years | 715 | 15.9% |
| 65 to 74 Years | 796 | 17.7% |
| 75 to 84 Years | 320 | 7.1% |
| 85 Years and Over | 108 | 2.4% |
| Total | 4,495 | 100.0% |
Housing Finances in Oneonta
Median Income by Occupancy in Oneonta
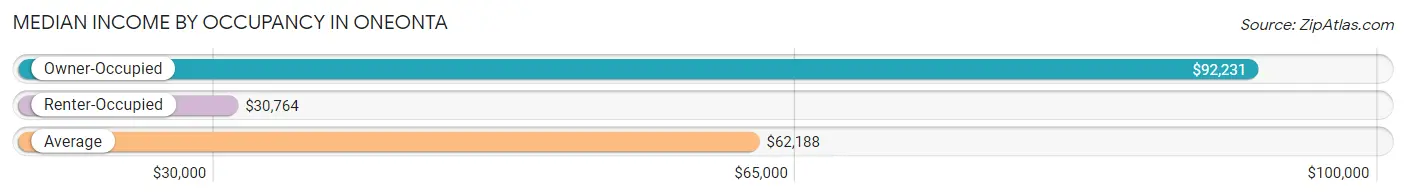
| Occupancy Type | # Households | Median Income |
| Owner-Occupied | 2,302 (51.2%) | $92,231 |
| Renter-Occupied | 2,193 (48.8%) | $30,764 |
| Average | 4,495 (100.0%) | $62,188 |
Occupancy by Householder Income Bracket in Oneonta
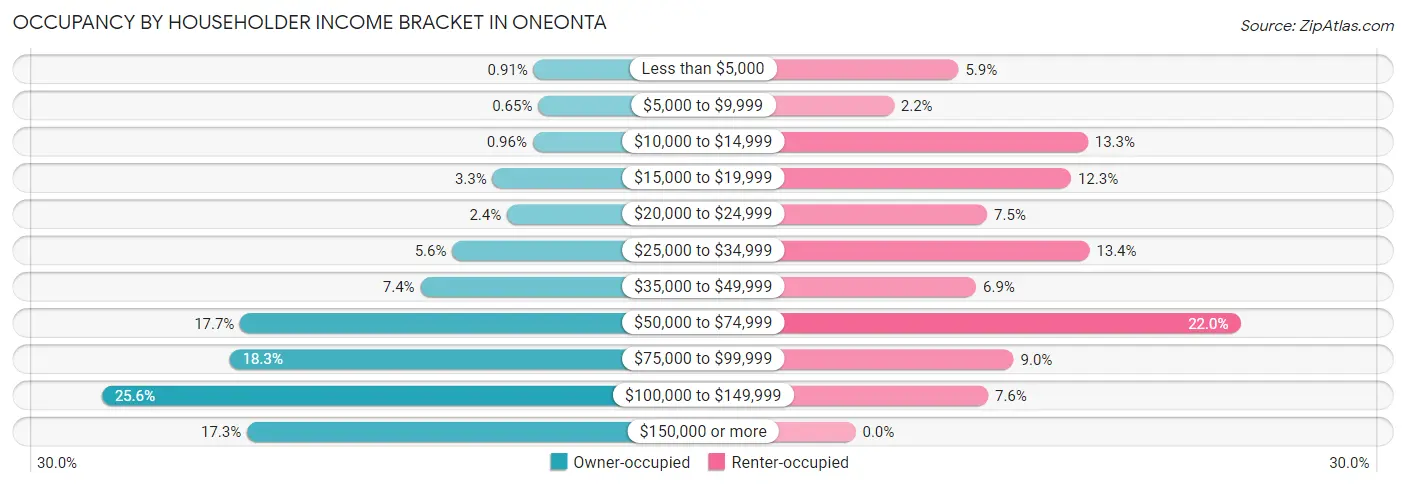
| Income Bracket | Owner-occupied | Renter-occupied |
| Less than $5,000 | 21 (0.9%) | 129 (5.9%) |
| $5,000 to $9,999 | 15 (0.6%) | 48 (2.2%) |
| $10,000 to $14,999 | 22 (1.0%) | 291 (13.3%) |
| $15,000 to $19,999 | 75 (3.3%) | 270 (12.3%) |
| $20,000 to $24,999 | 56 (2.4%) | 165 (7.5%) |
| $25,000 to $34,999 | 128 (5.6%) | 293 (13.4%) |
| $35,000 to $49,999 | 170 (7.4%) | 151 (6.9%) |
| $50,000 to $74,999 | 407 (17.7%) | 482 (22.0%) |
| $75,000 to $99,999 | 421 (18.3%) | 198 (9.0%) |
| $100,000 to $149,999 | 589 (25.6%) | 166 (7.6%) |
| $150,000 or more | 398 (17.3%) | 0 (0.0%) |
| Total | 2,302 (100.0%) | 2,193 (100.0%) |
Monthly Housing Cost Tiers in Oneonta
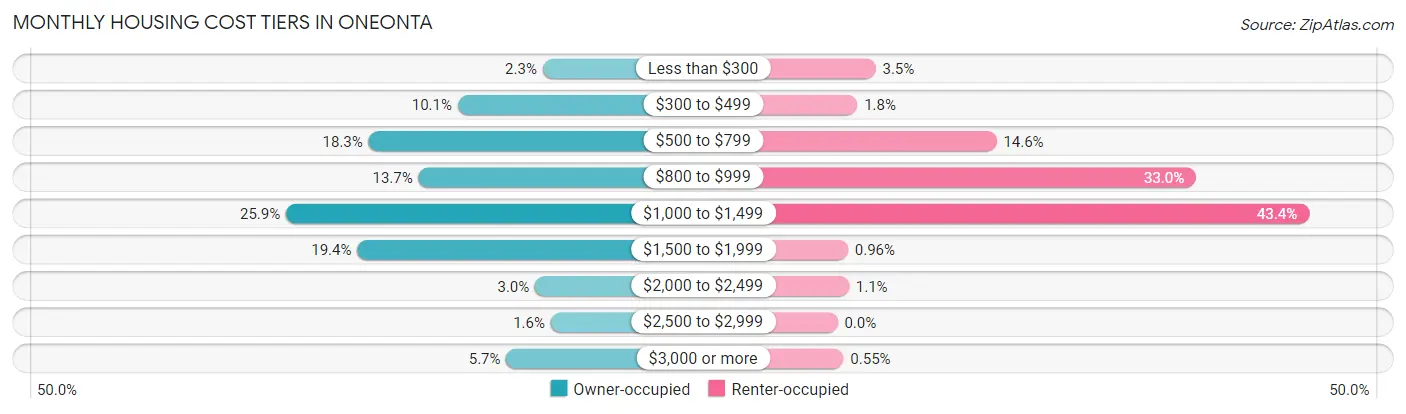
| Monthly Cost | Owner-occupied | Renter-occupied |
| Less than $300 | 53 (2.3%) | 77 (3.5%) |
| $300 to $499 | 233 (10.1%) | 40 (1.8%) |
| $500 to $799 | 422 (18.3%) | 321 (14.6%) |
| $800 to $999 | 316 (13.7%) | 724 (33.0%) |
| $1,000 to $1,499 | 597 (25.9%) | 952 (43.4%) |
| $1,500 to $1,999 | 446 (19.4%) | 21 (1.0%) |
| $2,000 to $2,499 | 69 (3.0%) | 23 (1.1%) |
| $2,500 to $2,999 | 36 (1.6%) | 0 (0.0%) |
| $3,000 or more | 130 (5.7%) | 12 (0.5%) |
| Total | 2,302 (100.0%) | 2,193 (100.0%) |
Physical Housing Characteristics in Oneonta
Housing Structures in Oneonta
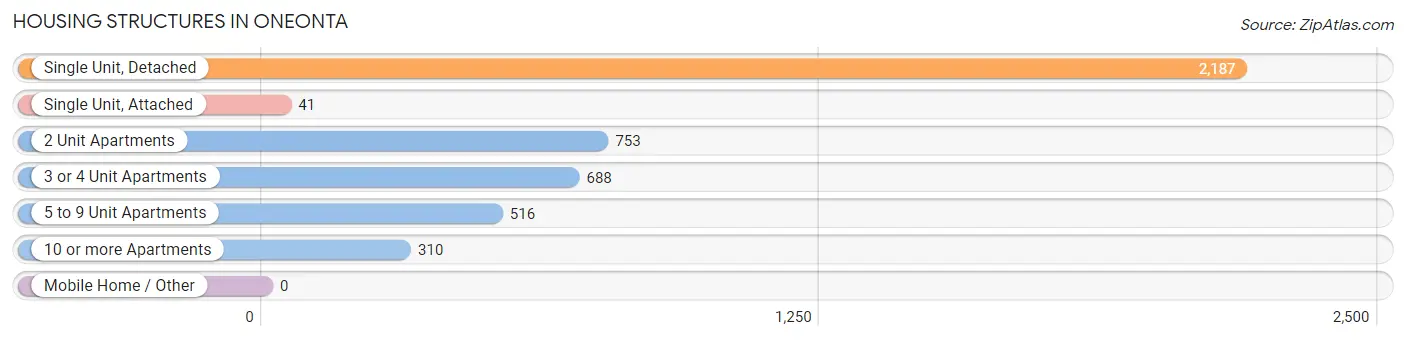
| Structure Type | # Housing Units | % Housing Units |
| Single Unit, Detached | 2,187 | 48.6% |
| Single Unit, Attached | 41 | 0.9% |
| 2 Unit Apartments | 753 | 16.8% |
| 3 or 4 Unit Apartments | 688 | 15.3% |
| 5 to 9 Unit Apartments | 516 | 11.5% |
| 10 or more Apartments | 310 | 6.9% |
| Mobile Home / Other | 0 | 0.0% |
| Total | 4,495 | 100.0% |
Housing Structures by Occupancy in Oneonta
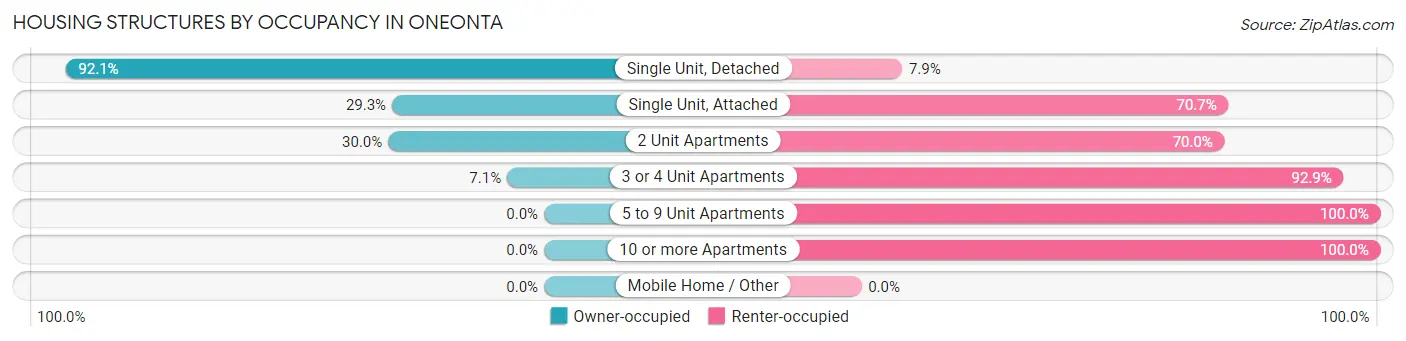
| Structure Type | Owner-occupied | Renter-occupied |
| Single Unit, Detached | 2,015 (92.1%) | 172 (7.9%) |
| Single Unit, Attached | 12 (29.3%) | 29 (70.7%) |
| 2 Unit Apartments | 226 (30.0%) | 527 (70.0%) |
| 3 or 4 Unit Apartments | 49 (7.1%) | 639 (92.9%) |
| 5 to 9 Unit Apartments | 0 (0.0%) | 516 (100.0%) |
| 10 or more Apartments | 0 (0.0%) | 310 (100.0%) |
| Mobile Home / Other | 0 (0.0%) | 0 (0.0%) |
| Total | 2,302 (51.2%) | 2,193 (48.8%) |
Housing Structures by Number of Rooms in Oneonta
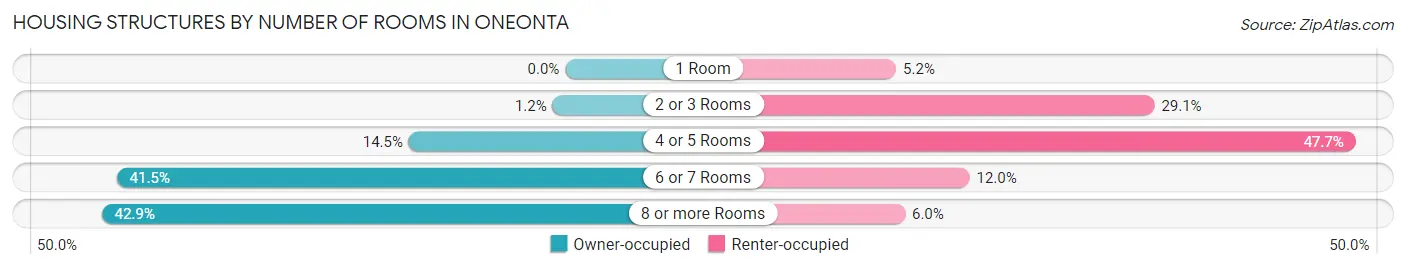
| Number of Rooms | Owner-occupied | Renter-occupied |
| 1 Room | 0 (0.0%) | 114 (5.2%) |
| 2 or 3 Rooms | 27 (1.2%) | 638 (29.1%) |
| 4 or 5 Rooms | 333 (14.5%) | 1,046 (47.7%) |
| 6 or 7 Rooms | 955 (41.5%) | 263 (12.0%) |
| 8 or more Rooms | 987 (42.9%) | 132 (6.0%) |
| Total | 2,302 (100.0%) | 2,193 (100.0%) |
Housing Structure by Heating Type in Oneonta
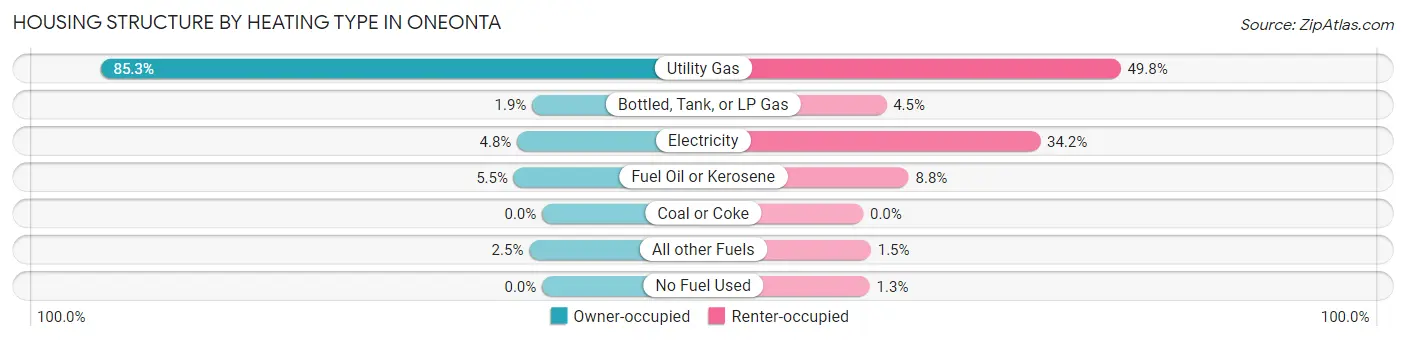
| Heating Type | Owner-occupied | Renter-occupied |
| Utility Gas | 1,964 (85.3%) | 1,091 (49.7%) |
| Bottled, Tank, or LP Gas | 44 (1.9%) | 98 (4.5%) |
| Electricity | 111 (4.8%) | 750 (34.2%) |
| Fuel Oil or Kerosene | 126 (5.5%) | 193 (8.8%) |
| Coal or Coke | 0 (0.0%) | 0 (0.0%) |
| All other Fuels | 57 (2.5%) | 33 (1.5%) |
| No Fuel Used | 0 (0.0%) | 28 (1.3%) |
| Total | 2,302 (100.0%) | 2,193 (100.0%) |
Household Vehicle Usage in Oneonta
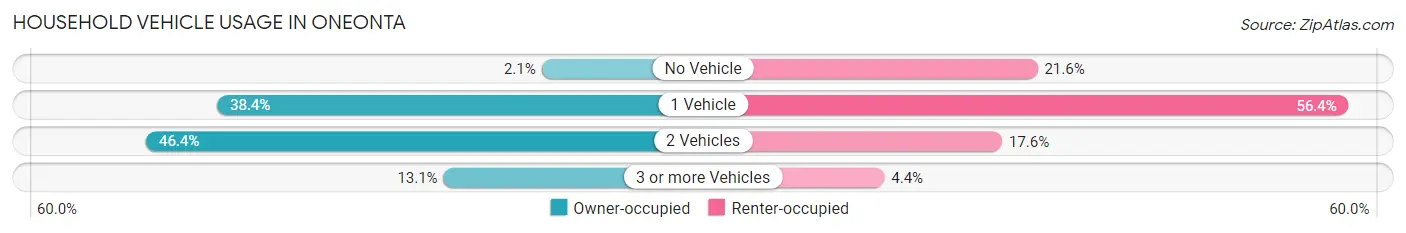
| Vehicles per Household | Owner-occupied | Renter-occupied |
| No Vehicle | 48 (2.1%) | 473 (21.6%) |
| 1 Vehicle | 885 (38.4%) | 1,237 (56.4%) |
| 2 Vehicles | 1,068 (46.4%) | 386 (17.6%) |
| 3 or more Vehicles | 301 (13.1%) | 97 (4.4%) |
| Total | 2,302 (100.0%) | 2,193 (100.0%) |
Real Estate & Mortgages in Oneonta
Real Estate and Mortgage Overview in Oneonta
| Characteristic | Without Mortgage | With Mortgage |
| Housing Units | 838 | 1,464 |
| Median Property Value | $162,100 | $177,300 |
| Median Household Income | $75,455 | $240 |
| Monthly Housing Costs | $565 | $130 |
| Real Estate Taxes | $2,965 | $32 |
Property Value by Mortgage Status in Oneonta
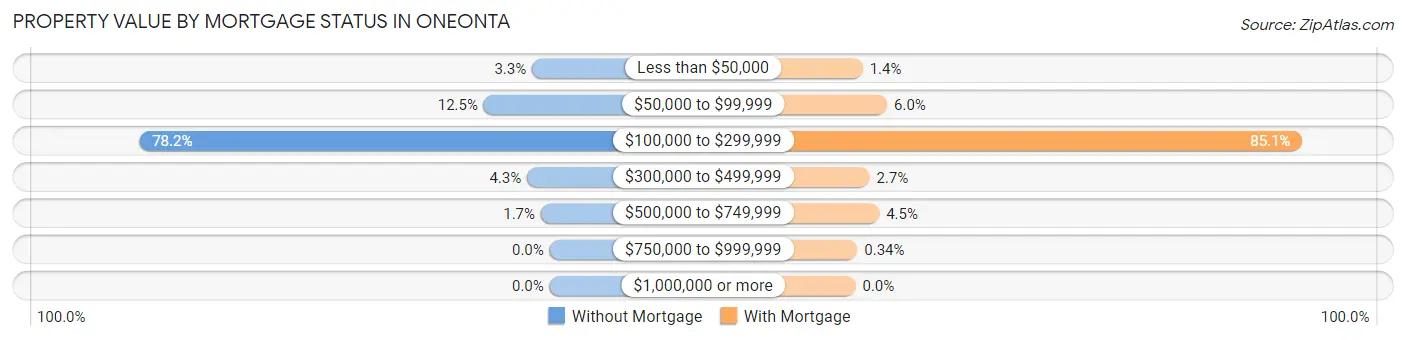
| Property Value | Without Mortgage | With Mortgage |
| Less than $50,000 | 28 (3.3%) | 20 (1.4%) |
| $50,000 to $99,999 | 105 (12.5%) | 88 (6.0%) |
| $100,000 to $299,999 | 655 (78.2%) | 1,246 (85.1%) |
| $300,000 to $499,999 | 36 (4.3%) | 39 (2.7%) |
| $500,000 to $749,999 | 14 (1.7%) | 66 (4.5%) |
| $750,000 to $999,999 | 0 (0.0%) | 5 (0.3%) |
| $1,000,000 or more | 0 (0.0%) | 0 (0.0%) |
| Total | 838 (100.0%) | 1,464 (100.0%) |
Household Income by Mortgage Status in Oneonta
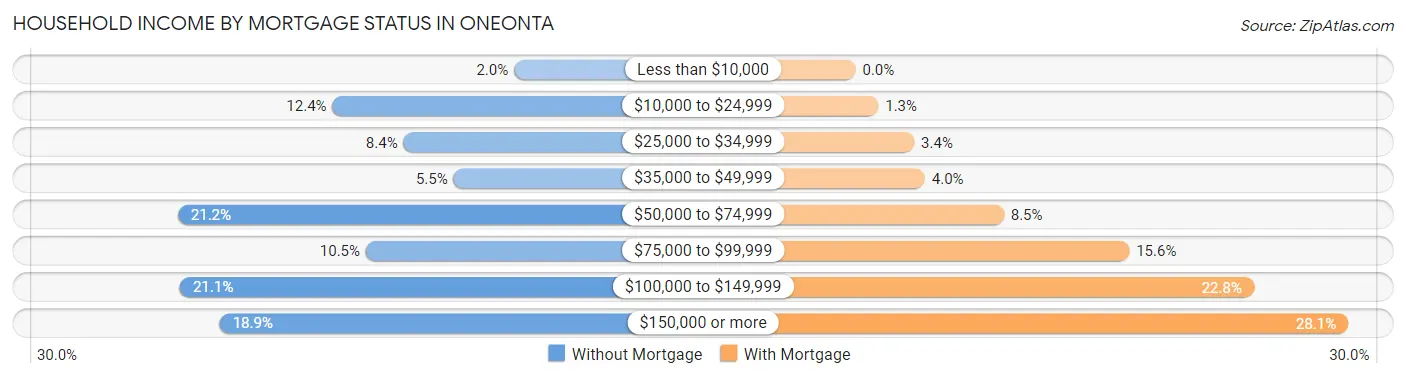
| Household Income | Without Mortgage | With Mortgage |
| Less than $10,000 | 17 (2.0%) | 0 (0.0%) |
| $10,000 to $24,999 | 104 (12.4%) | 19 (1.3%) |
| $25,000 to $34,999 | 70 (8.4%) | 49 (3.4%) |
| $35,000 to $49,999 | 46 (5.5%) | 58 (4.0%) |
| $50,000 to $74,999 | 178 (21.2%) | 124 (8.5%) |
| $75,000 to $99,999 | 88 (10.5%) | 229 (15.6%) |
| $100,000 to $149,999 | 177 (21.1%) | 333 (22.8%) |
| $150,000 or more | 158 (18.9%) | 412 (28.1%) |
| Total | 838 (100.0%) | 1,464 (100.0%) |
Property Value to Household Income Ratio in Oneonta
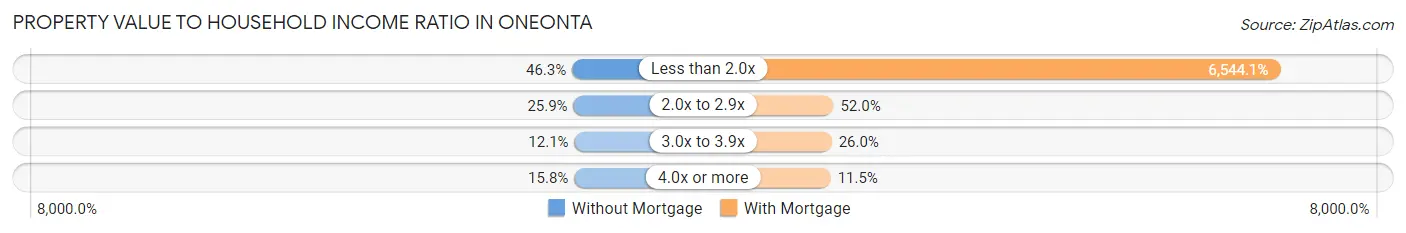
| Value-to-Income Ratio | Without Mortgage | With Mortgage |
| Less than 2.0x | 388 (46.3%) | 95,806 (6,544.1%) |
| 2.0x to 2.9x | 217 (25.9%) | 761 (52.0%) |
| 3.0x to 3.9x | 101 (12.0%) | 380 (26.0%) |
| 4.0x or more | 132 (15.8%) | 169 (11.5%) |
| Total | 838 (100.0%) | 1,464 (100.0%) |
Real Estate Taxes by Mortgage Status in Oneonta
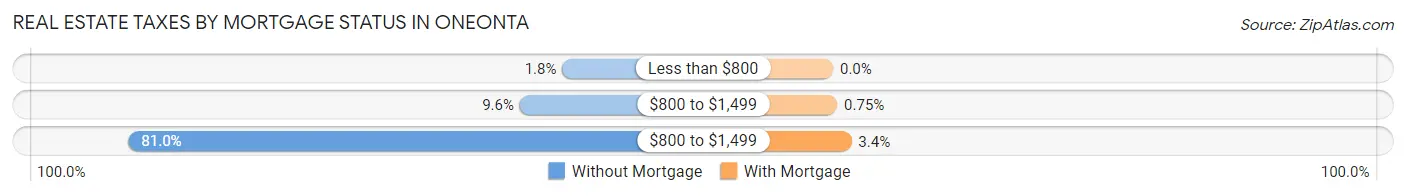
| Property Taxes | Without Mortgage | With Mortgage |
| Less than $800 | 15 (1.8%) | 0 (0.0%) |
| $800 to $1,499 | 80 (9.6%) | 11 (0.7%) |
| $800 to $1,499 | 679 (81.0%) | 49 (3.4%) |
| Total | 838 (100.0%) | 1,464 (100.0%) |
Health & Disability in Oneonta
Health Insurance Coverage by Age in Oneonta
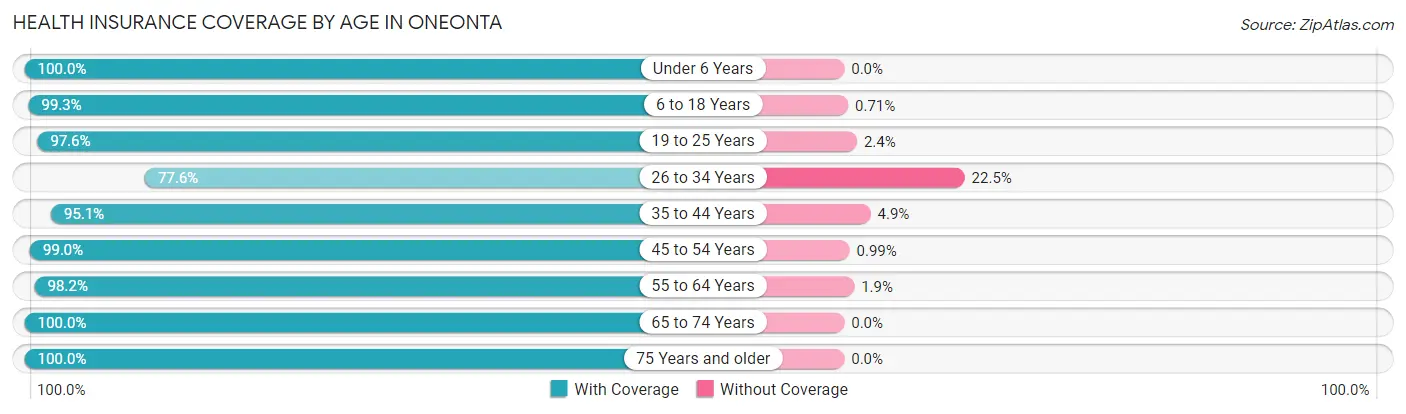
| Age Bracket | With Coverage | Without Coverage |
| Under 6 Years | 445 (100.0%) | 0 (0.0%) |
| 6 to 18 Years | 1,968 (99.3%) | 14 (0.7%) |
| 19 to 25 Years | 5,101 (97.6%) | 124 (2.4%) |
| 26 to 34 Years | 967 (77.5%) | 280 (22.5%) |
| 35 to 44 Years | 930 (95.1%) | 48 (4.9%) |
| 45 to 54 Years | 898 (99.0%) | 9 (1.0%) |
| 55 to 64 Years | 1,113 (98.2%) | 21 (1.8%) |
| 65 to 74 Years | 1,208 (100.0%) | 0 (0.0%) |
| 75 Years and older | 697 (100.0%) | 0 (0.0%) |
| Total | 13,327 (96.4%) | 496 (3.6%) |
Health Insurance Coverage by Citizenship Status in Oneonta
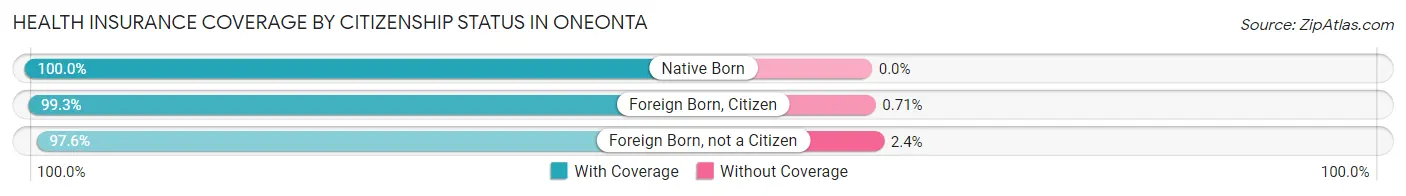
| Citizenship Status | With Coverage | Without Coverage |
| Native Born | 445 (100.0%) | 0 (0.0%) |
| Foreign Born, Citizen | 1,968 (99.3%) | 14 (0.7%) |
| Foreign Born, not a Citizen | 5,101 (97.6%) | 124 (2.4%) |
Health Insurance Coverage by Household Income in Oneonta
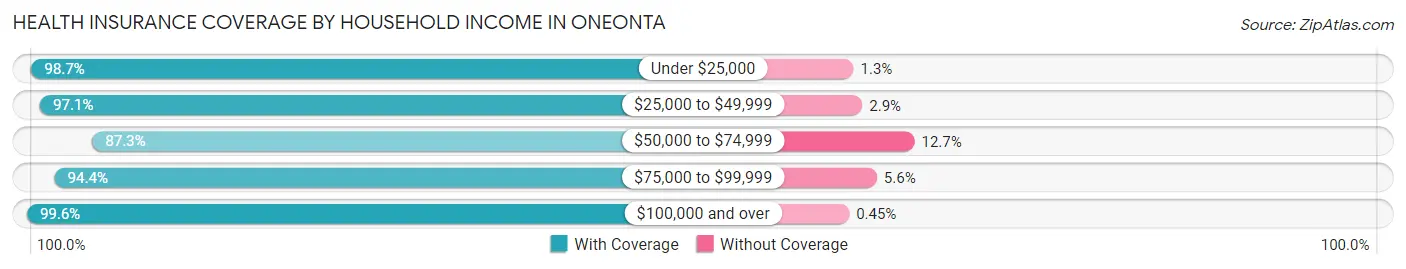
| Household Income | With Coverage | Without Coverage |
| Under $25,000 | 1,857 (98.7%) | 24 (1.3%) |
| $25,000 to $49,999 | 1,630 (97.1%) | 49 (2.9%) |
| $50,000 to $74,999 | 1,506 (87.3%) | 219 (12.7%) |
| $75,000 to $99,999 | 1,371 (94.4%) | 82 (5.6%) |
| $100,000 and over | 2,676 (99.6%) | 12 (0.4%) |
Public vs Private Health Insurance Coverage by Age in Oneonta
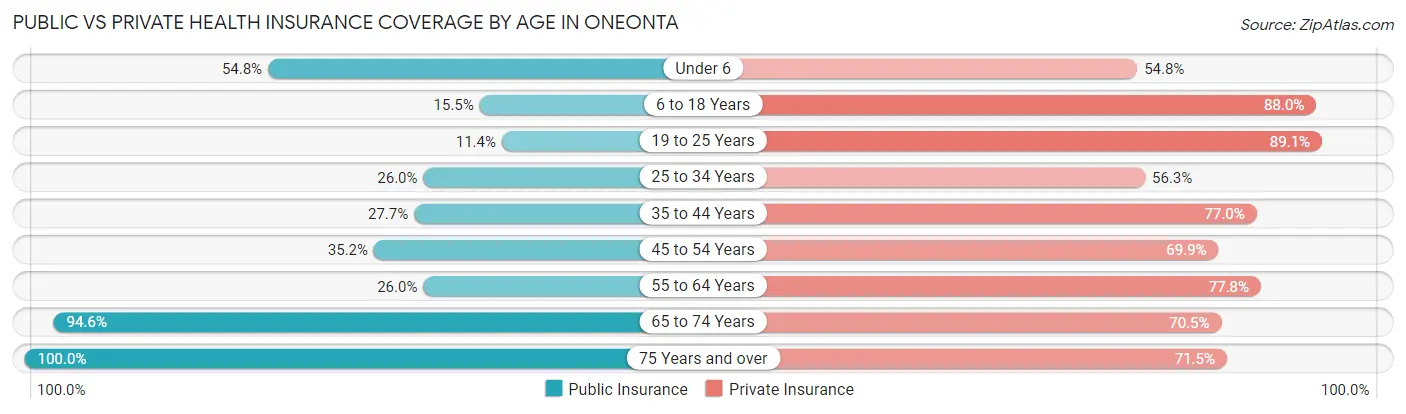
| Age Bracket | Public Insurance | Private Insurance |
| Under 6 | 244 (54.8%) | 244 (54.8%) |
| 6 to 18 Years | 308 (15.5%) | 1,745 (88.0%) |
| 19 to 25 Years | 597 (11.4%) | 4,656 (89.1%) |
| 25 to 34 Years | 324 (26.0%) | 702 (56.3%) |
| 35 to 44 Years | 271 (27.7%) | 753 (77.0%) |
| 45 to 54 Years | 319 (35.2%) | 634 (69.9%) |
| 55 to 64 Years | 295 (26.0%) | 882 (77.8%) |
| 65 to 74 Years | 1,143 (94.6%) | 851 (70.5%) |
| 75 Years and over | 697 (100.0%) | 498 (71.5%) |
| Total | 4,198 (30.4%) | 10,965 (79.3%) |
Disability Status by Sex by Age in Oneonta
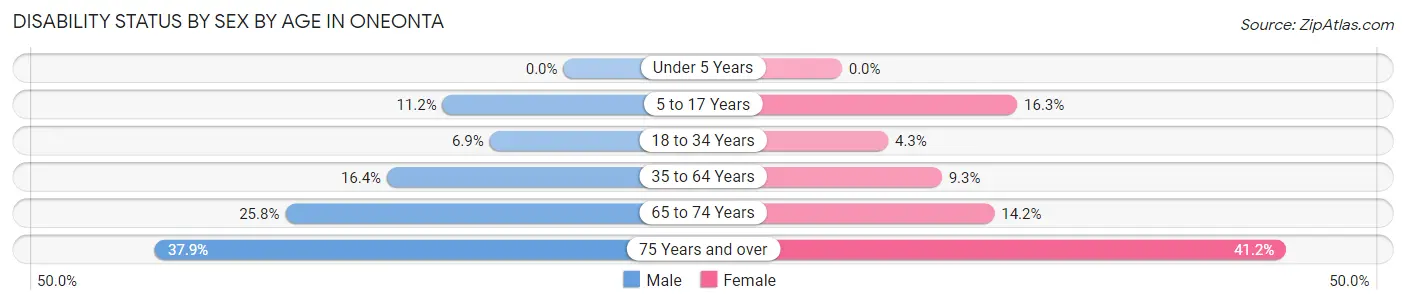
| Age Bracket | Male | Female |
| Under 5 Years | 0 (0.0%) | 0 (0.0%) |
| 5 to 17 Years | 51 (11.2%) | 69 (16.3%) |
| 18 to 34 Years | 236 (6.9%) | 178 (4.3%) |
| 35 to 64 Years | 233 (16.4%) | 148 (9.3%) |
| 65 to 74 Years | 144 (25.8%) | 92 (14.1%) |
| 75 Years and over | 130 (37.9%) | 146 (41.2%) |
Disability Class by Sex by Age in Oneonta
Disability Class: Hearing Difficulty
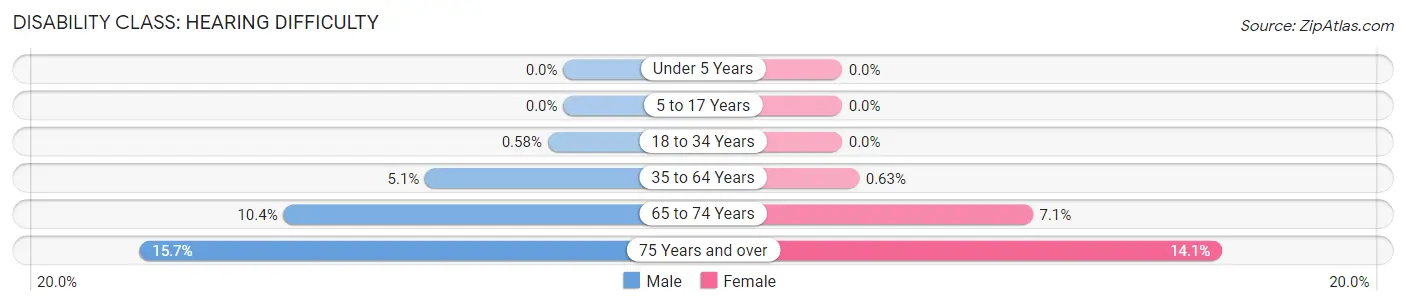
| Age Bracket | Male | Female |
| Under 5 Years | 0 (0.0%) | 0 (0.0%) |
| 5 to 17 Years | 0 (0.0%) | 0 (0.0%) |
| 18 to 34 Years | 20 (0.6%) | 0 (0.0%) |
| 35 to 64 Years | 73 (5.1%) | 10 (0.6%) |
| 65 to 74 Years | 58 (10.4%) | 46 (7.1%) |
| 75 Years and over | 54 (15.7%) | 50 (14.1%) |
Disability Class: Vision Difficulty
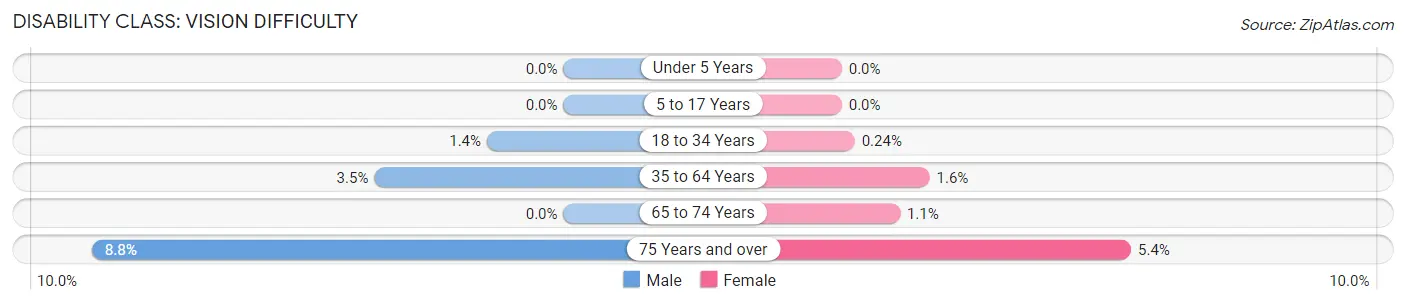
| Age Bracket | Male | Female |
| Under 5 Years | 0 (0.0%) | 0 (0.0%) |
| 5 to 17 Years | 0 (0.0%) | 0 (0.0%) |
| 18 to 34 Years | 49 (1.4%) | 10 (0.2%) |
| 35 to 64 Years | 50 (3.5%) | 26 (1.6%) |
| 65 to 74 Years | 0 (0.0%) | 7 (1.1%) |
| 75 Years and over | 30 (8.7%) | 19 (5.4%) |
Disability Class: Cognitive Difficulty
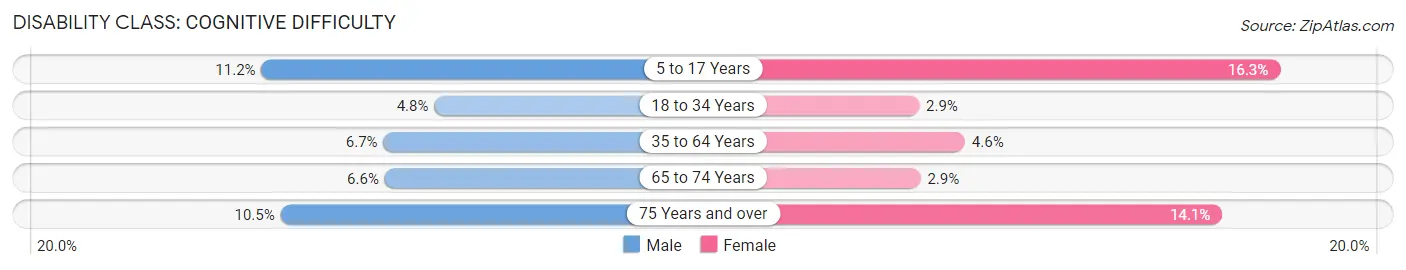
| Age Bracket | Male | Female |
| 5 to 17 Years | 51 (11.2%) | 69 (16.3%) |
| 18 to 34 Years | 165 (4.8%) | 119 (2.9%) |
| 35 to 64 Years | 95 (6.7%) | 73 (4.6%) |
| 65 to 74 Years | 37 (6.6%) | 19 (2.9%) |
| 75 Years and over | 36 (10.5%) | 50 (14.1%) |
Disability Class: Ambulatory Difficulty
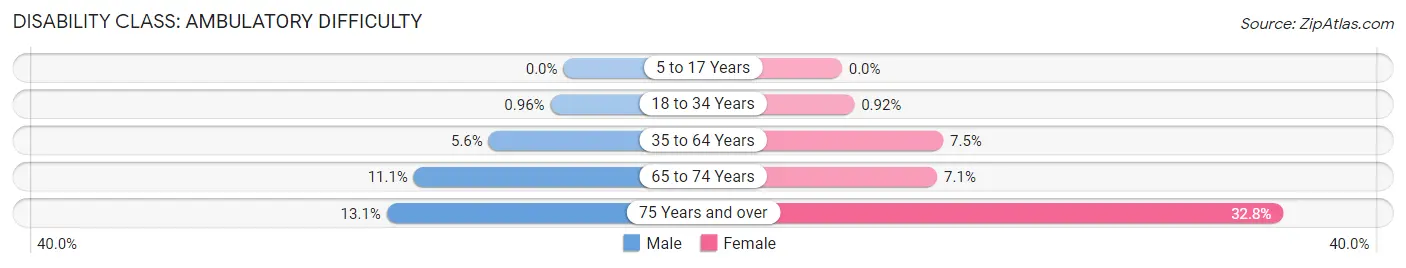
| Age Bracket | Male | Female |
| 5 to 17 Years | 0 (0.0%) | 0 (0.0%) |
| 18 to 34 Years | 33 (1.0%) | 38 (0.9%) |
| 35 to 64 Years | 79 (5.6%) | 120 (7.5%) |
| 65 to 74 Years | 62 (11.1%) | 46 (7.1%) |
| 75 Years and over | 45 (13.1%) | 116 (32.8%) |
Disability Class: Self-Care Difficulty
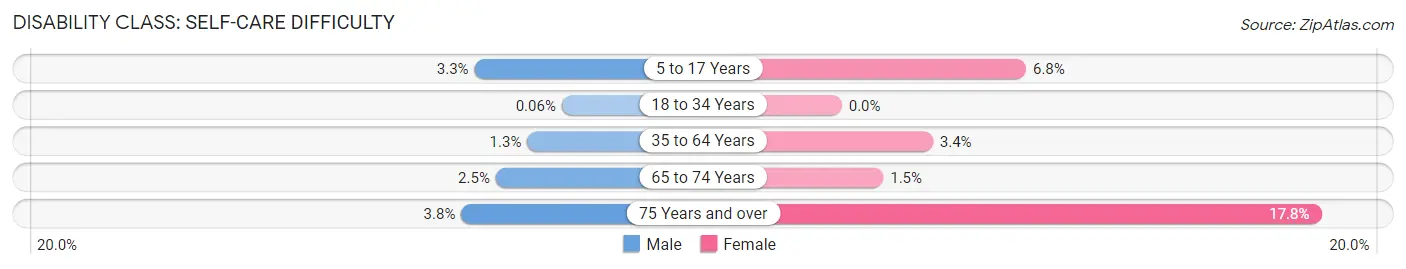
| Age Bracket | Male | Female |
| 5 to 17 Years | 15 (3.3%) | 29 (6.8%) |
| 18 to 34 Years | 2 (0.1%) | 0 (0.0%) |
| 35 to 64 Years | 19 (1.3%) | 54 (3.4%) |
| 65 to 74 Years | 14 (2.5%) | 10 (1.5%) |
| 75 Years and over | 13 (3.8%) | 63 (17.8%) |
Technology Access in Oneonta
Computing Device Access in Oneonta
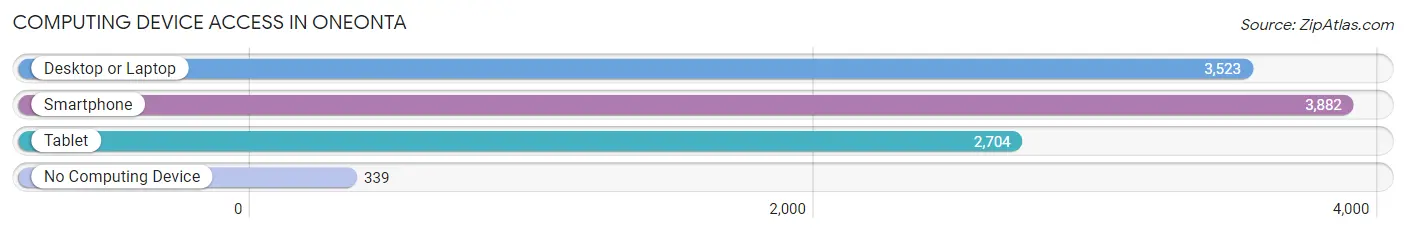
| Device Type | # Households | % Households |
| Desktop or Laptop | 3,523 | 78.4% |
| Smartphone | 3,882 | 86.4% |
| Tablet | 2,704 | 60.2% |
| No Computing Device | 339 | 7.5% |
| Total | 4,495 | 100.0% |
Internet Access in Oneonta
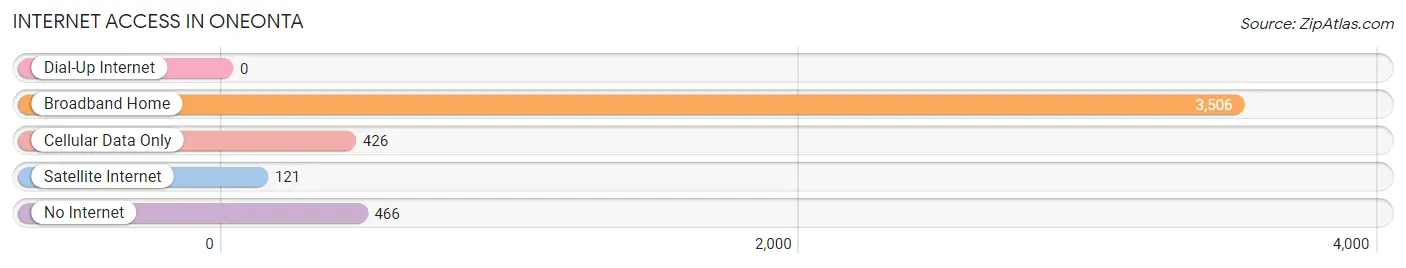
| Internet Type | # Households | % Households |
| Dial-Up Internet | 0 | 0.0% |
| Broadband Home | 3,506 | 78.0% |
| Cellular Data Only | 426 | 9.5% |
| Satellite Internet | 121 | 2.7% |
| No Internet | 466 | 10.4% |
| Total | 4,495 | 100.0% |
Oneonta Summary
Oneonta is a city located in Otsego County, New York, United States. It is situated in the foothills of the Catskill Mountains, approximately 85 miles northwest of New York City. The city is located in the Central Leatherstocking Region of New York, and is the county seat of Otsego County. As of the 2010 census, the city had a population of 13,901.
History
Oneonta was first settled in 1773 by Zadock Pratt, a Revolutionary War veteran. The city was originally known as "O-ne-o-ta," which means "place of open rocks" in the language of the local Native American tribe, the Mohawk. The city was incorporated in 1848 and was named after the Greek word for "one stone," referring to a large boulder located in the city.
In the late 19th century, Oneonta became a popular tourist destination due to its proximity to the Catskill Mountains. The city was also home to several large factories, including the Oneonta Woolen Mill, which produced woolen goods for the Union Army during the Civil War.
Geography
Oneonta is located at 42°27'N 75°3'W (42.45, -75.05). According to the United States Census Bureau, the city has a total area of 4.2 square miles (10.8 km2), all of it land.
Oneonta is located in the Central Leatherstocking Region of New York, and is the county seat of Otsego County. The city is situated in the foothills of the Catskill Mountains, approximately 85 miles northwest of New York City.
Economy
Oneonta is home to several large employers, including the State University of New York at Oneonta, Hartwick College, and the A.O. Fox Memorial Hospital. The city is also home to several manufacturing companies, including the Oneonta Woolen Mill, which produces woolen goods for the Union Army during the Civil War.
The city is also home to several retail stores, including the Oneonta Mall, which features over 50 stores and restaurants. The city is also home to several restaurants, bars, and cafes.
Demographics
As of the 2010 census, the city had a population of 13,901. The racial makeup of the city was 90.2% White, 4.2% African American, 0.3% Native American, 1.7% Asian, 0.1% Pacific Islander, 1.3% from other races, and 2.4% from two or more races. Hispanic or Latino of any race were 4.3% of the population.
The median income for a household in the city was $37,945, and the median income for a family was $50,945. Males had a median income of $36,945 versus $27,945 for females. The per capita income for the city was $20,945. About 8.2% of families and 12.3% of the population were below the poverty line, including 16.2% of those under age 18 and 8.2% of those age 65 or over.
Common Questions
What is Per Capita Income in Oneonta?
Per Capita income in Oneonta is $27,061.
What is the Median Family Income in Oneonta?
Median Family Income in Oneonta is $80,802.
What is the Median Household income in Oneonta?
Median Household Income in Oneonta is $62,188.
What is Income or Wage Gap in Oneonta?
Income or Wage Gap in Oneonta is 67.6%.
Women in Oneonta earn 32.4 cents for every dollar earned by a man.
What is Inequality or Gini Index in Oneonta?
Inequality or Gini Index in Oneonta is 0.45.
What is the Total Population of Oneonta?
Total Population of Oneonta is 14,097.
What is the Total Male Population of Oneonta?
Total Male Population of Oneonta is 6,685.
What is the Total Female Population of Oneonta?
Total Female Population of Oneonta is 7,412.
What is the Ratio of Males per 100 Females in Oneonta?
There are 90.19 Males per 100 Females in Oneonta.
What is the Ratio of Females per 100 Males in Oneonta?
There are 110.88 Females per 100 Males in Oneonta.
What is the Median Population Age in Oneonta?
Median Population Age in Oneonta is 22.7 Years.
What is the Average Family Size in Oneonta
Average Family Size in Oneonta is 2.5 People.
What is the Average Household Size in Oneonta
Average Household Size in Oneonta is 2.1 People.
How Large is the Labor Force in Oneonta?
There are 6,714 People in the Labor Forcein in Oneonta.
What is the Percentage of People in the Labor Force in Oneonta?
51.9% of People are in the Labor Force in Oneonta.
What is the Unemployment Rate in Oneonta?
Unemployment Rate in Oneonta is 3.6%.