Cities with the Highest Percentage of West Indian Population in New York
RELATED REPORTS & OPTIONS
West Indian
New York
Compare Cities
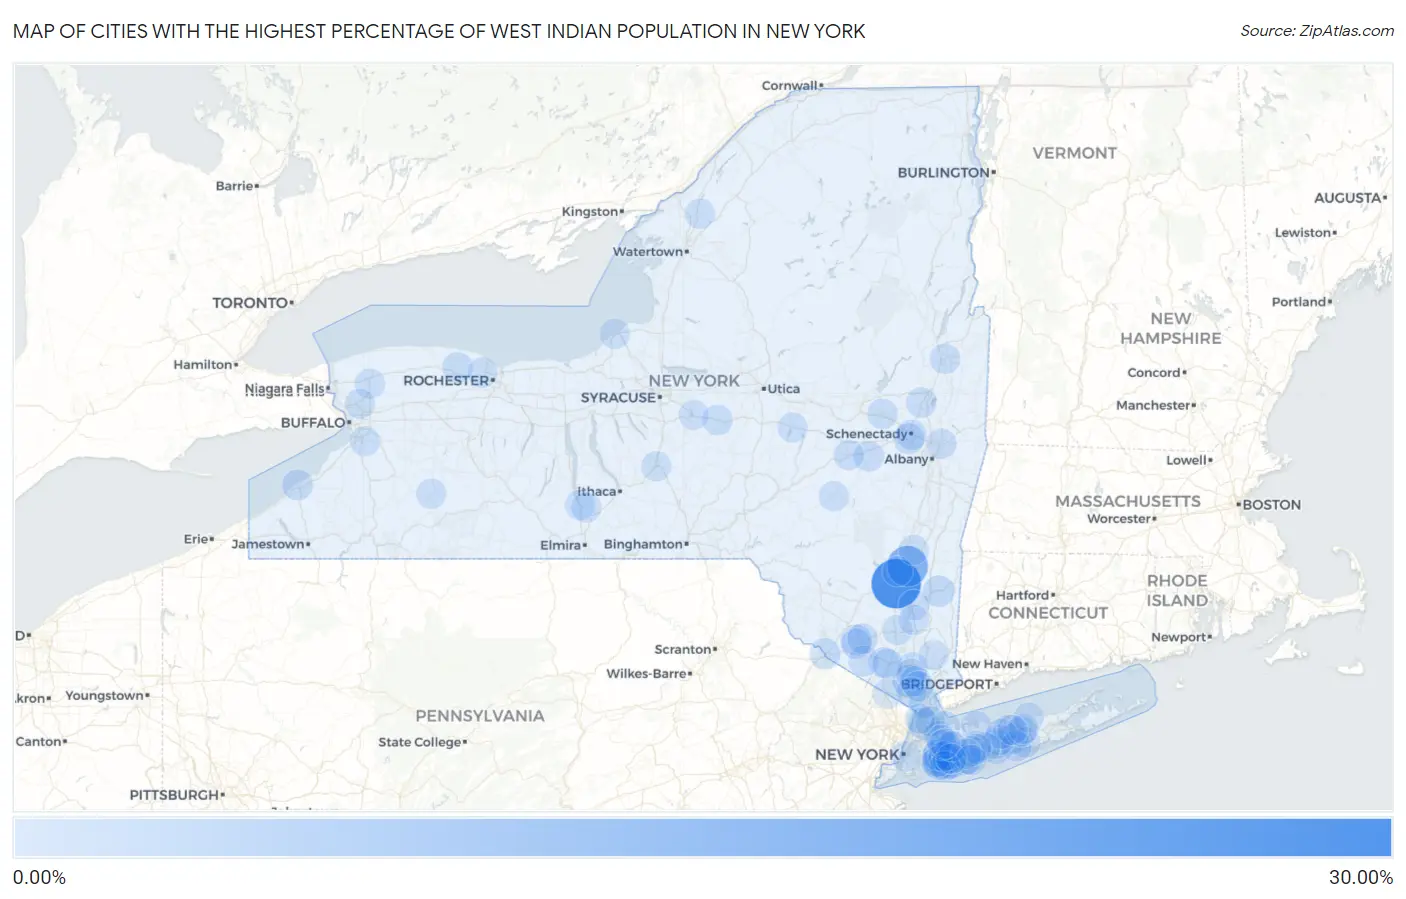
Map of Cities with the Highest Percentage of West Indian Population in New York
0.00%
30.00%
Cities with the Highest Percentage of West Indian Population in New York
| City | West Indian | vs State | vs National | |
| 1. | Tillson | 29.74% | 0.50%(+29.2)#1 | 0.081%(+29.7)#1 |
| 2. | East Kingston | 16.26% | 0.50%(+15.8)#2 | 0.081%(+16.2)#2 |
| 3. | Haverstraw | 3.61% | 0.50%(+3.10)#3 | 0.081%(+3.52)#13 |
| 4. | Mount Vernon | 2.54% | 0.50%(+2.04)#4 | 0.081%(+2.46)#27 |
| 5. | Baldwin | 2.42% | 0.50%(+1.91)#5 | 0.081%(+2.34)#33 |
| 6. | Salisbury Center | 2.35% | 0.50%(+1.85)#6 | 0.081%(+2.27)#35 |
| 7. | Millbrook | 2.32% | 0.50%(+1.81)#7 | 0.081%(+2.23)#36 |
| 8. | South Floral Park | 2.13% | 0.50%(+1.62)#8 | 0.081%(+2.05)#40 |
| 9. | Rosendale | 2.11% | 0.50%(+1.60)#9 | 0.081%(+2.03)#42 |
| 10. | Lakeview | 2.11% | 0.50%(+1.60)#10 | 0.081%(+2.02)#43 |
| 11. | Elmsford | 1.75% | 0.50%(+1.25)#11 | 0.081%(+1.67)#57 |
| 12. | North Valley Stream | 1.54% | 0.50%(+1.04)#12 | 0.081%(+1.46)#69 |
| 13. | Port Jervis | 1.54% | 0.50%(+1.03)#13 | 0.081%(+1.46)#72 |
| 14. | Centereach | 1.44% | 0.50%(+0.938)#14 | 0.081%(+1.36)#76 |
| 15. | Rotterdam | 1.31% | 0.50%(+0.801)#15 | 0.081%(+1.22)#89 |
| 16. | Washington Heights | 1.27% | 0.50%(+0.768)#16 | 0.081%(+1.19)#92 |
| 17. | Dunkirk | 1.17% | 0.50%(+0.664)#17 | 0.081%(+1.09)#101 |
| 18. | Islip Terrace | 1.15% | 0.50%(+0.643)#18 | 0.081%(+1.07)#103 |
| 19. | North Merrick | 1.13% | 0.50%(+0.628)#19 | 0.081%(+1.05)#105 |
| 20. | Freeport | 1.09% | 0.50%(+0.590)#20 | 0.081%(+1.01)#111 |
| 21. | Clarkson | 1.06% | 0.50%(+0.551)#21 | 0.081%(+0.975)#118 |
| 22. | Holtsville | 1.02% | 0.50%(+0.511)#22 | 0.081%(+0.935)#124 |
| 23. | Central Islip | 1.01% | 0.50%(+0.509)#23 | 0.081%(+0.932)#125 |
| 24. | Monroe | 1.01% | 0.50%(+0.504)#24 | 0.081%(+0.928)#126 |
| 25. | Uniondale | 0.99% | 0.50%(+0.490)#25 | 0.081%(+0.913)#129 |
| 26. | Schenectady | 0.99% | 0.50%(+0.489)#26 | 0.081%(+0.912)#130 |
| 27. | East Rockaway | 0.98% | 0.50%(+0.479)#27 | 0.081%(+0.902)#132 |
| 28. | Peekskill | 0.98% | 0.50%(+0.476)#28 | 0.081%(+0.900)#133 |
| 29. | New York | 0.94% | 0.50%(+0.438)#29 | 0.081%(+0.861)#143 |
| 30. | Florida | 0.92% | 0.50%(+0.415)#30 | 0.081%(+0.839)#148 |
| 31. | Hewlett | 0.90% | 0.50%(+0.392)#31 | 0.081%(+0.815)#157 |
| 32. | Baxter Estates | 0.87% | 0.50%(+0.367)#32 | 0.081%(+0.790)#163 |
| 33. | Ballston Spa | 0.87% | 0.50%(+0.366)#33 | 0.081%(+0.789)#164 |
| 34. | North Bellport | 0.86% | 0.50%(+0.360)#34 | 0.081%(+0.783)#167 |
| 35. | Middletown | 0.86% | 0.50%(+0.357)#35 | 0.081%(+0.781)#168 |
| 36. | Schoharie | 0.84% | 0.50%(+0.332)#36 | 0.081%(+0.756)#176 |
| 37. | South Valley Stream | 0.80% | 0.50%(+0.292)#37 | 0.081%(+0.716)#186 |
| 38. | Elmont | 0.79% | 0.50%(+0.291)#38 | 0.081%(+0.714)#188 |
| 39. | Patchogue | 0.79% | 0.50%(+0.290)#39 | 0.081%(+0.713)#189 |
| 40. | Morrisville | 0.79% | 0.50%(+0.282)#40 | 0.081%(+0.706)#192 |
| 41. | Islandia | 0.78% | 0.50%(+0.280)#41 | 0.081%(+0.704)#195 |
| 42. | Valley Stream | 0.78% | 0.50%(+0.278)#42 | 0.081%(+0.701)#196 |
| 43. | Scotchtown | 0.75% | 0.50%(+0.249)#43 | 0.081%(+0.673)#205 |
| 44. | Harriman | 0.74% | 0.50%(+0.240)#44 | 0.081%(+0.664)#208 |
| 45. | Gordon Heights | 0.74% | 0.50%(+0.235)#45 | 0.081%(+0.658)#211 |
| 46. | Wheatley Heights | 0.73% | 0.50%(+0.226)#46 | 0.081%(+0.650)#215 |
| 47. | South Glens Falls | 0.72% | 0.50%(+0.218)#47 | 0.081%(+0.641)#221 |
| 48. | Poughkeepsie | 0.72% | 0.50%(+0.218)#48 | 0.081%(+0.641)#222 |
| 49. | Centerport | 0.71% | 0.50%(+0.208)#49 | 0.081%(+0.631)#230 |
| 50. | Troy | 0.68% | 0.50%(+0.180)#50 | 0.081%(+0.604)#242 |
| 51. | Amsterdam | 0.66% | 0.50%(+0.159)#51 | 0.081%(+0.582)#250 |
| 52. | Cobleskill | 0.65% | 0.50%(+0.146)#52 | 0.081%(+0.570)#256 |
| 53. | Hempstead | 0.62% | 0.50%(+0.114)#53 | 0.081%(+0.537)#273 |
| 54. | South Hempstead | 0.61% | 0.50%(+0.102)#54 | 0.081%(+0.525)#279 |
| 55. | Massapequa | 0.60% | 0.50%(+0.091)#55 | 0.081%(+0.514)#286 |
| 56. | East Massapequa | 0.56% | 0.50%(+0.060)#56 | 0.081%(+0.483)#302 |
| 57. | Gardnertown | 0.56% | 0.50%(+0.054)#57 | 0.081%(+0.477)#306 |
| 58. | Baywood | 0.53% | 0.50%(+0.025)#58 | 0.081%(+0.448)#323 |
| 59. | Stamford | 0.52% | 0.50%(+0.015)#59 | 0.081%(+0.439)#327 |
| 60. | East Farmingdale | 0.51% | 0.50%(+0.009)#60 | 0.081%(+0.432)#332 |
| 61. | South Lockport | 0.51% | 0.50%(+0.007)#61 | 0.081%(+0.431)#334 |
| 62. | Suny Oswego | 0.51% | 0.50%(+0.005)#62 | 0.081%(+0.429)#336 |
| 63. | Glen Cove | 0.51% | 0.50%(+0.004)#63 | 0.081%(+0.428)#340 |
| 64. | Wappingers Falls | 0.50% | 0.50%(-0.002)#64 | 0.081%(+0.421)#345 |
| 65. | New Rochelle | 0.48% | 0.50%(-0.019)#65 | 0.081%(+0.404)#357 |
| 66. | Richfield Springs | 0.48% | 0.50%(-0.020)#66 | 0.081%(+0.403)#359 |
| 67. | Flower Hill | 0.48% | 0.50%(-0.024)#67 | 0.081%(+0.400)#362 |
| 68. | Hurley | 0.47% | 0.50%(-0.030)#68 | 0.081%(+0.394)#366 |
| 69. | New Cassel | 0.47% | 0.50%(-0.035)#69 | 0.081%(+0.389)#370 |
| 70. | East Setauket | 0.46% | 0.50%(-0.045)#70 | 0.081%(+0.379)#376 |
| 71. | Montrose | 0.46% | 0.50%(-0.048)#71 | 0.081%(+0.375)#381 |
| 72. | Nesconset | 0.45% | 0.50%(-0.054)#72 | 0.081%(+0.369)#385 |
| 73. | Wyandanch | 0.45% | 0.50%(-0.056)#73 | 0.081%(+0.368)#387 |
| 74. | Mahopac | 0.44% | 0.50%(-0.060)#74 | 0.081%(+0.364)#390 |
| 75. | Montour Falls | 0.44% | 0.50%(-0.067)#75 | 0.081%(+0.356)#400 |
| 76. | West Hempstead | 0.44% | 0.50%(-0.068)#76 | 0.081%(+0.356)#402 |
| 77. | Theresa | 0.44% | 0.50%(-0.069)#77 | 0.081%(+0.355)#404 |
| 78. | Searingtown | 0.43% | 0.50%(-0.079)#78 | 0.081%(+0.345)#409 |
| 79. | Westbury | 0.42% | 0.50%(-0.080)#79 | 0.081%(+0.344)#412 |
| 80. | Greece | 0.42% | 0.50%(-0.088)#80 | 0.081%(+0.336)#420 |
| 81. | Suffern | 0.40% | 0.50%(-0.100)#81 | 0.081%(+0.324)#432 |
| 82. | Croton On Hudson | 0.39% | 0.50%(-0.116)#82 | 0.081%(+0.308)#449 |
| 83. | South Farmingdale | 0.38% | 0.50%(-0.125)#83 | 0.081%(+0.299)#460 |
| 84. | Tivoli | 0.37% | 0.50%(-0.130)#84 | 0.081%(+0.293)#465 |
| 85. | Ossining | 0.37% | 0.50%(-0.131)#85 | 0.081%(+0.292)#467 |
| 86. | University At Buffalo | 0.37% | 0.50%(-0.133)#86 | 0.081%(+0.291)#470 |
| 87. | Odessa | 0.36% | 0.50%(-0.143)#87 | 0.081%(+0.281)#478 |
| 88. | Amityville | 0.36% | 0.50%(-0.147)#88 | 0.081%(+0.277)#483 |
| 89. | Houghton | 0.34% | 0.50%(-0.166)#89 | 0.081%(+0.258)#502 |
| 90. | Yonkers | 0.34% | 0.50%(-0.166)#90 | 0.081%(+0.258)#504 |
| 91. | Shoreham | 0.34% | 0.50%(-0.166)#91 | 0.081%(+0.258)#505 |
| 92. | Oceanside | 0.33% | 0.50%(-0.171)#92 | 0.081%(+0.253)#513 |
| 93. | Roslyn Heights | 0.33% | 0.50%(-0.172)#93 | 0.081%(+0.252)#516 |
| 94. | Valley Cottage | 0.33% | 0.50%(-0.174)#94 | 0.081%(+0.250)#517 |
| 95. | Cazenovia | 0.33% | 0.50%(-0.179)#95 | 0.081%(+0.245)#525 |
| 96. | Cortland | 0.32% | 0.50%(-0.186)#96 | 0.081%(+0.238)#534 |
| 97. | Roosevelt | 0.31% | 0.50%(-0.198)#97 | 0.081%(+0.226)#555 |
| 98. | Middle Island | 0.30% | 0.50%(-0.206)#98 | 0.081%(+0.217)#571 |
| 99. | Selden | 0.29% | 0.50%(-0.210)#99 | 0.081%(+0.213)#577 |
| 100. | Orchard Park | 0.29% | 0.50%(-0.213)#100 | 0.081%(+0.211)#586 |
Common Questions
What are the Top 10 Cities with the Highest Percentage of West Indian Population in New York?
Top 10 Cities with the Highest Percentage of West Indian Population in New York are:
#1
29.74%
#2
16.26%
#3
3.61%
#4
2.54%
#5
2.42%
#6
2.32%
#7
2.13%
#8
2.11%
#9
1.75%
#10
1.54%
What city has the Highest Percentage of West Indian Population in New York?
Tillson has the Highest Percentage of West Indian Population in New York with 29.74%.
What is the Percentage of West Indian Population in the State of New York?
Percentage of West Indian Population in New York is 0.50%.
What is the Percentage of West Indian Population in the United States?
Percentage of West Indian Population in the United States is 0.081%.