Cazenovia, NY Map & Demographics
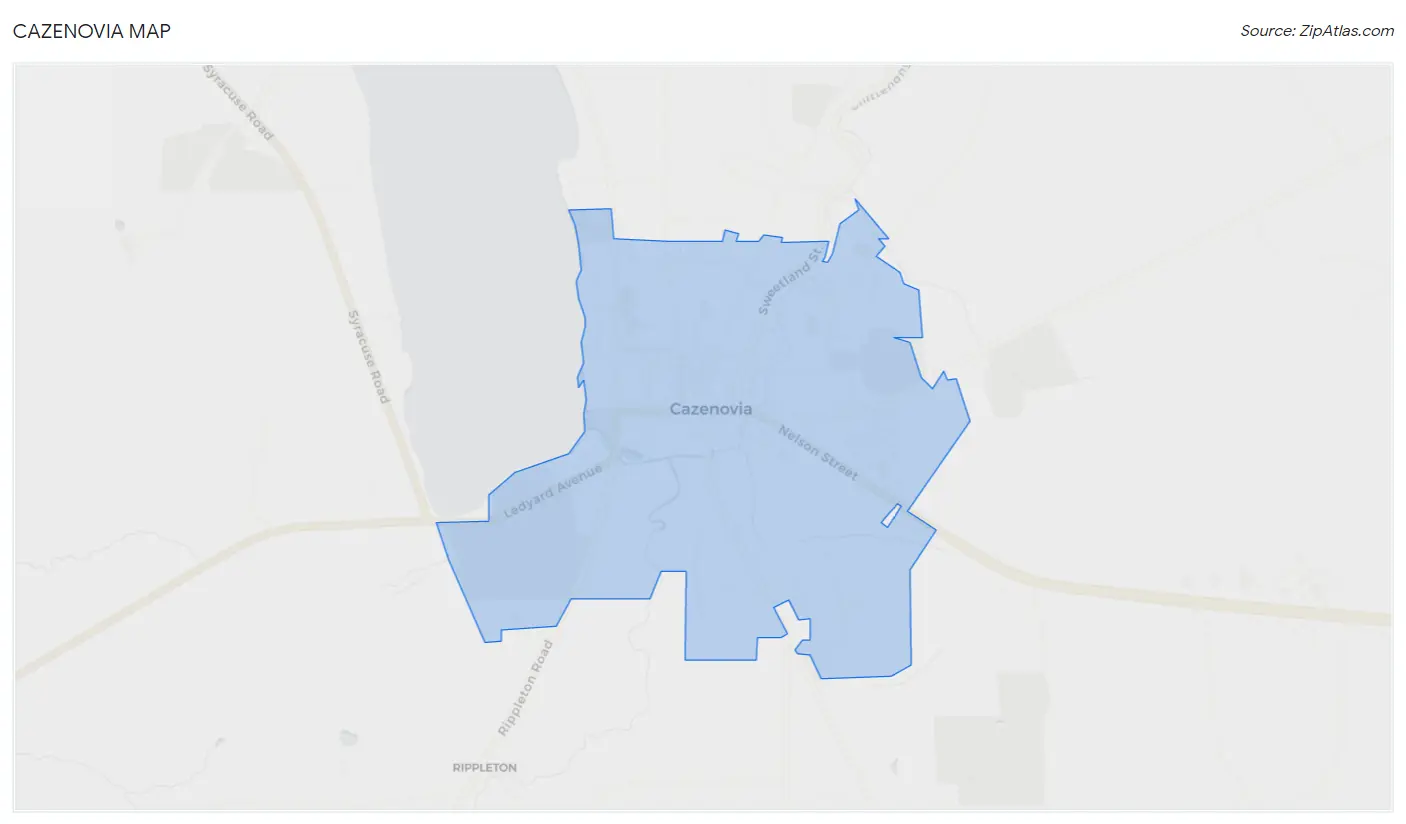
Cazenovia Map
Cazenovia Overview
$28,260
PER CAPITA INCOME
$99,167
AVG FAMILY INCOME
$77,260
AVG HOUSEHOLD INCOME
75.3%
WAGE / INCOME GAP [ % ]
24.7¢/ $1
WAGE / INCOME GAP [ $ ]
0.46
INEQUALITY / GINI INDEX
2,765
TOTAL POPULATION
1,056
MALE POPULATION
1,709
FEMALE POPULATION
61.79
MALES / 100 FEMALES
161.84
FEMALES / 100 MALES
21.1
MEDIAN AGE
3.1
AVG FAMILY SIZE
2.3
AVG HOUSEHOLD SIZE
1,216
LABOR FORCE [ PEOPLE ]
48.4%
PERCENT IN LABOR FORCE
5.6%
UNEMPLOYMENT RATE
Cazenovia Zip Codes
Cazenovia Area Codes
Income in Cazenovia
Income Overview in Cazenovia
Per Capita Income in Cazenovia is $28,260, while median incomes of families and households are $99,167 and $77,260 respectively.
| Characteristic | Number | Measure |
| Per Capita Income | 2,765 | $28,260 |
| Median Family Income | 396 | $99,167 |
| Mean Family Income | 396 | $138,414 |
| Median Household Income | 681 | $77,260 |
| Mean Household Income | 681 | $106,435 |
| Income Deficit | 396 | $0 |
| Wage / Income Gap (%) | 2,765 | 75.30% |
| Wage / Income Gap ($) | 2,765 | 24.70¢ per $1 |
| Gini / Inequality Index | 2,765 | 0.46 |
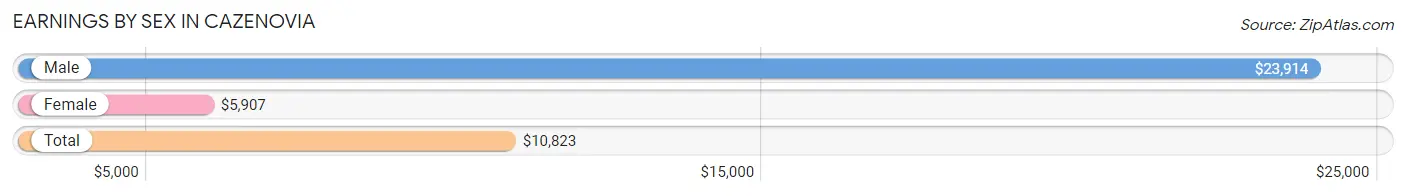
Earnings by Sex in Cazenovia
Average Earnings in Cazenovia are $10,823, $23,914 for men and $5,907 for women, a difference of 75.3%.
| Sex | Number | Average Earnings |
| Male | 615 (37.7%) | $23,914 |
| Female | 1,017 (62.3%) | $5,907 |
| Total | 1,632 (100.0%) | $10,823 |
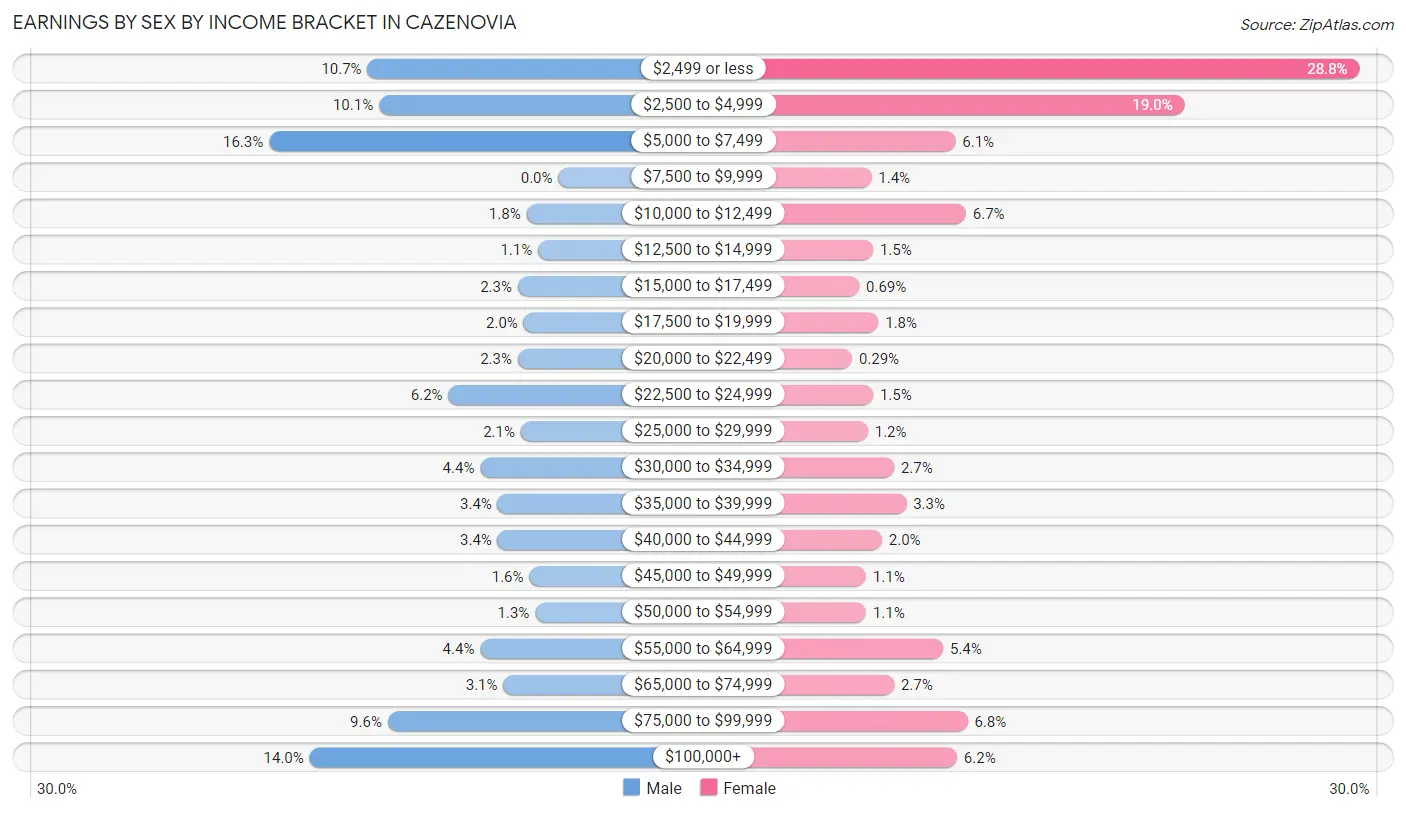
Earnings by Sex by Income Bracket in Cazenovia
The most common earnings brackets in Cazenovia are $5,000 to $7,499 for men (100 | 16.3%) and $2,499 or less for women (293 | 28.8%).
| Income | Male | Female |
| $2,499 or less | 66 (10.7%) | 293 (28.8%) |
| $2,500 to $4,999 | 62 (10.1%) | 193 (19.0%) |
| $5,000 to $7,499 | 100 (16.3%) | 62 (6.1%) |
| $7,500 to $9,999 | 0 (0.0%) | 14 (1.4%) |
| $10,000 to $12,499 | 11 (1.8%) | 68 (6.7%) |
| $12,500 to $14,999 | 7 (1.1%) | 15 (1.5%) |
| $15,000 to $17,499 | 14 (2.3%) | 7 (0.7%) |
| $17,500 to $19,999 | 12 (1.9%) | 18 (1.8%) |
| $20,000 to $22,499 | 14 (2.3%) | 3 (0.3%) |
| $22,500 to $24,999 | 38 (6.2%) | 15 (1.5%) |
| $25,000 to $29,999 | 13 (2.1%) | 12 (1.2%) |
| $30,000 to $34,999 | 27 (4.4%) | 27 (2.6%) |
| $35,000 to $39,999 | 21 (3.4%) | 34 (3.3%) |
| $40,000 to $44,999 | 21 (3.4%) | 20 (2.0%) |
| $45,000 to $49,999 | 10 (1.6%) | 11 (1.1%) |
| $50,000 to $54,999 | 8 (1.3%) | 11 (1.1%) |
| $55,000 to $64,999 | 27 (4.4%) | 55 (5.4%) |
| $65,000 to $74,999 | 19 (3.1%) | 27 (2.6%) |
| $75,000 to $99,999 | 59 (9.6%) | 69 (6.8%) |
| $100,000+ | 86 (14.0%) | 63 (6.2%) |
| Total | 615 (100.0%) | 1,017 (100.0%) |
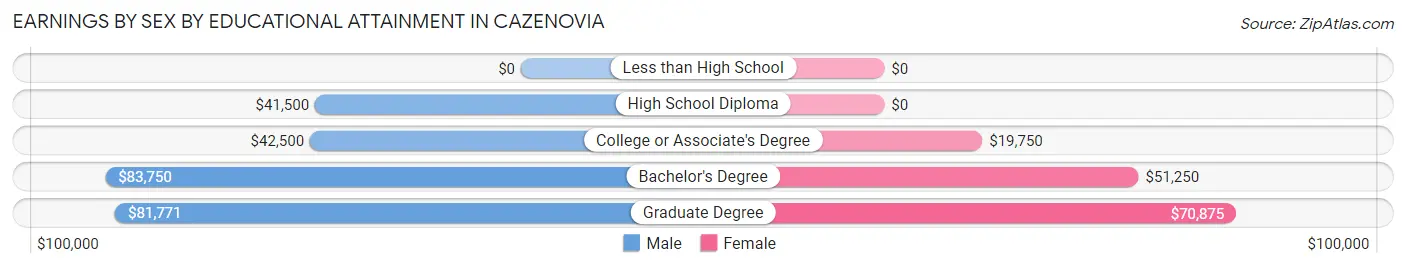
Earnings by Sex by Educational Attainment in Cazenovia
Average earnings in Cazenovia are $62,308 for men and $50,000 for women, a difference of 19.8%. Men with an educational attainment of bachelor's degree enjoy the highest average annual earnings of $83,750, while those with high school diploma education earn the least with $41,500. Women with an educational attainment of graduate degree earn the most with the average annual earnings of $70,875, while those with college or associate's degree education have the smallest earnings of $19,750.
| Educational Attainment | Male Income | Female Income |
| Less than High School | - | - |
| High School Diploma | $41,500 | $0 |
| College or Associate's Degree | $42,500 | $19,750 |
| Bachelor's Degree | $83,750 | $51,250 |
| Graduate Degree | $81,771 | $70,875 |
| Total | $62,308 | $50,000 |
Family Income in Cazenovia
Family Income Brackets in Cazenovia
According to the Cazenovia family income data, there are 86 families falling into the $75,000 to $99,999 income range, which is the most common income bracket and makes up 21.7% of all families.
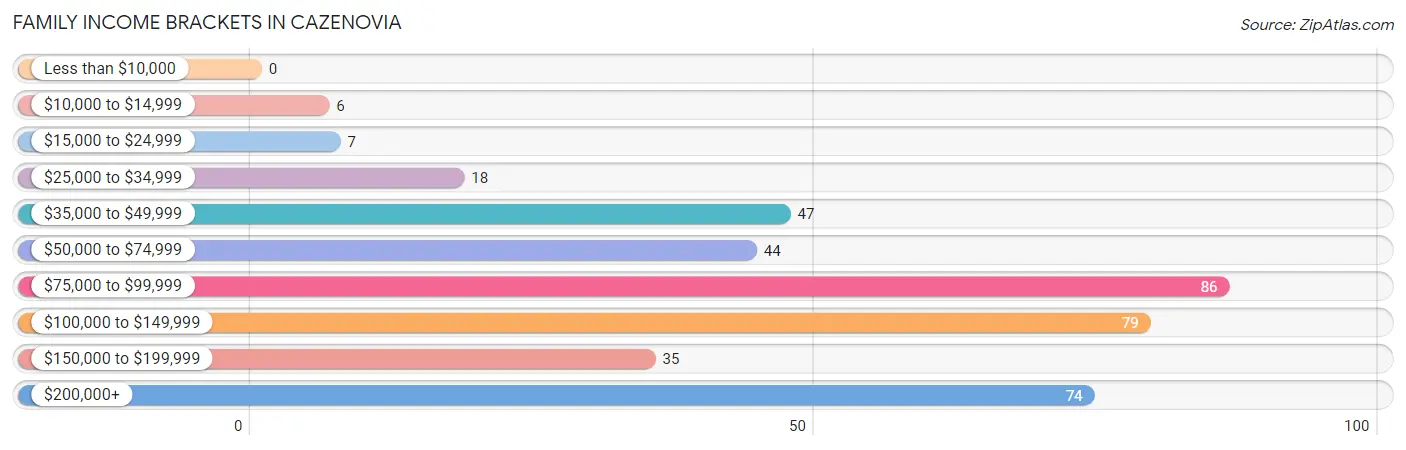
| Income Bracket | # Families | % Families |
| Less than $10,000 | 0 | 0.0% |
| $10,000 to $14,999 | 6 | 1.5% |
| $15,000 to $24,999 | 7 | 1.8% |
| $25,000 to $34,999 | 18 | 4.5% |
| $35,000 to $49,999 | 47 | 11.9% |
| $50,000 to $74,999 | 44 | 11.1% |
| $75,000 to $99,999 | 86 | 21.7% |
| $100,000 to $149,999 | 79 | 19.9% |
| $150,000 to $199,999 | 35 | 8.8% |
| $200,000+ | 74 | 18.7% |
Family Income by Famaliy Size in Cazenovia
4-person families (44 | 11.1%) account for the highest median family income in Cazenovia with $150,000 per family, while 2-person families (182 | 46.0%) have the highest median income of $39,500 per family member.
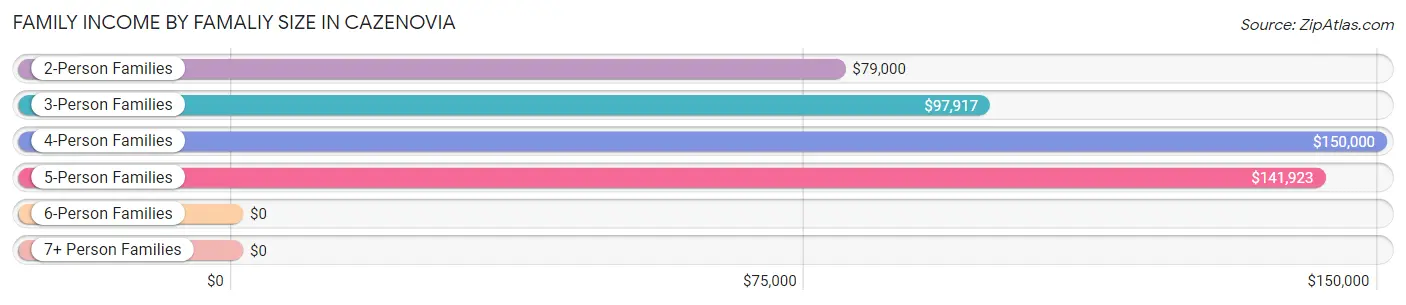
| Income Bracket | # Families | Median Income |
| 2-Person Families | 182 (46.0%) | $79,000 |
| 3-Person Families | 120 (30.3%) | $97,917 |
| 4-Person Families | 44 (11.1%) | $150,000 |
| 5-Person Families | 42 (10.6%) | $141,923 |
| 6-Person Families | 8 (2.0%) | $0 |
| 7+ Person Families | 0 (0.0%) | $0 |
| Total | 396 (100.0%) | $99,167 |
Family Income by Number of Earners in Cazenovia
The median family income in Cazenovia is $99,167, with families comprising 2 earners (161) having the highest median family income of $140,865, while families with no earners (34) have the lowest median family income of $58,750, accounting for 40.7% and 8.6% of families, respectively.
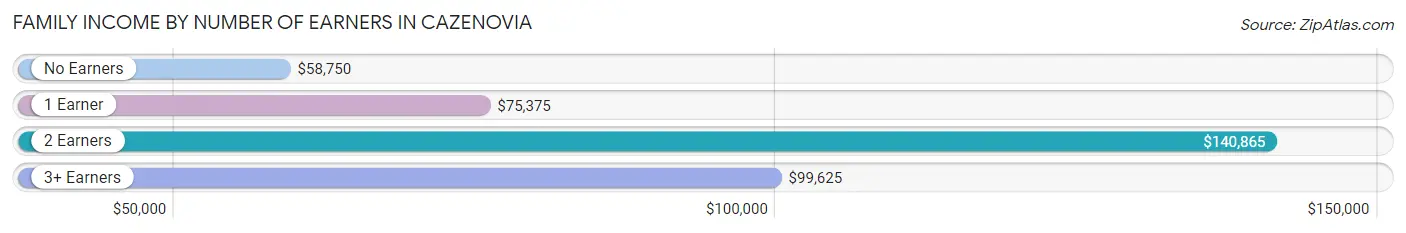
| Number of Earners | # Families | Median Income |
| No Earners | 34 (8.6%) | $58,750 |
| 1 Earner | 132 (33.3%) | $75,375 |
| 2 Earners | 161 (40.7%) | $140,865 |
| 3+ Earners | 69 (17.4%) | $99,625 |
| Total | 396 (100.0%) | $99,167 |
Household Income in Cazenovia
Household Income Brackets in Cazenovia
With 130 households falling in the category, the $100,000 to $149,999 income range is the most frequent in Cazenovia, accounting for 19.1% of all households. In contrast, only 21 households (3.1%) fall into the less than $10,000 income bracket, making it the least populous group.
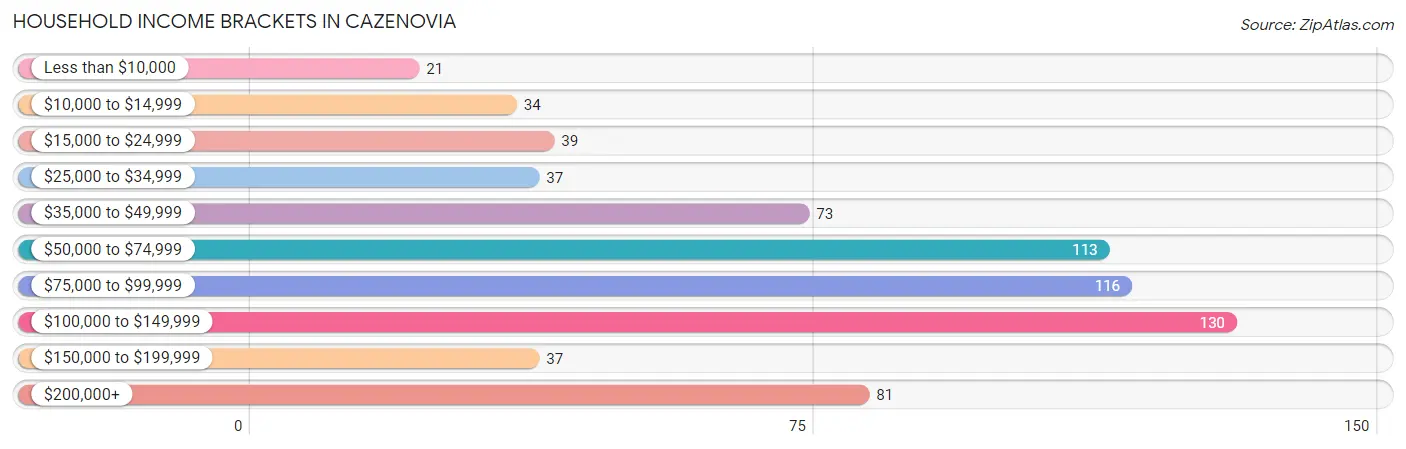
| Income Bracket | # Households | % Households |
| Less than $10,000 | 21 | 3.1% |
| $10,000 to $14,999 | 34 | 5.0% |
| $15,000 to $24,999 | 39 | 5.7% |
| $25,000 to $34,999 | 37 | 5.4% |
| $35,000 to $49,999 | 73 | 10.7% |
| $50,000 to $74,999 | 113 | 16.6% |
| $75,000 to $99,999 | 116 | 17.0% |
| $100,000 to $149,999 | 130 | 19.1% |
| $150,000 to $199,999 | 37 | 5.4% |
| $200,000+ | 81 | 11.9% |
Household Income by Householder Age in Cazenovia
The median household income in Cazenovia is $77,260, with the highest median household income of $99,125 found in the 45 to 64 years age bracket for the primary householder. A total of 249 households (36.6%) fall into this category. Meanwhile, the 15 to 24 years age bracket for the primary householder has the lowest median household income of $0, with 5 households (0.7%) in this group.
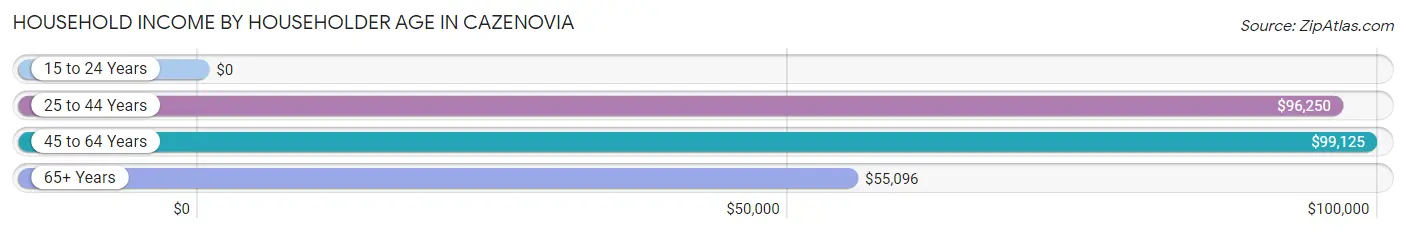
| Income Bracket | # Households | Median Income |
| 15 to 24 Years | 5 (0.7%) | $0 |
| 25 to 44 Years | 198 (29.1%) | $96,250 |
| 45 to 64 Years | 249 (36.6%) | $99,125 |
| 65+ Years | 229 (33.6%) | $55,096 |
| Total | 681 (100.0%) | $77,260 |
Poverty in Cazenovia
Income Below Poverty by Sex and Age in Cazenovia
With 8.1% poverty level for males and 6.0% for females among the residents of Cazenovia, 5 year old males and 55 to 64 year old females are the most vulnerable to poverty, with 3 males (100.0%) and 20 females (15.5%) in their respective age groups living below the poverty level.
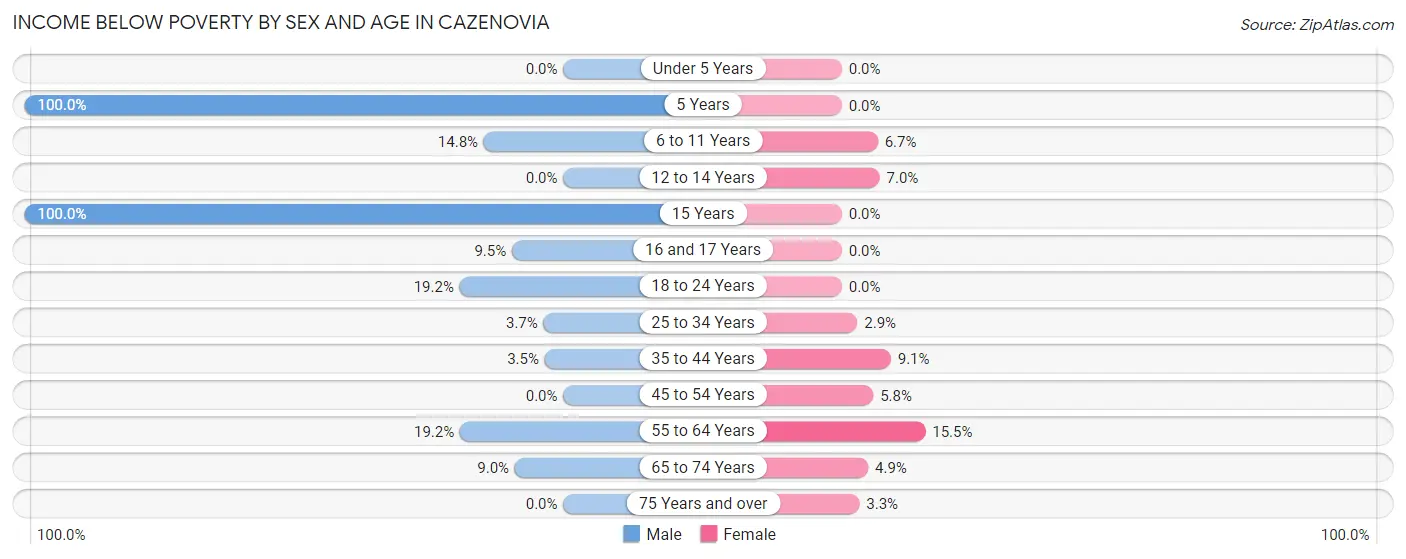
| Age Bracket | Male | Female |
| Under 5 Years | 0 (0.0%) | 0 (0.0%) |
| 5 Years | 3 (100.0%) | 0 (0.0%) |
| 6 to 11 Years | 9 (14.7%) | 4 (6.7%) |
| 12 to 14 Years | 0 (0.0%) | 4 (7.0%) |
| 15 Years | 2 (100.0%) | 0 (0.0%) |
| 16 and 17 Years | 4 (9.5%) | 0 (0.0%) |
| 18 to 24 Years | 5 (19.2%) | 0 (0.0%) |
| 25 to 34 Years | 3 (3.7%) | 3 (2.9%) |
| 35 to 44 Years | 4 (3.5%) | 10 (9.1%) |
| 45 to 54 Years | 0 (0.0%) | 7 (5.8%) |
| 55 to 64 Years | 14 (19.2%) | 20 (15.5%) |
| 65 to 74 Years | 8 (9.0%) | 4 (4.9%) |
| 75 Years and over | 0 (0.0%) | 3 (3.3%) |
| Total | 52 (8.1%) | 55 (6.0%) |
Income Above Poverty by Sex and Age in Cazenovia
According to the poverty statistics in Cazenovia, males aged under 5 years and females aged under 5 years are the age groups that are most secure financially, with 100.0% of males and 100.0% of females in these age groups living above the poverty line.
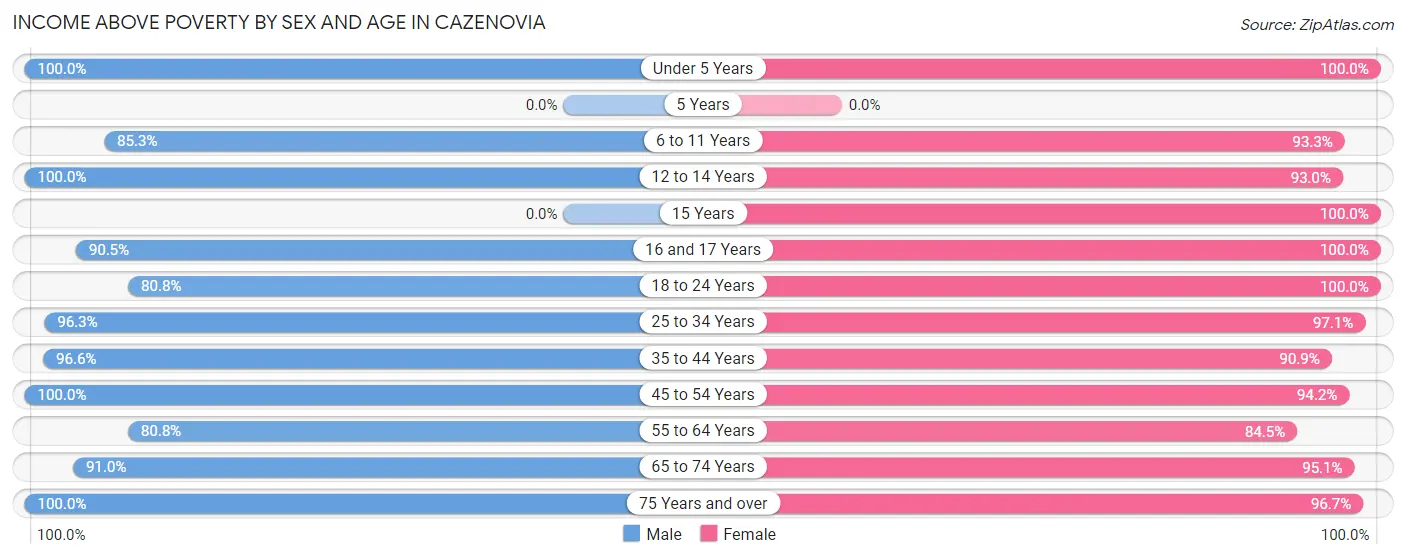
| Age Bracket | Male | Female |
| Under 5 Years | 4 (100.0%) | 40 (100.0%) |
| 5 Years | 0 (0.0%) | 0 (0.0%) |
| 6 to 11 Years | 52 (85.3%) | 56 (93.3%) |
| 12 to 14 Years | 17 (100.0%) | 53 (93.0%) |
| 15 Years | 0 (0.0%) | 9 (100.0%) |
| 16 and 17 Years | 38 (90.5%) | 53 (100.0%) |
| 18 to 24 Years | 21 (80.8%) | 62 (100.0%) |
| 25 to 34 Years | 79 (96.3%) | 101 (97.1%) |
| 35 to 44 Years | 112 (96.6%) | 100 (90.9%) |
| 45 to 54 Years | 81 (100.0%) | 113 (94.2%) |
| 55 to 64 Years | 59 (80.8%) | 109 (84.5%) |
| 65 to 74 Years | 81 (91.0%) | 78 (95.1%) |
| 75 Years and over | 47 (100.0%) | 89 (96.7%) |
| Total | 591 (91.9%) | 863 (94.0%) |
Income Below Poverty Among Married-Couple Families in Cazenovia
The poverty statistics for married-couple families in Cazenovia show that 1.1% or 3 of the total 273 families live below the poverty line. Families with 3 or 4 children have the highest poverty rate of 6.7%, comprising of 3 families. On the other hand, families with no children have the lowest poverty rate of 0.0%, which includes 0 families.
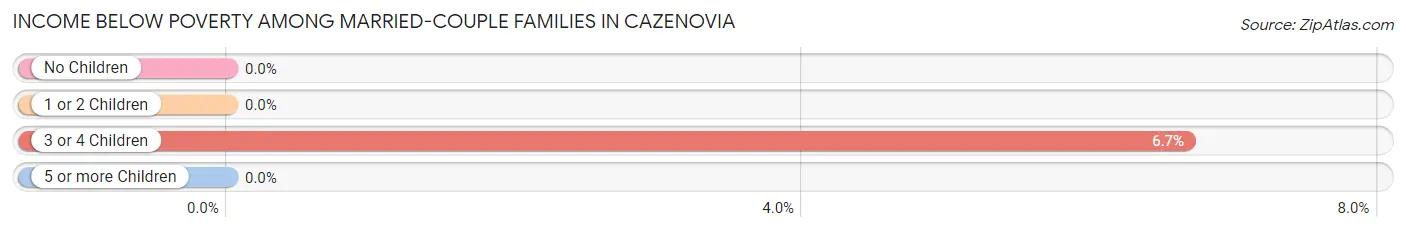
| Children | Above Poverty | Below Poverty |
| No Children | 137 (100.0%) | 0 (0.0%) |
| 1 or 2 Children | 91 (100.0%) | 0 (0.0%) |
| 3 or 4 Children | 42 (93.3%) | 3 (6.7%) |
| 5 or more Children | 0 (0.0%) | 0 (0.0%) |
| Total | 270 (98.9%) | 3 (1.1%) |
Income Below Poverty Among Single-Parent Households in Cazenovia
| Children | Single Father | Single Mother |
| No Children | 0 (0.0%) | 0 (0.0%) |
| 1 or 2 Children | 0 (0.0%) | 6 (9.2%) |
| 3 or 4 Children | 0 (0.0%) | 0 (0.0%) |
| 5 or more Children | 0 (0.0%) | 0 (0.0%) |
| Total | 0 (0.0%) | 6 (6.1%) |
Income Below Poverty Among Married-Couple vs Single-Parent Households in Cazenovia
The poverty data for Cazenovia shows that 3 of the married-couple family households (1.1%) and 6 of the single-parent households (4.9%) are living below the poverty level. Within the married-couple family households, those with 3 or 4 children have the highest poverty rate, with 3 households (6.7%) falling below the poverty line. Among the single-parent households, those with 1 or 2 children have the highest poverty rate, with 6 household (8.6%) living below poverty.
| Children | Married-Couple Families | Single-Parent Households |
| No Children | 0 (0.0%) | 0 (0.0%) |
| 1 or 2 Children | 0 (0.0%) | 6 (8.6%) |
| 3 or 4 Children | 3 (6.7%) | 0 (0.0%) |
| 5 or more Children | 0 (0.0%) | 0 (0.0%) |
| Total | 3 (1.1%) | 6 (4.9%) |
Race in Cazenovia
The most populous races in Cazenovia are White / Caucasian (2,381 | 86.1%), Hispanic or Latino (189 | 6.8%), and Black / African American (168 | 6.1%).
| Race | # Population | % Population |
| Asian | 78 | 2.8% |
| Black / African American | 168 | 6.1% |
| Hawaiian / Pacific | 0 | 0.0% |
| Hispanic or Latino | 189 | 6.8% |
| Native / Alaskan | 2 | 0.1% |
| White / Caucasian | 2,381 | 86.1% |
| Two or more Races | 119 | 4.3% |
| Some other Race | 17 | 0.6% |
| Total | 2,765 | 100.0% |
Ancestry in Cazenovia
The most populous ancestries reported in Cazenovia are Irish (715 | 25.9%), English (338 | 12.2%), American (337 | 12.2%), German (333 | 12.0%), and Italian (290 | 10.5%), together accounting for 72.8% of all Cazenovia residents.
| Ancestry | # Population | % Population |
| American | 337 | 12.2% |
| Arab | 57 | 2.1% |
| Australian | 7 | 0.3% |
| Austrian | 4 | 0.1% |
| Bhutanese | 1 | 0.0% |
| British | 5 | 0.2% |
| Burmese | 2 | 0.1% |
| Canadian | 28 | 1.0% |
| Central American | 3 | 0.1% |
| Croatian | 3 | 0.1% |
| Cuban | 10 | 0.4% |
| Czech | 19 | 0.7% |
| Danish | 14 | 0.5% |
| Dutch | 36 | 1.3% |
| Eastern European | 4 | 0.1% |
| Ecuadorian | 7 | 0.3% |
| English | 338 | 12.2% |
| European | 45 | 1.6% |
| Finnish | 6 | 0.2% |
| French | 76 | 2.8% |
| French Canadian | 32 | 1.2% |
| German | 333 | 12.0% |
| Greek | 5 | 0.2% |
| Guatemalan | 3 | 0.1% |
| Hungarian | 15 | 0.5% |
| Indian (Asian) | 56 | 2.0% |
| Irish | 715 | 25.9% |
| Iroquois | 8 | 0.3% |
| Israeli | 5 | 0.2% |
| Italian | 290 | 10.5% |
| Jamaican | 28 | 1.0% |
| Laotian | 7 | 0.3% |
| Lebanese | 8 | 0.3% |
| Lithuanian | 3 | 0.1% |
| Macedonian | 6 | 0.2% |
| Mexican | 36 | 1.3% |
| Norwegian | 23 | 0.8% |
| Pakistani | 10 | 0.4% |
| Peruvian | 15 | 0.5% |
| Polish | 133 | 4.8% |
| Portuguese | 4 | 0.1% |
| Puerto Rican | 61 | 2.2% |
| Russian | 24 | 0.9% |
| Scotch-Irish | 4 | 0.1% |
| Scottish | 40 | 1.5% |
| Slovene | 8 | 0.3% |
| South American | 31 | 1.1% |
| Spaniard | 12 | 0.4% |
| Subsaharan African | 3 | 0.1% |
| Swedish | 32 | 1.2% |
| Swiss | 9 | 0.3% |
| Syrian | 9 | 0.3% |
| Thai | 16 | 0.6% |
| Turkish | 6 | 0.2% |
| Ukrainian | 21 | 0.8% |
| Venezuelan | 3 | 0.1% |
| Welsh | 13 | 0.5% |
| West Indian | 9 | 0.3% | View All 58 Rows |
Immigrants in Cazenovia
The most numerous immigrant groups reported in Cazenovia came from Asia (93 | 3.4%), Latin America (53 | 1.9%), Western Asia (52 | 1.9%), Europe (40 | 1.5%), and Iraq (40 | 1.5%), together accounting for 10.1% of all Cazenovia residents.
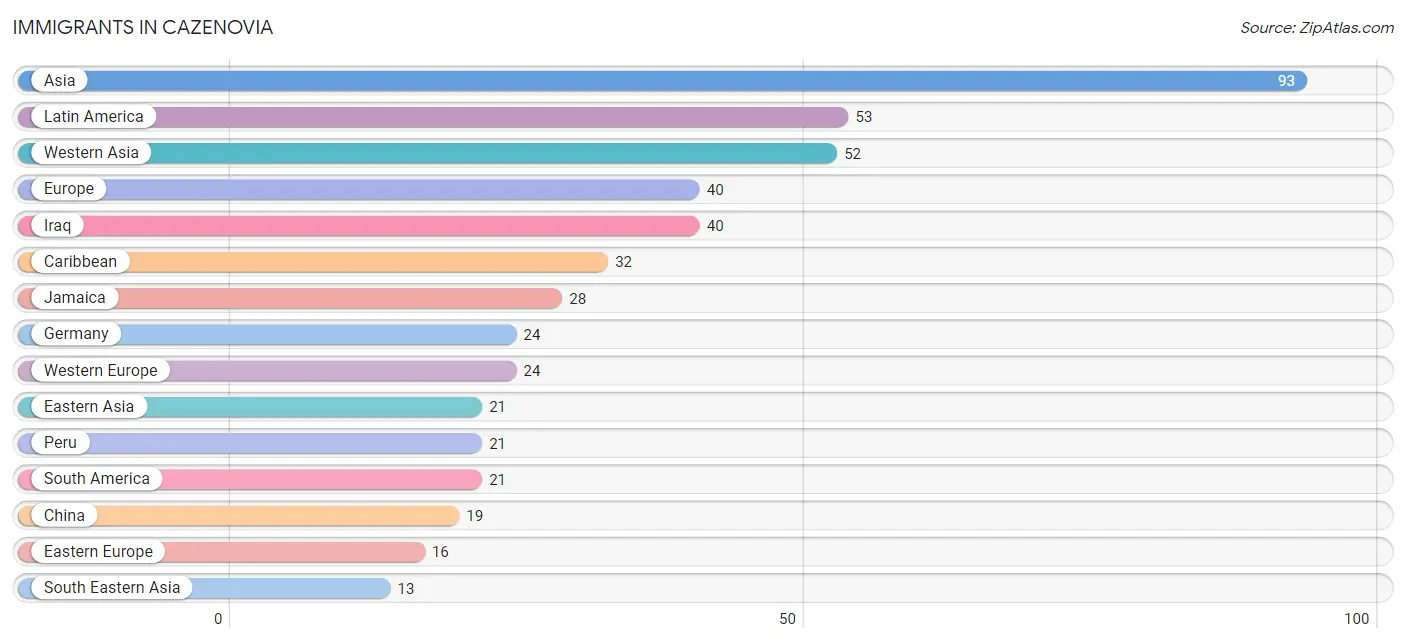
| Immigration Origin | # Population | % Population |
| Africa | 3 | 0.1% |
| Asia | 93 | 3.4% |
| Cameroon | 3 | 0.1% |
| Canada | 10 | 0.4% |
| Caribbean | 32 | 1.2% |
| China | 19 | 0.7% |
| Cuba | 4 | 0.1% |
| Czechoslovakia | 9 | 0.3% |
| Eastern Asia | 21 | 0.8% |
| Eastern Europe | 16 | 0.6% |
| Europe | 40 | 1.5% |
| Germany | 24 | 0.9% |
| India | 3 | 0.1% |
| Indonesia | 3 | 0.1% |
| Iraq | 40 | 1.5% |
| Israel | 5 | 0.2% |
| Jamaica | 28 | 1.0% |
| Korea | 2 | 0.1% |
| Latin America | 53 | 1.9% |
| Middle Africa | 3 | 0.1% |
| Pakistan | 4 | 0.1% |
| Peru | 21 | 0.8% |
| Russia | 7 | 0.3% |
| South America | 21 | 0.8% |
| South Central Asia | 7 | 0.3% |
| South Eastern Asia | 13 | 0.5% |
| Thailand | 10 | 0.4% |
| Turkey | 7 | 0.3% |
| Western Asia | 52 | 1.9% |
| Western Europe | 24 | 0.9% | View All 30 Rows |
Sex and Age in Cazenovia
Sex and Age in Cazenovia
The most populous age groups in Cazenovia are 15 to 19 Years (277 | 26.2%) for men and 15 to 19 Years (513 | 30.0%) for women.
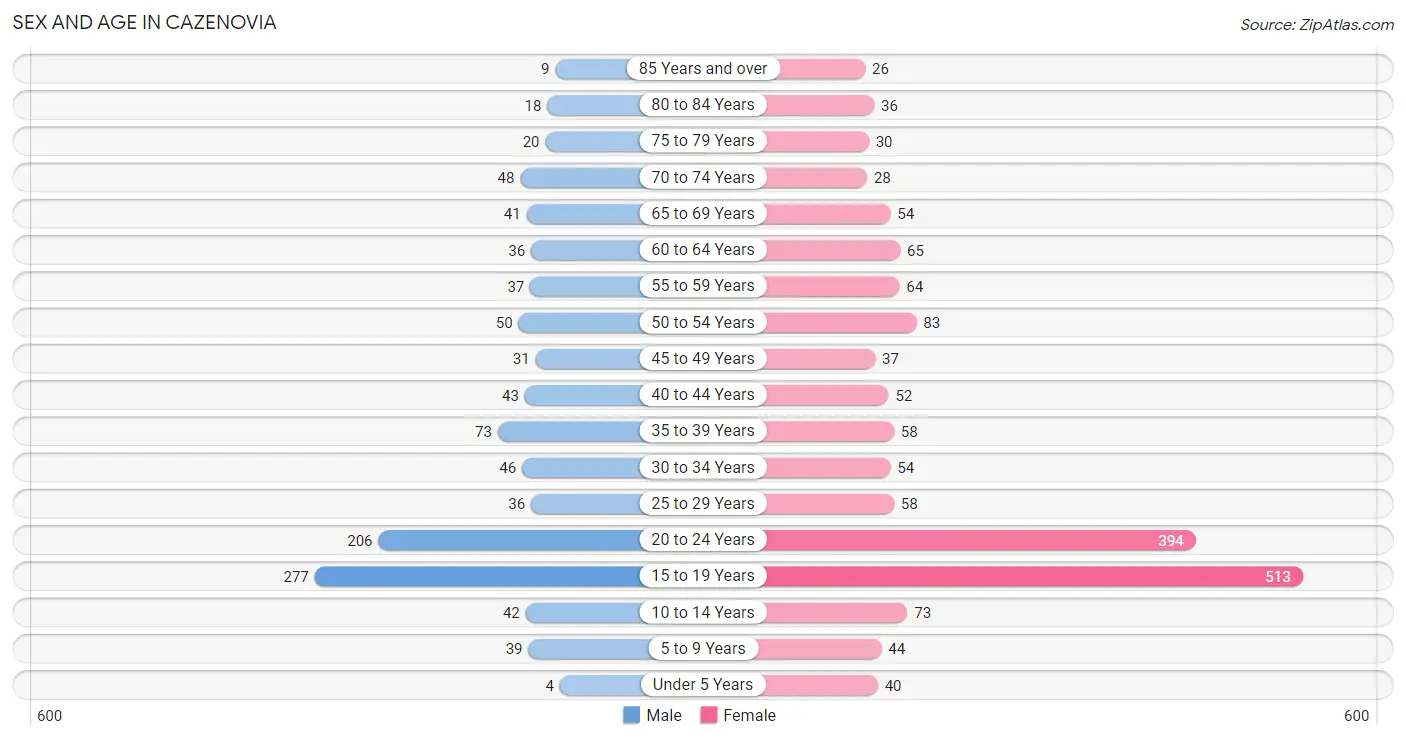
| Age Bracket | Male | Female |
| Under 5 Years | 4 (0.4%) | 40 (2.3%) |
| 5 to 9 Years | 39 (3.7%) | 44 (2.6%) |
| 10 to 14 Years | 42 (4.0%) | 73 (4.3%) |
| 15 to 19 Years | 277 (26.2%) | 513 (30.0%) |
| 20 to 24 Years | 206 (19.5%) | 394 (23.1%) |
| 25 to 29 Years | 36 (3.4%) | 58 (3.4%) |
| 30 to 34 Years | 46 (4.4%) | 54 (3.2%) |
| 35 to 39 Years | 73 (6.9%) | 58 (3.4%) |
| 40 to 44 Years | 43 (4.1%) | 52 (3.0%) |
| 45 to 49 Years | 31 (2.9%) | 37 (2.2%) |
| 50 to 54 Years | 50 (4.7%) | 83 (4.9%) |
| 55 to 59 Years | 37 (3.5%) | 64 (3.7%) |
| 60 to 64 Years | 36 (3.4%) | 65 (3.8%) |
| 65 to 69 Years | 41 (3.9%) | 54 (3.2%) |
| 70 to 74 Years | 48 (4.5%) | 28 (1.6%) |
| 75 to 79 Years | 20 (1.9%) | 30 (1.8%) |
| 80 to 84 Years | 18 (1.7%) | 36 (2.1%) |
| 85 Years and over | 9 (0.9%) | 26 (1.5%) |
| Total | 1,056 (100.0%) | 1,709 (100.0%) |
Families and Households in Cazenovia
Median Family Size in Cazenovia
The median family size in Cazenovia is 3.06 persons per family, with married-couple families (273 | 68.9%) accounting for the largest median family size of 3.37 persons per family. On the other hand, single female/mother families (99 | 25.0%) represent the smallest median family size with 2.31 persons per family.
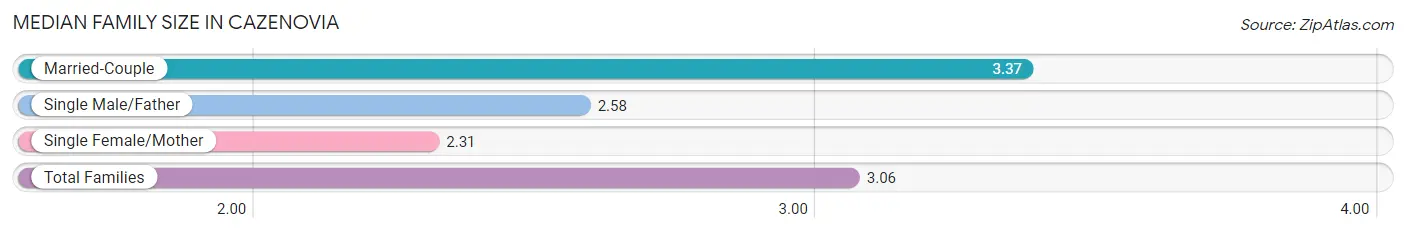
| Family Type | # Families | Family Size |
| Married-Couple | 273 (68.9%) | 3.37 |
| Single Male/Father | 24 (6.1%) | 2.58 |
| Single Female/Mother | 99 (25.0%) | 2.31 |
| Total Families | 396 (100.0%) | 3.06 |
Median Household Size in Cazenovia
The median household size in Cazenovia is 2.29 persons per household, with married-couple households (273 | 40.1%) accounting for the largest median household size of 3.41 persons per household. non-family households (285 | 41.8%) represent the smallest median household size with 1.16 persons per household.
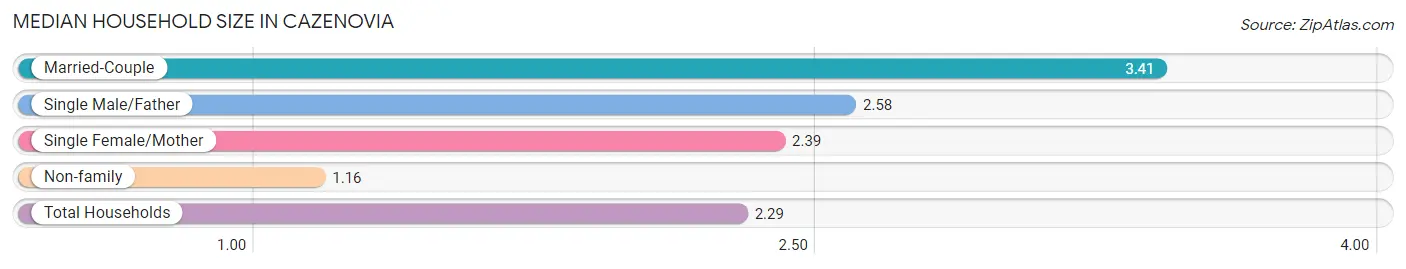
| Household Type | # Households | Household Size |
| Married-Couple | 273 (40.1%) | 3.41 |
| Single Male/Father | 24 (3.5%) | 2.58 |
| Single Female/Mother | 99 (14.5%) | 2.39 |
| Non-family | 285 (41.8%) | 1.16 |
| Total Households | 681 (100.0%) | 2.29 |
Household Size by Marriage Status in Cazenovia
Out of a total of 681 households in Cazenovia, 396 (58.2%) are family households, while 285 (41.8%) are nonfamily households. The most numerous type of family households are 2-person households, comprising 175, and the most common type of nonfamily households are 1-person households, comprising 241.
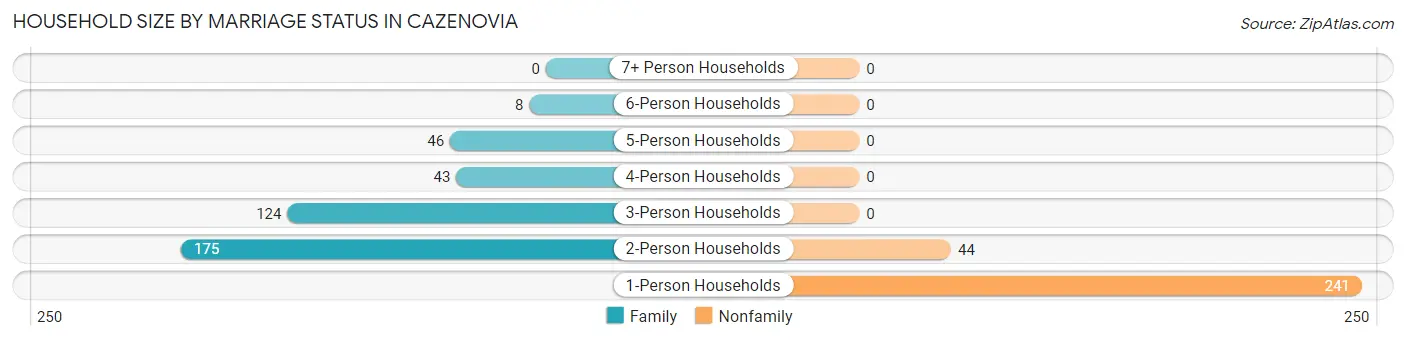
| Household Size | Family Households | Nonfamily Households |
| 1-Person Households | - | 241 (35.4%) |
| 2-Person Households | 175 (25.7%) | 44 (6.5%) |
| 3-Person Households | 124 (18.2%) | 0 (0.0%) |
| 4-Person Households | 43 (6.3%) | 0 (0.0%) |
| 5-Person Households | 46 (6.8%) | 0 (0.0%) |
| 6-Person Households | 8 (1.2%) | 0 (0.0%) |
| 7+ Person Households | 0 (0.0%) | 0 (0.0%) |
| Total | 396 (58.2%) | 285 (41.8%) |
Female Fertility in Cazenovia
Fertility by Age in Cazenovia
Average fertility rate in Cazenovia is 9.0 births per 1,000 women. Women in the age bracket of 20 to 34 years have the highest fertility rate with 22.0 births per 1,000 women. Women in the age bracket of 20 to 34 years acount for 100.0% of all women with births.
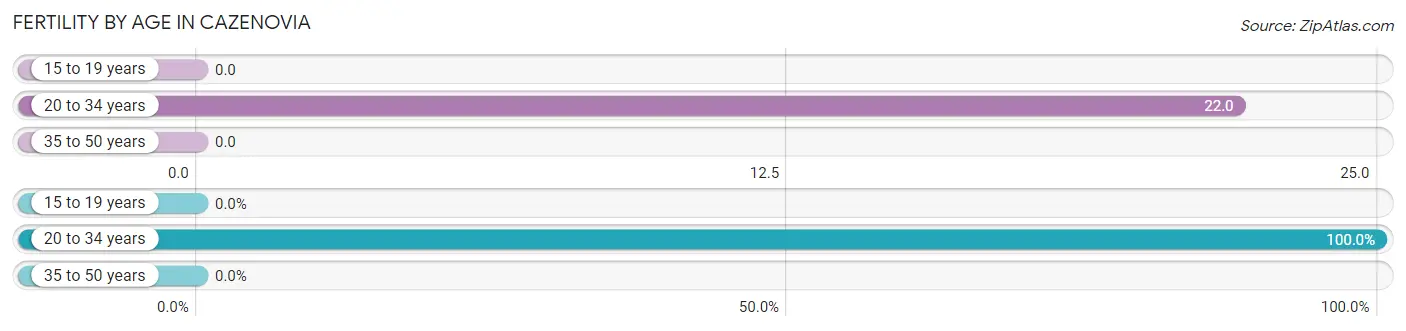
| Age Bracket | Women with Births | Births / 1,000 Women |
| 15 to 19 years | 0 (0.0%) | 0.0 |
| 20 to 34 years | 11 (100.0%) | 22.0 |
| 35 to 50 years | 0 (0.0%) | 0.0 |
| Total | 11 (100.0%) | 9.0 |
Fertility by Age by Marriage Status in Cazenovia
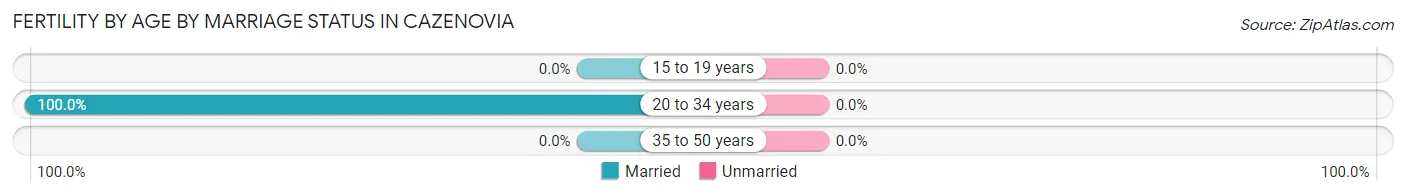
| Age Bracket | Married | Unmarried |
| 15 to 19 years | 0 (0.0%) | 0 (0.0%) |
| 20 to 34 years | 11 (100.0%) | 0 (0.0%) |
| 35 to 50 years | 0 (0.0%) | 0 (0.0%) |
| Total | 11 (100.0%) | 0 (0.0%) |
Fertility by Education in Cazenovia
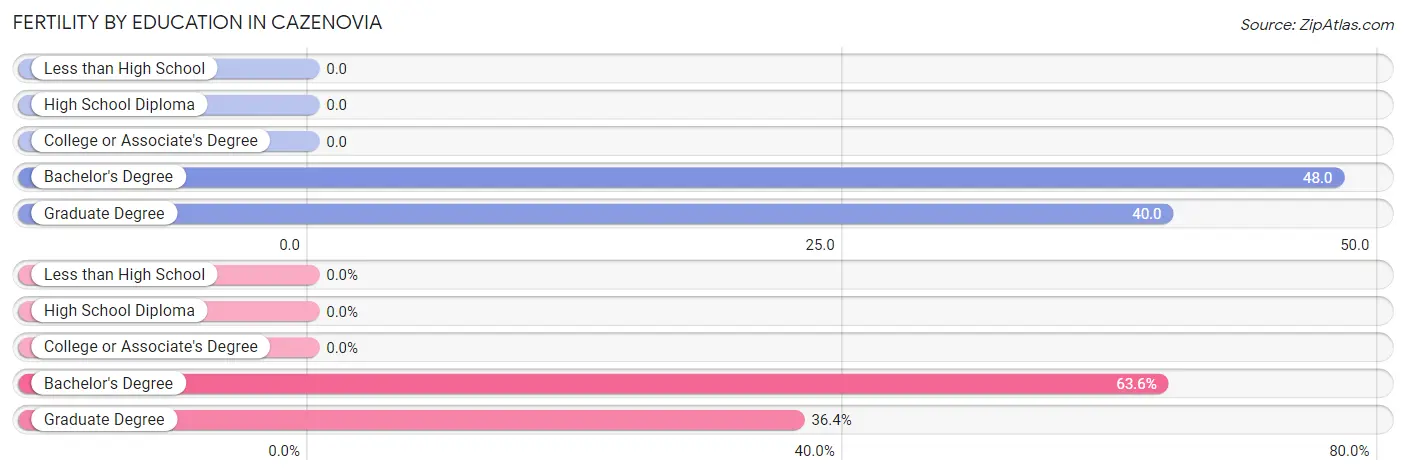
| Educational Attainment | Women with Births | Births / 1,000 Women |
| Less than High School | 0 (0.0%) | 0.0 |
| High School Diploma | 0 (0.0%) | 0.0 |
| College or Associate's Degree | 0 (0.0%) | 0.0 |
| Bachelor's Degree | 7 (63.6%) | 48.0 |
| Graduate Degree | 4 (36.4%) | 40.0 |
| Total | 11 (100.0%) | 9.0 |
Fertility by Education by Marriage Status in Cazenovia
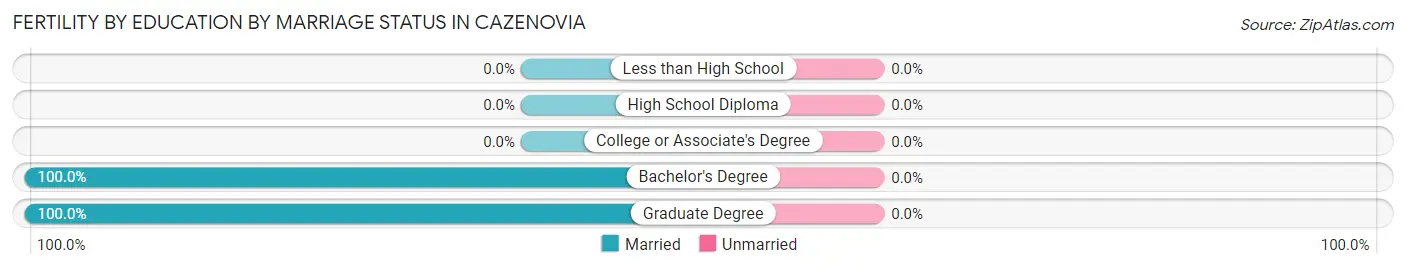
| Educational Attainment | Married | Unmarried |
| Less than High School | 0 (0.0%) | 0 (0.0%) |
| High School Diploma | 0 (0.0%) | 0 (0.0%) |
| College or Associate's Degree | 0 (0.0%) | 0 (0.0%) |
| Bachelor's Degree | 7 (100.0%) | 0 (0.0%) |
| Graduate Degree | 4 (100.0%) | 0 (0.0%) |
| Total | 11 (100.0%) | 0 (0.0%) |
Employment Characteristics in Cazenovia
Employment by Class of Employer in Cazenovia
Among the 1,070 employed individuals in Cazenovia, private company employees (567 | 53.0%), not-for-profit organizations (170 | 15.9%), and state government employees (116 | 10.8%) make up the most common classes of employment.
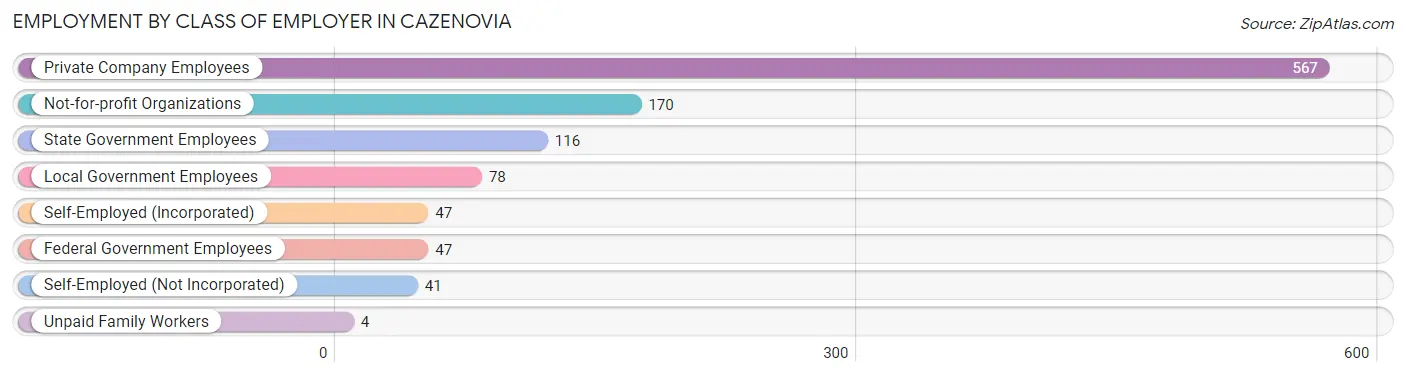
| Employer Class | # Employees | % Employees |
| Private Company Employees | 567 | 53.0% |
| Self-Employed (Incorporated) | 47 | 4.4% |
| Self-Employed (Not Incorporated) | 41 | 3.8% |
| Not-for-profit Organizations | 170 | 15.9% |
| Local Government Employees | 78 | 7.3% |
| State Government Employees | 116 | 10.8% |
| Federal Government Employees | 47 | 4.4% |
| Unpaid Family Workers | 4 | 0.4% |
| Total | 1,070 | 100.0% |
Employment Status by Age in Cazenovia
According to the labor force statistics for Cazenovia, out of the total population over 16 years of age (2,512), 48.4% or 1,216 individuals are in the labor force, with 5.6% or 68 of them unemployed. The age group with the highest labor force participation rate is 30 to 34 years, with 97.0% or 97 individuals in the labor force. Within the labor force, the 45 to 54 years age range has the highest percentage of unemployed individuals, with 20.0% or 37 of them being unemployed.
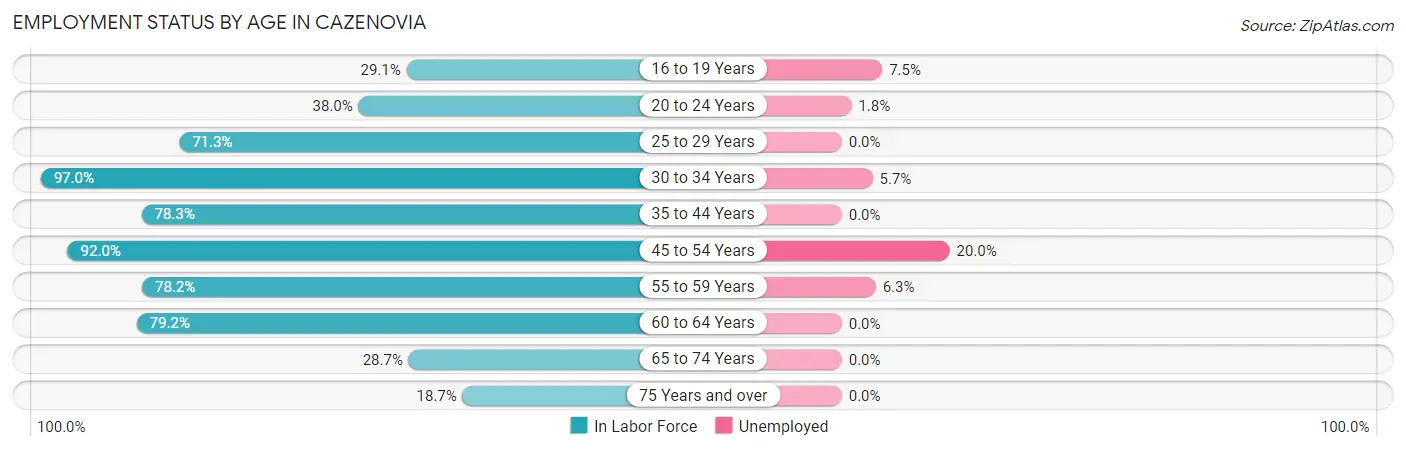
| Age Bracket | In Labor Force | Unemployed |
| 16 to 19 Years | 227 (29.1%) | 17 (7.5%) |
| 20 to 24 Years | 228 (38.0%) | 4 (1.8%) |
| 25 to 29 Years | 67 (71.3%) | 0 (0.0%) |
| 30 to 34 Years | 97 (97.0%) | 6 (5.7%) |
| 35 to 44 Years | 177 (78.3%) | 0 (0.0%) |
| 45 to 54 Years | 185 (92.0%) | 37 (20.0%) |
| 55 to 59 Years | 79 (78.2%) | 5 (6.3%) |
| 60 to 64 Years | 80 (79.2%) | 0 (0.0%) |
| 65 to 74 Years | 49 (28.7%) | 0 (0.0%) |
| 75 Years and over | 26 (18.7%) | 0 (0.0%) |
| Total | 1,216 (48.4%) | 68 (5.6%) |
Employment Status by Educational Attainment in Cazenovia
According to labor force statistics for Cazenovia, 83.2% of individuals (685) out of the total population between 25 and 64 years of age (823) are in the labor force, with 7.0% or 48 of them being unemployed. The group with the highest labor force participation rate are those with the educational attainment of bachelor's degree or higher, with 88.3% or 461 individuals in the labor force. Within the labor force, individuals with bachelor's degree or higher education have the highest percentage of unemployment, with 8.8% or 41 of them being unemployed.
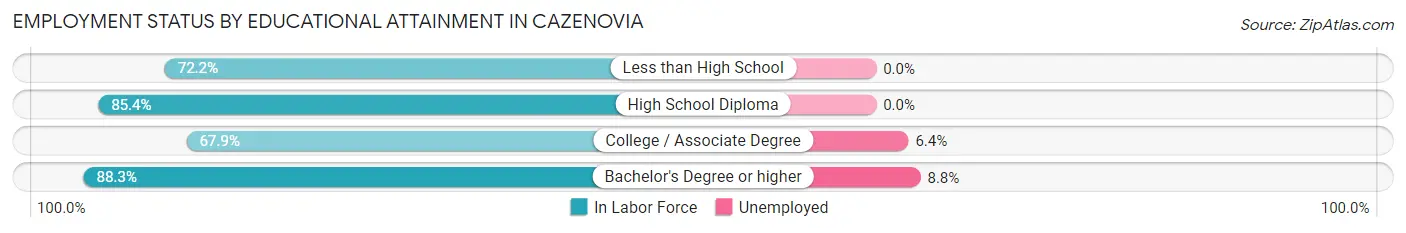
| Educational Attainment | In Labor Force | Unemployed |
| Less than High School | 26 (72.2%) | 0 (0.0%) |
| High School Diploma | 88 (85.4%) | 0 (0.0%) |
| College / Associate Degree | 110 (67.9%) | 10 (6.4%) |
| Bachelor's Degree or higher | 461 (88.3%) | 46 (8.8%) |
| Total | 685 (83.2%) | 58 (7.0%) |
Employment Occupations by Sex in Cazenovia
Management, Business, Science and Arts Occupations
The most common Management, Business, Science and Arts occupations in Cazenovia are Community & Social Service (200 | 17.6%), Management (154 | 13.5%), Education Instruction & Library (149 | 13.1%), Health Diagnosing & Treating (59 | 5.2%), and Health Technologists (59 | 5.2%).
Management, Business, Science and Arts Occupations by Sex
Within the Management, Business, Science and Arts occupations in Cazenovia, the most male-oriented occupations are Computers & Mathematics (100.0%), Legal Services & Support (86.7%), and Business & Financial (57.1%), while the most female-oriented occupations are Architecture & Engineering (87.5%), Arts, Media & Entertainment (83.3%), and Health Diagnosing & Treating (79.7%).
| Occupation | Male | Female |
| Management | 69 (44.8%) | 85 (55.2%) |
| Business & Financial | 24 (57.1%) | 18 (42.9%) |
| Computers, Engineering & Science | 19 (50.0%) | 19 (50.0%) |
| Computers & Mathematics | 12 (100.0%) | 0 (0.0%) |
| Architecture & Engineering | 1 (12.5%) | 7 (87.5%) |
| Life, Physical & Social Science | 6 (33.3%) | 12 (66.7%) |
| Community & Social Service | 74 (37.0%) | 126 (63.0%) |
| Education, Arts & Media | 8 (44.4%) | 10 (55.6%) |
| Legal Services & Support | 13 (86.7%) | 2 (13.3%) |
| Education Instruction & Library | 50 (33.6%) | 99 (66.4%) |
| Arts, Media & Entertainment | 3 (16.7%) | 15 (83.3%) |
| Health Diagnosing & Treating | 12 (20.3%) | 47 (79.7%) |
| Health Technologists | 12 (20.3%) | 47 (79.7%) |
| Total (Category) | 198 (40.2%) | 295 (59.8%) |
| Total (Overall) | 422 (37.1%) | 716 (62.9%) |
Services Occupations
The most common Services occupations in Cazenovia are Food Preparation & Serving (153 | 13.4%), Cleaning & Maintenance (35 | 3.1%), Healthcare Support (34 | 3.0%), Security & Protection (31 | 2.7%), and Firefighting & Prevention (31 | 2.7%).
Services Occupations by Sex
Within the Services occupations in Cazenovia, the most male-oriented occupations are Cleaning & Maintenance (57.1%), Personal Care & Service (38.1%), and Food Preparation & Serving (30.7%), while the most female-oriented occupations are Healthcare Support (100.0%), Security & Protection (100.0%), and Firefighting & Prevention (100.0%).
| Occupation | Male | Female |
| Healthcare Support | 0 (0.0%) | 34 (100.0%) |
| Security & Protection | 0 (0.0%) | 31 (100.0%) |
| Firefighting & Prevention | 0 (0.0%) | 31 (100.0%) |
| Law Enforcement | 0 (0.0%) | 0 (0.0%) |
| Food Preparation & Serving | 47 (30.7%) | 106 (69.3%) |
| Cleaning & Maintenance | 20 (57.1%) | 15 (42.9%) |
| Personal Care & Service | 8 (38.1%) | 13 (61.9%) |
| Total (Category) | 75 (27.4%) | 199 (72.6%) |
| Total (Overall) | 422 (37.1%) | 716 (62.9%) |
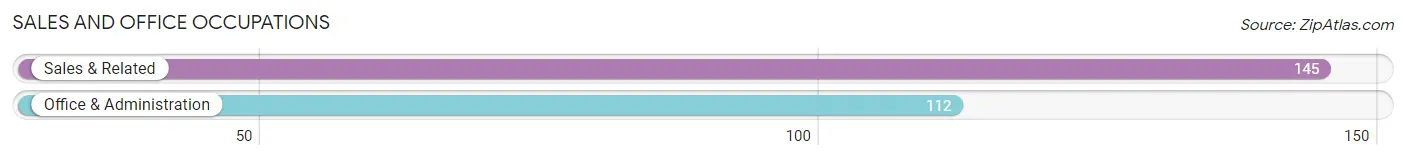
Sales and Office Occupations
The most common Sales and Office occupations in Cazenovia are Sales & Related (145 | 12.7%), and Office & Administration (112 | 9.8%).
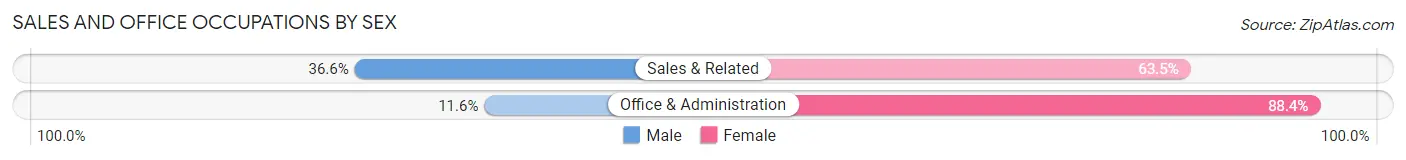
Sales and Office Occupations by Sex
| Occupation | Male | Female |
| Sales & Related | 53 (36.5%) | 92 (63.4%) |
| Office & Administration | 13 (11.6%) | 99 (88.4%) |
| Total (Category) | 66 (25.7%) | 191 (74.3%) |
| Total (Overall) | 422 (37.1%) | 716 (62.9%) |
Natural Resources, Construction and Maintenance Occupations
The most common Natural Resources, Construction and Maintenance occupations in Cazenovia are Construction & Extraction (26 | 2.3%), Installation, Maintenance & Repair (15 | 1.3%), and Farming, Fishing & Forestry (10 | 0.9%).

Natural Resources, Construction and Maintenance Occupations by Sex
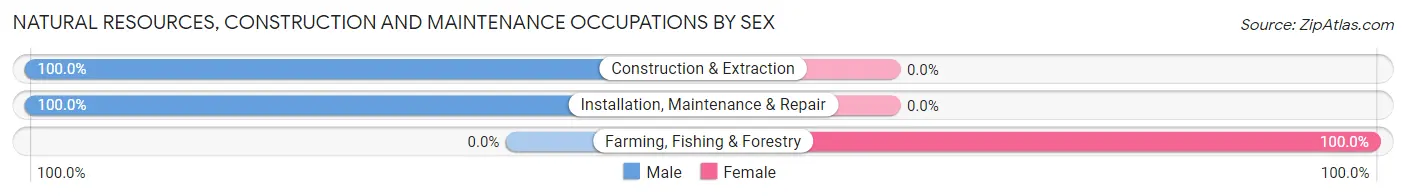
| Occupation | Male | Female |
| Farming, Fishing & Forestry | 0 (0.0%) | 10 (100.0%) |
| Construction & Extraction | 26 (100.0%) | 0 (0.0%) |
| Installation, Maintenance & Repair | 15 (100.0%) | 0 (0.0%) |
| Total (Category) | 41 (80.4%) | 10 (19.6%) |
| Total (Overall) | 422 (37.1%) | 716 (62.9%) |
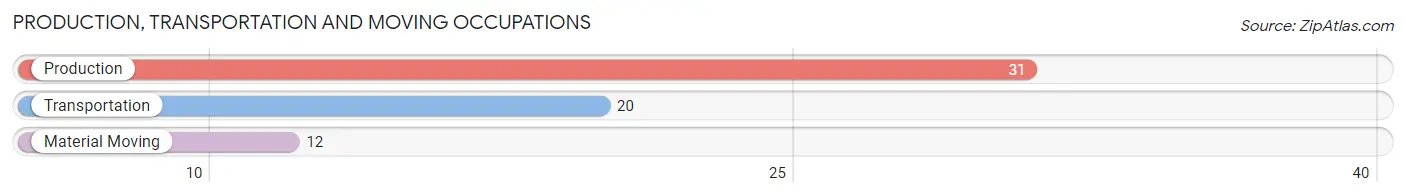
Production, Transportation and Moving Occupations
The most common Production, Transportation and Moving occupations in Cazenovia are Production (31 | 2.7%), Transportation (20 | 1.8%), and Material Moving (12 | 1.1%).
Production, Transportation and Moving Occupations by Sex
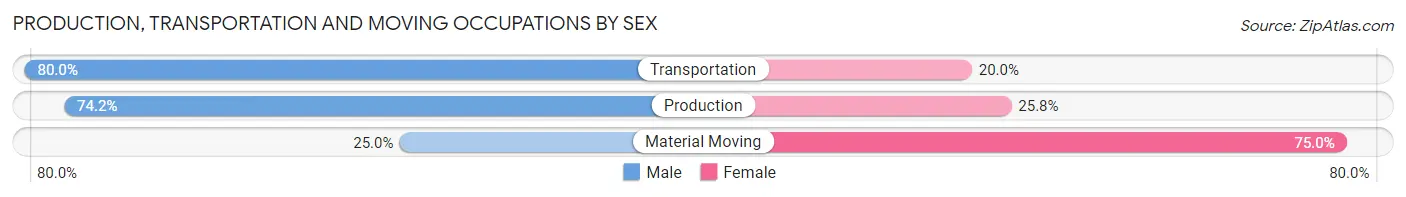
| Occupation | Male | Female |
| Production | 23 (74.2%) | 8 (25.8%) |
| Transportation | 16 (80.0%) | 4 (20.0%) |
| Material Moving | 3 (25.0%) | 9 (75.0%) |
| Total (Category) | 42 (66.7%) | 21 (33.3%) |
| Total (Overall) | 422 (37.1%) | 716 (62.9%) |
Employment Industries by Sex in Cazenovia
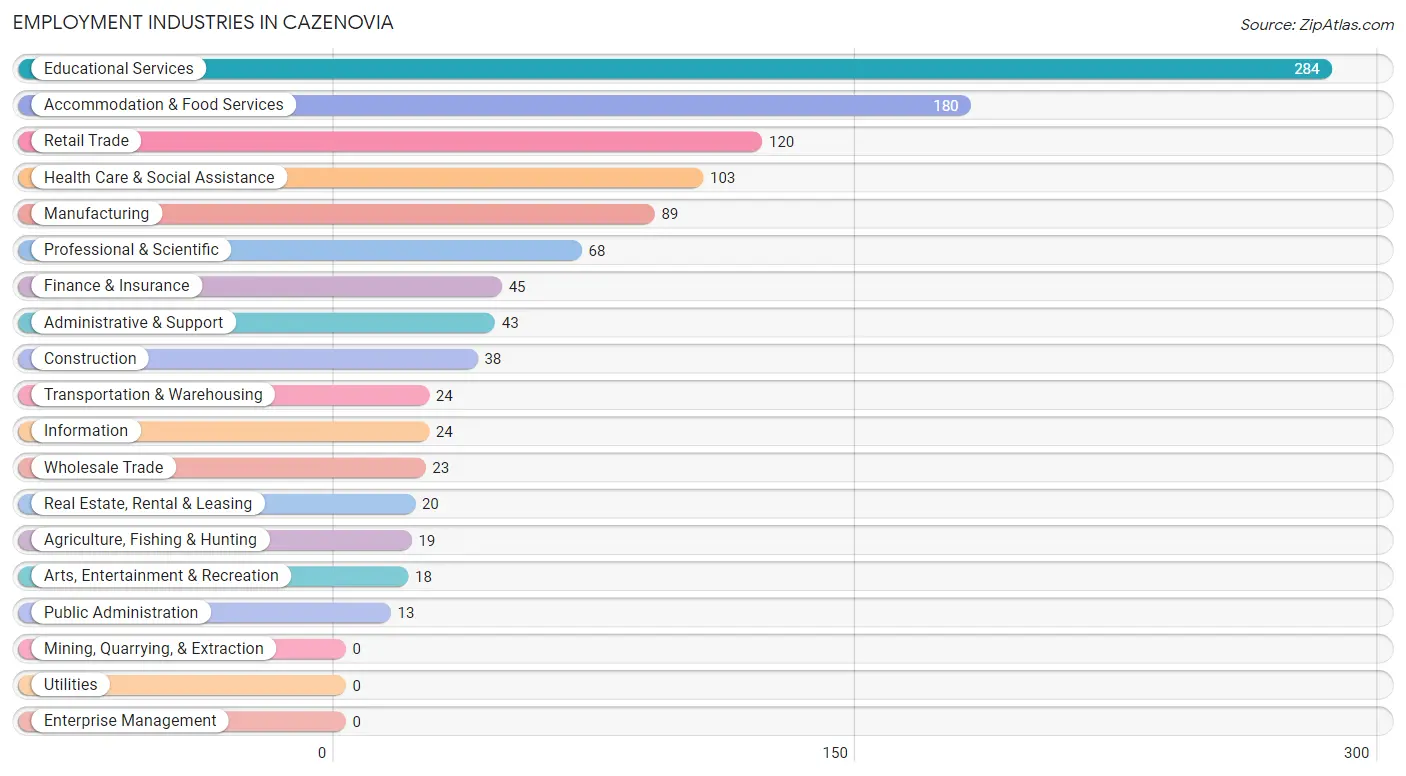
Employment Industries in Cazenovia
The major employment industries in Cazenovia include Educational Services (284 | 25.0%), Accommodation & Food Services (180 | 15.8%), Retail Trade (120 | 10.5%), Health Care & Social Assistance (103 | 9.0%), and Manufacturing (89 | 7.8%).
Employment Industries by Sex in Cazenovia
The Cazenovia industries that see more men than women are Construction (100.0%), Transportation & Warehousing (83.3%), and Wholesale Trade (73.9%), whereas the industries that tend to have a higher number of women are Real Estate, Rental & Leasing (100.0%), Health Care & Social Assistance (85.4%), and Accommodation & Food Services (77.2%).
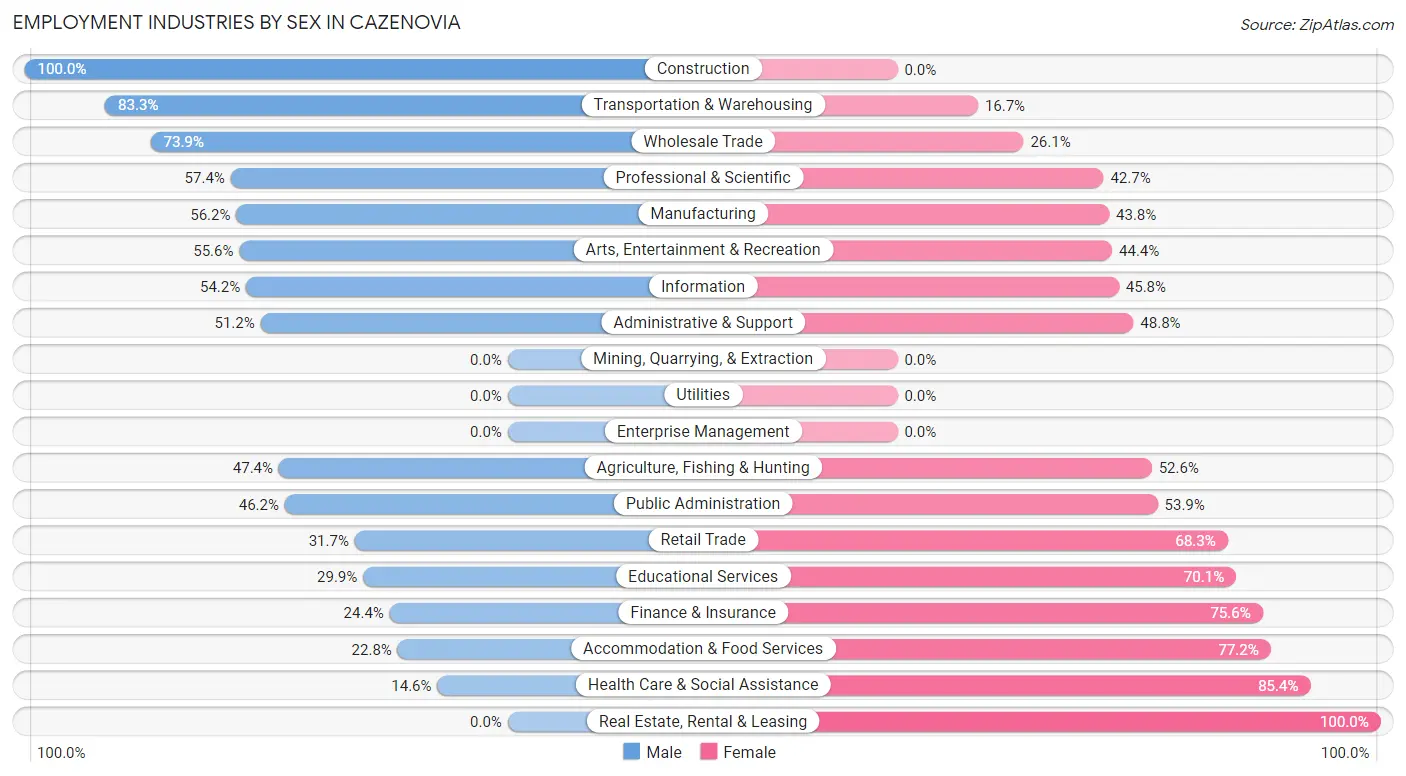
| Industry | Male | Female |
| Agriculture, Fishing & Hunting | 9 (47.4%) | 10 (52.6%) |
| Mining, Quarrying, & Extraction | 0 (0.0%) | 0 (0.0%) |
| Construction | 38 (100.0%) | 0 (0.0%) |
| Manufacturing | 50 (56.2%) | 39 (43.8%) |
| Wholesale Trade | 17 (73.9%) | 6 (26.1%) |
| Retail Trade | 38 (31.7%) | 82 (68.3%) |
| Transportation & Warehousing | 20 (83.3%) | 4 (16.7%) |
| Utilities | 0 (0.0%) | 0 (0.0%) |
| Information | 13 (54.2%) | 11 (45.8%) |
| Finance & Insurance | 11 (24.4%) | 34 (75.6%) |
| Real Estate, Rental & Leasing | 0 (0.0%) | 20 (100.0%) |
| Professional & Scientific | 39 (57.4%) | 29 (42.6%) |
| Enterprise Management | 0 (0.0%) | 0 (0.0%) |
| Administrative & Support | 22 (51.2%) | 21 (48.8%) |
| Educational Services | 85 (29.9%) | 199 (70.1%) |
| Health Care & Social Assistance | 15 (14.6%) | 88 (85.4%) |
| Arts, Entertainment & Recreation | 10 (55.6%) | 8 (44.4%) |
| Accommodation & Food Services | 41 (22.8%) | 139 (77.2%) |
| Public Administration | 6 (46.2%) | 7 (53.8%) |
| Total | 422 (37.1%) | 716 (62.9%) |
Education in Cazenovia
School Enrollment in Cazenovia
The most common levels of schooling among the 1,596 students in Cazenovia are college / undergraduate (1,252 | 78.4%), high school (123 | 7.7%), and elementary school (85 | 5.3%).
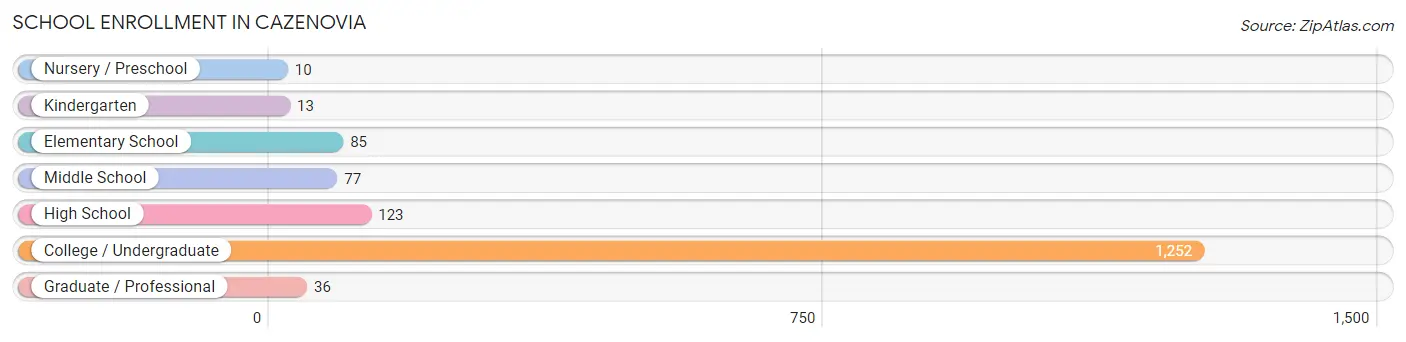
| School Level | # Students | % Students |
| Nursery / Preschool | 10 | 0.6% |
| Kindergarten | 13 | 0.8% |
| Elementary School | 85 | 5.3% |
| Middle School | 77 | 4.8% |
| High School | 123 | 7.7% |
| College / Undergraduate | 1,252 | 78.4% |
| Graduate / Professional | 36 | 2.3% |
| Total | 1,596 | 100.0% |
School Enrollment by Age by Funding Source in Cazenovia
Out of a total of 1,596 students who are enrolled in schools in Cazenovia, 1,017 (63.7%) attend a private institution, while the remaining 579 (36.3%) are enrolled in public schools. The age group of 20 to 24 year olds has the highest likelihood of being enrolled in private schools, with 499 (86.3% in the age bracket) enrolled. Conversely, the age group of 3 to 4 year olds has the lowest likelihood of being enrolled in a private school, with 7 (100.0% in the age bracket) attending a public institution.
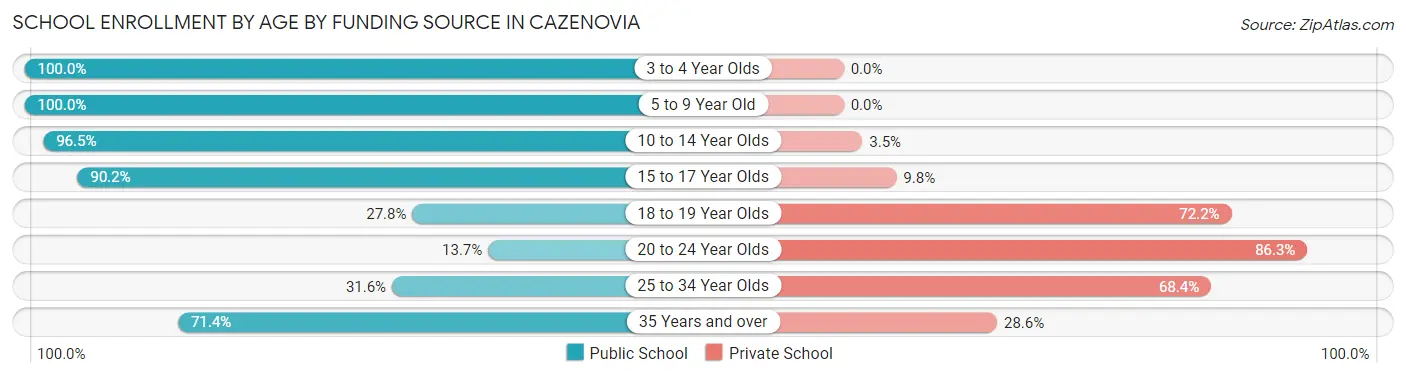
| Age Bracket | Public School | Private School |
| 3 to 4 Year Olds | 7 (100.0%) | 0 (0.0%) |
| 5 to 9 Year Old | 78 (100.0%) | 0 (0.0%) |
| 10 to 14 Year Olds | 111 (96.5%) | 4 (3.5%) |
| 15 to 17 Year Olds | 101 (90.2%) | 11 (9.8%) |
| 18 to 19 Year Olds | 187 (27.8%) | 486 (72.2%) |
| 20 to 24 Year Olds | 79 (13.7%) | 499 (86.3%) |
| 25 to 34 Year Olds | 6 (31.6%) | 13 (68.4%) |
| 35 Years and over | 10 (71.4%) | 4 (28.6%) |
| Total | 579 (36.3%) | 1,017 (63.7%) |
Educational Attainment by Field of Study in Cazenovia
Education (100 | 14.4%), science & technology (88 | 12.7%), business (69 | 9.9%), psychology (60 | 8.6%), and social sciences (49 | 7.0%) are the most common fields of study among 695 individuals in Cazenovia who have obtained a bachelor's degree or higher.
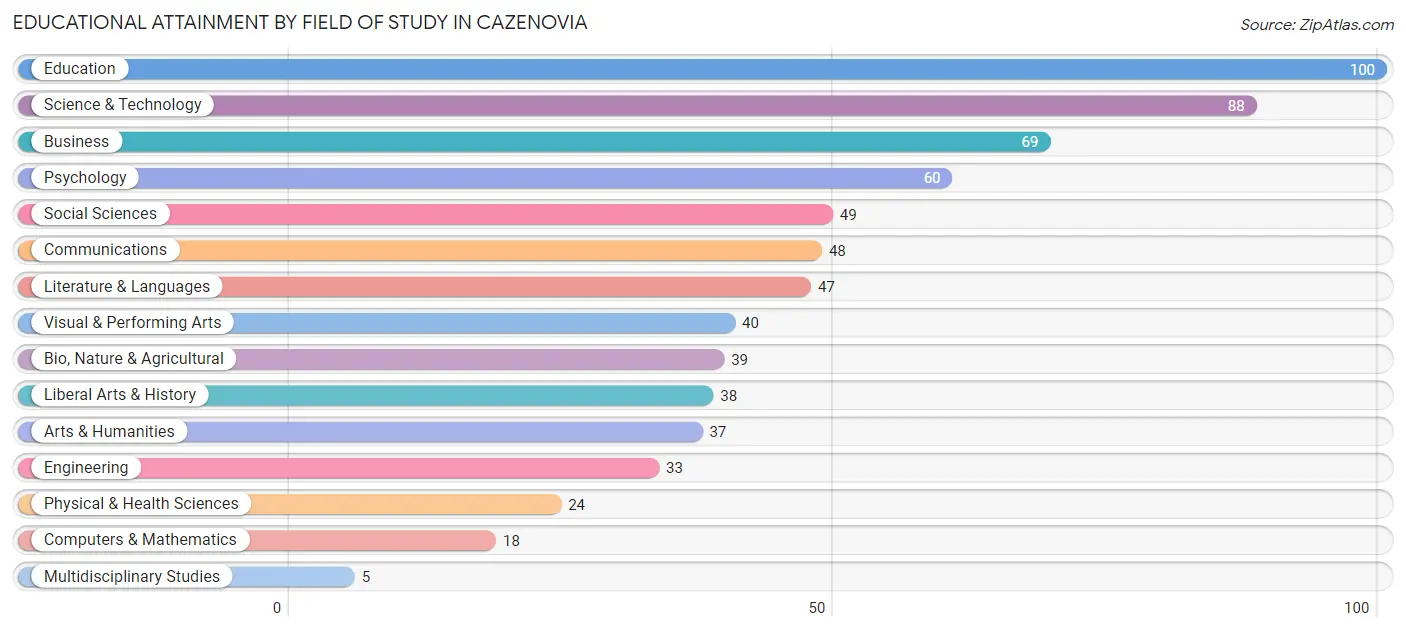
| Field of Study | # Graduates | % Graduates |
| Computers & Mathematics | 18 | 2.6% |
| Bio, Nature & Agricultural | 39 | 5.6% |
| Physical & Health Sciences | 24 | 3.5% |
| Psychology | 60 | 8.6% |
| Social Sciences | 49 | 7.0% |
| Engineering | 33 | 4.8% |
| Multidisciplinary Studies | 5 | 0.7% |
| Science & Technology | 88 | 12.7% |
| Business | 69 | 9.9% |
| Education | 100 | 14.4% |
| Literature & Languages | 47 | 6.8% |
| Liberal Arts & History | 38 | 5.5% |
| Visual & Performing Arts | 40 | 5.8% |
| Communications | 48 | 6.9% |
| Arts & Humanities | 37 | 5.3% |
| Total | 695 | 100.0% |
Transportation & Commute in Cazenovia
Vehicle Availability by Sex in Cazenovia
The most prevalent vehicle ownership categories in Cazenovia are males with 2 vehicles (174, accounting for 50.4%) and females with 2 vehicles (204, making up 41.1%).
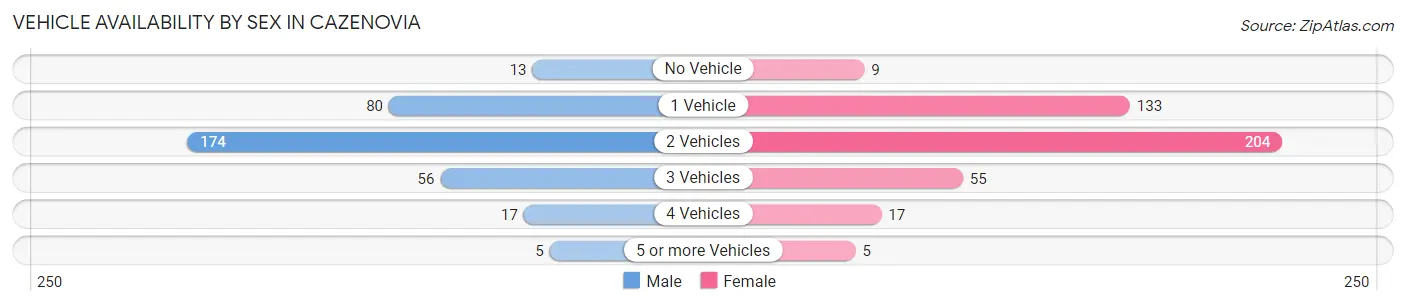
| Vehicles Available | Male | Female |
| No Vehicle | 13 (3.8%) | 9 (2.1%) |
| 1 Vehicle | 80 (23.2%) | 133 (31.4%) |
| 2 Vehicles | 174 (50.4%) | 204 (48.2%) |
| 3 Vehicles | 56 (16.2%) | 55 (13.0%) |
| 4 Vehicles | 17 (4.9%) | 17 (4.0%) |
| 5 or more Vehicles | 5 (1.5%) | 5 (1.2%) |
| Total | 345 (100.0%) | 423 (100.0%) |
Commute Time in Cazenovia
The most frequently occuring commute durations in Cazenovia are 5 to 9 minutes (185 commuters, 20.9%), 30 to 34 minutes (123 commuters, 13.9%), and less than 5 minutes (96 commuters, 10.8%).
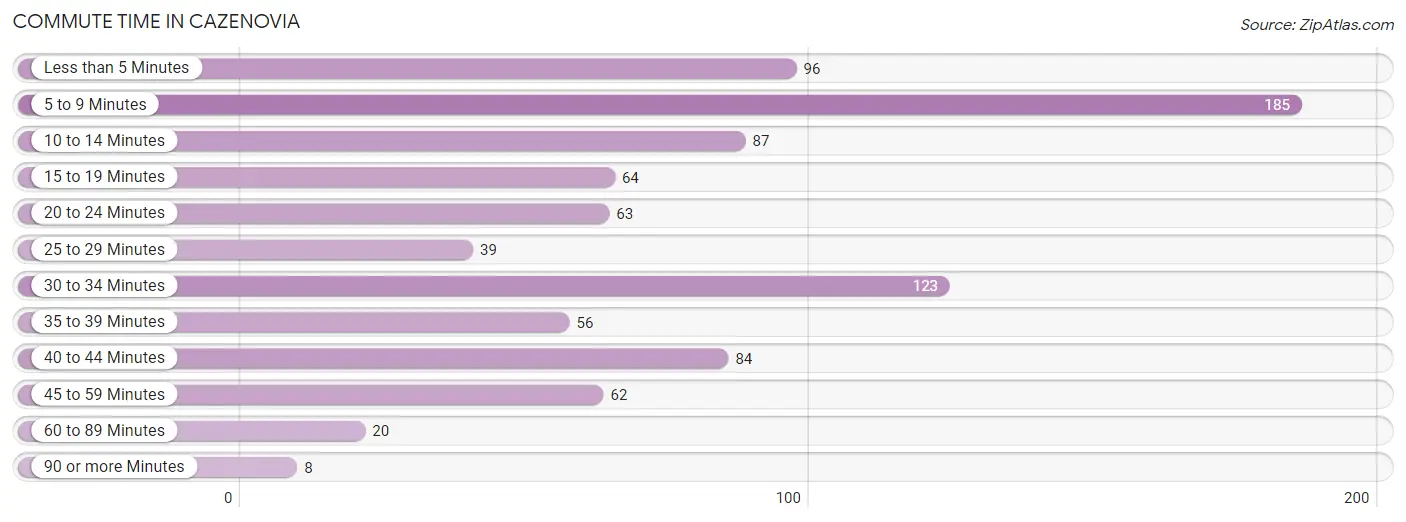
| Commute Time | # Commuters | % Commuters |
| Less than 5 Minutes | 96 | 10.8% |
| 5 to 9 Minutes | 185 | 20.9% |
| 10 to 14 Minutes | 87 | 9.8% |
| 15 to 19 Minutes | 64 | 7.2% |
| 20 to 24 Minutes | 63 | 7.1% |
| 25 to 29 Minutes | 39 | 4.4% |
| 30 to 34 Minutes | 123 | 13.9% |
| 35 to 39 Minutes | 56 | 6.3% |
| 40 to 44 Minutes | 84 | 9.5% |
| 45 to 59 Minutes | 62 | 7.0% |
| 60 to 89 Minutes | 20 | 2.2% |
| 90 or more Minutes | 8 | 0.9% |
Commute Time by Sex in Cazenovia
The most common commute times in Cazenovia are 5 to 9 minutes (59 commuters, 17.0%) for males and 5 to 9 minutes (126 commuters, 23.4%) for females.
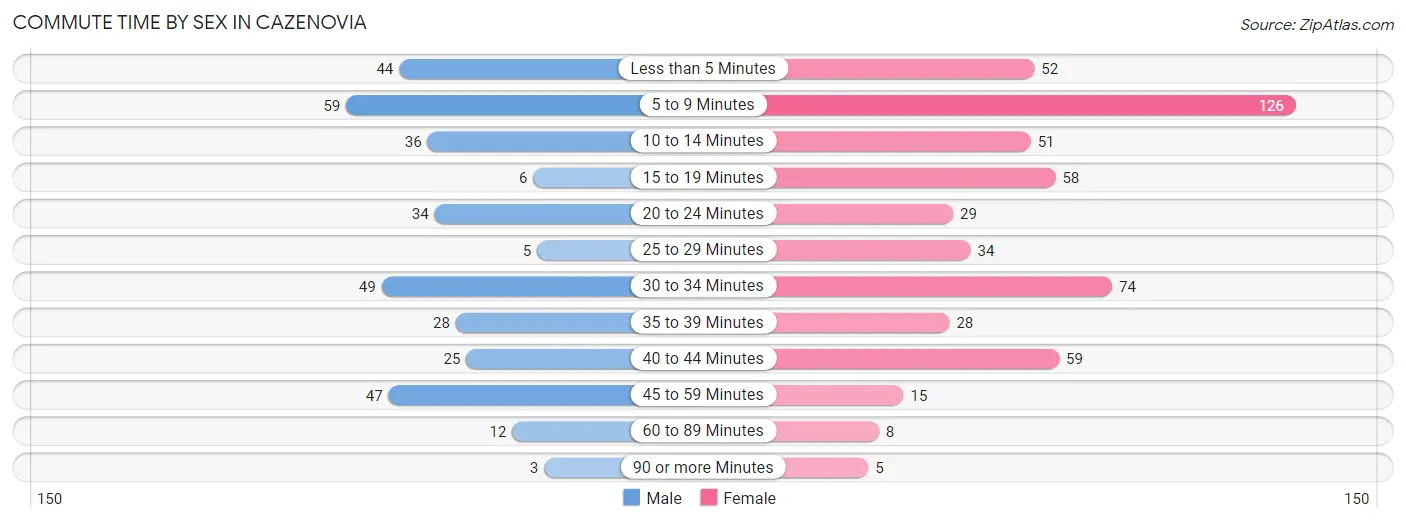
| Commute Time | Male | Female |
| Less than 5 Minutes | 44 (12.6%) | 52 (9.7%) |
| 5 to 9 Minutes | 59 (17.0%) | 126 (23.4%) |
| 10 to 14 Minutes | 36 (10.3%) | 51 (9.5%) |
| 15 to 19 Minutes | 6 (1.7%) | 58 (10.8%) |
| 20 to 24 Minutes | 34 (9.8%) | 29 (5.4%) |
| 25 to 29 Minutes | 5 (1.4%) | 34 (6.3%) |
| 30 to 34 Minutes | 49 (14.1%) | 74 (13.7%) |
| 35 to 39 Minutes | 28 (8.1%) | 28 (5.2%) |
| 40 to 44 Minutes | 25 (7.2%) | 59 (11.0%) |
| 45 to 59 Minutes | 47 (13.5%) | 15 (2.8%) |
| 60 to 89 Minutes | 12 (3.5%) | 8 (1.5%) |
| 90 or more Minutes | 3 (0.9%) | 5 (0.9%) |
Time of Departure to Work by Sex in Cazenovia
The most frequent times of departure to work in Cazenovia are 7:00 AM to 7:29 AM (62, 17.8%) for males and 4:00 PM to 11:59 PM (133, 24.7%) for females.
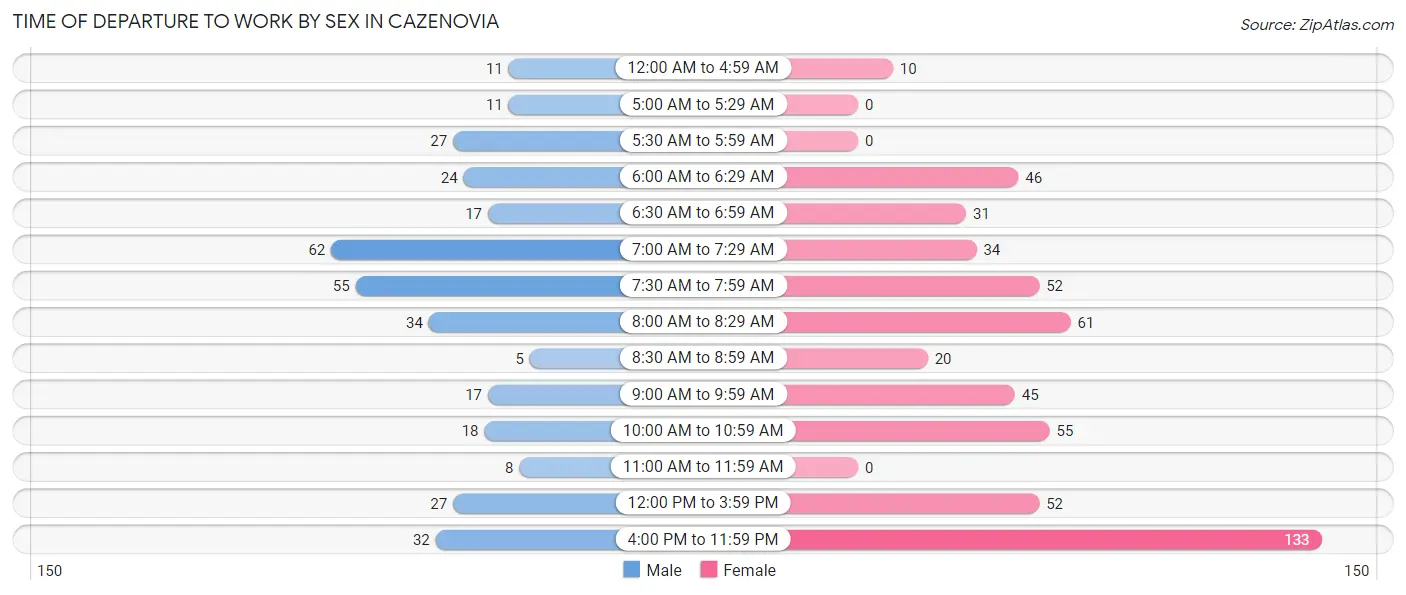
| Time of Departure | Male | Female |
| 12:00 AM to 4:59 AM | 11 (3.2%) | 10 (1.9%) |
| 5:00 AM to 5:29 AM | 11 (3.2%) | 0 (0.0%) |
| 5:30 AM to 5:59 AM | 27 (7.8%) | 0 (0.0%) |
| 6:00 AM to 6:29 AM | 24 (6.9%) | 46 (8.5%) |
| 6:30 AM to 6:59 AM | 17 (4.9%) | 31 (5.8%) |
| 7:00 AM to 7:29 AM | 62 (17.8%) | 34 (6.3%) |
| 7:30 AM to 7:59 AM | 55 (15.8%) | 52 (9.7%) |
| 8:00 AM to 8:29 AM | 34 (9.8%) | 61 (11.3%) |
| 8:30 AM to 8:59 AM | 5 (1.4%) | 20 (3.7%) |
| 9:00 AM to 9:59 AM | 17 (4.9%) | 45 (8.4%) |
| 10:00 AM to 10:59 AM | 18 (5.2%) | 55 (10.2%) |
| 11:00 AM to 11:59 AM | 8 (2.3%) | 0 (0.0%) |
| 12:00 PM to 3:59 PM | 27 (7.8%) | 52 (9.7%) |
| 4:00 PM to 11:59 PM | 32 (9.2%) | 133 (24.7%) |
| Total | 348 (100.0%) | 539 (100.0%) |
Housing Occupancy in Cazenovia
Occupancy by Ownership in Cazenovia
Of the total 681 dwellings in Cazenovia, owner-occupied units account for 423 (62.1%), while renter-occupied units make up 258 (37.9%).
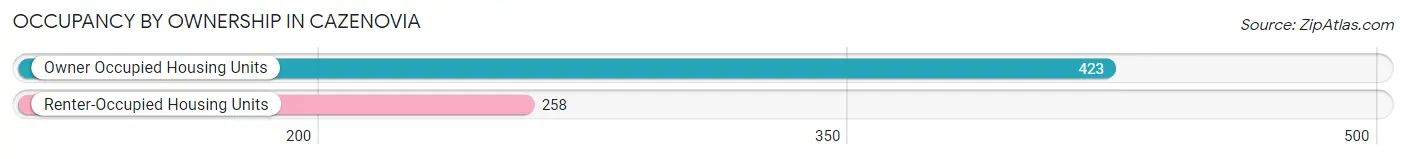
| Occupancy | # Housing Units | % Housing Units |
| Owner Occupied Housing Units | 423 | 62.1% |
| Renter-Occupied Housing Units | 258 | 37.9% |
| Total Occupied Housing Units | 681 | 100.0% |
Occupancy by Household Size in Cazenovia
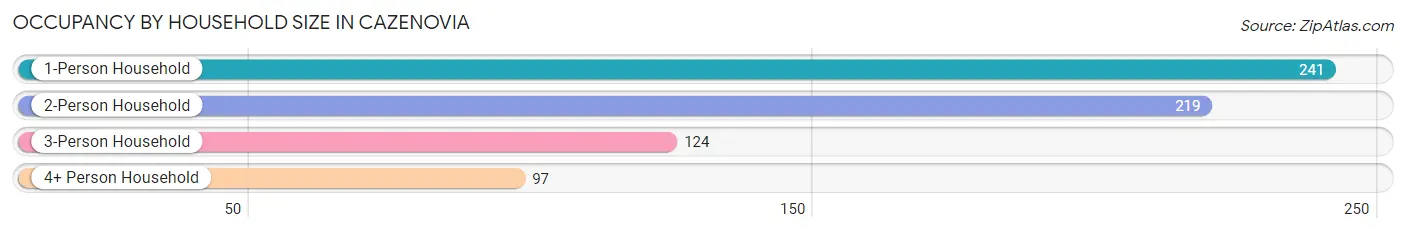
| Household Size | # Housing Units | % Housing Units |
| 1-Person Household | 241 | 35.4% |
| 2-Person Household | 219 | 32.2% |
| 3-Person Household | 124 | 18.2% |
| 4+ Person Household | 97 | 14.2% |
| Total Housing Units | 681 | 100.0% |
Occupancy by Ownership by Household Size in Cazenovia
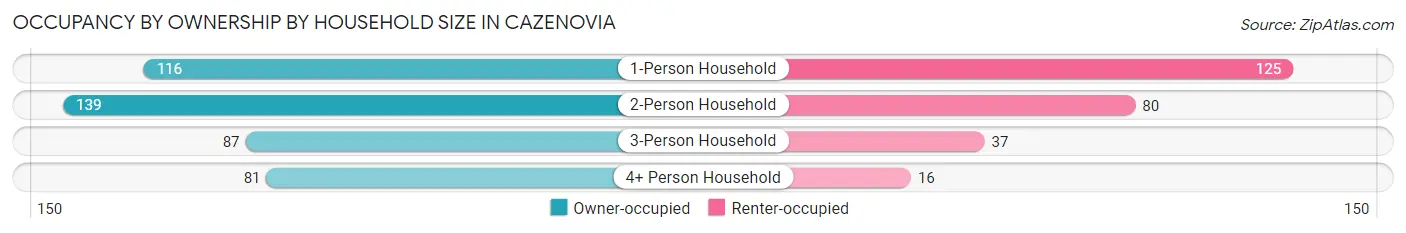
| Household Size | Owner-occupied | Renter-occupied |
| 1-Person Household | 116 (48.1%) | 125 (51.9%) |
| 2-Person Household | 139 (63.5%) | 80 (36.5%) |
| 3-Person Household | 87 (70.2%) | 37 (29.8%) |
| 4+ Person Household | 81 (83.5%) | 16 (16.5%) |
| Total Housing Units | 423 (62.1%) | 258 (37.9%) |
Occupancy by Educational Attainment in Cazenovia
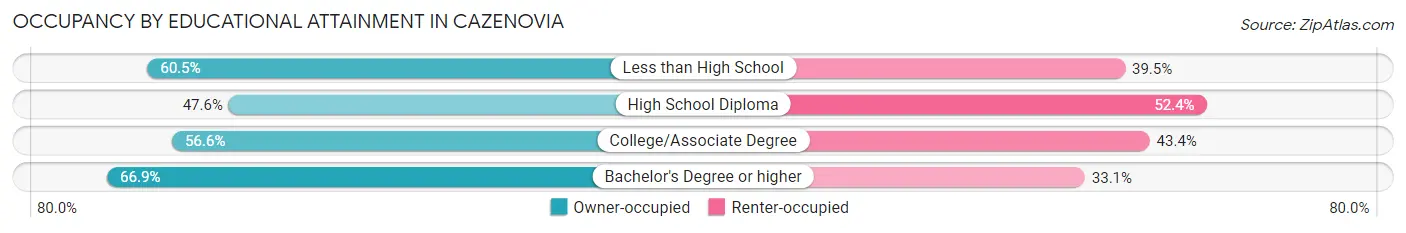
| Household Size | Owner-occupied | Renter-occupied |
| Less than High School | 23 (60.5%) | 15 (39.5%) |
| High School Diploma | 40 (47.6%) | 44 (52.4%) |
| College/Associate Degree | 77 (56.6%) | 59 (43.4%) |
| Bachelor's Degree or higher | 283 (66.9%) | 140 (33.1%) |
Occupancy by Age of Householder in Cazenovia
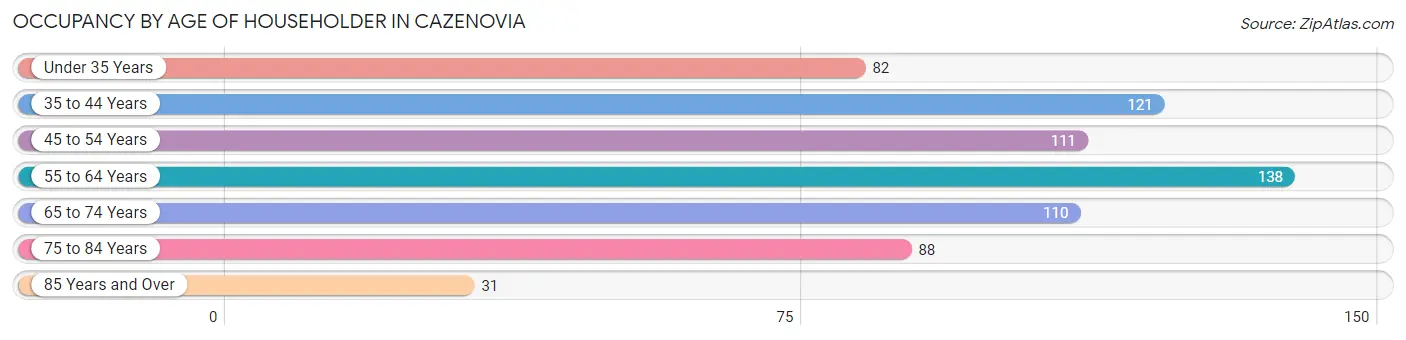
| Age Bracket | # Households | % Households |
| Under 35 Years | 82 | 12.0% |
| 35 to 44 Years | 121 | 17.8% |
| 45 to 54 Years | 111 | 16.3% |
| 55 to 64 Years | 138 | 20.3% |
| 65 to 74 Years | 110 | 16.2% |
| 75 to 84 Years | 88 | 12.9% |
| 85 Years and Over | 31 | 4.5% |
| Total | 681 | 100.0% |
Housing Finances in Cazenovia
Median Income by Occupancy in Cazenovia
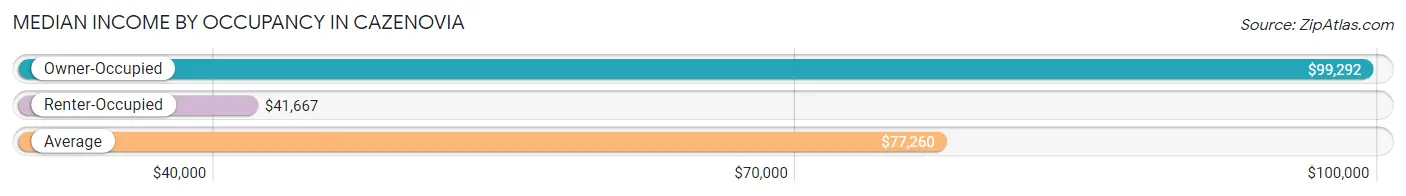
| Occupancy Type | # Households | Median Income |
| Owner-Occupied | 423 (62.1%) | $99,292 |
| Renter-Occupied | 258 (37.9%) | $41,667 |
| Average | 681 (100.0%) | $77,260 |
Occupancy by Householder Income Bracket in Cazenovia
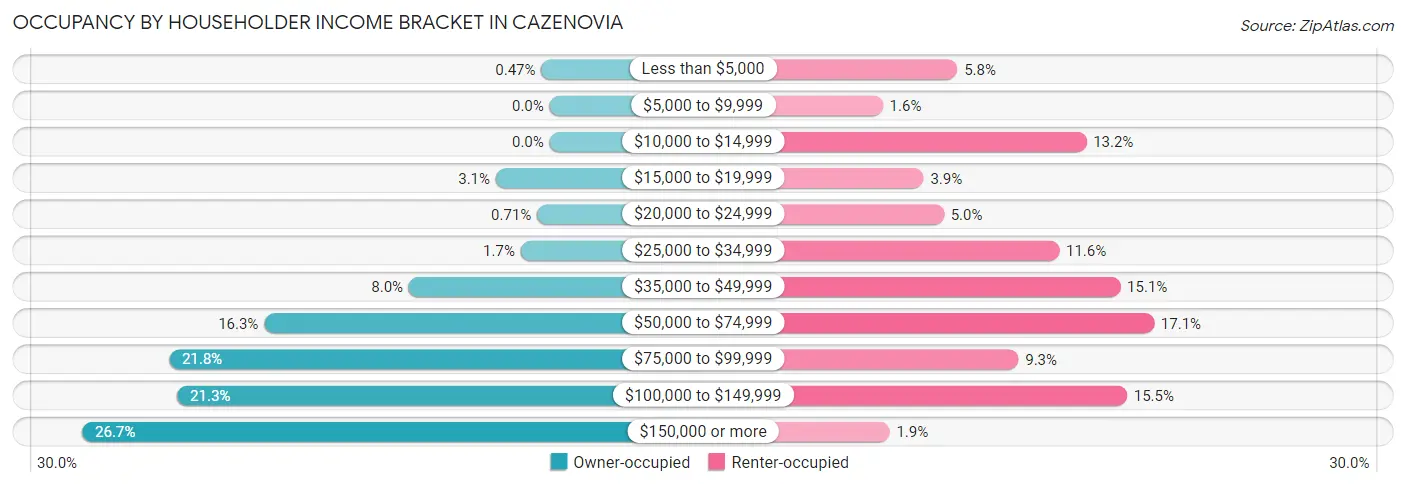
| Income Bracket | Owner-occupied | Renter-occupied |
| Less than $5,000 | 2 (0.5%) | 15 (5.8%) |
| $5,000 to $9,999 | 0 (0.0%) | 4 (1.5%) |
| $10,000 to $14,999 | 0 (0.0%) | 34 (13.2%) |
| $15,000 to $19,999 | 13 (3.1%) | 10 (3.9%) |
| $20,000 to $24,999 | 3 (0.7%) | 13 (5.0%) |
| $25,000 to $34,999 | 7 (1.7%) | 30 (11.6%) |
| $35,000 to $49,999 | 34 (8.0%) | 39 (15.1%) |
| $50,000 to $74,999 | 69 (16.3%) | 44 (17.1%) |
| $75,000 to $99,999 | 92 (21.7%) | 24 (9.3%) |
| $100,000 to $149,999 | 90 (21.3%) | 40 (15.5%) |
| $150,000 or more | 113 (26.7%) | 5 (1.9%) |
| Total | 423 (100.0%) | 258 (100.0%) |
Monthly Housing Cost Tiers in Cazenovia
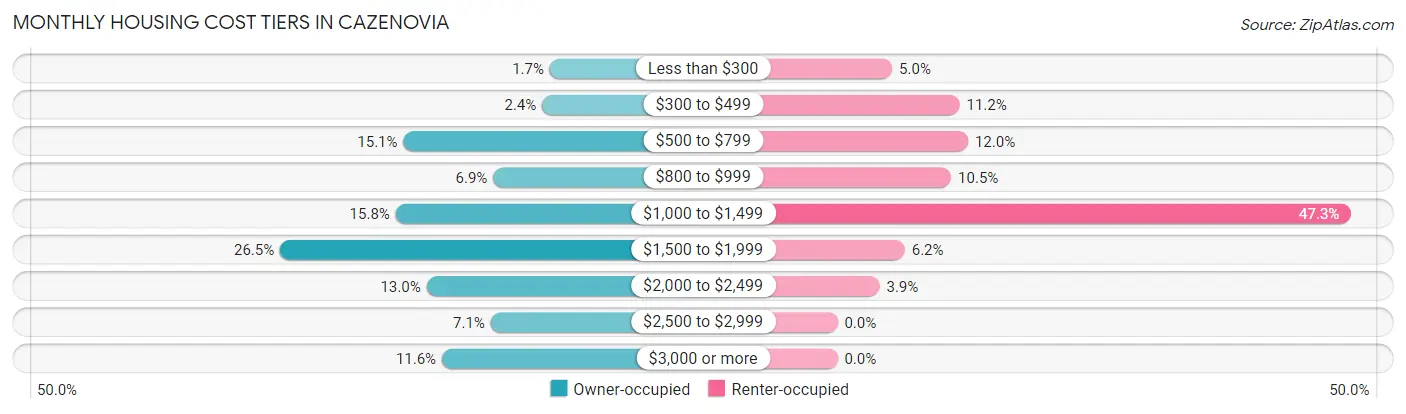
| Monthly Cost | Owner-occupied | Renter-occupied |
| Less than $300 | 7 (1.7%) | 13 (5.0%) |
| $300 to $499 | 10 (2.4%) | 29 (11.2%) |
| $500 to $799 | 64 (15.1%) | 31 (12.0%) |
| $800 to $999 | 29 (6.9%) | 27 (10.5%) |
| $1,000 to $1,499 | 67 (15.8%) | 122 (47.3%) |
| $1,500 to $1,999 | 112 (26.5%) | 16 (6.2%) |
| $2,000 to $2,499 | 55 (13.0%) | 10 (3.9%) |
| $2,500 to $2,999 | 30 (7.1%) | 0 (0.0%) |
| $3,000 or more | 49 (11.6%) | 0 (0.0%) |
| Total | 423 (100.0%) | 258 (100.0%) |
Physical Housing Characteristics in Cazenovia
Housing Structures in Cazenovia
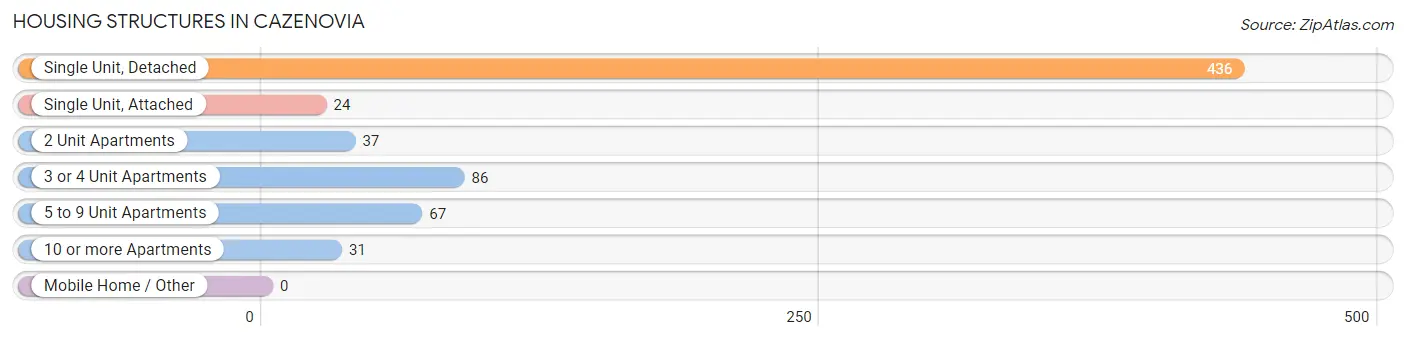
| Structure Type | # Housing Units | % Housing Units |
| Single Unit, Detached | 436 | 64.0% |
| Single Unit, Attached | 24 | 3.5% |
| 2 Unit Apartments | 37 | 5.4% |
| 3 or 4 Unit Apartments | 86 | 12.6% |
| 5 to 9 Unit Apartments | 67 | 9.8% |
| 10 or more Apartments | 31 | 4.5% |
| Mobile Home / Other | 0 | 0.0% |
| Total | 681 | 100.0% |
Housing Structures by Occupancy in Cazenovia
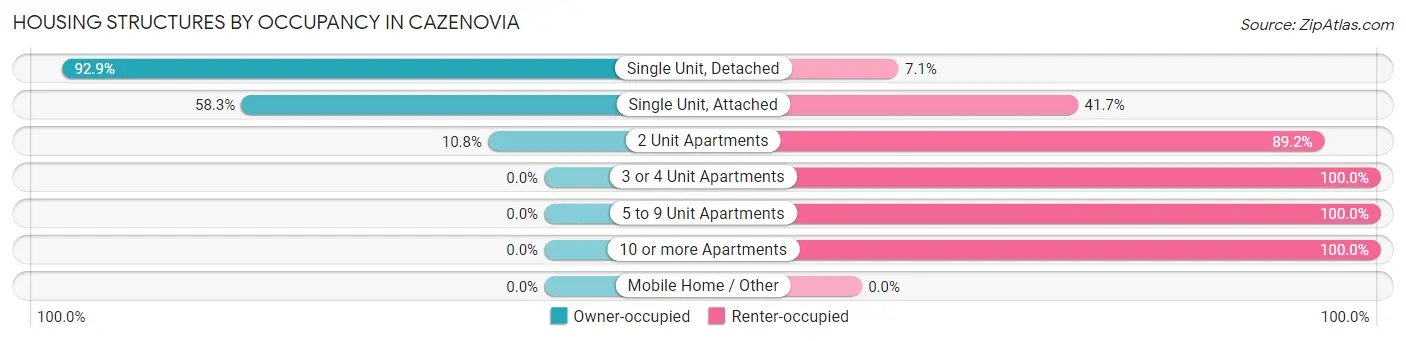
| Structure Type | Owner-occupied | Renter-occupied |
| Single Unit, Detached | 405 (92.9%) | 31 (7.1%) |
| Single Unit, Attached | 14 (58.3%) | 10 (41.7%) |
| 2 Unit Apartments | 4 (10.8%) | 33 (89.2%) |
| 3 or 4 Unit Apartments | 0 (0.0%) | 86 (100.0%) |
| 5 to 9 Unit Apartments | 0 (0.0%) | 67 (100.0%) |
| 10 or more Apartments | 0 (0.0%) | 31 (100.0%) |
| Mobile Home / Other | 0 (0.0%) | 0 (0.0%) |
| Total | 423 (62.1%) | 258 (37.9%) |
Housing Structures by Number of Rooms in Cazenovia
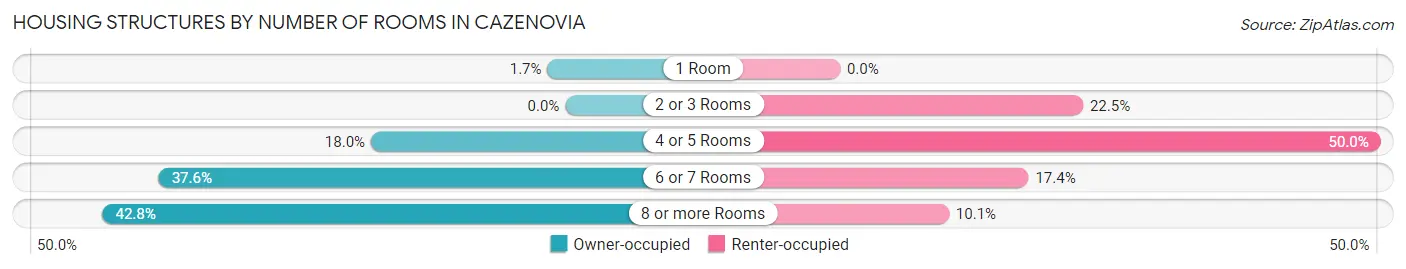
| Number of Rooms | Owner-occupied | Renter-occupied |
| 1 Room | 7 (1.7%) | 0 (0.0%) |
| 2 or 3 Rooms | 0 (0.0%) | 58 (22.5%) |
| 4 or 5 Rooms | 76 (18.0%) | 129 (50.0%) |
| 6 or 7 Rooms | 159 (37.6%) | 45 (17.4%) |
| 8 or more Rooms | 181 (42.8%) | 26 (10.1%) |
| Total | 423 (100.0%) | 258 (100.0%) |
Housing Structure by Heating Type in Cazenovia
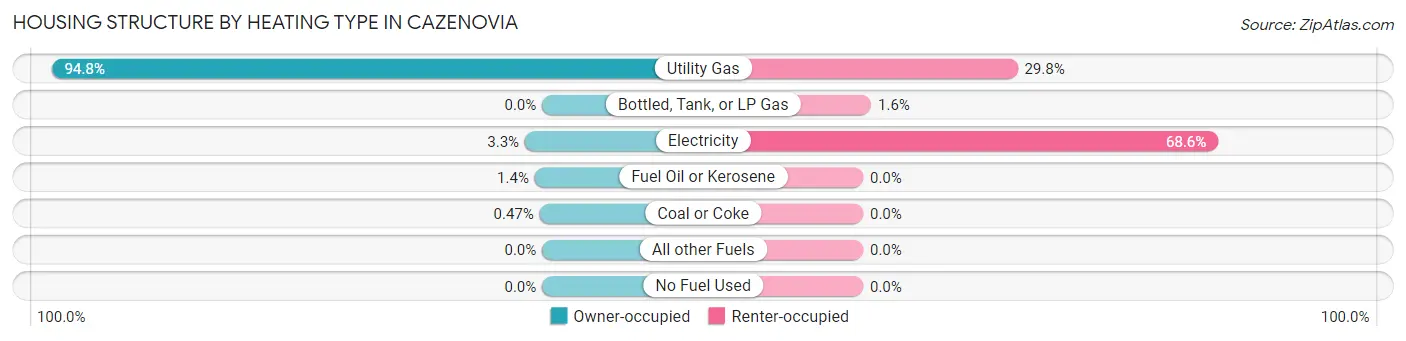
| Heating Type | Owner-occupied | Renter-occupied |
| Utility Gas | 401 (94.8%) | 77 (29.8%) |
| Bottled, Tank, or LP Gas | 0 (0.0%) | 4 (1.5%) |
| Electricity | 14 (3.3%) | 177 (68.6%) |
| Fuel Oil or Kerosene | 6 (1.4%) | 0 (0.0%) |
| Coal or Coke | 2 (0.5%) | 0 (0.0%) |
| All other Fuels | 0 (0.0%) | 0 (0.0%) |
| No Fuel Used | 0 (0.0%) | 0 (0.0%) |
| Total | 423 (100.0%) | 258 (100.0%) |
Household Vehicle Usage in Cazenovia
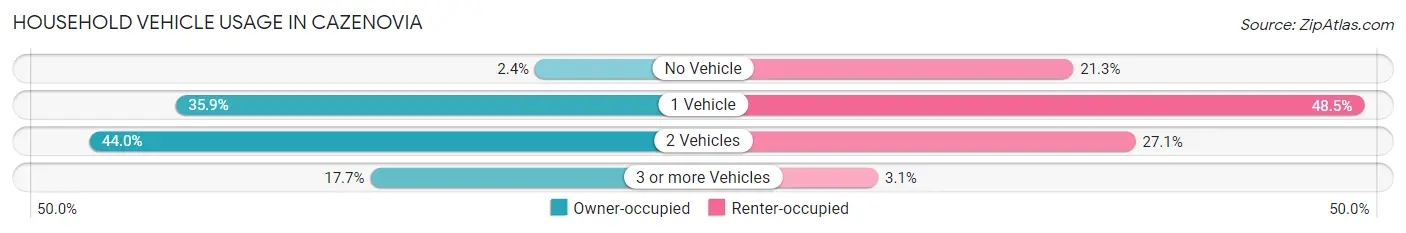
| Vehicles per Household | Owner-occupied | Renter-occupied |
| No Vehicle | 10 (2.4%) | 55 (21.3%) |
| 1 Vehicle | 152 (35.9%) | 125 (48.4%) |
| 2 Vehicles | 186 (44.0%) | 70 (27.1%) |
| 3 or more Vehicles | 75 (17.7%) | 8 (3.1%) |
| Total | 423 (100.0%) | 258 (100.0%) |
Real Estate & Mortgages in Cazenovia
Real Estate and Mortgage Overview in Cazenovia
| Characteristic | Without Mortgage | With Mortgage |
| Housing Units | 168 | 255 |
| Median Property Value | $250,000 | $233,000 |
| Median Household Income | $91,667 | $77 |
| Monthly Housing Costs | $850 | $46 |
| Real Estate Taxes | $6,154 | $0 |
Property Value by Mortgage Status in Cazenovia
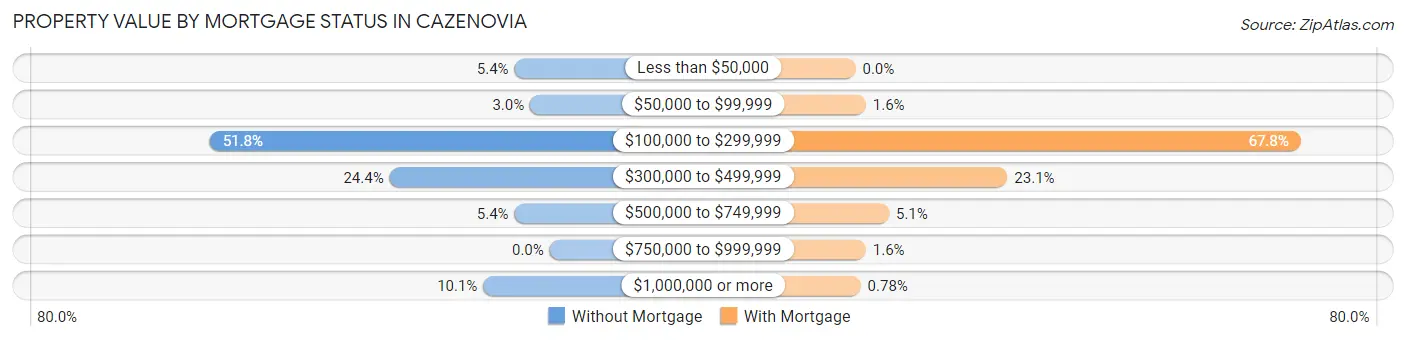
| Property Value | Without Mortgage | With Mortgage |
| Less than $50,000 | 9 (5.4%) | 0 (0.0%) |
| $50,000 to $99,999 | 5 (3.0%) | 4 (1.6%) |
| $100,000 to $299,999 | 87 (51.8%) | 173 (67.8%) |
| $300,000 to $499,999 | 41 (24.4%) | 59 (23.1%) |
| $500,000 to $749,999 | 9 (5.4%) | 13 (5.1%) |
| $750,000 to $999,999 | 0 (0.0%) | 4 (1.6%) |
| $1,000,000 or more | 17 (10.1%) | 2 (0.8%) |
| Total | 168 (100.0%) | 255 (100.0%) |
Household Income by Mortgage Status in Cazenovia
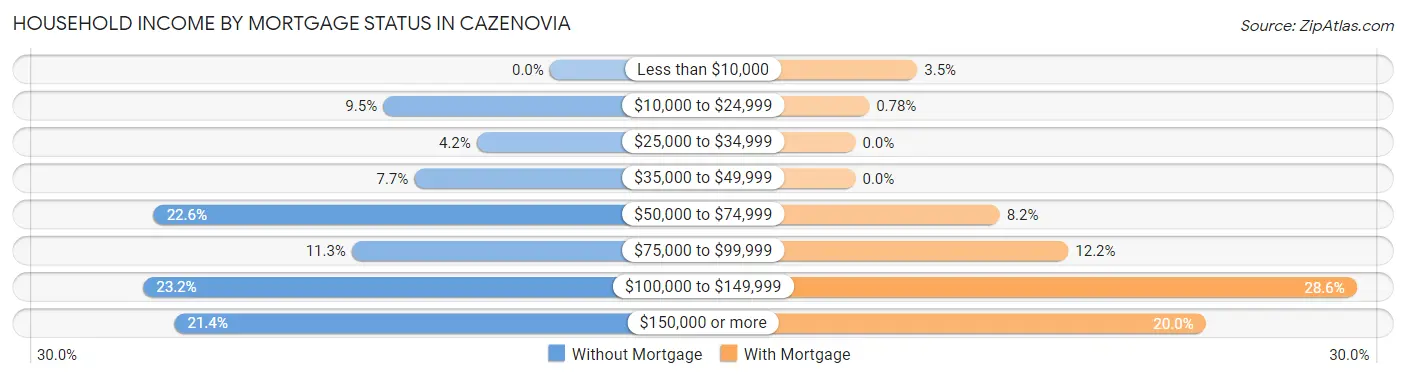
| Household Income | Without Mortgage | With Mortgage |
| Less than $10,000 | 0 (0.0%) | 9 (3.5%) |
| $10,000 to $24,999 | 16 (9.5%) | 2 (0.8%) |
| $25,000 to $34,999 | 7 (4.2%) | 0 (0.0%) |
| $35,000 to $49,999 | 13 (7.7%) | 0 (0.0%) |
| $50,000 to $74,999 | 38 (22.6%) | 21 (8.2%) |
| $75,000 to $99,999 | 19 (11.3%) | 31 (12.2%) |
| $100,000 to $149,999 | 39 (23.2%) | 73 (28.6%) |
| $150,000 or more | 36 (21.4%) | 51 (20.0%) |
| Total | 168 (100.0%) | 255 (100.0%) |
Property Value to Household Income Ratio in Cazenovia
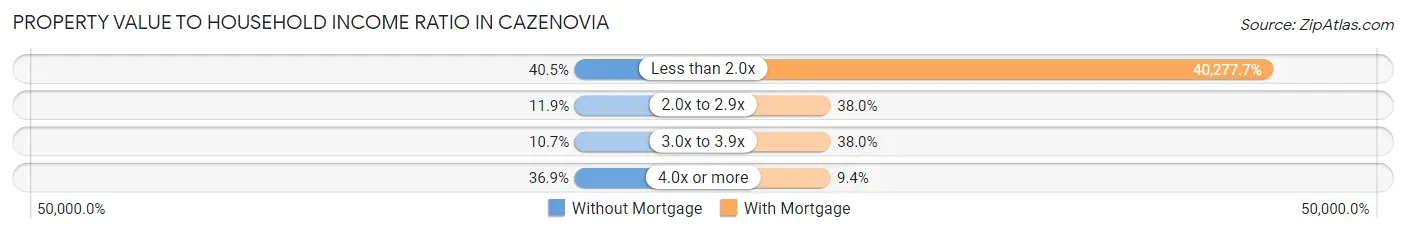
| Value-to-Income Ratio | Without Mortgage | With Mortgage |
| Less than 2.0x | 68 (40.5%) | 102,708 (40,277.6%) |
| 2.0x to 2.9x | 20 (11.9%) | 97 (38.0%) |
| 3.0x to 3.9x | 18 (10.7%) | 97 (38.0%) |
| 4.0x or more | 62 (36.9%) | 24 (9.4%) |
| Total | 168 (100.0%) | 255 (100.0%) |
Real Estate Taxes by Mortgage Status in Cazenovia
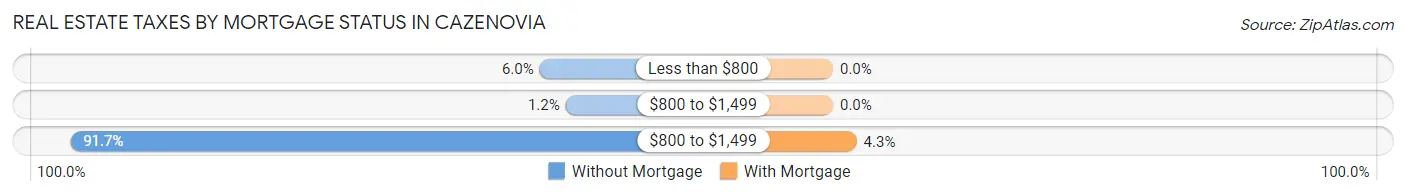
| Property Taxes | Without Mortgage | With Mortgage |
| Less than $800 | 10 (5.9%) | 0 (0.0%) |
| $800 to $1,499 | 2 (1.2%) | 0 (0.0%) |
| $800 to $1,499 | 154 (91.7%) | 11 (4.3%) |
| Total | 168 (100.0%) | 255 (100.0%) |
Health & Disability in Cazenovia
Health Insurance Coverage by Age in Cazenovia
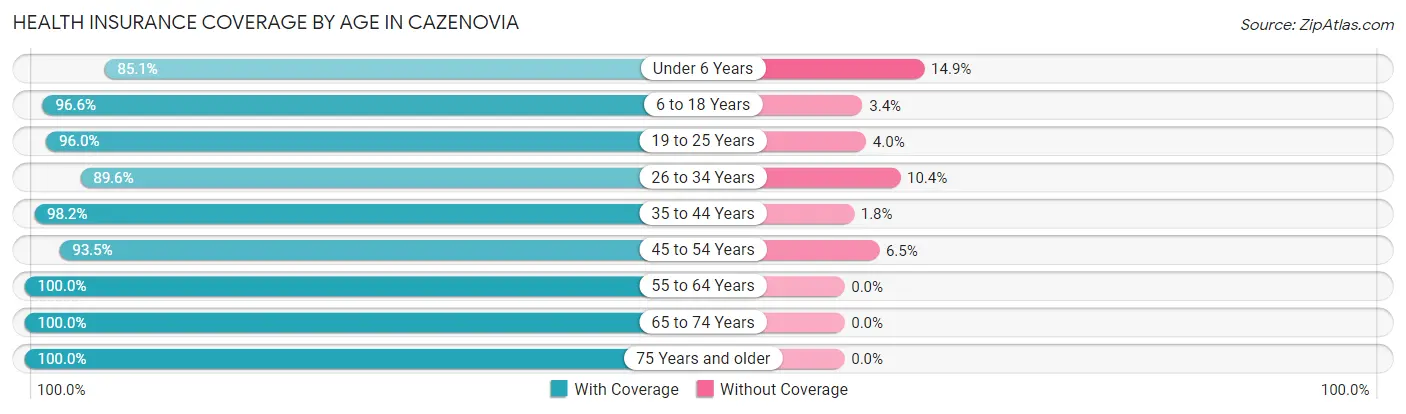
| Age Bracket | With Coverage | Without Coverage |
| Under 6 Years | 40 (85.1%) | 7 (14.9%) |
| 6 to 18 Years | 602 (96.6%) | 21 (3.4%) |
| 19 to 25 Years | 953 (96.0%) | 40 (4.0%) |
| 26 to 34 Years | 138 (89.6%) | 16 (10.4%) |
| 35 to 44 Years | 222 (98.2%) | 4 (1.8%) |
| 45 to 54 Years | 188 (93.5%) | 13 (6.5%) |
| 55 to 64 Years | 202 (100.0%) | 0 (0.0%) |
| 65 to 74 Years | 171 (100.0%) | 0 (0.0%) |
| 75 Years and older | 139 (100.0%) | 0 (0.0%) |
| Total | 2,655 (96.3%) | 101 (3.7%) |
Health Insurance Coverage by Citizenship Status in Cazenovia
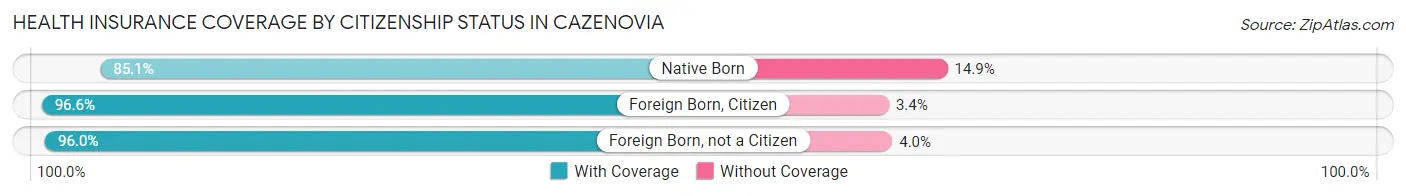
| Citizenship Status | With Coverage | Without Coverage |
| Native Born | 40 (85.1%) | 7 (14.9%) |
| Foreign Born, Citizen | 602 (96.6%) | 21 (3.4%) |
| Foreign Born, not a Citizen | 953 (96.0%) | 40 (4.0%) |
Health Insurance Coverage by Household Income in Cazenovia
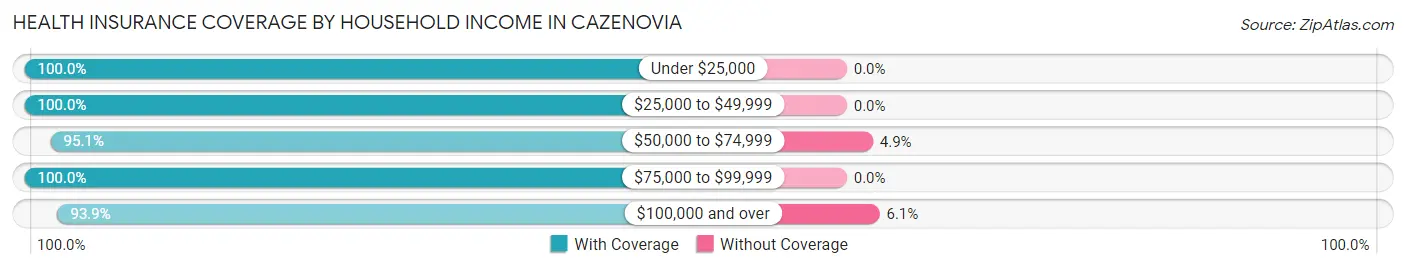
| Household Income | With Coverage | Without Coverage |
| Under $25,000 | 121 (100.0%) | 0 (0.0%) |
| $25,000 to $49,999 | 269 (100.0%) | 0 (0.0%) |
| $50,000 to $74,999 | 195 (95.1%) | 10 (4.9%) |
| $75,000 to $99,999 | 240 (100.0%) | 0 (0.0%) |
| $100,000 and over | 673 (93.9%) | 44 (6.1%) |
Public vs Private Health Insurance Coverage by Age in Cazenovia
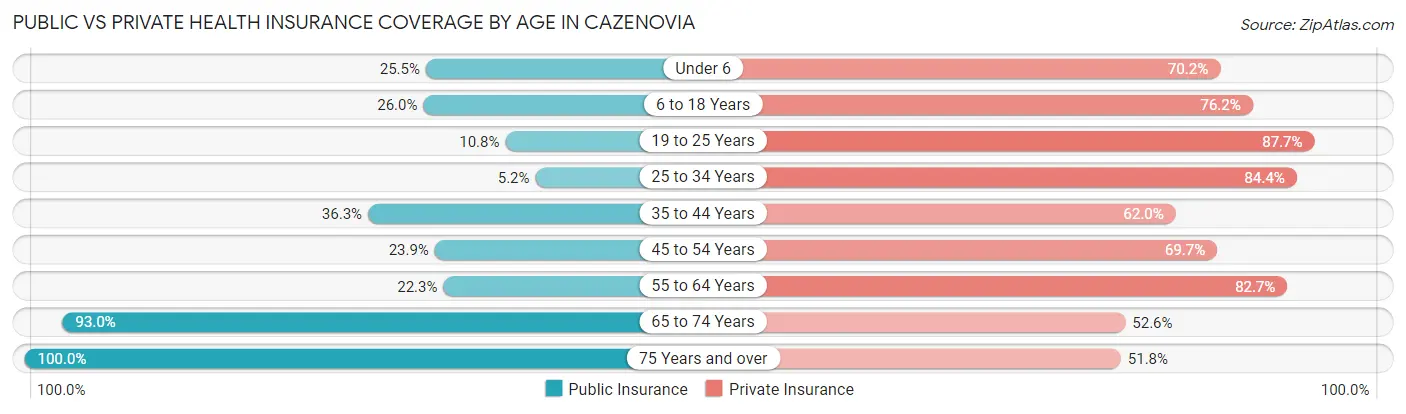
| Age Bracket | Public Insurance | Private Insurance |
| Under 6 | 12 (25.5%) | 33 (70.2%) |
| 6 to 18 Years | 162 (26.0%) | 475 (76.2%) |
| 19 to 25 Years | 107 (10.8%) | 871 (87.7%) |
| 25 to 34 Years | 8 (5.2%) | 130 (84.4%) |
| 35 to 44 Years | 82 (36.3%) | 140 (62.0%) |
| 45 to 54 Years | 48 (23.9%) | 140 (69.7%) |
| 55 to 64 Years | 45 (22.3%) | 167 (82.7%) |
| 65 to 74 Years | 159 (93.0%) | 90 (52.6%) |
| 75 Years and over | 139 (100.0%) | 72 (51.8%) |
| Total | 762 (27.7%) | 2,118 (76.8%) |
Disability Status by Sex by Age in Cazenovia
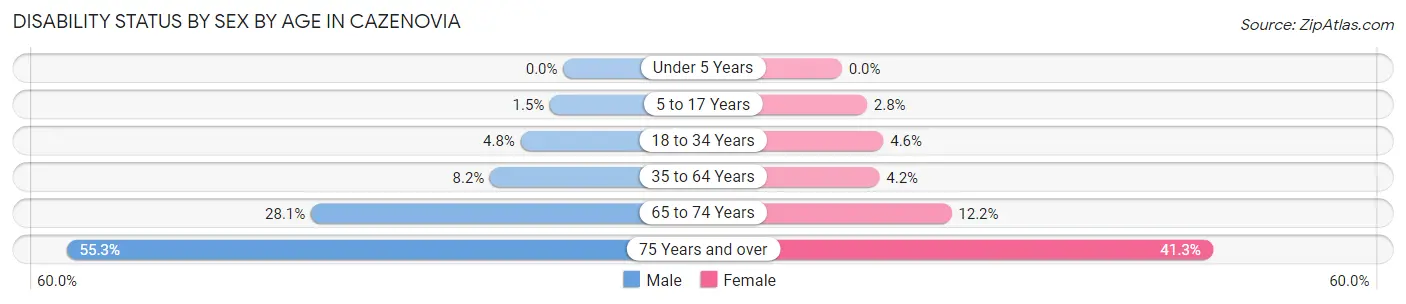
| Age Bracket | Male | Female |
| Under 5 Years | 0 (0.0%) | 0 (0.0%) |
| 5 to 17 Years | 2 (1.5%) | 5 (2.8%) |
| 18 to 34 Years | 24 (4.8%) | 44 (4.6%) |
| 35 to 64 Years | 22 (8.2%) | 15 (4.2%) |
| 65 to 74 Years | 25 (28.1%) | 10 (12.2%) |
| 75 Years and over | 26 (55.3%) | 38 (41.3%) |
Disability Class by Sex by Age in Cazenovia
Disability Class: Hearing Difficulty
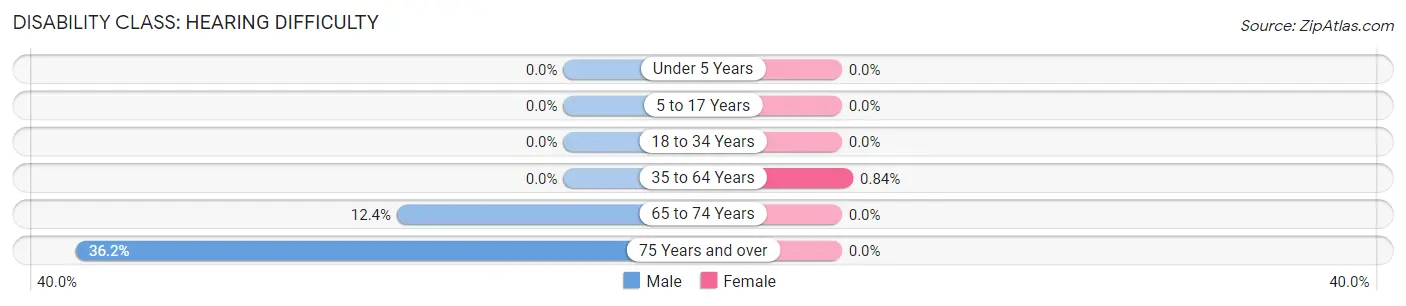
| Age Bracket | Male | Female |
| Under 5 Years | 0 (0.0%) | 0 (0.0%) |
| 5 to 17 Years | 0 (0.0%) | 0 (0.0%) |
| 18 to 34 Years | 0 (0.0%) | 0 (0.0%) |
| 35 to 64 Years | 0 (0.0%) | 3 (0.8%) |
| 65 to 74 Years | 11 (12.4%) | 0 (0.0%) |
| 75 Years and over | 17 (36.2%) | 0 (0.0%) |
Disability Class: Vision Difficulty
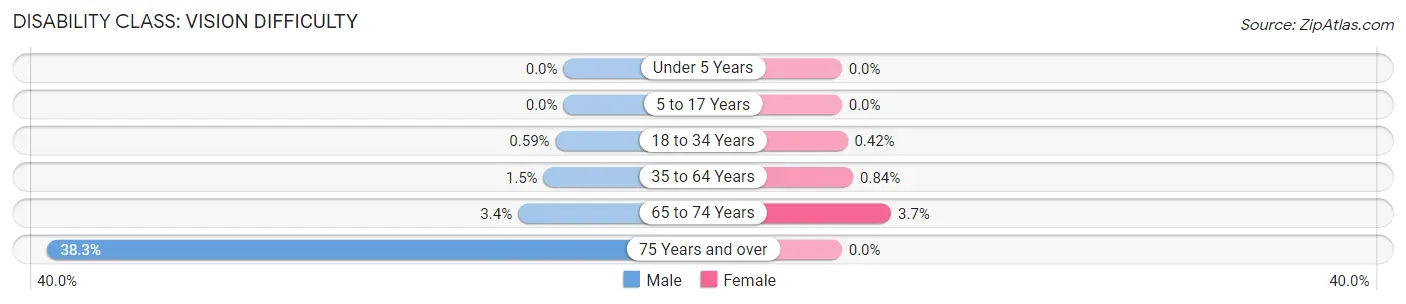
| Age Bracket | Male | Female |
| Under 5 Years | 0 (0.0%) | 0 (0.0%) |
| 5 to 17 Years | 0 (0.0%) | 0 (0.0%) |
| 18 to 34 Years | 3 (0.6%) | 4 (0.4%) |
| 35 to 64 Years | 4 (1.5%) | 3 (0.8%) |
| 65 to 74 Years | 3 (3.4%) | 3 (3.7%) |
| 75 Years and over | 18 (38.3%) | 0 (0.0%) |
Disability Class: Cognitive Difficulty
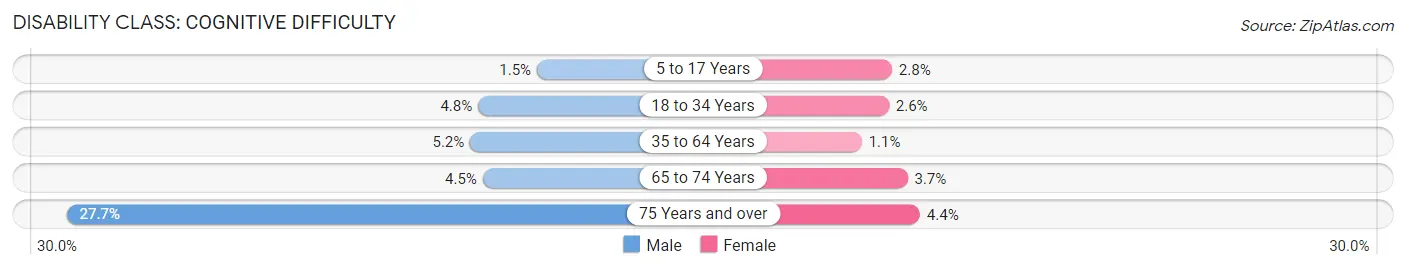
| Age Bracket | Male | Female |
| 5 to 17 Years | 2 (1.5%) | 5 (2.8%) |
| 18 to 34 Years | 24 (4.8%) | 25 (2.6%) |
| 35 to 64 Years | 14 (5.2%) | 4 (1.1%) |
| 65 to 74 Years | 4 (4.5%) | 3 (3.7%) |
| 75 Years and over | 13 (27.7%) | 4 (4.3%) |
Disability Class: Ambulatory Difficulty
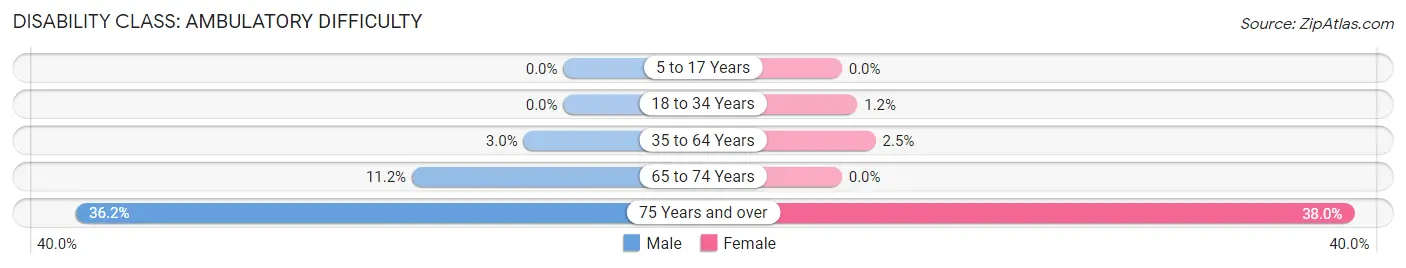
| Age Bracket | Male | Female |
| 5 to 17 Years | 0 (0.0%) | 0 (0.0%) |
| 18 to 34 Years | 0 (0.0%) | 11 (1.1%) |
| 35 to 64 Years | 8 (3.0%) | 9 (2.5%) |
| 65 to 74 Years | 10 (11.2%) | 0 (0.0%) |
| 75 Years and over | 17 (36.2%) | 35 (38.0%) |
Disability Class: Self-Care Difficulty
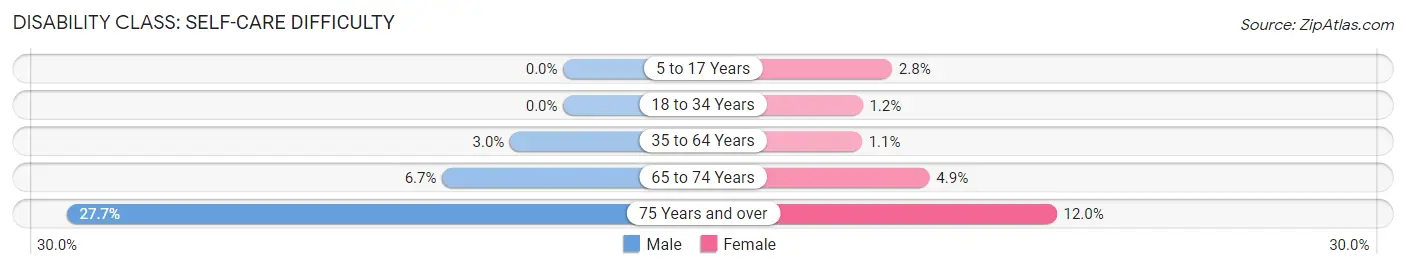
| Age Bracket | Male | Female |
| 5 to 17 Years | 0 (0.0%) | 5 (2.8%) |
| 18 to 34 Years | 0 (0.0%) | 11 (1.1%) |
| 35 to 64 Years | 8 (3.0%) | 4 (1.1%) |
| 65 to 74 Years | 6 (6.7%) | 4 (4.9%) |
| 75 Years and over | 13 (27.7%) | 11 (12.0%) |
Technology Access in Cazenovia
Computing Device Access in Cazenovia
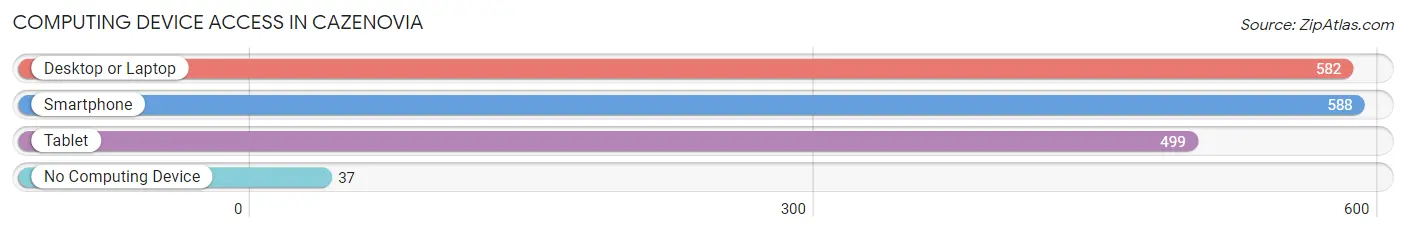
| Device Type | # Households | % Households |
| Desktop or Laptop | 582 | 85.5% |
| Smartphone | 588 | 86.3% |
| Tablet | 499 | 73.3% |
| No Computing Device | 37 | 5.4% |
| Total | 681 | 100.0% |
Internet Access in Cazenovia
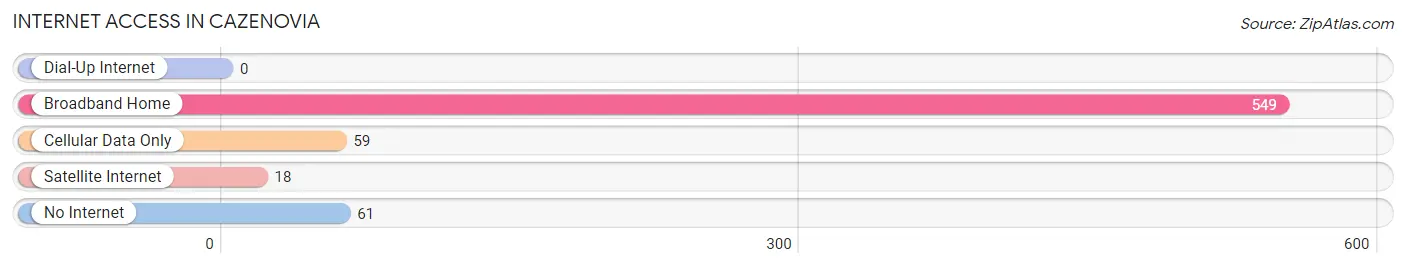
| Internet Type | # Households | % Households |
| Dial-Up Internet | 0 | 0.0% |
| Broadband Home | 549 | 80.6% |
| Cellular Data Only | 59 | 8.7% |
| Satellite Internet | 18 | 2.6% |
| No Internet | 61 | 9.0% |
| Total | 681 | 100.0% |
Cazenovia Summary
Cazenovia is a small village located in Madison County, New York. It is situated on the eastern shore of Cazenovia Lake, a popular recreational area. The village is home to about 2,800 people and is part of the Syracuse Metropolitan Statistical Area.
History
The area that is now Cazenovia was originally inhabited by the Oneida people. The first European settlers arrived in the area in 1793, led by John Lincklaen, a Dutch land agent. The village was named after Theophilus Cazenove, a Dutch financier who had helped finance the settlement.
The village was incorporated in 1810 and quickly became a popular destination for wealthy New Yorkers looking to escape the hustle and bustle of the city. The village was home to several prominent families, including the Lincklaens, the Fitches, and the Ledyards.
In the mid-19th century, Cazenovia became a popular summer resort destination. The village was home to several grand hotels, including the Cazenovia House and the Hotel Cazenovia. The village also became a popular destination for artists, writers, and musicians.
Geography
Cazenovia is located in Madison County, New York. It is situated on the eastern shore of Cazenovia Lake, a popular recreational area. The village is located about 20 miles southeast of Syracuse and about 30 miles west of Utica.
The village is located in the Finger Lakes region of New York. The area is known for its rolling hills, lush forests, and numerous lakes and streams. The village is also home to several parks and nature preserves, including the Cazenovia Lake State Park.
Economy
The economy of Cazenovia is largely based on tourism and agriculture. The village is home to several wineries, including the Cazenovia Winery and the Chateau LaFayette Reneau Winery. The village is also home to several small businesses, including restaurants, shops, and galleries.
The village is also home to several educational institutions, including Cazenovia College and Morrisville State College. The village is also home to several historic sites, including the Lorenzo State Historic Site and the Cazenovia Historic District.
Demographics
As of the 2010 census, the population of Cazenovia was 2,824. The racial makeup of the village was 97.2% White, 0.7% African American, 0.3% Native American, 0.7% Asian, and 0.9% from other races. Hispanic or Latino of any race were 1.7% of the population.
The median household income in Cazenovia was $50,938, and the median family income was $62,917. The per capita income for the village was $27,945. About 5.2% of families and 8.2% of the population were below the poverty line.
Cazenovia is a small village with a rich history and a vibrant economy. The village is home to several wineries, educational institutions, and historic sites. The village is also home to a diverse population, with a median household income that is higher than the national average.
Common Questions
What is Per Capita Income in Cazenovia?
Per Capita income in Cazenovia is $28,260.
What is the Median Family Income in Cazenovia?
Median Family Income in Cazenovia is $99,167.
What is the Median Household income in Cazenovia?
Median Household Income in Cazenovia is $77,260.
What is Income or Wage Gap in Cazenovia?
Income or Wage Gap in Cazenovia is 75.3%.
Women in Cazenovia earn 24.7 cents for every dollar earned by a man.
What is Inequality or Gini Index in Cazenovia?
Inequality or Gini Index in Cazenovia is 0.46.
What is the Total Population of Cazenovia?
Total Population of Cazenovia is 2,765.
What is the Total Male Population of Cazenovia?
Total Male Population of Cazenovia is 1,056.
What is the Total Female Population of Cazenovia?
Total Female Population of Cazenovia is 1,709.
What is the Ratio of Males per 100 Females in Cazenovia?
There are 61.79 Males per 100 Females in Cazenovia.
What is the Ratio of Females per 100 Males in Cazenovia?
There are 161.84 Females per 100 Males in Cazenovia.
What is the Median Population Age in Cazenovia?
Median Population Age in Cazenovia is 21.1 Years.
What is the Average Family Size in Cazenovia
Average Family Size in Cazenovia is 3.1 People.
What is the Average Household Size in Cazenovia
Average Household Size in Cazenovia is 2.3 People.
How Large is the Labor Force in Cazenovia?
There are 1,216 People in the Labor Forcein in Cazenovia.
What is the Percentage of People in the Labor Force in Cazenovia?
48.4% of People are in the Labor Force in Cazenovia.
What is the Unemployment Rate in Cazenovia?
Unemployment Rate in Cazenovia is 5.6%.