Cities with the Highest Percentage of Population Employed in Enterprise Management in New York
RELATED REPORTS & OPTIONS
Enterprise Management
New York
Compare Cities
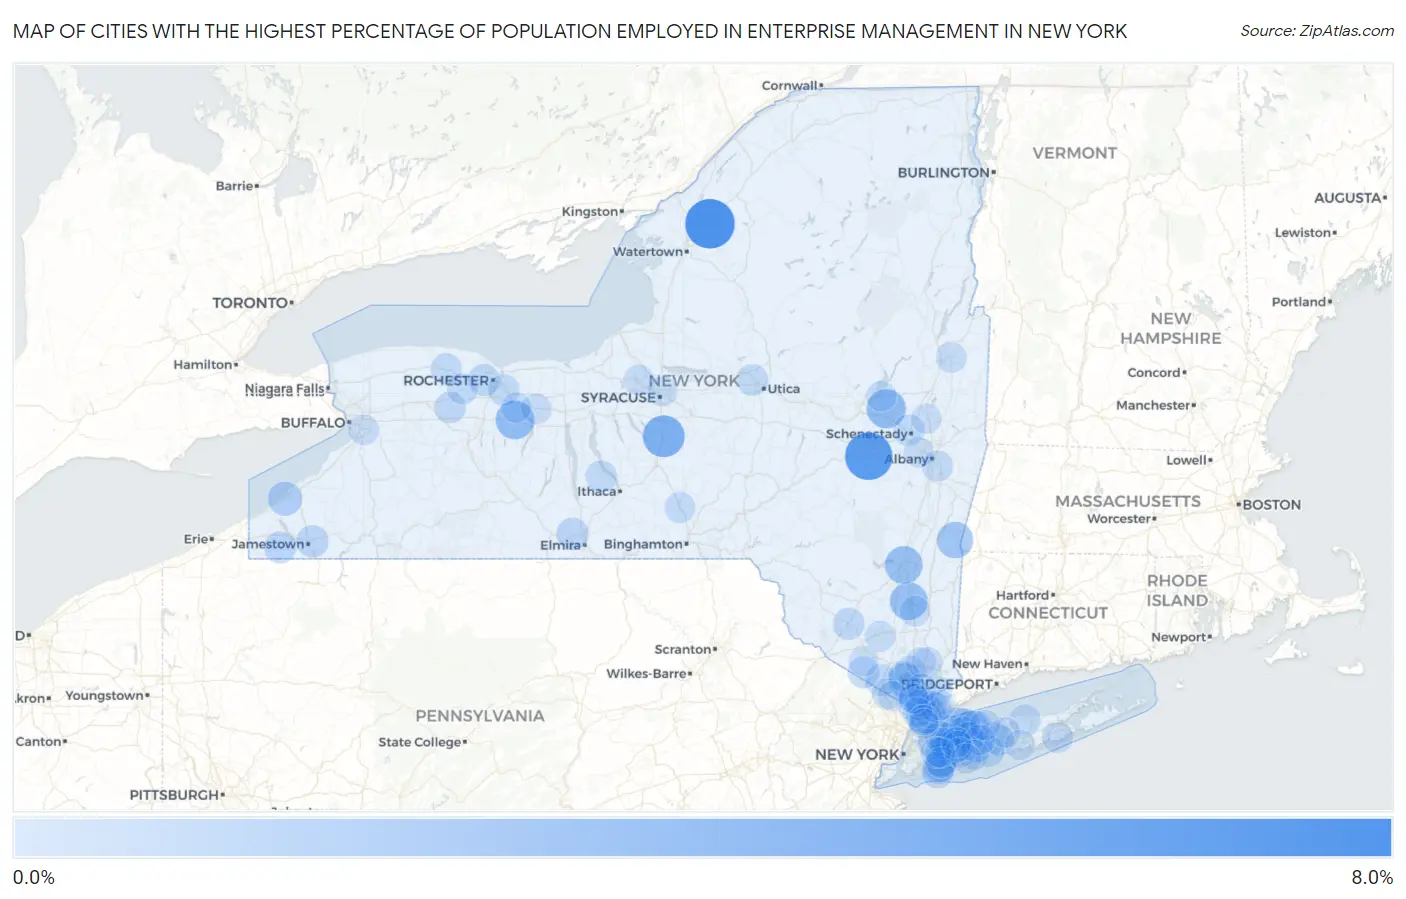
Map of Cities with the Highest Percentage of Population Employed in Enterprise Management in New York
0.0%
8.0%
Cities with the Highest Percentage of Population Employed in Enterprise Management in New York
| City | % Employed | vs State | vs National | |
| 1. | Philadelphia | 6.2% | 0.11%(+6.14)#1 | 0.14%(+6.11)#39 |
| 2. | Schoharie | 5.6% | 0.11%(+5.44)#2 | 0.14%(+5.42)#46 |
| 3. | Tully | 3.8% | 0.11%(+3.71)#3 | 0.14%(+3.68)#87 |
| 4. | Hagaman | 3.0% | 0.11%(+2.88)#4 | 0.14%(+2.85)#125 |
| 5. | Bloomfield | 2.8% | 0.11%(+2.71)#5 | 0.14%(+2.69)#141 |
| 6. | Highland | 2.6% | 0.11%(+2.46)#6 | 0.14%(+2.43)#173 |
| 7. | Lincoln Park | 2.5% | 0.11%(+2.42)#7 | 0.14%(+2.39)#178 |
| 8. | Taconic Shores | 2.1% | 0.11%(+1.99)#8 | 0.14%(+1.96)#226 |
| 9. | New Cassel | 1.9% | 0.11%(+1.76)#9 | 0.14%(+1.73)#268 |
| 10. | Centre Island | 1.7% | 0.11%(+1.55)#10 | 0.14%(+1.53)#315 |
| 11. | Tuckahoe | 1.6% | 0.11%(+1.48)#11 | 0.14%(+1.45)#332 |
| 12. | Halesite | 1.5% | 0.11%(+1.37)#12 | 0.14%(+1.35)#367 |
| 13. | Brocton | 1.4% | 0.11%(+1.31)#13 | 0.14%(+1.29)#387 |
| 14. | Tioga Terrace | 1.4% | 0.11%(+1.26)#14 | 0.14%(+1.23)#405 |
| 15. | West Haverstraw | 1.2% | 0.11%(+1.10)#15 | 0.14%(+1.07)#465 |
| 16. | Congers | 1.1% | 0.11%(+0.956)#16 | 0.14%(+0.930)#534 |
| 17. | Hewlett Neck | 1.1% | 0.11%(+0.956)#17 | 0.14%(+0.929)#537 |
| 18. | Greenville Cdp Westchester County | 1.0% | 0.11%(+0.928)#18 | 0.14%(+0.902)#559 |
| 19. | Carle Place | 1.0% | 0.11%(+0.912)#19 | 0.14%(+0.885)#573 |
| 20. | Malverne | 0.97% | 0.11%(+0.857)#20 | 0.14%(+0.830)#624 |
| 21. | Roslyn Harbor | 0.90% | 0.11%(+0.791)#21 | 0.14%(+0.764)#685 |
| 22. | Matinecock | 0.90% | 0.11%(+0.786)#22 | 0.14%(+0.760)#690 |
| 23. | Great Neck Estates | 0.90% | 0.11%(+0.785)#23 | 0.14%(+0.759)#692 |
| 24. | Falconer | 0.89% | 0.11%(+0.780)#24 | 0.14%(+0.753)#696 |
| 25. | Milton Cdp Saratoga County | 0.87% | 0.11%(+0.760)#25 | 0.14%(+0.733)#708 |
| 26. | Big Flats | 0.87% | 0.11%(+0.756)#26 | 0.14%(+0.729)#712 |
| 27. | Panama | 0.82% | 0.11%(+0.704)#27 | 0.14%(+0.678)#766 |
| 28. | East Atlantic Beach | 0.78% | 0.11%(+0.669)#28 | 0.14%(+0.643)#811 |
| 29. | Laurel Hollow | 0.78% | 0.11%(+0.665)#29 | 0.14%(+0.639)#816 |
| 30. | Wurtsboro | 0.77% | 0.11%(+0.656)#30 | 0.14%(+0.629)#832 |
| 31. | Tuxedo Park | 0.77% | 0.11%(+0.655)#31 | 0.14%(+0.629)#835 |
| 32. | Warwick | 0.76% | 0.11%(+0.651)#32 | 0.14%(+0.625)#840 |
| 33. | Piermont | 0.76% | 0.11%(+0.648)#33 | 0.14%(+0.621)#847 |
| 34. | Gates | 0.72% | 0.11%(+0.610)#34 | 0.14%(+0.584)#892 |
| 35. | Eastchester | 0.72% | 0.11%(+0.606)#35 | 0.14%(+0.579)#901 |
| 36. | Le Roy | 0.71% | 0.11%(+0.595)#36 | 0.14%(+0.569)#919 |
| 37. | Melville | 0.70% | 0.11%(+0.583)#37 | 0.14%(+0.557)#937 |
| 38. | Oriskany | 0.68% | 0.11%(+0.570)#38 | 0.14%(+0.544)#954 |
| 39. | Roslyn Heights | 0.67% | 0.11%(+0.554)#39 | 0.14%(+0.528)#971 |
| 40. | Pittsford | 0.66% | 0.11%(+0.549)#40 | 0.14%(+0.522)#982 |
| 41. | Wheatley Heights | 0.65% | 0.11%(+0.538)#41 | 0.14%(+0.511)#1,001 |
| 42. | Hauppauge | 0.63% | 0.11%(+0.519)#42 | 0.14%(+0.493)#1,026 |
| 43. | Islandia | 0.63% | 0.11%(+0.519)#43 | 0.14%(+0.493)#1,027 |
| 44. | Scarsdale | 0.63% | 0.11%(+0.519)#44 | 0.14%(+0.492)#1,028 |
| 45. | Trumansburg | 0.63% | 0.11%(+0.518)#45 | 0.14%(+0.491)#1,033 |
| 46. | Bay Shore | 0.62% | 0.11%(+0.511)#46 | 0.14%(+0.485)#1,046 |
| 47. | Scotia | 0.62% | 0.11%(+0.510)#47 | 0.14%(+0.484)#1,049 |
| 48. | Hewlett Harbor | 0.61% | 0.11%(+0.503)#48 | 0.14%(+0.476)#1,062 |
| 49. | Port Washington | 0.61% | 0.11%(+0.501)#49 | 0.14%(+0.475)#1,066 |
| 50. | Holley | 0.60% | 0.11%(+0.490)#50 | 0.14%(+0.463)#1,087 |
| 51. | Buchanan | 0.59% | 0.11%(+0.483)#51 | 0.14%(+0.456)#1,098 |
| 52. | Armonk | 0.57% | 0.11%(+0.460)#52 | 0.14%(+0.434)#1,142 |
| 53. | Suffern | 0.57% | 0.11%(+0.458)#53 | 0.14%(+0.432)#1,145 |
| 54. | Nyack | 0.57% | 0.11%(+0.457)#54 | 0.14%(+0.430)#1,150 |
| 55. | Rocky Point | 0.56% | 0.11%(+0.451)#55 | 0.14%(+0.425)#1,167 |
| 56. | East Greenbush | 0.54% | 0.11%(+0.425)#56 | 0.14%(+0.398)#1,234 |
| 57. | Centerport | 0.54% | 0.11%(+0.423)#57 | 0.14%(+0.396)#1,238 |
| 58. | Churchville | 0.51% | 0.11%(+0.396)#58 | 0.14%(+0.370)#1,300 |
| 59. | Bellerose | 0.51% | 0.11%(+0.394)#59 | 0.14%(+0.368)#1,305 |
| 60. | Whitney Point | 0.51% | 0.11%(+0.393)#60 | 0.14%(+0.366)#1,310 |
| 61. | West Hills | 0.50% | 0.11%(+0.385)#61 | 0.14%(+0.358)#1,337 |
| 62. | Lynbrook | 0.47% | 0.11%(+0.360)#62 | 0.14%(+0.334)#1,402 |
| 63. | Stony Point | 0.47% | 0.11%(+0.358)#63 | 0.14%(+0.332)#1,406 |
| 64. | Westhampton | 0.47% | 0.11%(+0.355)#64 | 0.14%(+0.328)#1,414 |
| 65. | Lloyd Harbor | 0.46% | 0.11%(+0.345)#65 | 0.14%(+0.318)#1,437 |
| 66. | Spackenkill | 0.45% | 0.11%(+0.343)#66 | 0.14%(+0.316)#1,440 |
| 67. | Irvington | 0.44% | 0.11%(+0.329)#67 | 0.14%(+0.302)#1,480 |
| 68. | Hicksville | 0.43% | 0.11%(+0.313)#68 | 0.14%(+0.287)#1,532 |
| 69. | Maybrook | 0.43% | 0.11%(+0.313)#69 | 0.14%(+0.286)#1,533 |
| 70. | Baldwinsville | 0.42% | 0.11%(+0.306)#70 | 0.14%(+0.280)#1,548 |
| 71. | Hudson Falls | 0.42% | 0.11%(+0.304)#71 | 0.14%(+0.278)#1,556 |
| 72. | Jefferson Valley Yorktown | 0.41% | 0.11%(+0.296)#72 | 0.14%(+0.269)#1,585 |
| 73. | Manchester | 0.40% | 0.11%(+0.285)#73 | 0.14%(+0.258)#1,631 |
| 74. | Tarrytown | 0.39% | 0.11%(+0.275)#74 | 0.14%(+0.249)#1,668 |
| 75. | West Seneca | 0.38% | 0.11%(+0.268)#75 | 0.14%(+0.241)#1,692 |
| 76. | Lake Grove | 0.36% | 0.11%(+0.251)#76 | 0.14%(+0.224)#1,770 |
| 77. | White Plains | 0.35% | 0.11%(+0.236)#77 | 0.14%(+0.210)#1,822 |
| 78. | Harrison | 0.33% | 0.11%(+0.217)#78 | 0.14%(+0.191)#1,909 |
| 79. | Country Knolls | 0.33% | 0.11%(+0.213)#79 | 0.14%(+0.186)#1,921 |
| 80. | Rye Brook | 0.32% | 0.11%(+0.208)#80 | 0.14%(+0.181)#1,940 |
| 81. | Dix Hills | 0.32% | 0.11%(+0.204)#81 | 0.14%(+0.177)#1,962 |
| 82. | Westmere | 0.31% | 0.11%(+0.203)#82 | 0.14%(+0.176)#1,968 |
| 83. | North Lindenhurst | 0.31% | 0.11%(+0.200)#83 | 0.14%(+0.174)#1,978 |
| 84. | Fort Salonga | 0.31% | 0.11%(+0.194)#84 | 0.14%(+0.167)#2,005 |
| 85. | Victor | 0.31% | 0.11%(+0.194)#85 | 0.14%(+0.167)#2,006 |
| 86. | Broadalbin | 0.30% | 0.11%(+0.192)#86 | 0.14%(+0.166)#2,016 |
| 87. | Lake Mohegan | 0.30% | 0.11%(+0.189)#87 | 0.14%(+0.163)#2,042 |
| 88. | Briarcliff Manor | 0.30% | 0.11%(+0.188)#88 | 0.14%(+0.162)#2,046 |
| 89. | Lyncourt | 0.30% | 0.11%(+0.185)#89 | 0.14%(+0.158)#2,066 |
| 90. | Airmont | 0.29% | 0.11%(+0.176)#90 | 0.14%(+0.149)#2,113 |
| 91. | Levittown | 0.29% | 0.11%(+0.175)#91 | 0.14%(+0.149)#2,118 |
| 92. | Jericho | 0.28% | 0.11%(+0.167)#92 | 0.14%(+0.141)#2,153 |
| 93. | Massapequa Park | 0.28% | 0.11%(+0.167)#93 | 0.14%(+0.140)#2,156 |
| 94. | Hastings On Hudson | 0.27% | 0.11%(+0.158)#94 | 0.14%(+0.131)#2,203 |
| 95. | South Nyack | 0.26% | 0.11%(+0.152)#95 | 0.14%(+0.126)#2,238 |
| 96. | Florida | 0.26% | 0.11%(+0.148)#96 | 0.14%(+0.121)#2,262 |
| 97. | East Patchogue | 0.26% | 0.11%(+0.146)#97 | 0.14%(+0.120)#2,269 |
| 98. | Stewart Manor | 0.26% | 0.11%(+0.146)#98 | 0.14%(+0.119)#2,272 |
| 99. | Bronxville | 0.25% | 0.11%(+0.140)#99 | 0.14%(+0.114)#2,310 |
| 100. | Mount Vernon | 0.24% | 0.11%(+0.132)#100 | 0.14%(+0.105)#2,358 |
Common Questions
What are the Top 10 Cities with the Highest Percentage of Population Employed in Enterprise Management in New York?
Top 10 Cities with the Highest Percentage of Population Employed in Enterprise Management in New York are:
#1
6.2%
#2
5.6%
#3
3.8%
#4
3.0%
#5
2.8%
#6
2.6%
#7
2.5%
#8
2.1%
#9
1.9%
#10
1.7%
What city has the Highest Percentage of Population Employed in Enterprise Management in New York?
Philadelphia has the Highest Percentage of Population Employed in Enterprise Management in New York with 6.2%.
What is the Percentage of Population Employed in Enterprise Management in the State of New York?
Percentage of Population Employed in Enterprise Management in New York is 0.11%.
What is the Percentage of Population Employed in Enterprise Management in the United States?
Percentage of Population Employed in Enterprise Management in the United States is 0.14%.