Cities with the Largest Colombian Community in New York
RELATED REPORTS & OPTIONS
Colombian
New York
Compare Cities
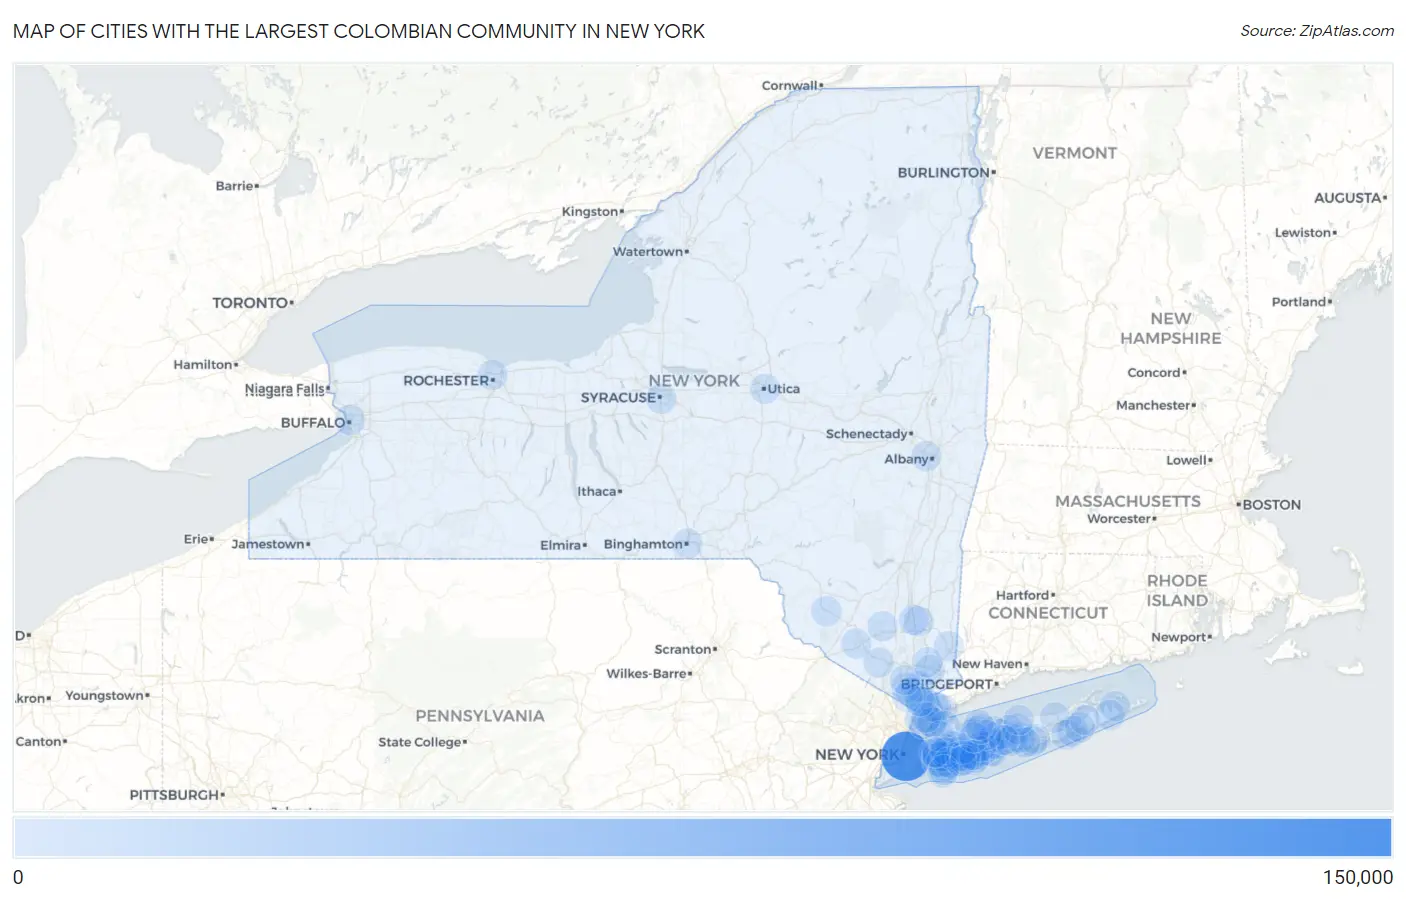
Map of Cities with the Largest Colombian Community in New York
0
150,000
Cities with the Largest Colombian Community in New York
| City | Colombian | vs State | vs National | |
| 1. | New York | 109,862 | 180,228(60.96%)#1 | 1,357,798(8.09%)#1 |
| 2. | White Plains | 2,275 | 180,228(1.26%)#2 | 1,357,798(0.17%)#72 |
| 3. | Yonkers | 2,112 | 180,228(1.17%)#3 | 1,357,798(0.16%)#79 |
| 4. | Hicksville | 1,879 | 180,228(1.04%)#4 | 1,357,798(0.14%)#87 |
| 5. | Brentwood | 1,790 | 180,228(0.99%)#5 | 1,357,798(0.13%)#91 |
| 6. | Port Chester | 1,748 | 180,228(0.97%)#6 | 1,357,798(0.13%)#95 |
| 7. | Hampton Bays | 1,696 | 180,228(0.94%)#7 | 1,357,798(0.12%)#99 |
| 8. | Bay Shore | 1,553 | 180,228(0.86%)#8 | 1,357,798(0.11%)#112 |
| 9. | New Rochelle | 1,499 | 180,228(0.83%)#9 | 1,357,798(0.11%)#115 |
| 10. | Levittown | 1,329 | 180,228(0.74%)#10 | 1,357,798(0.10%)#131 |
| 11. | Valley Stream | 1,226 | 180,228(0.68%)#11 | 1,357,798(0.09%)#141 |
| 12. | Elmont | 1,010 | 180,228(0.56%)#12 | 1,357,798(0.07%)#180 |
| 13. | Hempstead | 960 | 180,228(0.53%)#13 | 1,357,798(0.07%)#188 |
| 14. | Freeport | 880 | 180,228(0.49%)#14 | 1,357,798(0.06%)#209 |
| 15. | Ossining | 878 | 180,228(0.49%)#15 | 1,357,798(0.06%)#210 |
| 16. | Greenlawn | 867 | 180,228(0.48%)#16 | 1,357,798(0.06%)#212 |
| 17. | Mount Vernon | 722 | 180,228(0.40%)#17 | 1,357,798(0.05%)#255 |
| 18. | Long Beach | 700 | 180,228(0.39%)#18 | 1,357,798(0.05%)#263 |
| 19. | Middletown | 670 | 180,228(0.37%)#19 | 1,357,798(0.05%)#274 |
| 20. | Riverhead | 636 | 180,228(0.35%)#20 | 1,357,798(0.05%)#292 |
| 21. | Uniondale | 606 | 180,228(0.34%)#21 | 1,357,798(0.04%)#313 |
| 22. | Centereach | 584 | 180,228(0.32%)#22 | 1,357,798(0.04%)#326 |
| 23. | Syracuse | 579 | 180,228(0.32%)#23 | 1,357,798(0.04%)#327 |
| 24. | North Valley Stream | 575 | 180,228(0.32%)#24 | 1,357,798(0.04%)#329 |
| 25. | West Hempstead | 551 | 180,228(0.31%)#25 | 1,357,798(0.04%)#341 |
| 26. | Central Islip | 536 | 180,228(0.30%)#26 | 1,357,798(0.04%)#349 |
| 27. | East Quogue | 534 | 180,228(0.30%)#27 | 1,357,798(0.04%)#351 |
| 28. | Elmsford | 531 | 180,228(0.29%)#28 | 1,357,798(0.04%)#353 |
| 29. | East Meadow | 513 | 180,228(0.28%)#29 | 1,357,798(0.04%)#373 |
| 30. | Huntington Station | 510 | 180,228(0.28%)#30 | 1,357,798(0.04%)#375 |
| 31. | West Babylon | 489 | 180,228(0.27%)#31 | 1,357,798(0.04%)#398 |
| 32. | Buffalo | 481 | 180,228(0.27%)#32 | 1,357,798(0.04%)#412 |
| 33. | Islip | 466 | 180,228(0.26%)#33 | 1,357,798(0.03%)#427 |
| 34. | Monticello | 445 | 180,228(0.25%)#34 | 1,357,798(0.03%)#446 |
| 35. | North Bay Shore | 425 | 180,228(0.24%)#35 | 1,357,798(0.03%)#463 |
| 36. | Franklin Square | 422 | 180,228(0.23%)#36 | 1,357,798(0.03%)#464 |
| 37. | Westbury | 417 | 180,228(0.23%)#37 | 1,357,798(0.03%)#470 |
| 38. | Oceanside | 413 | 180,228(0.23%)#38 | 1,357,798(0.03%)#475 |
| 39. | Smithtown | 400 | 180,228(0.22%)#39 | 1,357,798(0.03%)#488 |
| 40. | Sleepy Hollow | 399 | 180,228(0.22%)#40 | 1,357,798(0.03%)#489 |
| 41. | Holtsville | 395 | 180,228(0.22%)#41 | 1,357,798(0.03%)#496 |
| 42. | Rochester | 386 | 180,228(0.21%)#42 | 1,357,798(0.03%)#511 |
| 43. | Floral Park | 386 | 180,228(0.21%)#43 | 1,357,798(0.03%)#513 |
| 44. | Hauppauge | 370 | 180,228(0.21%)#44 | 1,357,798(0.03%)#530 |
| 45. | Lynbrook | 369 | 180,228(0.20%)#45 | 1,357,798(0.03%)#531 |
| 46. | Nesconset | 368 | 180,228(0.20%)#46 | 1,357,798(0.03%)#532 |
| 47. | South Farmingdale | 360 | 180,228(0.20%)#47 | 1,357,798(0.03%)#537 |
| 48. | Copiague | 358 | 180,228(0.20%)#48 | 1,357,798(0.03%)#541 |
| 49. | North Bellmore | 342 | 180,228(0.19%)#49 | 1,357,798(0.03%)#561 |
| 50. | Glen Cove | 334 | 180,228(0.19%)#50 | 1,357,798(0.02%)#574 |
| 51. | Lindenhurst | 333 | 180,228(0.18%)#51 | 1,357,798(0.02%)#576 |
| 52. | Harrison | 329 | 180,228(0.18%)#52 | 1,357,798(0.02%)#584 |
| 53. | Holbrook | 325 | 180,228(0.18%)#53 | 1,357,798(0.02%)#592 |
| 54. | Medford | 318 | 180,228(0.18%)#54 | 1,357,798(0.02%)#604 |
| 55. | Albany | 307 | 180,228(0.17%)#55 | 1,357,798(0.02%)#624 |
| 56. | North Babylon | 305 | 180,228(0.17%)#56 | 1,357,798(0.02%)#628 |
| 57. | Springs | 295 | 180,228(0.16%)#57 | 1,357,798(0.02%)#650 |
| 58. | Coram | 291 | 180,228(0.16%)#58 | 1,357,798(0.02%)#661 |
| 59. | Mineola | 280 | 180,228(0.16%)#59 | 1,357,798(0.02%)#688 |
| 60. | Myers Corner | 279 | 180,228(0.15%)#60 | 1,357,798(0.02%)#691 |
| 61. | Walden | 279 | 180,228(0.15%)#61 | 1,357,798(0.02%)#692 |
| 62. | Yorktown Heights | 276 | 180,228(0.15%)#62 | 1,357,798(0.02%)#697 |
| 63. | New City | 275 | 180,228(0.15%)#63 | 1,357,798(0.02%)#699 |
| 64. | Valley Cottage | 270 | 180,228(0.15%)#64 | 1,357,798(0.02%)#709 |
| 65. | Port Washington | 264 | 180,228(0.15%)#65 | 1,357,798(0.02%)#728 |
| 66. | North Wantagh | 263 | 180,228(0.15%)#66 | 1,357,798(0.02%)#729 |
| 67. | Walton Park | 258 | 180,228(0.14%)#67 | 1,357,798(0.02%)#736 |
| 68. | Mastic | 257 | 180,228(0.14%)#68 | 1,357,798(0.02%)#740 |
| 69. | Deer Park | 255 | 180,228(0.14%)#69 | 1,357,798(0.02%)#746 |
| 70. | East Hampton North | 252 | 180,228(0.14%)#70 | 1,357,798(0.02%)#754 |
| 71. | Commack | 251 | 180,228(0.14%)#71 | 1,357,798(0.02%)#758 |
| 72. | Garden City | 250 | 180,228(0.14%)#72 | 1,357,798(0.02%)#768 |
| 73. | Shirley | 249 | 180,228(0.14%)#73 | 1,357,798(0.02%)#770 |
| 74. | Brewster Hill | 239 | 180,228(0.13%)#74 | 1,357,798(0.02%)#795 |
| 75. | North Amityville | 235 | 180,228(0.13%)#75 | 1,357,798(0.02%)#806 |
| 76. | Baldwin | 232 | 180,228(0.13%)#76 | 1,357,798(0.02%)#816 |
| 77. | North Massapequa | 228 | 180,228(0.13%)#77 | 1,357,798(0.02%)#832 |
| 78. | North Bellport | 226 | 180,228(0.13%)#78 | 1,357,798(0.02%)#838 |
| 79. | Massapequa | 224 | 180,228(0.12%)#79 | 1,357,798(0.02%)#846 |
| 80. | Bethpage | 222 | 180,228(0.12%)#80 | 1,357,798(0.02%)#850 |
| 81. | North Lindenhurst | 221 | 180,228(0.12%)#81 | 1,357,798(0.02%)#855 |
| 82. | Jefferson Valley Yorktown | 218 | 180,228(0.12%)#82 | 1,357,798(0.02%)#863 |
| 83. | North Sea | 211 | 180,228(0.12%)#83 | 1,357,798(0.02%)#886 |
| 84. | Seaford | 206 | 180,228(0.11%)#84 | 1,357,798(0.02%)#900 |
| 85. | South Huntington | 199 | 180,228(0.11%)#85 | 1,357,798(0.01%)#932 |
| 86. | West Nyack | 199 | 180,228(0.11%)#86 | 1,357,798(0.01%)#933 |
| 87. | Shinnecock Hills | 199 | 180,228(0.11%)#87 | 1,357,798(0.01%)#935 |
| 88. | East Northport | 195 | 180,228(0.11%)#88 | 1,357,798(0.01%)#945 |
| 89. | Miller Place | 195 | 180,228(0.11%)#89 | 1,357,798(0.01%)#946 |
| 90. | Larchmont | 195 | 180,228(0.11%)#90 | 1,357,798(0.01%)#947 |
| 91. | Ronkonkoma | 193 | 180,228(0.11%)#91 | 1,357,798(0.01%)#953 |
| 92. | Island Park | 189 | 180,228(0.10%)#92 | 1,357,798(0.01%)#973 |
| 93. | Binghamton | 188 | 180,228(0.10%)#93 | 1,357,798(0.01%)#976 |
| 94. | Eastchester | 188 | 180,228(0.10%)#94 | 1,357,798(0.01%)#977 |
| 95. | Tarrytown | 187 | 180,228(0.10%)#95 | 1,357,798(0.01%)#986 |
| 96. | Northport | 184 | 180,228(0.10%)#96 | 1,357,798(0.01%)#1,001 |
| 97. | Utica | 183 | 180,228(0.10%)#97 | 1,357,798(0.01%)#1,002 |
| 98. | West Haverstraw | 183 | 180,228(0.10%)#98 | 1,357,798(0.01%)#1,003 |
| 99. | Bellerose Terrace | 182 | 180,228(0.10%)#99 | 1,357,798(0.01%)#1,009 |
| 100. | Wappingers Falls | 181 | 180,228(0.10%)#100 | 1,357,798(0.01%)#1,018 |
Common Questions
What are the Top 10 Cities with the Largest Colombian Community in New York?
Top 10 Cities with the Largest Colombian Community in New York are:
#1
109,862
#2
2,275
#3
2,112
#4
1,879
#5
1,790
#6
1,748
#7
1,696
#8
1,553
#9
1,499
#10
1,329
What city has the Largest Colombian Community in New York?
New York has the Largest Colombian Community in New York with 109,862.
What is the Total Colombian Population in the State of New York?
Total Colombian Population in New York is 180,228.
What is the Total Colombian Population in the United States?
Total Colombian Population in the United States is 1,357,798.