DeKalb Junction, NY Map & Demographics
DeKalb Junction Map
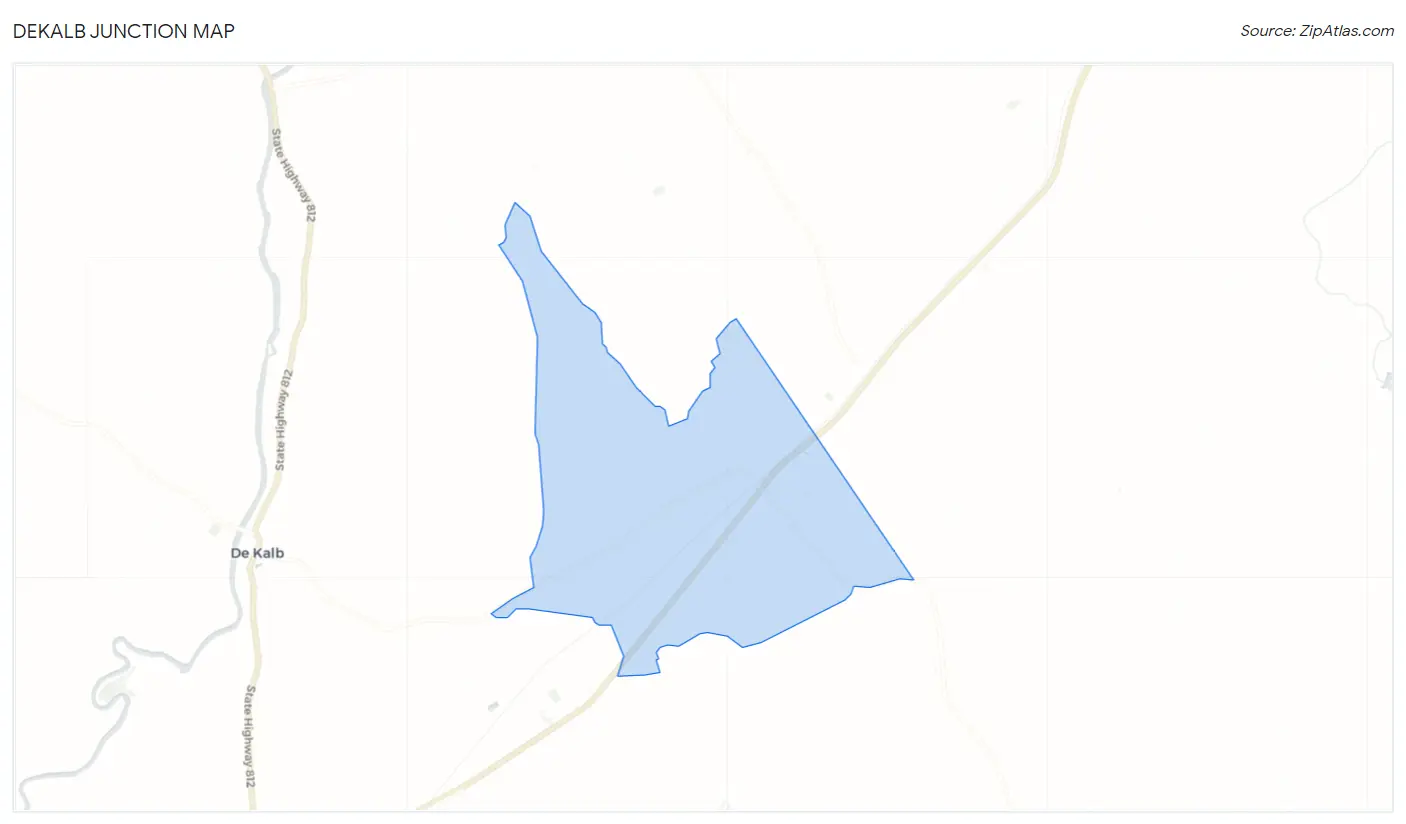
DeKalb Junction Overview
$19,275
PER CAPITA INCOME
$43,417
AVG FAMILY INCOME
$44,583
AVG HOUSEHOLD INCOME
41.2%
WAGE / INCOME GAP [ % ]
58.8¢/ $1
WAGE / INCOME GAP [ $ ]
0.36
INEQUALITY / GINI INDEX
645
TOTAL POPULATION
381
MALE POPULATION
264
FEMALE POPULATION
144.32
MALES / 100 FEMALES
69.29
FEMALES / 100 MALES
42.4
MEDIAN AGE
3.3
AVG FAMILY SIZE
3.1
AVG HOUSEHOLD SIZE
265
LABOR FORCE [ PEOPLE ]
48.8%
PERCENT IN LABOR FORCE
2.6%
UNEMPLOYMENT RATE
Income in DeKalb Junction
Income Overview in DeKalb Junction
Per Capita Income in DeKalb Junction is $19,275, while median incomes of families and households are $43,417 and $44,583 respectively.
| Characteristic | Number | Measure |
| Per Capita Income | 645 | $19,275 |
| Median Family Income | 159 | $43,417 |
| Mean Family Income | 159 | $52,711 |
| Median Household Income | 199 | $44,583 |
| Mean Household Income | 199 | $60,612 |
| Income Deficit | 159 | $0 |
| Wage / Income Gap (%) | 645 | 41.17% |
| Wage / Income Gap ($) | 645 | 58.83¢ per $1 |
| Gini / Inequality Index | 645 | 0.36 |
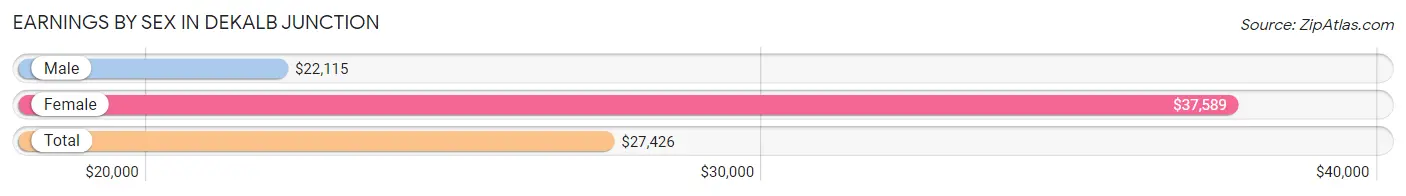
Earnings by Sex in DeKalb Junction
Average Earnings in DeKalb Junction are $27,426, $22,115 for men and $37,589 for women, a difference of 41.2%.
| Sex | Number | Average Earnings |
| Male | 150 (57.0%) | $22,115 |
| Female | 113 (43.0%) | $37,589 |
| Total | 263 (100.0%) | $27,426 |
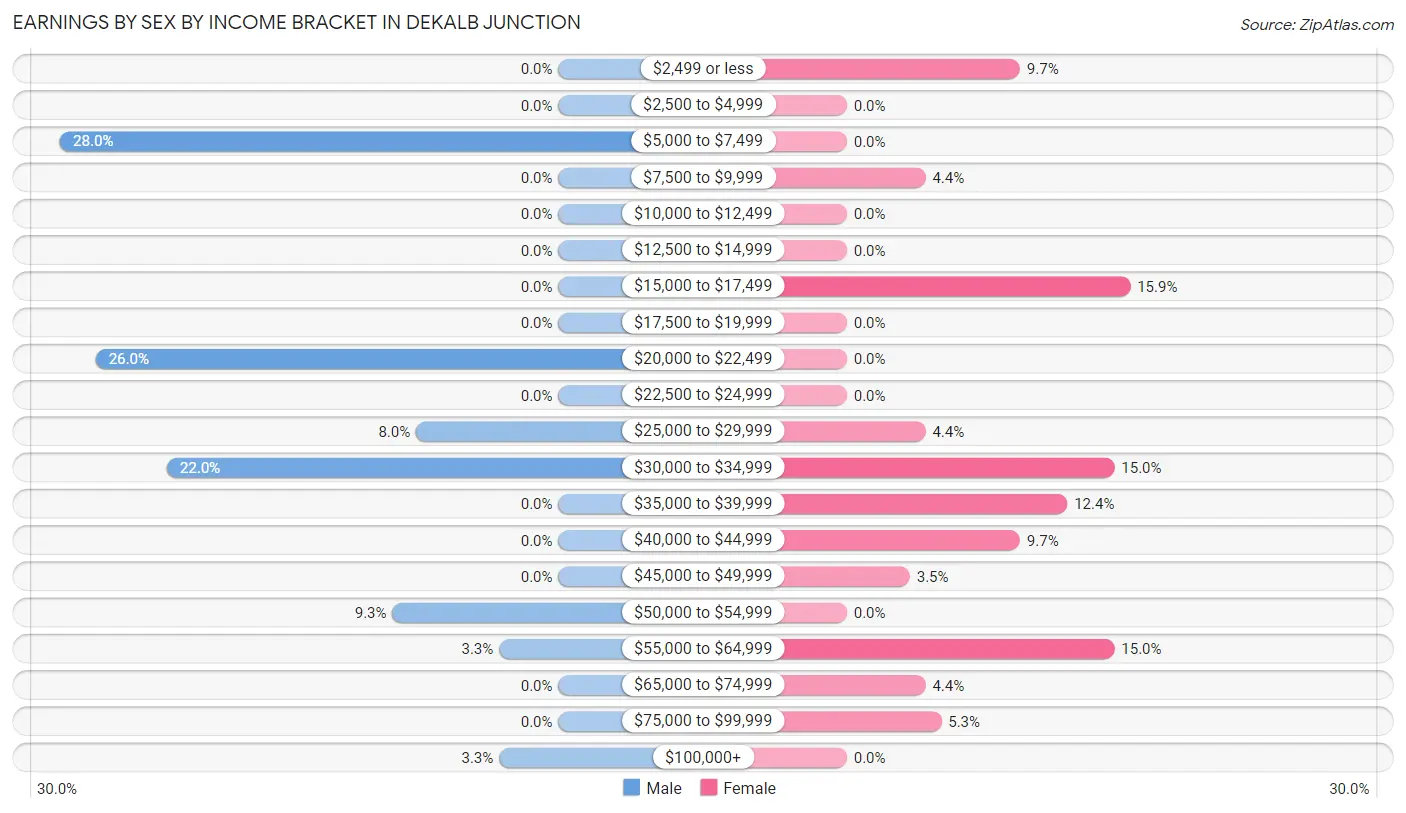
Earnings by Sex by Income Bracket in DeKalb Junction
The most common earnings brackets in DeKalb Junction are $5,000 to $7,499 for men (42 | 28.0%) and $15,000 to $17,499 for women (18 | 15.9%).
| Income | Male | Female |
| $2,499 or less | 0 (0.0%) | 11 (9.7%) |
| $2,500 to $4,999 | 0 (0.0%) | 0 (0.0%) |
| $5,000 to $7,499 | 42 (28.0%) | 0 (0.0%) |
| $7,500 to $9,999 | 0 (0.0%) | 5 (4.4%) |
| $10,000 to $12,499 | 0 (0.0%) | 0 (0.0%) |
| $12,500 to $14,999 | 0 (0.0%) | 0 (0.0%) |
| $15,000 to $17,499 | 0 (0.0%) | 18 (15.9%) |
| $17,500 to $19,999 | 0 (0.0%) | 0 (0.0%) |
| $20,000 to $22,499 | 39 (26.0%) | 0 (0.0%) |
| $22,500 to $24,999 | 0 (0.0%) | 0 (0.0%) |
| $25,000 to $29,999 | 12 (8.0%) | 5 (4.4%) |
| $30,000 to $34,999 | 33 (22.0%) | 17 (15.0%) |
| $35,000 to $39,999 | 0 (0.0%) | 14 (12.4%) |
| $40,000 to $44,999 | 0 (0.0%) | 11 (9.7%) |
| $45,000 to $49,999 | 0 (0.0%) | 4 (3.5%) |
| $50,000 to $54,999 | 14 (9.3%) | 0 (0.0%) |
| $55,000 to $64,999 | 5 (3.3%) | 17 (15.0%) |
| $65,000 to $74,999 | 0 (0.0%) | 5 (4.4%) |
| $75,000 to $99,999 | 0 (0.0%) | 6 (5.3%) |
| $100,000+ | 5 (3.3%) | 0 (0.0%) |
| Total | 150 (100.0%) | 113 (100.0%) |
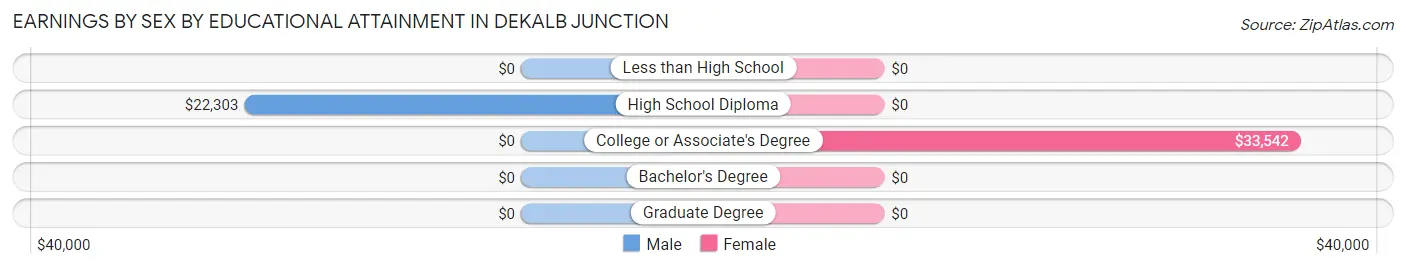
Earnings by Sex by Educational Attainment in DeKalb Junction
Average earnings in DeKalb Junction are $30,152 for men and $38,482 for women, a difference of 21.6%. Men with an educational attainment of high school diploma enjoy the highest average annual earnings of $22,303, while those with high school diploma education earn the least with $22,303. Women with an educational attainment of college or associate's degree earn the most with the average annual earnings of $33,542, while those with college or associate's degree education have the smallest earnings of $33,542.
| Educational Attainment | Male Income | Female Income |
| Less than High School | - | - |
| High School Diploma | $22,303 | $0 |
| College or Associate's Degree | - | - |
| Bachelor's Degree | - | - |
| Graduate Degree | - | - |
| Total | $30,152 | $38,482 |
Family Income in DeKalb Junction
Family Income Brackets in DeKalb Junction
According to the DeKalb Junction family income data, there are 40 families falling into the $25,000 to $34,999 income range, which is the most common income bracket and makes up 25.2% of all families.
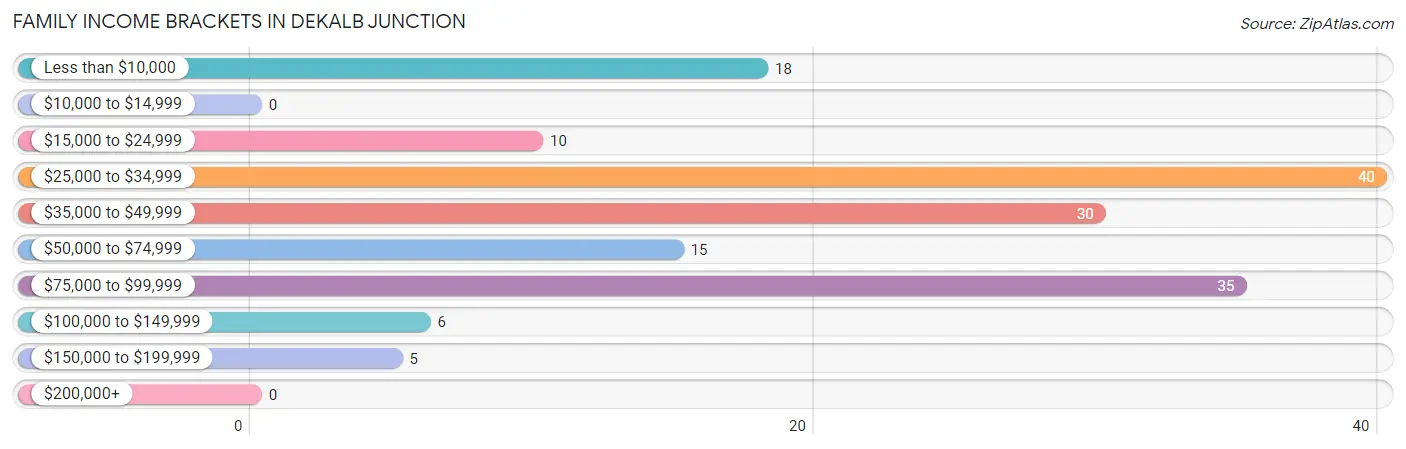
| Income Bracket | # Families | % Families |
| Less than $10,000 | 18 | 11.3% |
| $10,000 to $14,999 | 0 | 0.0% |
| $15,000 to $24,999 | 10 | 6.3% |
| $25,000 to $34,999 | 40 | 25.2% |
| $35,000 to $49,999 | 30 | 18.9% |
| $50,000 to $74,999 | 15 | 9.4% |
| $75,000 to $99,999 | 35 | 22.0% |
| $100,000 to $149,999 | 6 | 3.8% |
| $150,000 to $199,999 | 5 | 3.1% |
| $200,000+ | 0 | 0.0% |
Family Income by Famaliy Size in DeKalb Junction
3-person families (15 | 9.4%) account for the highest median family income in DeKalb Junction with $86,750 per family, while 3-person families (15 | 9.4%) have the highest median income of $28,917 per family member.
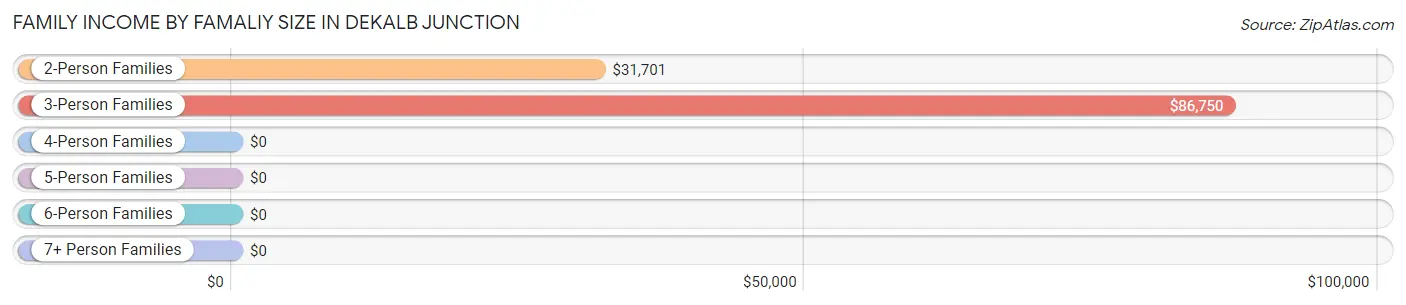
| Income Bracket | # Families | Median Income |
| 2-Person Families | 69 (43.4%) | $31,701 |
| 3-Person Families | 15 (9.4%) | $86,750 |
| 4-Person Families | 24 (15.1%) | $0 |
| 5-Person Families | 32 (20.1%) | $0 |
| 6-Person Families | 0 (0.0%) | $0 |
| 7+ Person Families | 19 (11.9%) | $0 |
| Total | 159 (100.0%) | $43,417 |
Family Income by Number of Earners in DeKalb Junction
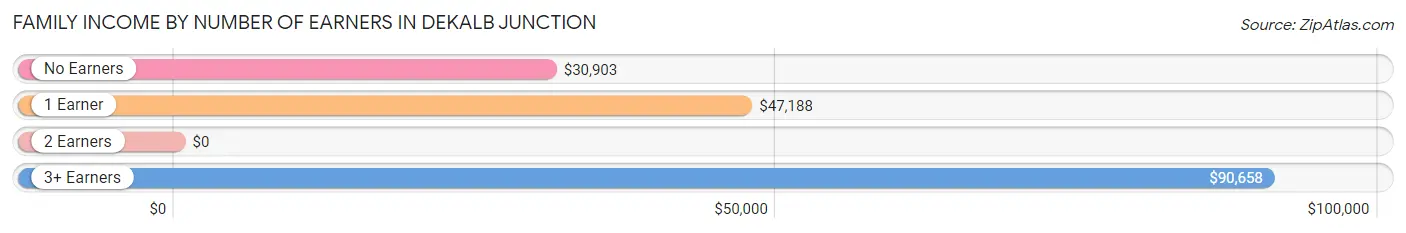
| Number of Earners | # Families | Median Income |
| No Earners | 70 (44.0%) | $30,903 |
| 1 Earner | 33 (20.7%) | $47,188 |
| 2 Earners | 16 (10.1%) | $0 |
| 3+ Earners | 40 (25.2%) | $90,658 |
| Total | 159 (100.0%) | $43,417 |
Household Income in DeKalb Junction
Household Income Brackets in DeKalb Junction
With 52 households falling in the category, the $25,000 to $34,999 income range is the most frequent in DeKalb Junction, accounting for 26.1% of all households.
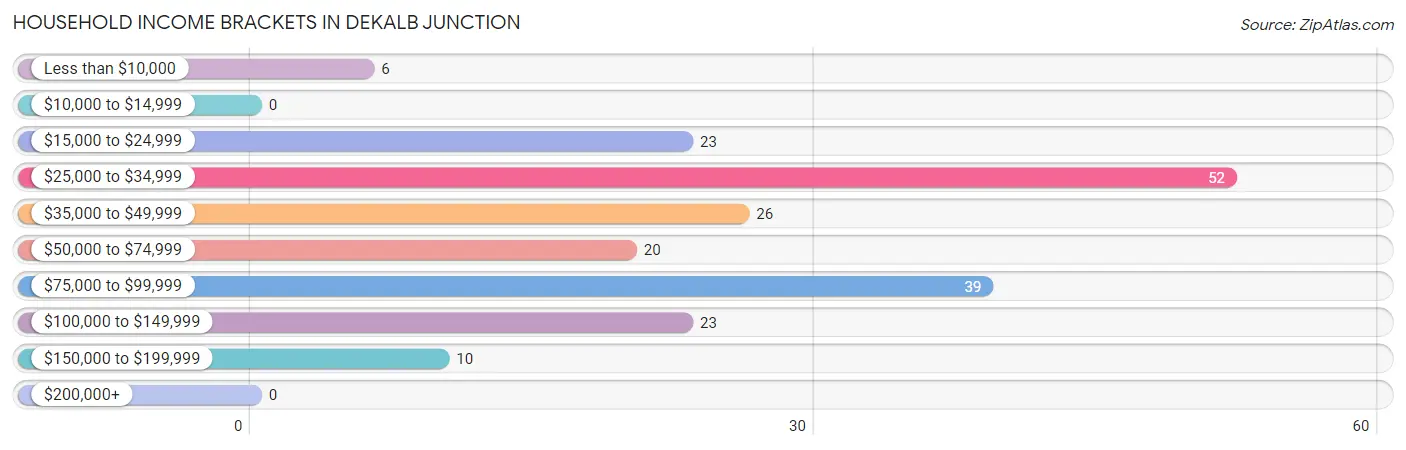
| Income Bracket | # Households | % Households |
| Less than $10,000 | 6 | 3.0% |
| $10,000 to $14,999 | 0 | 0.0% |
| $15,000 to $24,999 | 23 | 11.6% |
| $25,000 to $34,999 | 52 | 26.1% |
| $35,000 to $49,999 | 26 | 13.1% |
| $50,000 to $74,999 | 20 | 10.1% |
| $75,000 to $99,999 | 39 | 19.6% |
| $100,000 to $149,999 | 23 | 11.6% |
| $150,000 to $199,999 | 10 | 5.0% |
| $200,000+ | 0 | 0.0% |
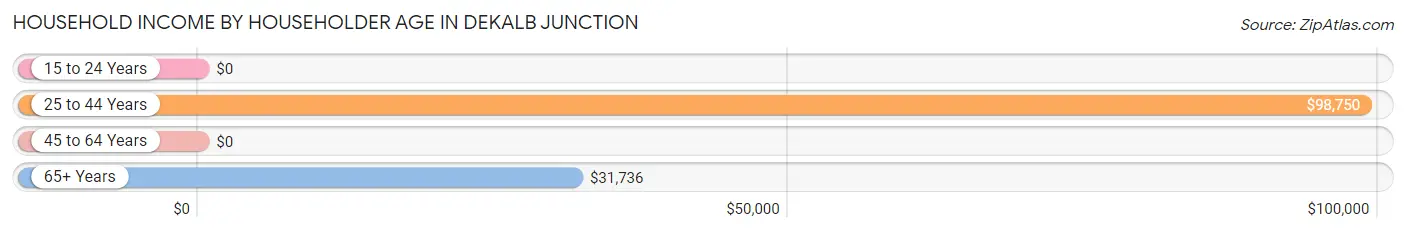
Household Income by Householder Age in DeKalb Junction
The median household income in DeKalb Junction is $44,583, with the highest median household income of $98,750 found in the 25 to 44 years age bracket for the primary householder. A total of 50 households (25.1%) fall into this category.
| Income Bracket | # Households | Median Income |
| 15 to 24 Years | 0 (0.0%) | $0 |
| 25 to 44 Years | 50 (25.1%) | $98,750 |
| 45 to 64 Years | 73 (36.7%) | $0 |
| 65+ Years | 76 (38.2%) | $31,736 |
| Total | 199 (100.0%) | $44,583 |
Poverty in DeKalb Junction
Income Below Poverty by Sex and Age in DeKalb Junction
With 15.5% poverty level for males and 22.7% for females among the residents of DeKalb Junction, 5 year old males and 25 to 34 year old females are the most vulnerable to poverty, with 5 males (100.0%) and 12 females (100.0%) in their respective age groups living below the poverty level.
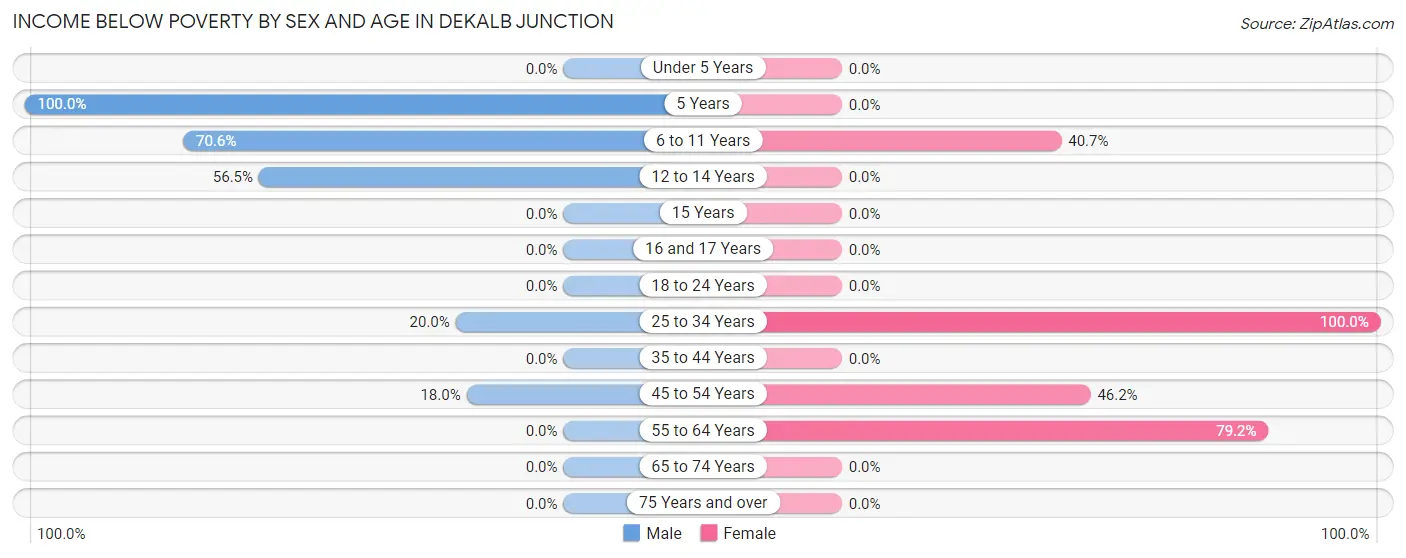
| Age Bracket | Male | Female |
| Under 5 Years | 0 (0.0%) | 0 (0.0%) |
| 5 Years | 5 (100.0%) | 0 (0.0%) |
| 6 to 11 Years | 12 (70.6%) | 11 (40.7%) |
| 12 to 14 Years | 13 (56.5%) | 0 (0.0%) |
| 15 Years | 0 (0.0%) | 0 (0.0%) |
| 16 and 17 Years | 0 (0.0%) | 0 (0.0%) |
| 18 to 24 Years | 0 (0.0%) | 0 (0.0%) |
| 25 to 34 Years | 13 (20.0%) | 12 (100.0%) |
| 35 to 44 Years | 0 (0.0%) | 0 (0.0%) |
| 45 to 54 Years | 16 (18.0%) | 18 (46.2%) |
| 55 to 64 Years | 0 (0.0%) | 19 (79.2%) |
| 65 to 74 Years | 0 (0.0%) | 0 (0.0%) |
| 75 Years and over | 0 (0.0%) | 0 (0.0%) |
| Total | 59 (15.5%) | 60 (22.7%) |
Income Above Poverty by Sex and Age in DeKalb Junction
According to the poverty statistics in DeKalb Junction, males aged under 5 years and females aged 12 to 14 years are the age groups that are most secure financially, with 100.0% of males and 100.0% of females in these age groups living above the poverty line.
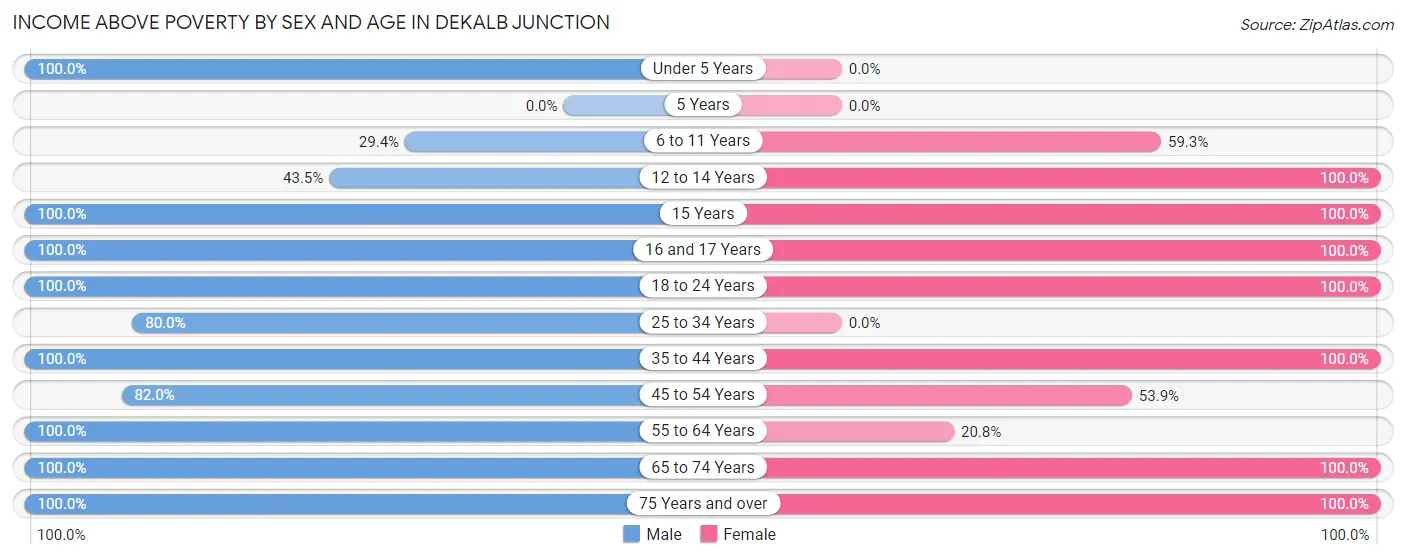
| Age Bracket | Male | Female |
| Under 5 Years | 7 (100.0%) | 0 (0.0%) |
| 5 Years | 0 (0.0%) | 0 (0.0%) |
| 6 to 11 Years | 5 (29.4%) | 16 (59.3%) |
| 12 to 14 Years | 10 (43.5%) | 5 (100.0%) |
| 15 Years | 5 (100.0%) | 13 (100.0%) |
| 16 and 17 Years | 17 (100.0%) | 5 (100.0%) |
| 18 to 24 Years | 40 (100.0%) | 28 (100.0%) |
| 25 to 34 Years | 52 (80.0%) | 0 (0.0%) |
| 35 to 44 Years | 15 (100.0%) | 72 (100.0%) |
| 45 to 54 Years | 73 (82.0%) | 21 (53.8%) |
| 55 to 64 Years | 12 (100.0%) | 5 (20.8%) |
| 65 to 74 Years | 59 (100.0%) | 8 (100.0%) |
| 75 Years and over | 27 (100.0%) | 31 (100.0%) |
| Total | 322 (84.5%) | 204 (77.3%) |
Income Below Poverty Among Married-Couple Families in DeKalb Junction
The poverty statistics for married-couple families in DeKalb Junction show that 14.0% or 16 of the total 114 families live below the poverty line. Families with 1 or 2 children have the highest poverty rate of 23.1%, comprising of 6 families. On the other hand, families with no children have the lowest poverty rate of 11.4%, which includes 10 families.
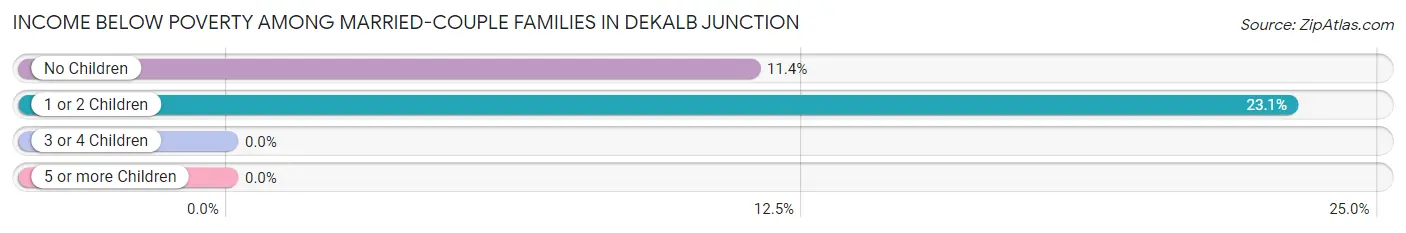
| Children | Above Poverty | Below Poverty |
| No Children | 78 (88.6%) | 10 (11.4%) |
| 1 or 2 Children | 20 (76.9%) | 6 (23.1%) |
| 3 or 4 Children | 0 (0.0%) | 0 (0.0%) |
| 5 or more Children | 0 (0.0%) | 0 (0.0%) |
| Total | 98 (86.0%) | 16 (14.0%) |
Income Below Poverty Among Single-Parent Households in DeKalb Junction
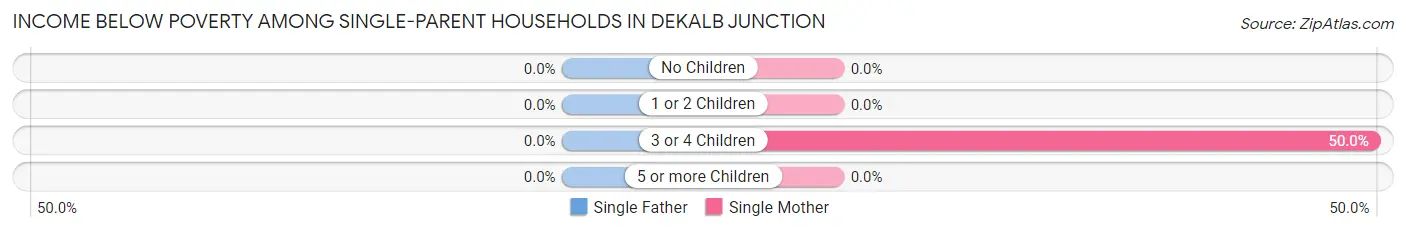
| Children | Single Father | Single Mother |
| No Children | 0 (0.0%) | 0 (0.0%) |
| 1 or 2 Children | 0 (0.0%) | 0 (0.0%) |
| 3 or 4 Children | 0 (0.0%) | 12 (50.0%) |
| 5 or more Children | 0 (0.0%) | 0 (0.0%) |
| Total | 0 (0.0%) | 12 (30.0%) |
Income Below Poverty Among Married-Couple vs Single-Parent Households in DeKalb Junction
The poverty data for DeKalb Junction shows that 16 of the married-couple family households (14.0%) and 12 of the single-parent households (26.7%) are living below the poverty level. Within the married-couple family households, those with 1 or 2 children have the highest poverty rate, with 6 households (23.1%) falling below the poverty line. Among the single-parent households, those with 3 or 4 children have the highest poverty rate, with 12 household (50.0%) living below poverty.
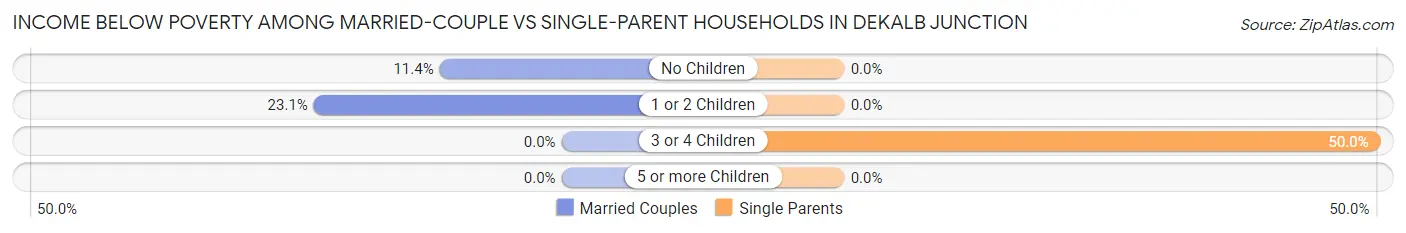
| Children | Married-Couple Families | Single-Parent Households |
| No Children | 10 (11.4%) | 0 (0.0%) |
| 1 or 2 Children | 6 (23.1%) | 0 (0.0%) |
| 3 or 4 Children | 0 (0.0%) | 12 (50.0%) |
| 5 or more Children | 0 (0.0%) | 0 (0.0%) |
| Total | 16 (14.0%) | 12 (26.7%) |
Race in DeKalb Junction
The most populous races in DeKalb Junction are White / Caucasian (619 | 96.0%), Two or more Races (17 | 2.6%), and Black / African American (5 | 0.8%).
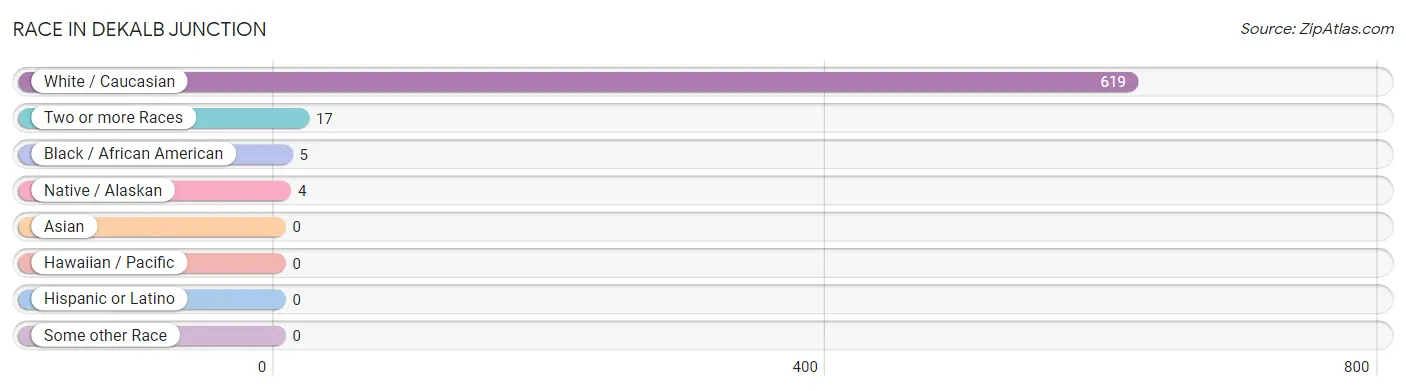
| Race | # Population | % Population |
| Asian | 0 | 0.0% |
| Black / African American | 5 | 0.8% |
| Hawaiian / Pacific | 0 | 0.0% |
| Hispanic or Latino | 0 | 0.0% |
| Native / Alaskan | 4 | 0.6% |
| White / Caucasian | 619 | 96.0% |
| Two or more Races | 17 | 2.6% |
| Some other Race | 0 | 0.0% |
| Total | 645 | 100.0% |
Ancestry in DeKalb Junction
The most populous ancestries reported in DeKalb Junction are German (115 | 17.8%), Irish (99 | 15.3%), French (94 | 14.6%), French Canadian (45 | 7.0%), and Scottish (32 | 5.0%), together accounting for 59.7% of all DeKalb Junction residents.
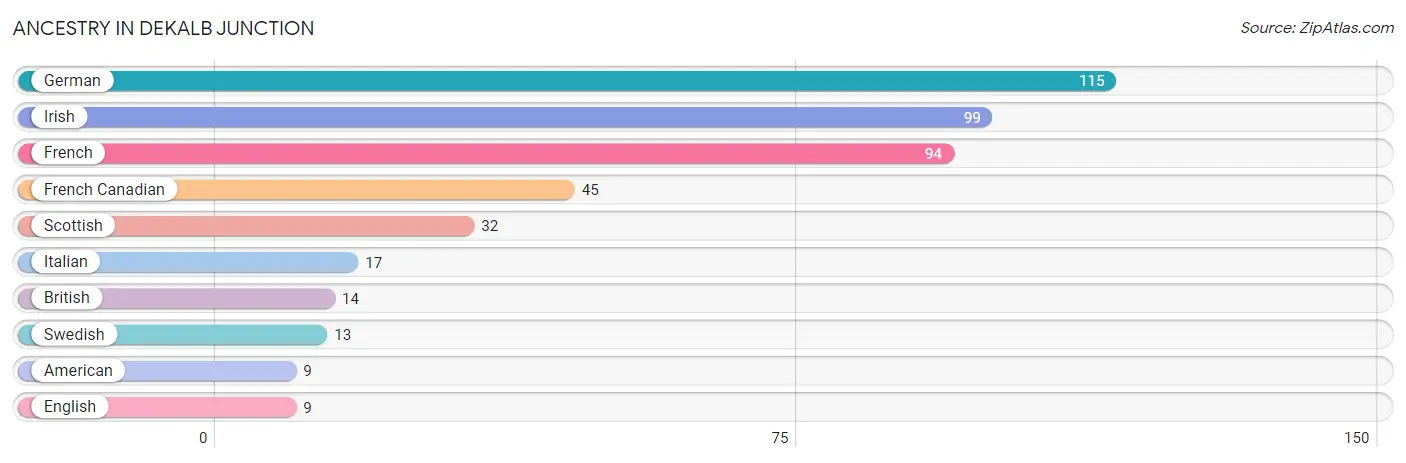
| Ancestry | # Population | % Population |
| American | 9 | 1.4% |
| British | 14 | 2.2% |
| English | 9 | 1.4% |
| French | 94 | 14.6% |
| French Canadian | 45 | 7.0% |
| German | 115 | 17.8% |
| Irish | 99 | 15.3% |
| Italian | 17 | 2.6% |
| Scottish | 32 | 5.0% |
| Swedish | 13 | 2.0% | View All 10 Rows |
Immigrants in DeKalb Junction

| Immigration Origin | # Population | % Population | View All 0 Rows |
Sex and Age in DeKalb Junction
Sex and Age in DeKalb Junction
The most populous age groups in DeKalb Junction are 45 to 49 Years (57 | 15.0%) for men and 40 to 44 Years (46 | 17.4%) for women.
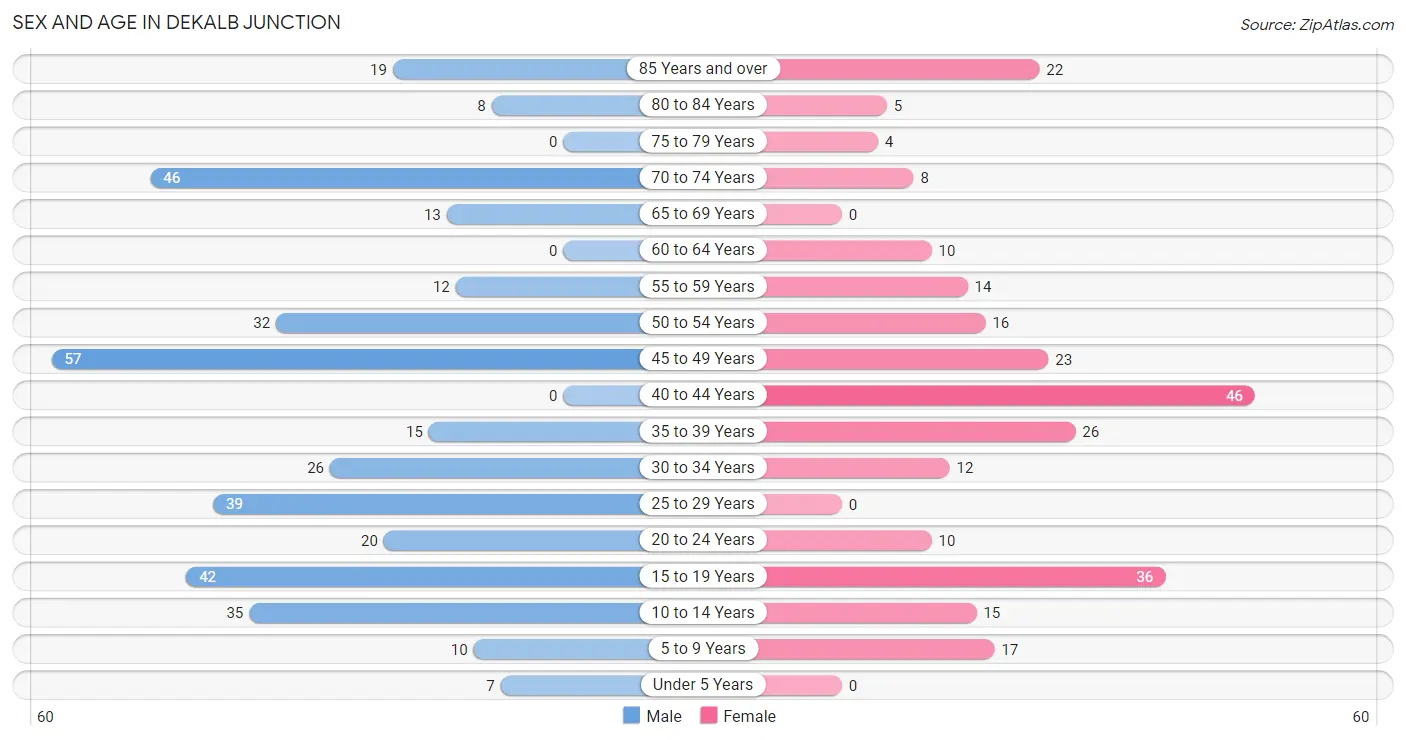
| Age Bracket | Male | Female |
| Under 5 Years | 7 (1.8%) | 0 (0.0%) |
| 5 to 9 Years | 10 (2.6%) | 17 (6.4%) |
| 10 to 14 Years | 35 (9.2%) | 15 (5.7%) |
| 15 to 19 Years | 42 (11.0%) | 36 (13.6%) |
| 20 to 24 Years | 20 (5.2%) | 10 (3.8%) |
| 25 to 29 Years | 39 (10.2%) | 0 (0.0%) |
| 30 to 34 Years | 26 (6.8%) | 12 (4.5%) |
| 35 to 39 Years | 15 (3.9%) | 26 (9.9%) |
| 40 to 44 Years | 0 (0.0%) | 46 (17.4%) |
| 45 to 49 Years | 57 (15.0%) | 23 (8.7%) |
| 50 to 54 Years | 32 (8.4%) | 16 (6.1%) |
| 55 to 59 Years | 12 (3.2%) | 14 (5.3%) |
| 60 to 64 Years | 0 (0.0%) | 10 (3.8%) |
| 65 to 69 Years | 13 (3.4%) | 0 (0.0%) |
| 70 to 74 Years | 46 (12.1%) | 8 (3.0%) |
| 75 to 79 Years | 0 (0.0%) | 4 (1.5%) |
| 80 to 84 Years | 8 (2.1%) | 5 (1.9%) |
| 85 Years and over | 19 (5.0%) | 22 (8.3%) |
| Total | 381 (100.0%) | 264 (100.0%) |
Families and Households in DeKalb Junction
Median Family Size in DeKalb Junction
The median family size in DeKalb Junction is 3.28 persons per family, with single female/mother families (40 | 25.2%) accounting for the largest median family size of 3.83 persons per family. On the other hand, single male/father families (5 | 3.1%) represent the smallest median family size with 2.00 persons per family.
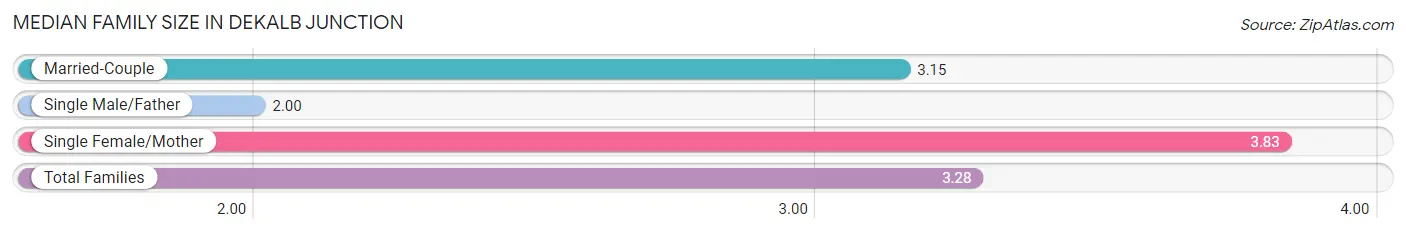
| Family Type | # Families | Family Size |
| Married-Couple | 114 (71.7%) | 3.15 |
| Single Male/Father | 5 (3.1%) | 2.00 |
| Single Female/Mother | 40 (25.2%) | 3.83 |
| Total Families | 159 (100.0%) | 3.28 |
Median Household Size in DeKalb Junction
The median household size in DeKalb Junction is 3.15 persons per household, with single female/mother households (40 | 20.1%) accounting for the largest median household size of 4.95 persons per household. non-family households (40 | 20.1%) represent the smallest median household size with 1.35 persons per household.
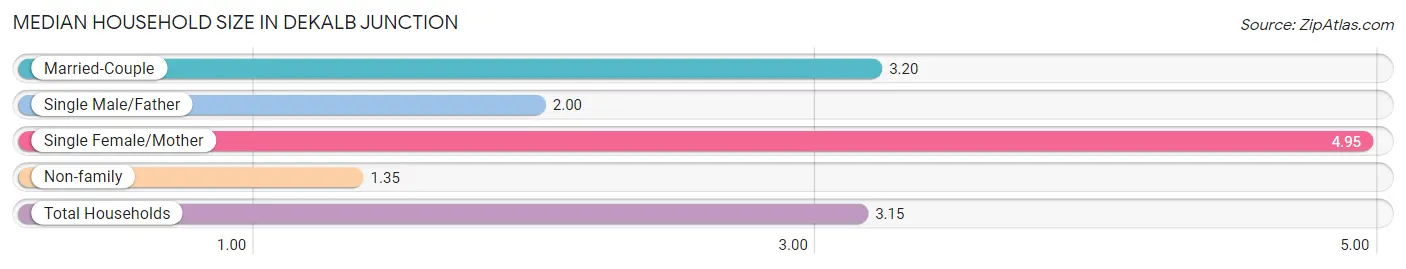
| Household Type | # Households | Household Size |
| Married-Couple | 114 (57.3%) | 3.20 |
| Single Male/Father | 5 (2.5%) | 2.00 |
| Single Female/Mother | 40 (20.1%) | 4.95 |
| Non-family | 40 (20.1%) | 1.35 |
| Total Households | 199 (100.0%) | 3.15 |
Household Size by Marriage Status in DeKalb Junction
Out of a total of 199 households in DeKalb Junction, 159 (79.9%) are family households, while 40 (20.1%) are nonfamily households. The most numerous type of family households are 2-person households, comprising 69, and the most common type of nonfamily households are 1-person households, comprising 23.
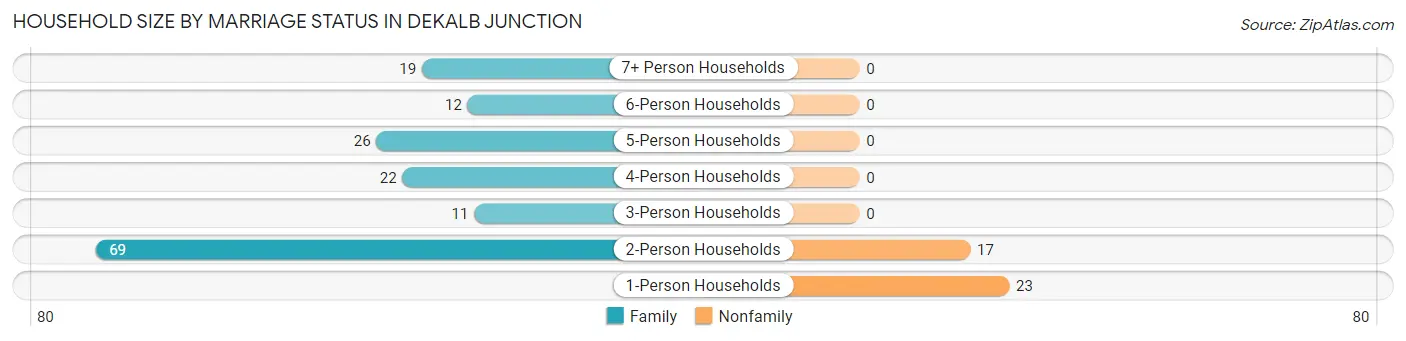
| Household Size | Family Households | Nonfamily Households |
| 1-Person Households | - | 23 (11.6%) |
| 2-Person Households | 69 (34.7%) | 17 (8.5%) |
| 3-Person Households | 11 (5.5%) | 0 (0.0%) |
| 4-Person Households | 22 (11.1%) | 0 (0.0%) |
| 5-Person Households | 26 (13.1%) | 0 (0.0%) |
| 6-Person Households | 12 (6.0%) | 0 (0.0%) |
| 7+ Person Households | 19 (9.6%) | 0 (0.0%) |
| Total | 159 (79.9%) | 40 (20.1%) |
Female Fertility in DeKalb Junction
Fertility by Age in DeKalb Junction
| Age Bracket | Women with Births | Births / 1,000 Women |
| 15 to 19 years | 0 (0.0%) | 0.0 |
| 20 to 34 years | 0 (0.0%) | 0.0 |
| 35 to 50 years | 0 (0.0%) | 0.0 |
| Total | 0 (0.0%) | 0.0 |
Fertility by Age by Marriage Status in DeKalb Junction
| Age Bracket | Married | Unmarried |
| 15 to 19 years | 0 (0.0%) | 0 (0.0%) |
| 20 to 34 years | 0 (0.0%) | 0 (0.0%) |
| 35 to 50 years | 0 (0.0%) | 0 (0.0%) |
| Total | 0 (0.0%) | 0 (0.0%) |
Fertility by Education in DeKalb Junction
| Educational Attainment | Women with Births | Births / 1,000 Women |
| Less than High School | 0 (0.0%) | 0.0 |
| High School Diploma | 0 (0.0%) | 0.0 |
| College or Associate's Degree | 0 (0.0%) | 0.0 |
| Bachelor's Degree | 0 (0.0%) | 0.0 |
| Graduate Degree | 0 (0.0%) | 0.0 |
| Total | 0 (0.0%) | 0.0 |
Fertility by Education by Marriage Status in DeKalb Junction
| Educational Attainment | Married | Unmarried |
| Less than High School | 0 (0.0%) | 0 (0.0%) |
| High School Diploma | 0 (0.0%) | 0 (0.0%) |
| College or Associate's Degree | 0 (0.0%) | 0 (0.0%) |
| Bachelor's Degree | 0 (0.0%) | 0 (0.0%) |
| Graduate Degree | 0 (0.0%) | 0 (0.0%) |
| Total | 0 (0.0%) | 0 (0.0%) |
Employment Characteristics in DeKalb Junction
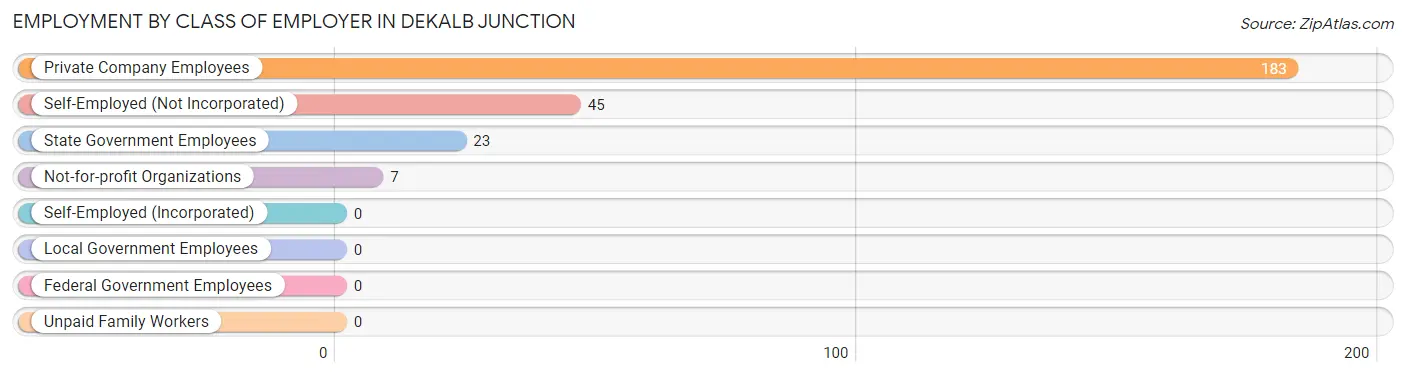
Employment by Class of Employer in DeKalb Junction
Among the 258 employed individuals in DeKalb Junction, private company employees (183 | 70.9%), self-employed (not incorporated) (45 | 17.4%), and state government employees (23 | 8.9%) make up the most common classes of employment.
| Employer Class | # Employees | % Employees |
| Private Company Employees | 183 | 70.9% |
| Self-Employed (Incorporated) | 0 | 0.0% |
| Self-Employed (Not Incorporated) | 45 | 17.4% |
| Not-for-profit Organizations | 7 | 2.7% |
| Local Government Employees | 0 | 0.0% |
| State Government Employees | 23 | 8.9% |
| Federal Government Employees | 0 | 0.0% |
| Unpaid Family Workers | 0 | 0.0% |
| Total | 258 | 100.0% |
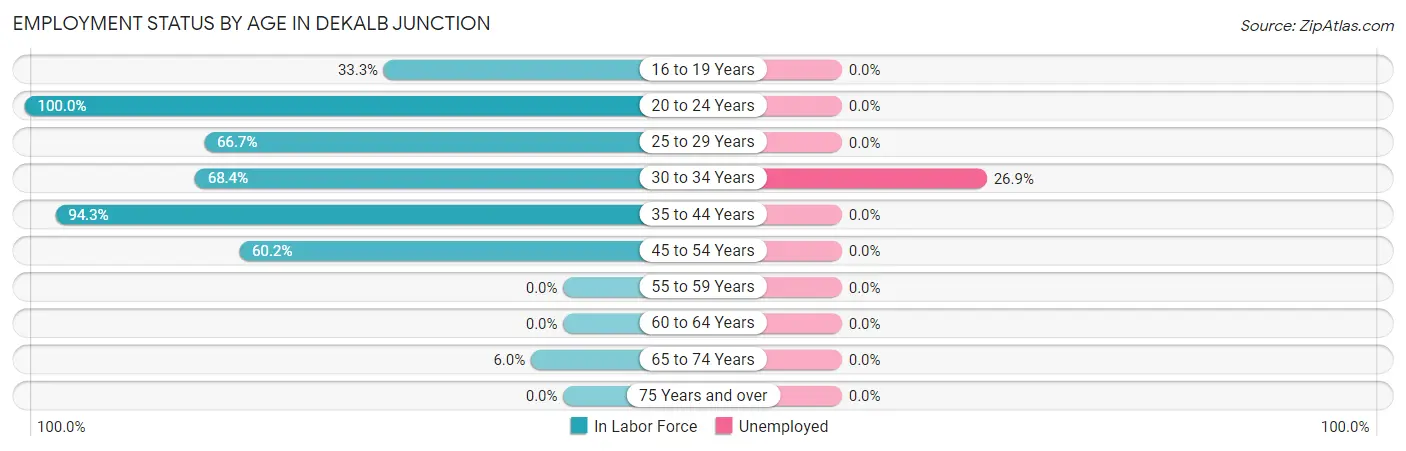
Employment Status by Age in DeKalb Junction
According to the labor force statistics for DeKalb Junction, out of the total population over 16 years of age (543), 48.8% or 265 individuals are in the labor force, with 2.6% or 7 of them unemployed. The age group with the highest labor force participation rate is 20 to 24 years, with 100.0% or 30 individuals in the labor force. Within the labor force, the 30 to 34 years age range has the highest percentage of unemployed individuals, with 26.9% or 7 of them being unemployed.
| Age Bracket | In Labor Force | Unemployed |
| 16 to 19 Years | 20 (33.3%) | 0 (0.0%) |
| 20 to 24 Years | 30 (100.0%) | 0 (0.0%) |
| 25 to 29 Years | 26 (66.7%) | 0 (0.0%) |
| 30 to 34 Years | 26 (68.4%) | 7 (26.9%) |
| 35 to 44 Years | 82 (94.3%) | 0 (0.0%) |
| 45 to 54 Years | 77 (60.2%) | 0 (0.0%) |
| 55 to 59 Years | 0 (0.0%) | 0 (0.0%) |
| 60 to 64 Years | 0 (0.0%) | 0 (0.0%) |
| 65 to 74 Years | 4 (6.0%) | 0 (0.0%) |
| 75 Years and over | 0 (0.0%) | 0 (0.0%) |
| Total | 265 (48.8%) | 7 (2.6%) |
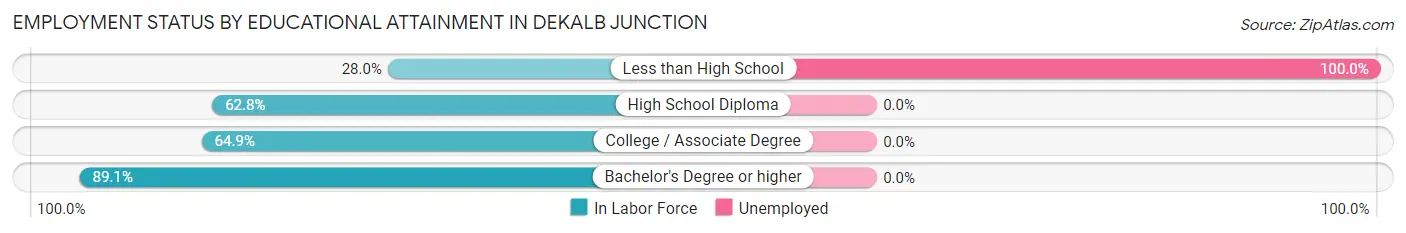
Employment Status by Educational Attainment in DeKalb Junction
According to labor force statistics for DeKalb Junction, 64.3% of individuals (211) out of the total population between 25 and 64 years of age (328) are in the labor force, with 3.3% or 7 of them being unemployed. The group with the highest labor force participation rate are those with the educational attainment of bachelor's degree or higher, with 89.1% or 41 individuals in the labor force. Within the labor force, individuals with less than high school education have the highest percentage of unemployment, with 100.0% or 7 of them being unemployed.
| Educational Attainment | In Labor Force | Unemployed |
| Less than High School | 7 (28.0%) | 25 (100.0%) |
| High School Diploma | 115 (62.8%) | 0 (0.0%) |
| College / Associate Degree | 48 (64.9%) | 0 (0.0%) |
| Bachelor's Degree or higher | 41 (89.1%) | 0 (0.0%) |
| Total | 211 (64.3%) | 11 (3.3%) |
Employment Occupations by Sex in DeKalb Junction
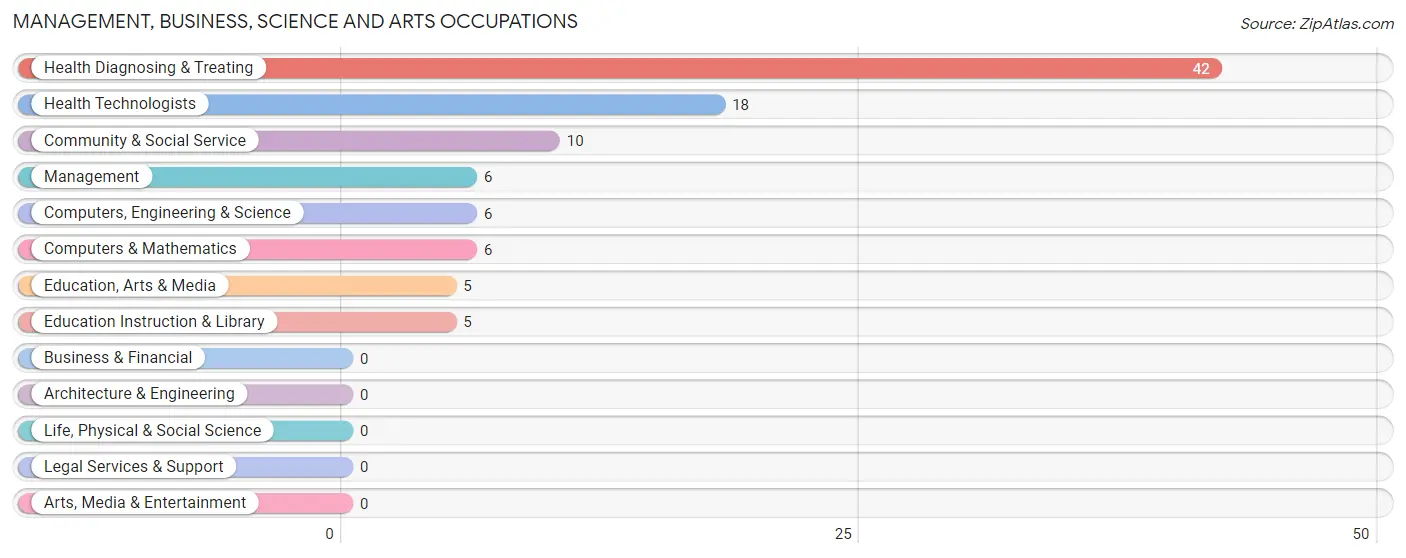
Management, Business, Science and Arts Occupations
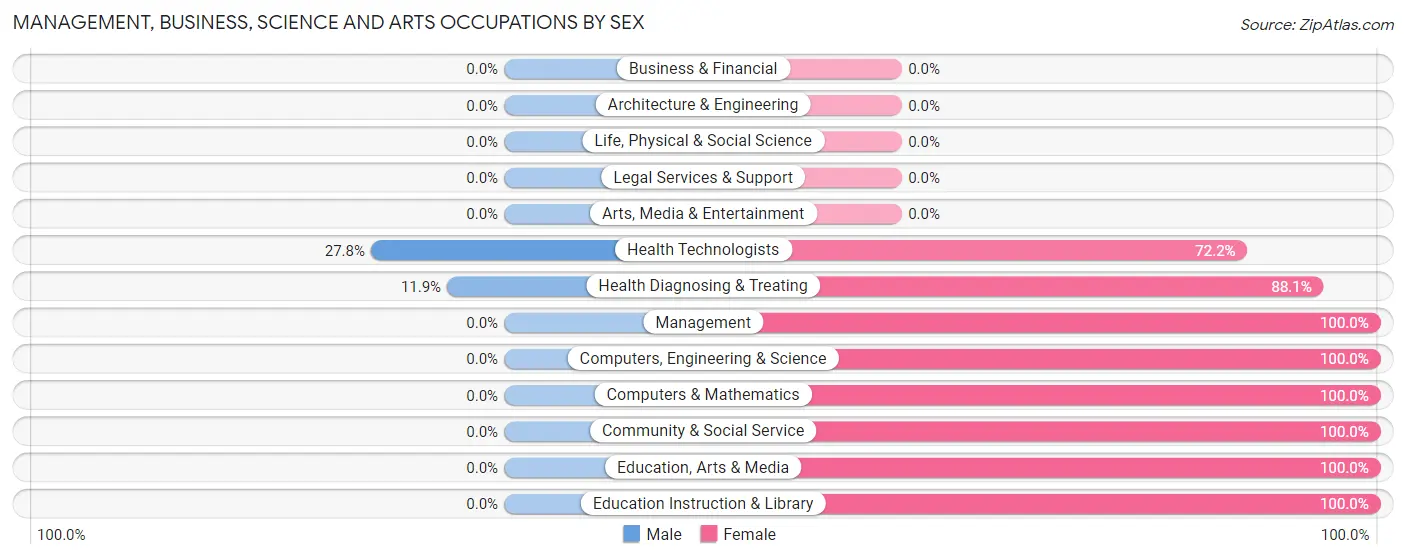
The most common Management, Business, Science and Arts occupations in DeKalb Junction are Health Diagnosing & Treating (42 | 16.3%), Health Technologists (18 | 7.0%), Community & Social Service (10 | 3.9%), Management (6 | 2.3%), and Computers, Engineering & Science (6 | 2.3%).
Management, Business, Science and Arts Occupations by Sex
Within the Management, Business, Science and Arts occupations in DeKalb Junction, the most male-oriented occupations are Health Technologists (27.8%), and Health Diagnosing & Treating (11.9%), while the most female-oriented occupations are Management (100.0%), Computers, Engineering & Science (100.0%), and Computers & Mathematics (100.0%).
| Occupation | Male | Female |
| Management | 0 (0.0%) | 6 (100.0%) |
| Business & Financial | 0 (0.0%) | 0 (0.0%) |
| Computers, Engineering & Science | 0 (0.0%) | 6 (100.0%) |
| Computers & Mathematics | 0 (0.0%) | 6 (100.0%) |
| Architecture & Engineering | 0 (0.0%) | 0 (0.0%) |
| Life, Physical & Social Science | 0 (0.0%) | 0 (0.0%) |
| Community & Social Service | 0 (0.0%) | 10 (100.0%) |
| Education, Arts & Media | 0 (0.0%) | 5 (100.0%) |
| Legal Services & Support | 0 (0.0%) | 0 (0.0%) |
| Education Instruction & Library | 0 (0.0%) | 5 (100.0%) |
| Arts, Media & Entertainment | 0 (0.0%) | 0 (0.0%) |
| Health Diagnosing & Treating | 5 (11.9%) | 37 (88.1%) |
| Health Technologists | 5 (27.8%) | 13 (72.2%) |
| Total (Category) | 5 (7.8%) | 59 (92.2%) |
| Total (Overall) | 150 (58.1%) | 108 (41.9%) |
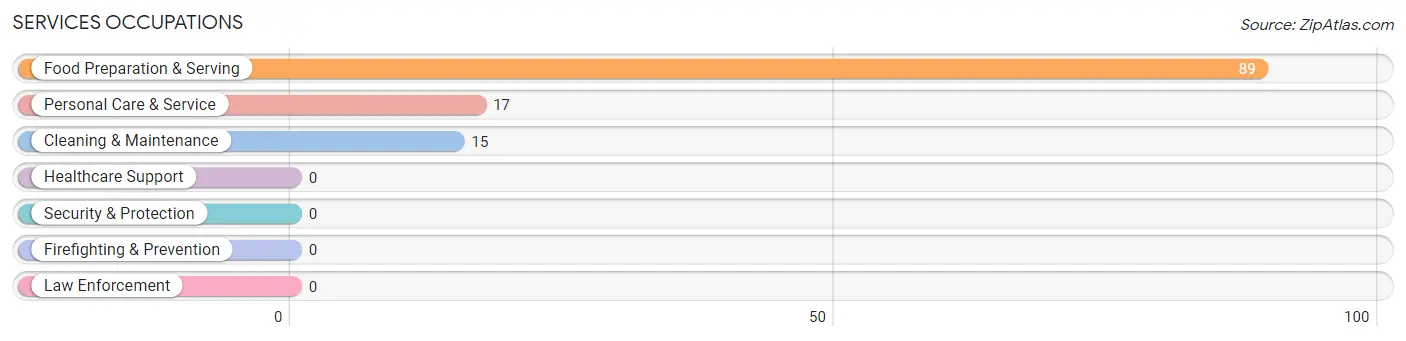
Services Occupations
The most common Services occupations in DeKalb Junction are Food Preparation & Serving (89 | 34.5%), Personal Care & Service (17 | 6.6%), and Cleaning & Maintenance (15 | 5.8%).
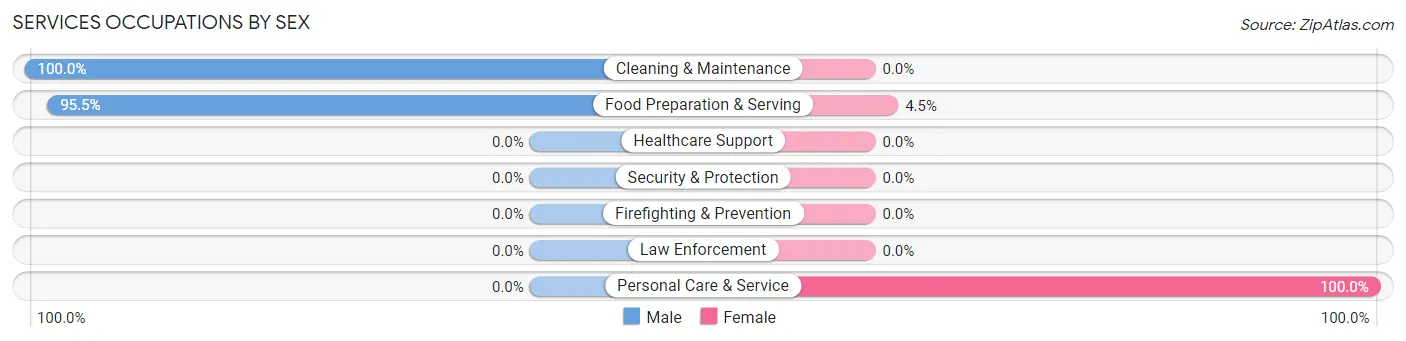
Services Occupations by Sex
Within the Services occupations in DeKalb Junction, the most male-oriented occupations are Cleaning & Maintenance (100.0%), and Food Preparation & Serving (95.5%), while the most female-oriented occupations are Personal Care & Service (100.0%), and Food Preparation & Serving (4.5%).
| Occupation | Male | Female |
| Healthcare Support | 0 (0.0%) | 0 (0.0%) |
| Security & Protection | 0 (0.0%) | 0 (0.0%) |
| Firefighting & Prevention | 0 (0.0%) | 0 (0.0%) |
| Law Enforcement | 0 (0.0%) | 0 (0.0%) |
| Food Preparation & Serving | 85 (95.5%) | 4 (4.5%) |
| Cleaning & Maintenance | 15 (100.0%) | 0 (0.0%) |
| Personal Care & Service | 0 (0.0%) | 17 (100.0%) |
| Total (Category) | 100 (82.6%) | 21 (17.4%) |
| Total (Overall) | 150 (58.1%) | 108 (41.9%) |
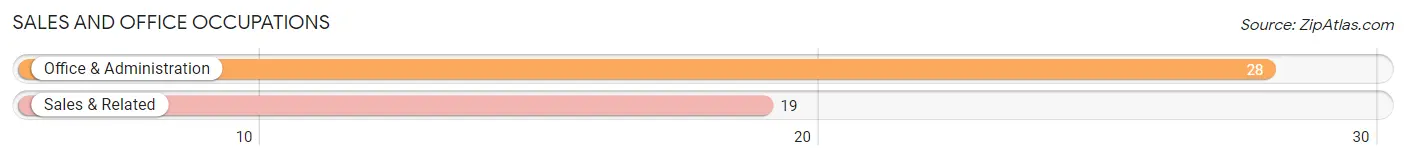
Sales and Office Occupations
The most common Sales and Office occupations in DeKalb Junction are Office & Administration (28 | 10.8%), and Sales & Related (19 | 7.4%).
Sales and Office Occupations by Sex
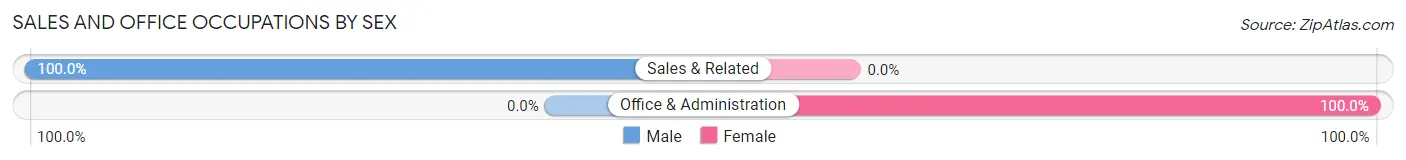
| Occupation | Male | Female |
| Sales & Related | 19 (100.0%) | 0 (0.0%) |
| Office & Administration | 0 (0.0%) | 28 (100.0%) |
| Total (Category) | 19 (40.4%) | 28 (59.6%) |
| Total (Overall) | 150 (58.1%) | 108 (41.9%) |
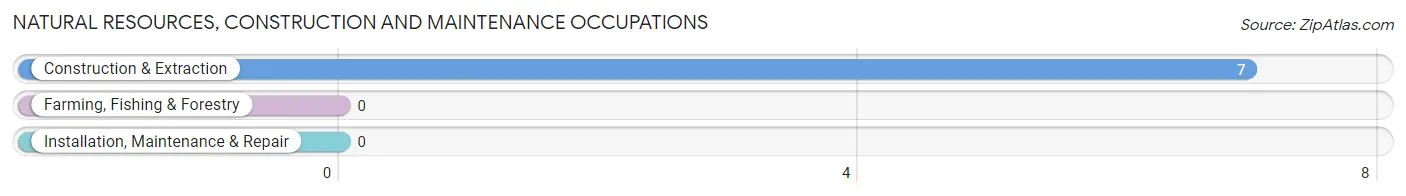
Natural Resources, Construction and Maintenance Occupations
The most common Natural Resources, Construction and Maintenance occupations in DeKalb Junction are , and Construction & Extraction (7 | 2.7%).
Natural Resources, Construction and Maintenance Occupations by Sex
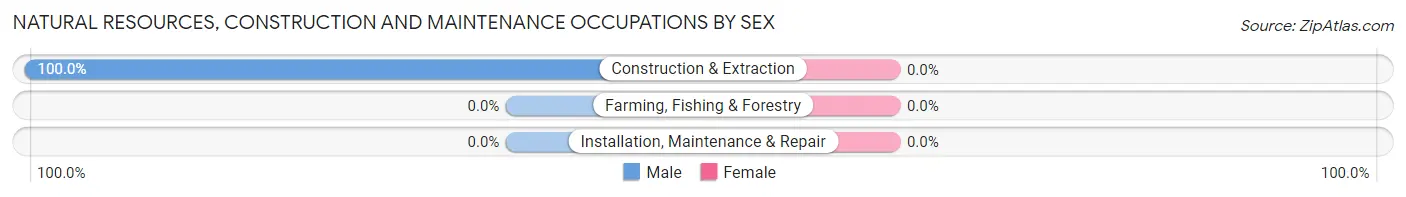
| Occupation | Male | Female |
| Farming, Fishing & Forestry | 0 (0.0%) | 0 (0.0%) |
| Construction & Extraction | 7 (100.0%) | 0 (0.0%) |
| Installation, Maintenance & Repair | 0 (0.0%) | 0 (0.0%) |
| Total (Category) | 7 (100.0%) | 0 (0.0%) |
| Total (Overall) | 150 (58.1%) | 108 (41.9%) |
Production, Transportation and Moving Occupations
The most common Production, Transportation and Moving occupations in DeKalb Junction are , and Transportation (19 | 7.4%).
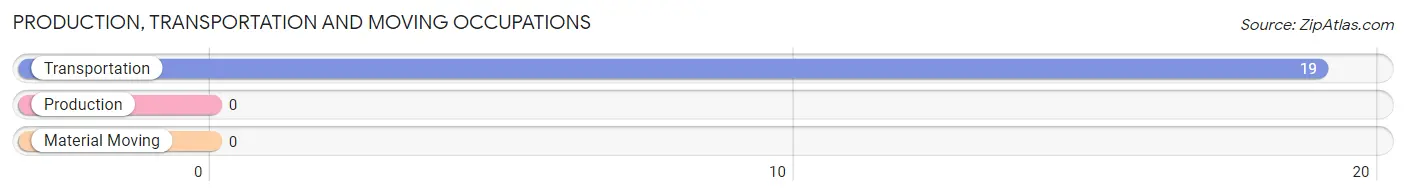
Production, Transportation and Moving Occupations by Sex
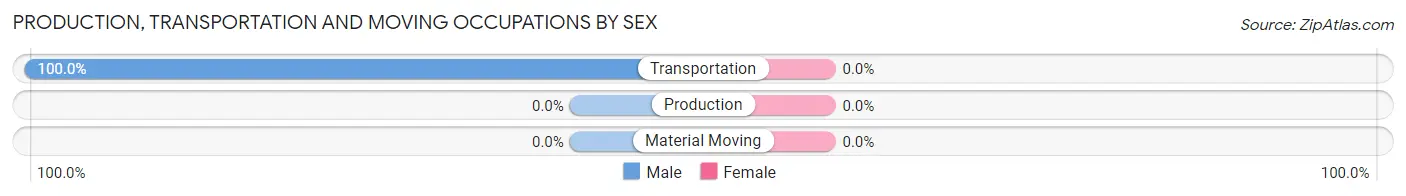
| Occupation | Male | Female |
| Production | 0 (0.0%) | 0 (0.0%) |
| Transportation | 19 (100.0%) | 0 (0.0%) |
| Material Moving | 0 (0.0%) | 0 (0.0%) |
| Total (Category) | 19 (100.0%) | 0 (0.0%) |
| Total (Overall) | 150 (58.1%) | 108 (41.9%) |
Employment Industries by Sex in DeKalb Junction
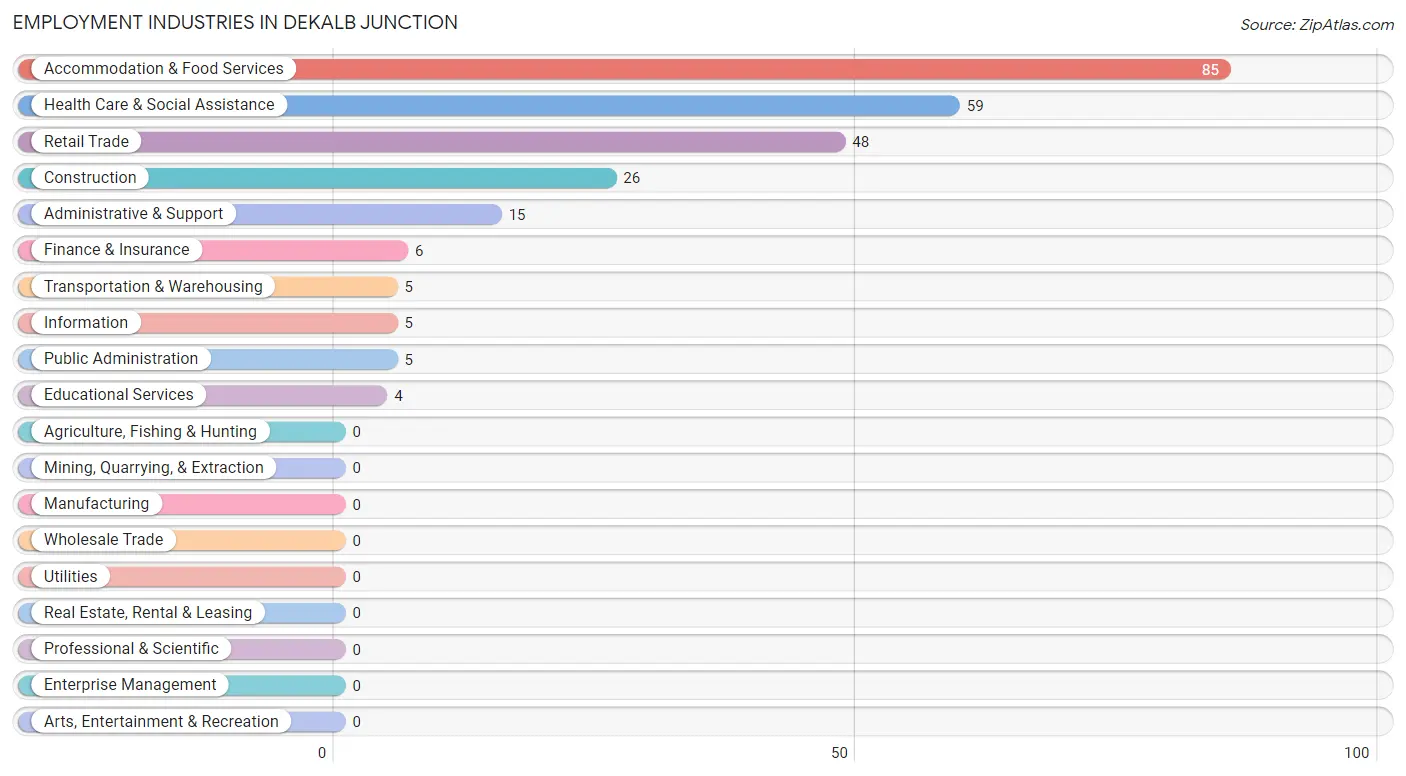
Employment Industries in DeKalb Junction
The major employment industries in DeKalb Junction include Accommodation & Food Services (85 | 33.0%), Health Care & Social Assistance (59 | 22.9%), Retail Trade (48 | 18.6%), Construction (26 | 10.1%), and Administrative & Support (15 | 5.8%).
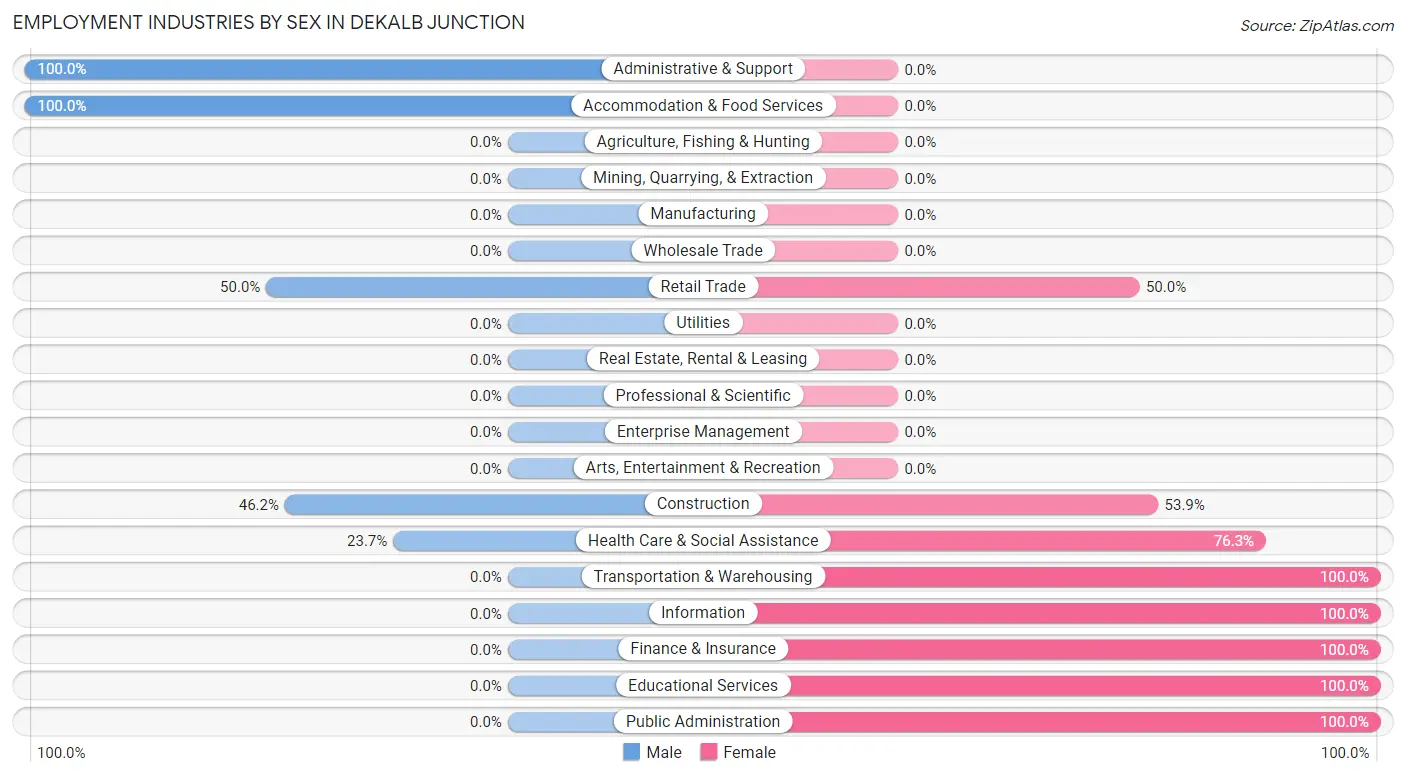
Employment Industries by Sex in DeKalb Junction
The DeKalb Junction industries that see more men than women are Administrative & Support (100.0%), Accommodation & Food Services (100.0%), and Retail Trade (50.0%), whereas the industries that tend to have a higher number of women are Transportation & Warehousing (100.0%), Information (100.0%), and Finance & Insurance (100.0%).
| Industry | Male | Female |
| Agriculture, Fishing & Hunting | 0 (0.0%) | 0 (0.0%) |
| Mining, Quarrying, & Extraction | 0 (0.0%) | 0 (0.0%) |
| Construction | 12 (46.2%) | 14 (53.8%) |
| Manufacturing | 0 (0.0%) | 0 (0.0%) |
| Wholesale Trade | 0 (0.0%) | 0 (0.0%) |
| Retail Trade | 24 (50.0%) | 24 (50.0%) |
| Transportation & Warehousing | 0 (0.0%) | 5 (100.0%) |
| Utilities | 0 (0.0%) | 0 (0.0%) |
| Information | 0 (0.0%) | 5 (100.0%) |
| Finance & Insurance | 0 (0.0%) | 6 (100.0%) |
| Real Estate, Rental & Leasing | 0 (0.0%) | 0 (0.0%) |
| Professional & Scientific | 0 (0.0%) | 0 (0.0%) |
| Enterprise Management | 0 (0.0%) | 0 (0.0%) |
| Administrative & Support | 15 (100.0%) | 0 (0.0%) |
| Educational Services | 0 (0.0%) | 4 (100.0%) |
| Health Care & Social Assistance | 14 (23.7%) | 45 (76.3%) |
| Arts, Entertainment & Recreation | 0 (0.0%) | 0 (0.0%) |
| Accommodation & Food Services | 85 (100.0%) | 0 (0.0%) |
| Public Administration | 0 (0.0%) | 5 (100.0%) |
| Total | 150 (58.1%) | 108 (41.9%) |
Education in DeKalb Junction
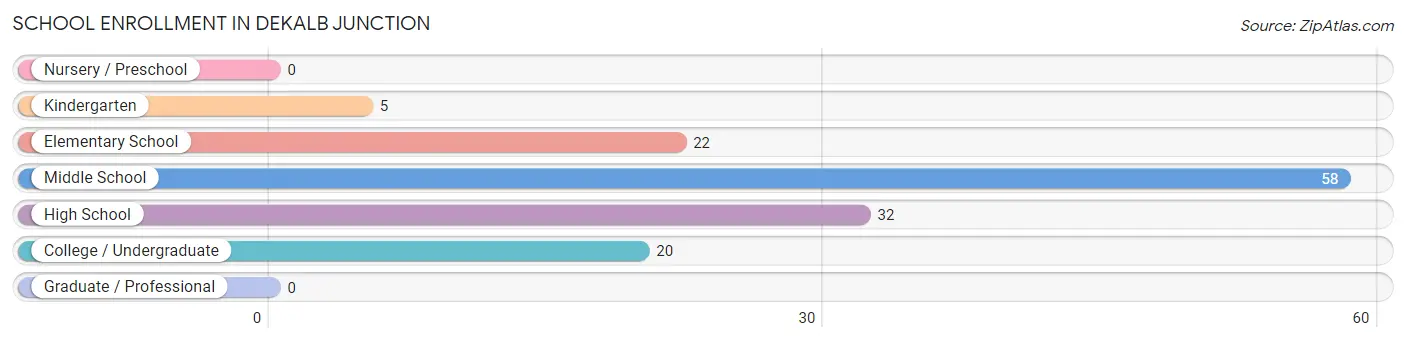
School Enrollment in DeKalb Junction
The most common levels of schooling among the 137 students in DeKalb Junction are middle school (58 | 42.3%), high school (32 | 23.4%), and elementary school (22 | 16.1%).
| School Level | # Students | % Students |
| Nursery / Preschool | 0 | 0.0% |
| Kindergarten | 5 | 3.6% |
| Elementary School | 22 | 16.1% |
| Middle School | 58 | 42.3% |
| High School | 32 | 23.4% |
| College / Undergraduate | 20 | 14.6% |
| Graduate / Professional | 0 | 0.0% |
| Total | 137 | 100.0% |
School Enrollment by Age by Funding Source in DeKalb Junction
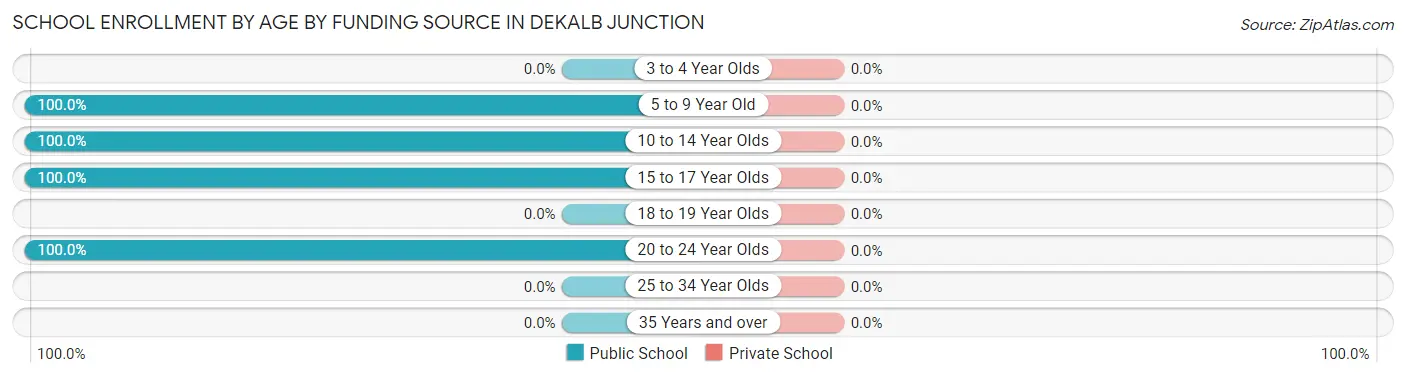
| Age Bracket | Public School | Private School |
| 3 to 4 Year Olds | 0 (0.0%) | 0 (0.0%) |
| 5 to 9 Year Old | 27 (100.0%) | 0 (0.0%) |
| 10 to 14 Year Olds | 50 (100.0%) | 0 (0.0%) |
| 15 to 17 Year Olds | 40 (100.0%) | 0 (0.0%) |
| 18 to 19 Year Olds | 0 (0.0%) | 0 (0.0%) |
| 20 to 24 Year Olds | 20 (100.0%) | 0 (0.0%) |
| 25 to 34 Year Olds | 0 (0.0%) | 0 (0.0%) |
| 35 Years and over | 0 (0.0%) | 0 (0.0%) |
| Total | 137 (100.0%) | 0 (0.0%) |
Educational Attainment by Field of Study in DeKalb Junction
Business (18 | 30.0%), education (14 | 23.3%), arts & humanities (7 | 11.7%), science & technology (6 | 10.0%), and computers & mathematics (5 | 8.3%) are the most common fields of study among 60 individuals in DeKalb Junction who have obtained a bachelor's degree or higher.
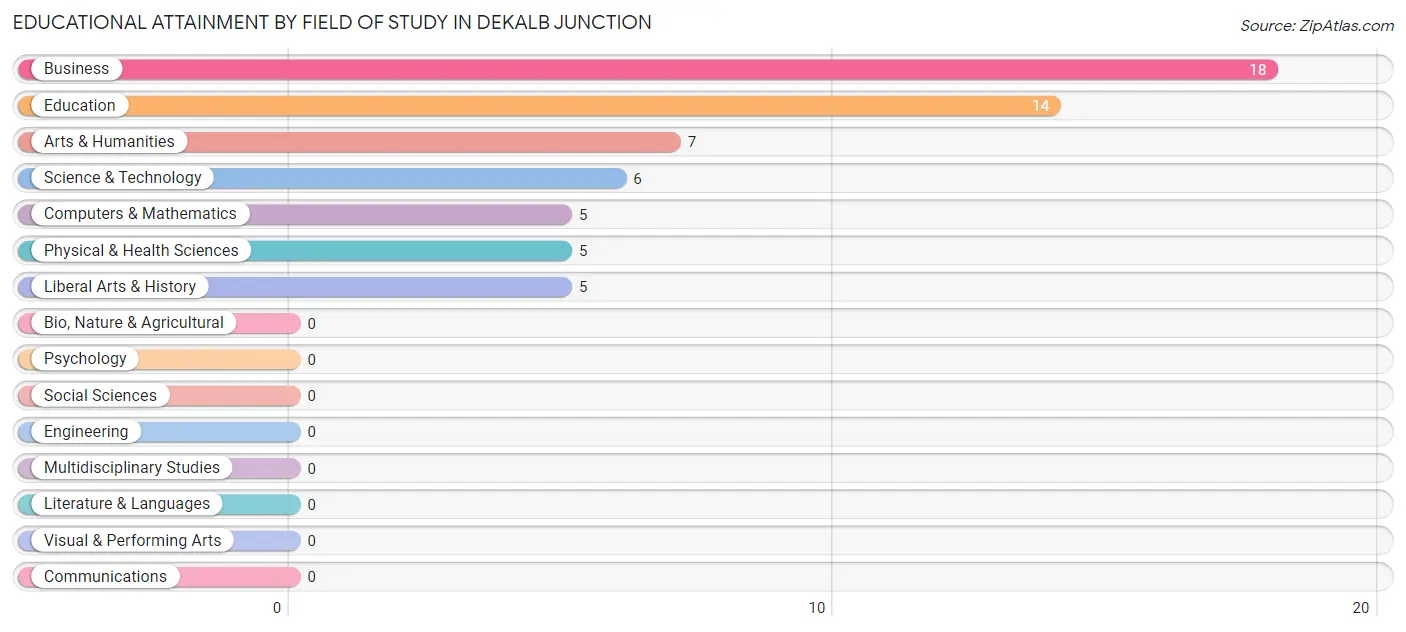
| Field of Study | # Graduates | % Graduates |
| Computers & Mathematics | 5 | 8.3% |
| Bio, Nature & Agricultural | 0 | 0.0% |
| Physical & Health Sciences | 5 | 8.3% |
| Psychology | 0 | 0.0% |
| Social Sciences | 0 | 0.0% |
| Engineering | 0 | 0.0% |
| Multidisciplinary Studies | 0 | 0.0% |
| Science & Technology | 6 | 10.0% |
| Business | 18 | 30.0% |
| Education | 14 | 23.3% |
| Literature & Languages | 0 | 0.0% |
| Liberal Arts & History | 5 | 8.3% |
| Visual & Performing Arts | 0 | 0.0% |
| Communications | 0 | 0.0% |
| Arts & Humanities | 7 | 11.7% |
| Total | 60 | 100.0% |
Transportation & Commute in DeKalb Junction
Vehicle Availability by Sex in DeKalb Junction
The most prevalent vehicle ownership categories in DeKalb Junction are males with 2 vehicles (70, accounting for 46.7%) and females with 2 vehicles (56, making up 64.8%).
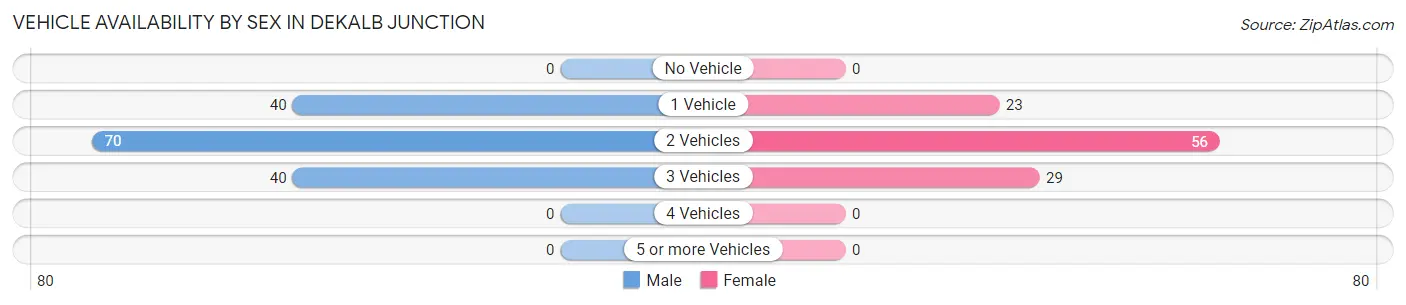
| Vehicles Available | Male | Female |
| No Vehicle | 0 (0.0%) | 0 (0.0%) |
| 1 Vehicle | 40 (26.7%) | 23 (21.3%) |
| 2 Vehicles | 70 (46.7%) | 56 (51.8%) |
| 3 Vehicles | 40 (26.7%) | 29 (26.9%) |
| 4 Vehicles | 0 (0.0%) | 0 (0.0%) |
| 5 or more Vehicles | 0 (0.0%) | 0 (0.0%) |
| Total | 150 (100.0%) | 108 (100.0%) |
Commute Time in DeKalb Junction
The most frequently occuring commute durations in DeKalb Junction are 20 to 24 minutes (60 commuters, 25.5%), 15 to 19 minutes (42 commuters, 17.9%), and 10 to 14 minutes (32 commuters, 13.6%).
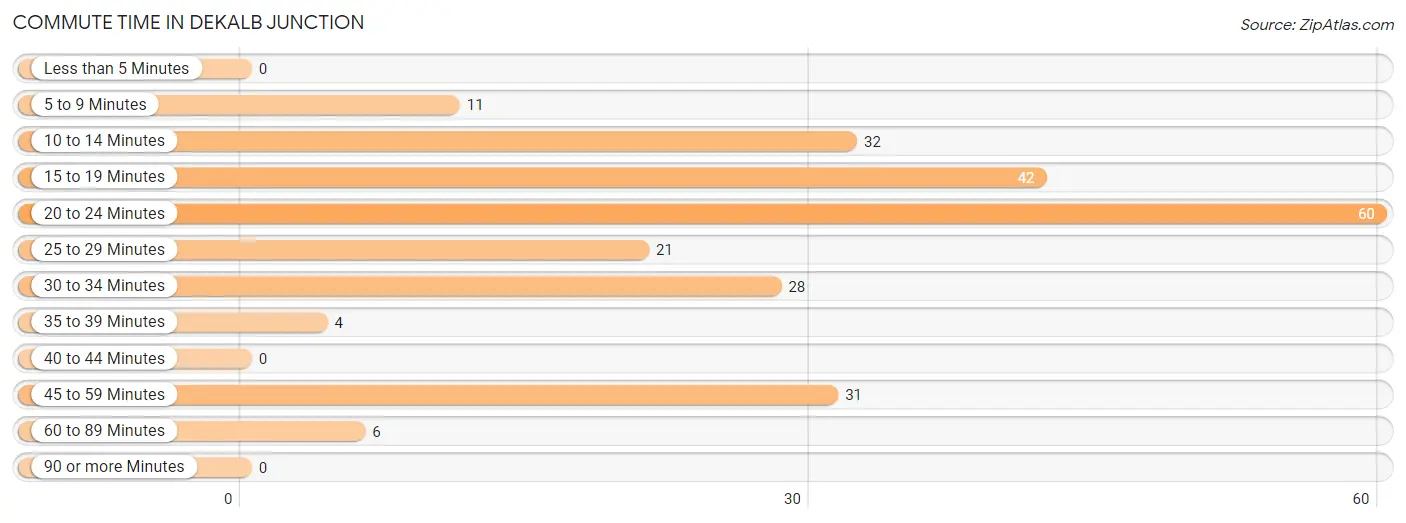
| Commute Time | # Commuters | % Commuters |
| Less than 5 Minutes | 0 | 0.0% |
| 5 to 9 Minutes | 11 | 4.7% |
| 10 to 14 Minutes | 32 | 13.6% |
| 15 to 19 Minutes | 42 | 17.9% |
| 20 to 24 Minutes | 60 | 25.5% |
| 25 to 29 Minutes | 21 | 8.9% |
| 30 to 34 Minutes | 28 | 11.9% |
| 35 to 39 Minutes | 4 | 1.7% |
| 40 to 44 Minutes | 0 | 0.0% |
| 45 to 59 Minutes | 31 | 13.2% |
| 60 to 89 Minutes | 6 | 2.5% |
| 90 or more Minutes | 0 | 0.0% |
Commute Time by Sex in DeKalb Junction
The most common commute times in DeKalb Junction are 20 to 24 minutes (55 commuters, 36.7%) for males and 10 to 14 minutes (32 commuters, 37.7%) for females.
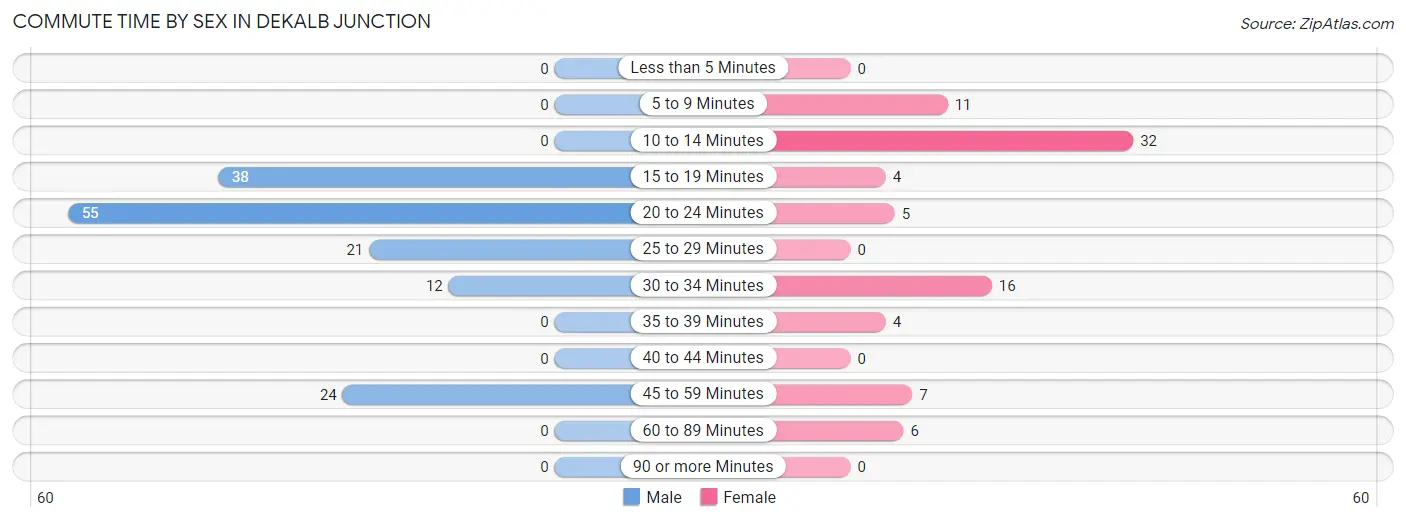
| Commute Time | Male | Female |
| Less than 5 Minutes | 0 (0.0%) | 0 (0.0%) |
| 5 to 9 Minutes | 0 (0.0%) | 11 (12.9%) |
| 10 to 14 Minutes | 0 (0.0%) | 32 (37.7%) |
| 15 to 19 Minutes | 38 (25.3%) | 4 (4.7%) |
| 20 to 24 Minutes | 55 (36.7%) | 5 (5.9%) |
| 25 to 29 Minutes | 21 (14.0%) | 0 (0.0%) |
| 30 to 34 Minutes | 12 (8.0%) | 16 (18.8%) |
| 35 to 39 Minutes | 0 (0.0%) | 4 (4.7%) |
| 40 to 44 Minutes | 0 (0.0%) | 0 (0.0%) |
| 45 to 59 Minutes | 24 (16.0%) | 7 (8.2%) |
| 60 to 89 Minutes | 0 (0.0%) | 6 (7.1%) |
| 90 or more Minutes | 0 (0.0%) | 0 (0.0%) |
Time of Departure to Work by Sex in DeKalb Junction
The most frequent times of departure to work in DeKalb Junction are 6:00 AM to 6:29 AM (52, 34.7%) for males and 7:30 AM to 7:59 AM (48, 56.5%) for females.
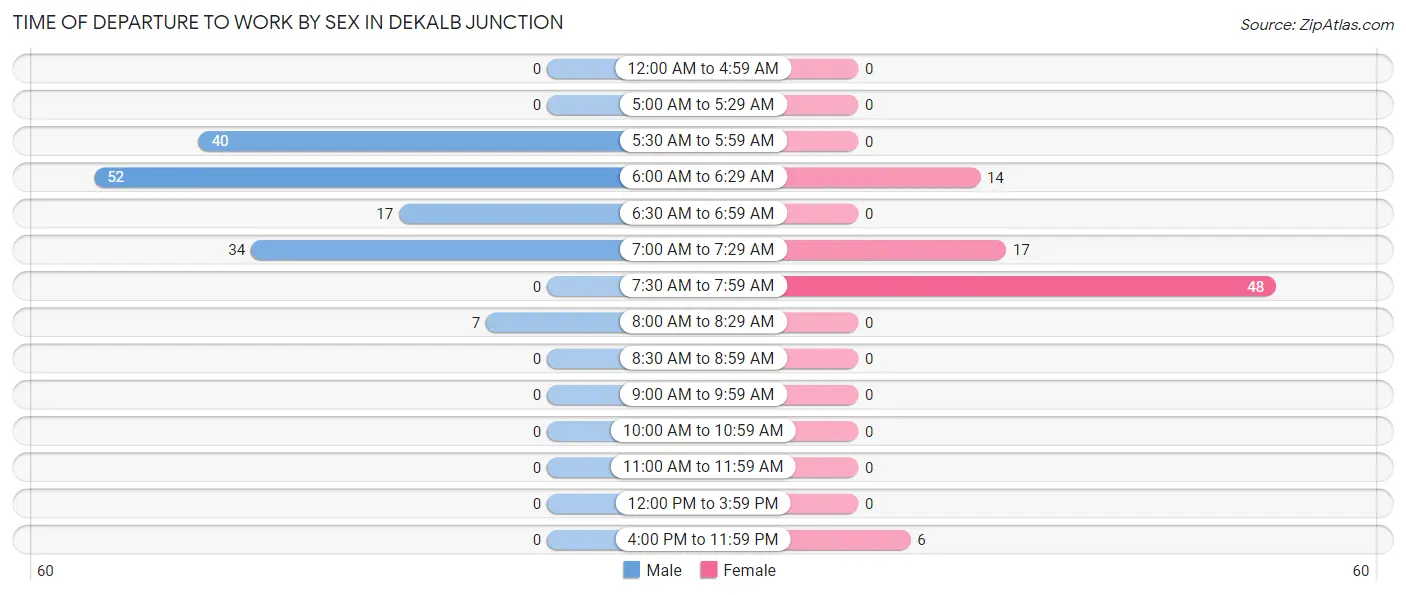
| Time of Departure | Male | Female |
| 12:00 AM to 4:59 AM | 0 (0.0%) | 0 (0.0%) |
| 5:00 AM to 5:29 AM | 0 (0.0%) | 0 (0.0%) |
| 5:30 AM to 5:59 AM | 40 (26.7%) | 0 (0.0%) |
| 6:00 AM to 6:29 AM | 52 (34.7%) | 14 (16.5%) |
| 6:30 AM to 6:59 AM | 17 (11.3%) | 0 (0.0%) |
| 7:00 AM to 7:29 AM | 34 (22.7%) | 17 (20.0%) |
| 7:30 AM to 7:59 AM | 0 (0.0%) | 48 (56.5%) |
| 8:00 AM to 8:29 AM | 7 (4.7%) | 0 (0.0%) |
| 8:30 AM to 8:59 AM | 0 (0.0%) | 0 (0.0%) |
| 9:00 AM to 9:59 AM | 0 (0.0%) | 0 (0.0%) |
| 10:00 AM to 10:59 AM | 0 (0.0%) | 0 (0.0%) |
| 11:00 AM to 11:59 AM | 0 (0.0%) | 0 (0.0%) |
| 12:00 PM to 3:59 PM | 0 (0.0%) | 0 (0.0%) |
| 4:00 PM to 11:59 PM | 0 (0.0%) | 6 (7.1%) |
| Total | 150 (100.0%) | 85 (100.0%) |
Housing Occupancy in DeKalb Junction
Occupancy by Ownership in DeKalb Junction
Of the total 199 dwellings in DeKalb Junction, owner-occupied units account for 167 (83.9%), while renter-occupied units make up 32 (16.1%).
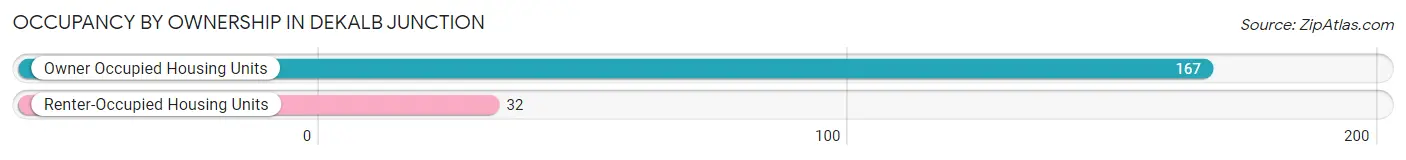
| Occupancy | # Housing Units | % Housing Units |
| Owner Occupied Housing Units | 167 | 83.9% |
| Renter-Occupied Housing Units | 32 | 16.1% |
| Total Occupied Housing Units | 199 | 100.0% |
Occupancy by Household Size in DeKalb Junction
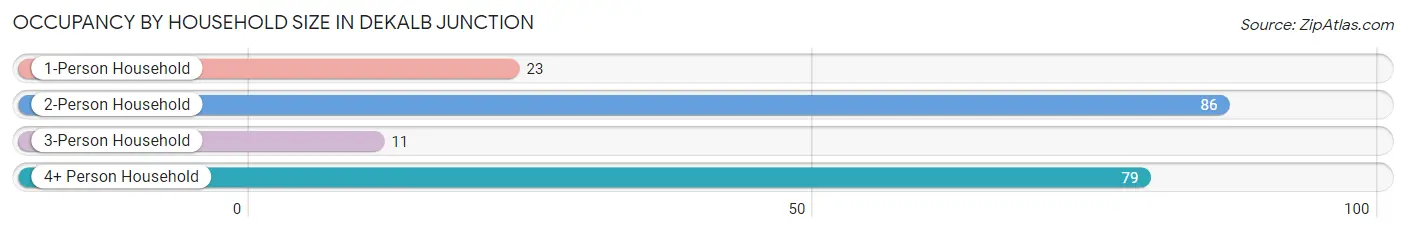
| Household Size | # Housing Units | % Housing Units |
| 1-Person Household | 23 | 11.6% |
| 2-Person Household | 86 | 43.2% |
| 3-Person Household | 11 | 5.5% |
| 4+ Person Household | 79 | 39.7% |
| Total Housing Units | 199 | 100.0% |
Occupancy by Ownership by Household Size in DeKalb Junction
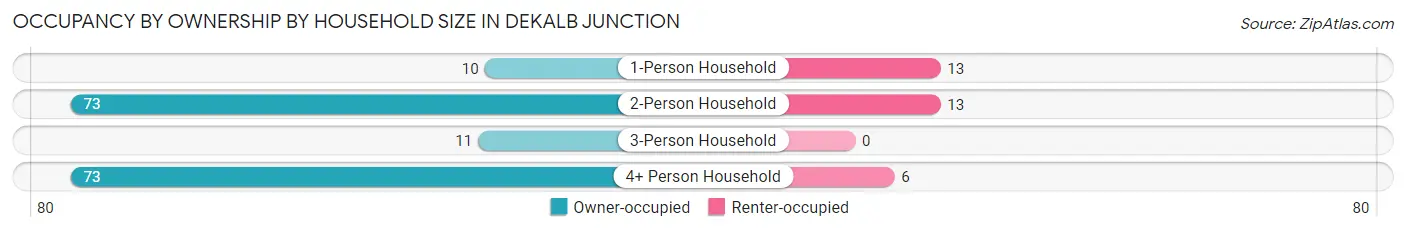
| Household Size | Owner-occupied | Renter-occupied |
| 1-Person Household | 10 (43.5%) | 13 (56.5%) |
| 2-Person Household | 73 (84.9%) | 13 (15.1%) |
| 3-Person Household | 11 (100.0%) | 0 (0.0%) |
| 4+ Person Household | 73 (92.4%) | 6 (7.6%) |
| Total Housing Units | 167 (83.9%) | 32 (16.1%) |
Occupancy by Educational Attainment in DeKalb Junction
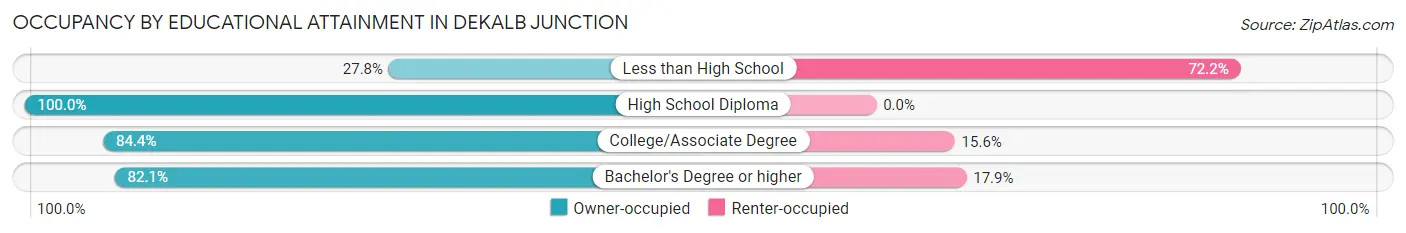
| Household Size | Owner-occupied | Renter-occupied |
| Less than High School | 5 (27.8%) | 13 (72.2%) |
| High School Diploma | 63 (100.0%) | 0 (0.0%) |
| College/Associate Degree | 76 (84.4%) | 14 (15.6%) |
| Bachelor's Degree or higher | 23 (82.1%) | 5 (17.9%) |
Occupancy by Age of Householder in DeKalb Junction
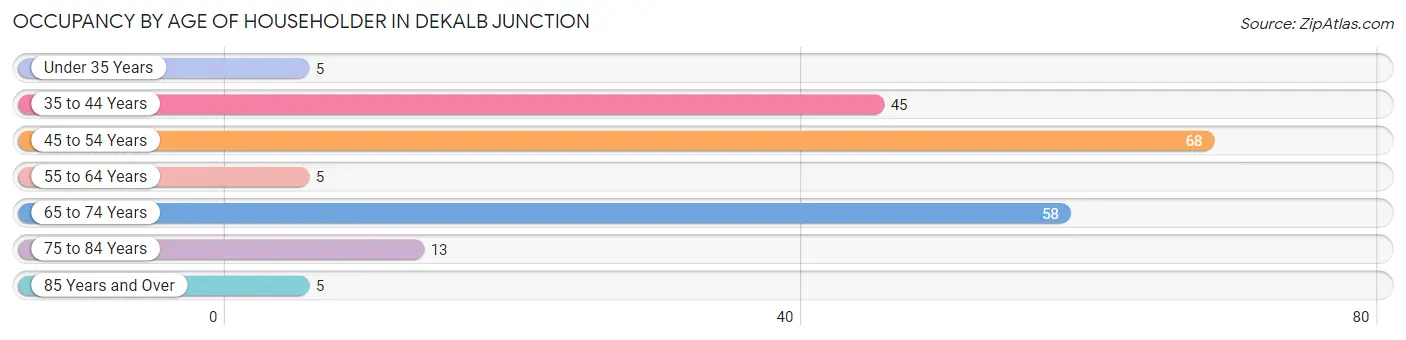
| Age Bracket | # Households | % Households |
| Under 35 Years | 5 | 2.5% |
| 35 to 44 Years | 45 | 22.6% |
| 45 to 54 Years | 68 | 34.2% |
| 55 to 64 Years | 5 | 2.5% |
| 65 to 74 Years | 58 | 29.1% |
| 75 to 84 Years | 13 | 6.5% |
| 85 Years and Over | 5 | 2.5% |
| Total | 199 | 100.0% |
Housing Finances in DeKalb Junction
Median Income by Occupancy in DeKalb Junction
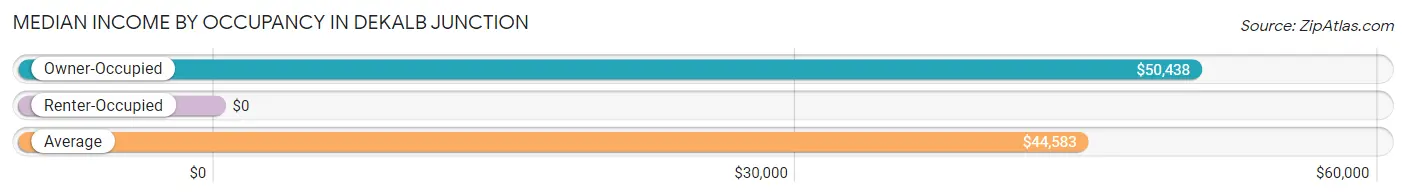
| Occupancy Type | # Households | Median Income |
| Owner-Occupied | 167 (83.9%) | $50,438 |
| Renter-Occupied | 32 (16.1%) | $0 |
| Average | 199 (100.0%) | $44,583 |
Occupancy by Householder Income Bracket in DeKalb Junction
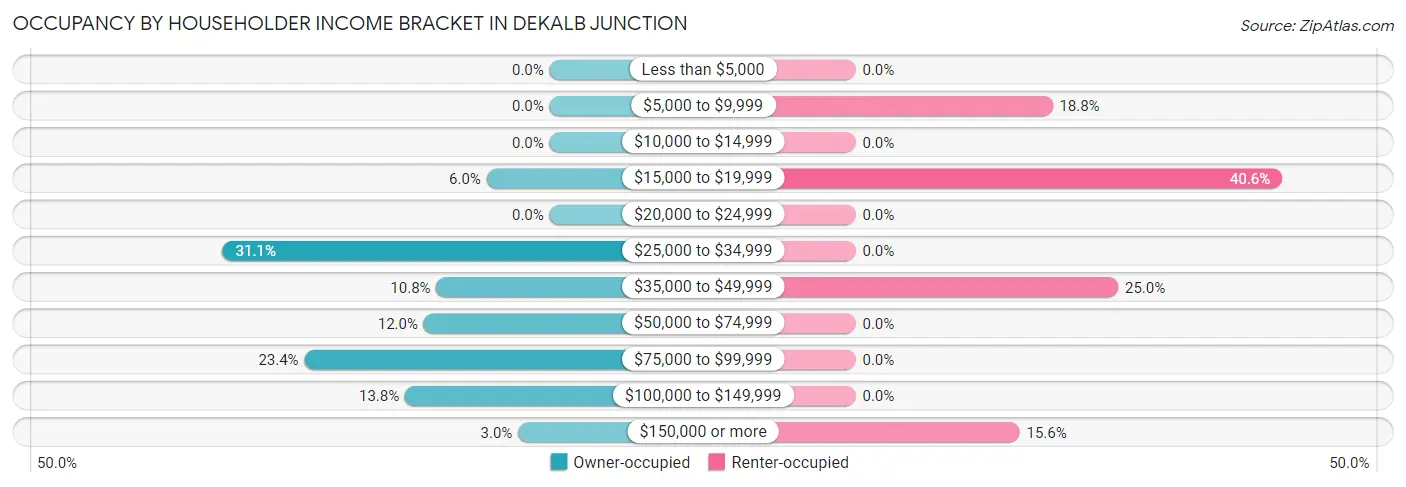
| Income Bracket | Owner-occupied | Renter-occupied |
| Less than $5,000 | 0 (0.0%) | 0 (0.0%) |
| $5,000 to $9,999 | 0 (0.0%) | 6 (18.8%) |
| $10,000 to $14,999 | 0 (0.0%) | 0 (0.0%) |
| $15,000 to $19,999 | 10 (6.0%) | 13 (40.6%) |
| $20,000 to $24,999 | 0 (0.0%) | 0 (0.0%) |
| $25,000 to $34,999 | 52 (31.1%) | 0 (0.0%) |
| $35,000 to $49,999 | 18 (10.8%) | 8 (25.0%) |
| $50,000 to $74,999 | 20 (12.0%) | 0 (0.0%) |
| $75,000 to $99,999 | 39 (23.4%) | 0 (0.0%) |
| $100,000 to $149,999 | 23 (13.8%) | 0 (0.0%) |
| $150,000 or more | 5 (3.0%) | 5 (15.6%) |
| Total | 167 (100.0%) | 32 (100.0%) |
Monthly Housing Cost Tiers in DeKalb Junction
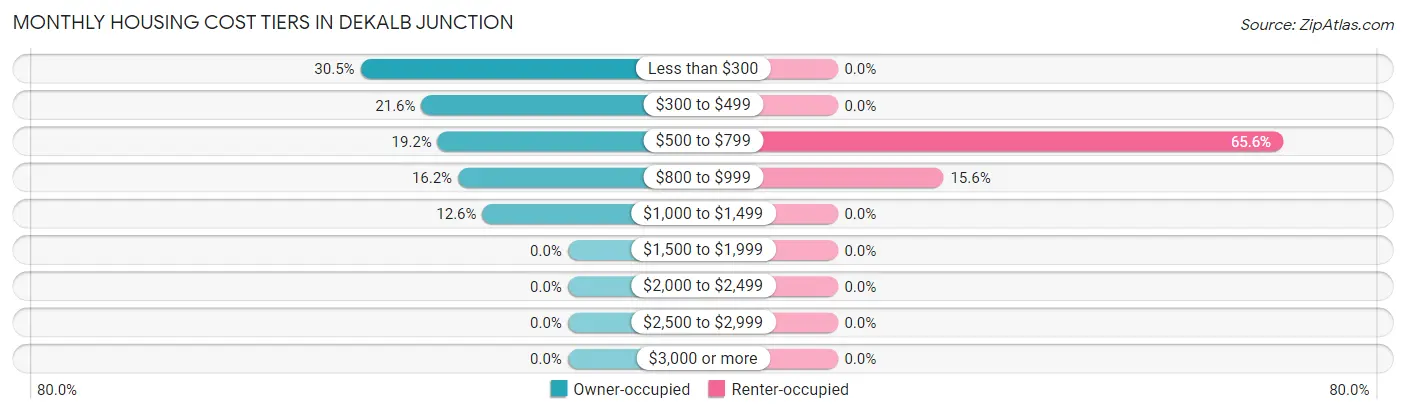
| Monthly Cost | Owner-occupied | Renter-occupied |
| Less than $300 | 51 (30.5%) | 0 (0.0%) |
| $300 to $499 | 36 (21.6%) | 0 (0.0%) |
| $500 to $799 | 32 (19.2%) | 21 (65.6%) |
| $800 to $999 | 27 (16.2%) | 5 (15.6%) |
| $1,000 to $1,499 | 21 (12.6%) | 0 (0.0%) |
| $1,500 to $1,999 | 0 (0.0%) | 0 (0.0%) |
| $2,000 to $2,499 | 0 (0.0%) | 0 (0.0%) |
| $2,500 to $2,999 | 0 (0.0%) | 0 (0.0%) |
| $3,000 or more | 0 (0.0%) | 0 (0.0%) |
| Total | 167 (100.0%) | 32 (100.0%) |
Physical Housing Characteristics in DeKalb Junction
Housing Structures in DeKalb Junction
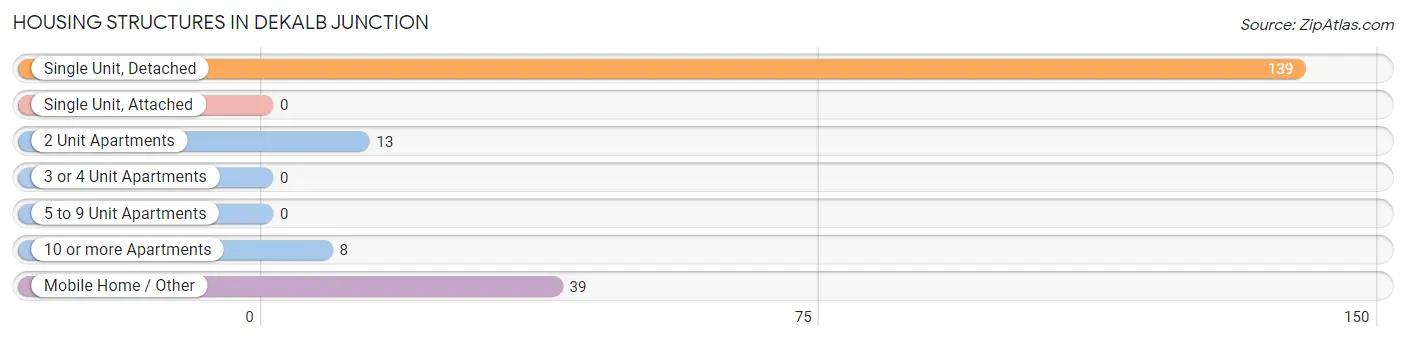
| Structure Type | # Housing Units | % Housing Units |
| Single Unit, Detached | 139 | 69.9% |
| Single Unit, Attached | 0 | 0.0% |
| 2 Unit Apartments | 13 | 6.5% |
| 3 or 4 Unit Apartments | 0 | 0.0% |
| 5 to 9 Unit Apartments | 0 | 0.0% |
| 10 or more Apartments | 8 | 4.0% |
| Mobile Home / Other | 39 | 19.6% |
| Total | 199 | 100.0% |
Housing Structures by Occupancy in DeKalb Junction
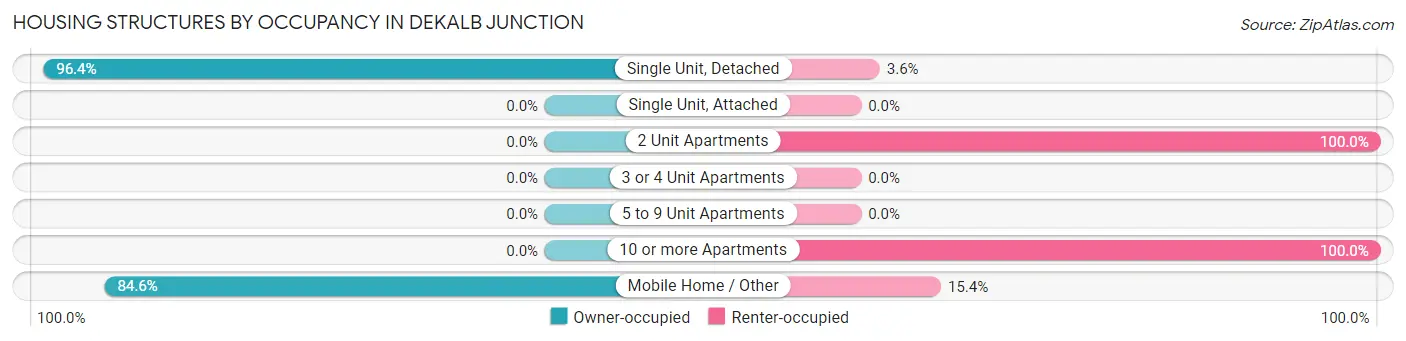
| Structure Type | Owner-occupied | Renter-occupied |
| Single Unit, Detached | 134 (96.4%) | 5 (3.6%) |
| Single Unit, Attached | 0 (0.0%) | 0 (0.0%) |
| 2 Unit Apartments | 0 (0.0%) | 13 (100.0%) |
| 3 or 4 Unit Apartments | 0 (0.0%) | 0 (0.0%) |
| 5 to 9 Unit Apartments | 0 (0.0%) | 0 (0.0%) |
| 10 or more Apartments | 0 (0.0%) | 8 (100.0%) |
| Mobile Home / Other | 33 (84.6%) | 6 (15.4%) |
| Total | 167 (83.9%) | 32 (16.1%) |
Housing Structures by Number of Rooms in DeKalb Junction
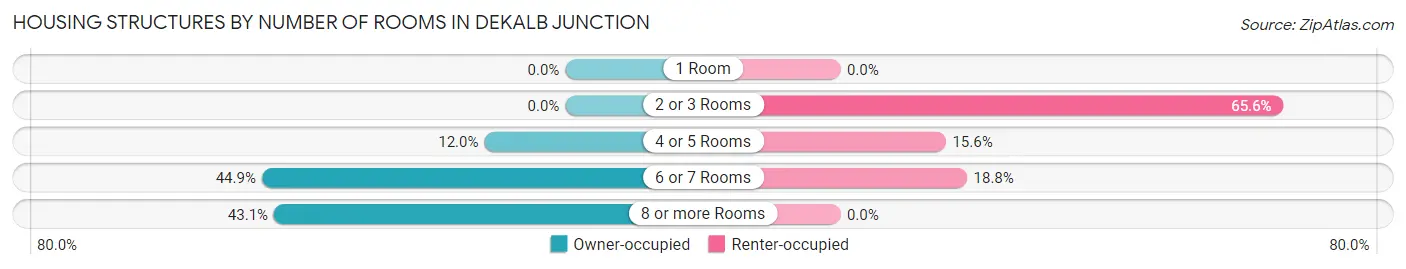
| Number of Rooms | Owner-occupied | Renter-occupied |
| 1 Room | 0 (0.0%) | 0 (0.0%) |
| 2 or 3 Rooms | 0 (0.0%) | 21 (65.6%) |
| 4 or 5 Rooms | 20 (12.0%) | 5 (15.6%) |
| 6 or 7 Rooms | 75 (44.9%) | 6 (18.8%) |
| 8 or more Rooms | 72 (43.1%) | 0 (0.0%) |
| Total | 167 (100.0%) | 32 (100.0%) |
Housing Structure by Heating Type in DeKalb Junction
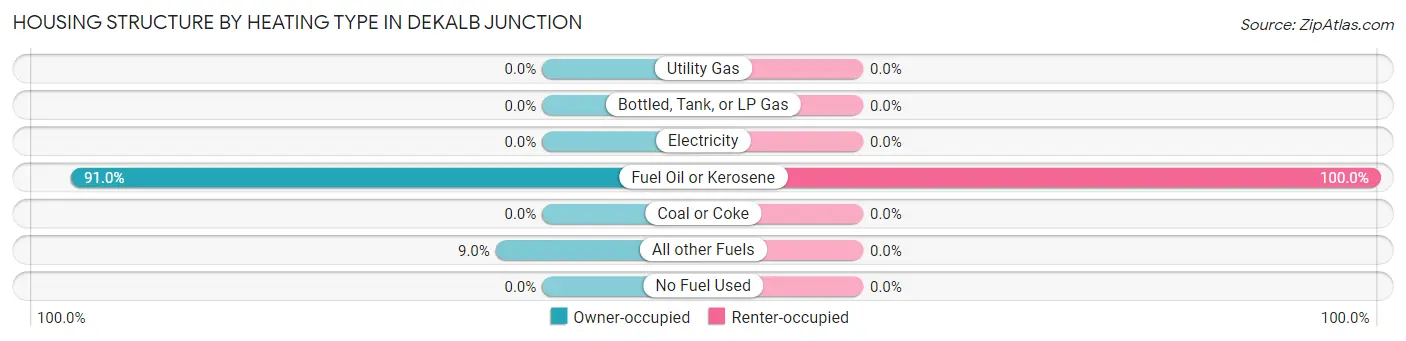
| Heating Type | Owner-occupied | Renter-occupied |
| Utility Gas | 0 (0.0%) | 0 (0.0%) |
| Bottled, Tank, or LP Gas | 0 (0.0%) | 0 (0.0%) |
| Electricity | 0 (0.0%) | 0 (0.0%) |
| Fuel Oil or Kerosene | 152 (91.0%) | 32 (100.0%) |
| Coal or Coke | 0 (0.0%) | 0 (0.0%) |
| All other Fuels | 15 (9.0%) | 0 (0.0%) |
| No Fuel Used | 0 (0.0%) | 0 (0.0%) |
| Total | 167 (100.0%) | 32 (100.0%) |
Household Vehicle Usage in DeKalb Junction
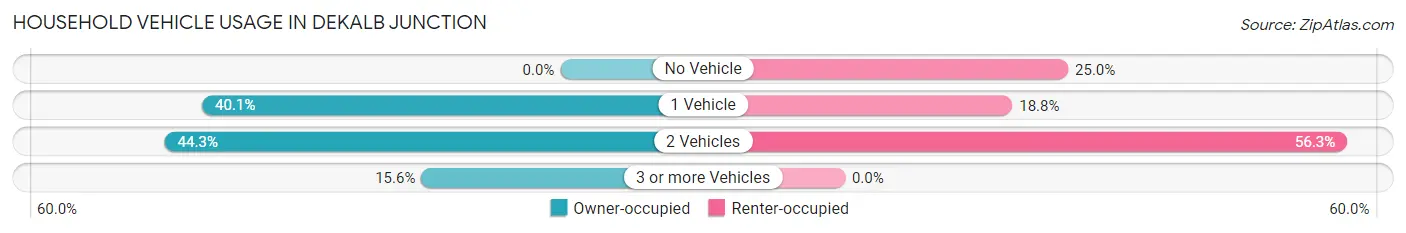
| Vehicles per Household | Owner-occupied | Renter-occupied |
| No Vehicle | 0 (0.0%) | 8 (25.0%) |
| 1 Vehicle | 67 (40.1%) | 6 (18.8%) |
| 2 Vehicles | 74 (44.3%) | 18 (56.2%) |
| 3 or more Vehicles | 26 (15.6%) | 0 (0.0%) |
| Total | 167 (100.0%) | 32 (100.0%) |
Real Estate & Mortgages in DeKalb Junction
Real Estate and Mortgage Overview in DeKalb Junction
| Characteristic | Without Mortgage | With Mortgage |
| Housing Units | 102 | 65 |
| Median Property Value | $48,000 | $75,300 |
| Median Household Income | $32,014 | $0 |
| Monthly Housing Costs | $350 | $0 |
| Real Estate Taxes | $1,069 | $0 |
Property Value by Mortgage Status in DeKalb Junction
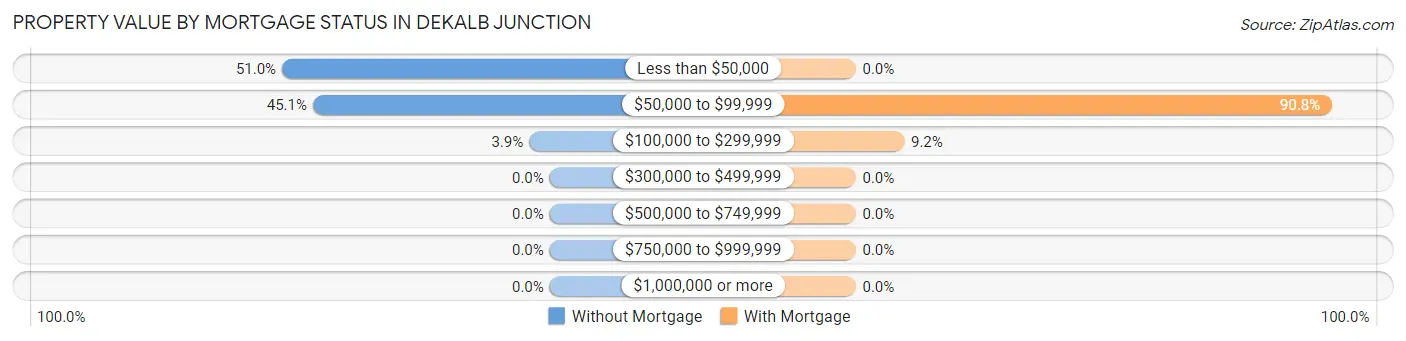
| Property Value | Without Mortgage | With Mortgage |
| Less than $50,000 | 52 (51.0%) | 0 (0.0%) |
| $50,000 to $99,999 | 46 (45.1%) | 59 (90.8%) |
| $100,000 to $299,999 | 4 (3.9%) | 6 (9.2%) |
| $300,000 to $499,999 | 0 (0.0%) | 0 (0.0%) |
| $500,000 to $749,999 | 0 (0.0%) | 0 (0.0%) |
| $750,000 to $999,999 | 0 (0.0%) | 0 (0.0%) |
| $1,000,000 or more | 0 (0.0%) | 0 (0.0%) |
| Total | 102 (100.0%) | 65 (100.0%) |
Household Income by Mortgage Status in DeKalb Junction
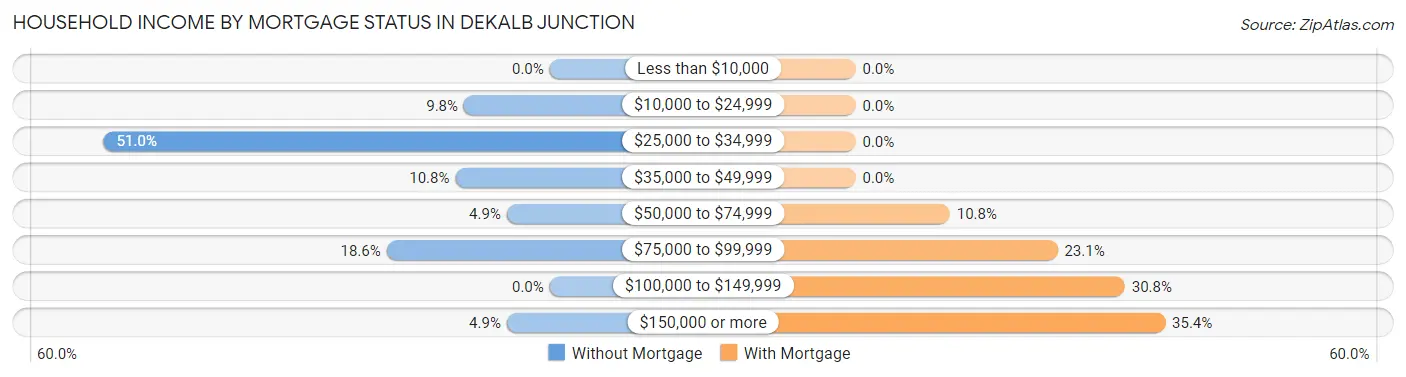
| Household Income | Without Mortgage | With Mortgage |
| Less than $10,000 | 0 (0.0%) | 0 (0.0%) |
| $10,000 to $24,999 | 10 (9.8%) | 0 (0.0%) |
| $25,000 to $34,999 | 52 (51.0%) | 0 (0.0%) |
| $35,000 to $49,999 | 11 (10.8%) | 0 (0.0%) |
| $50,000 to $74,999 | 5 (4.9%) | 7 (10.8%) |
| $75,000 to $99,999 | 19 (18.6%) | 15 (23.1%) |
| $100,000 to $149,999 | 0 (0.0%) | 20 (30.8%) |
| $150,000 or more | 5 (4.9%) | 23 (35.4%) |
| Total | 102 (100.0%) | 65 (100.0%) |
Property Value to Household Income Ratio in DeKalb Junction
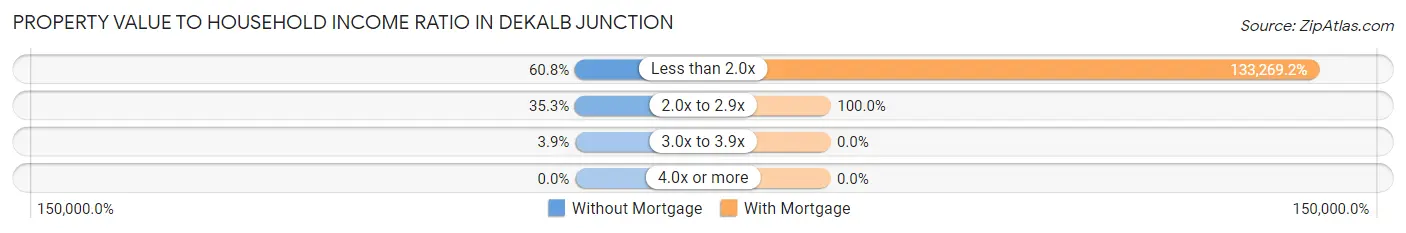
| Value-to-Income Ratio | Without Mortgage | With Mortgage |
| Less than 2.0x | 62 (60.8%) | 86,625 (133,269.2%) |
| 2.0x to 2.9x | 36 (35.3%) | 65 (100.0%) |
| 3.0x to 3.9x | 4 (3.9%) | 0 (0.0%) |
| 4.0x or more | 0 (0.0%) | 0 (0.0%) |
| Total | 102 (100.0%) | 65 (100.0%) |
Real Estate Taxes by Mortgage Status in DeKalb Junction
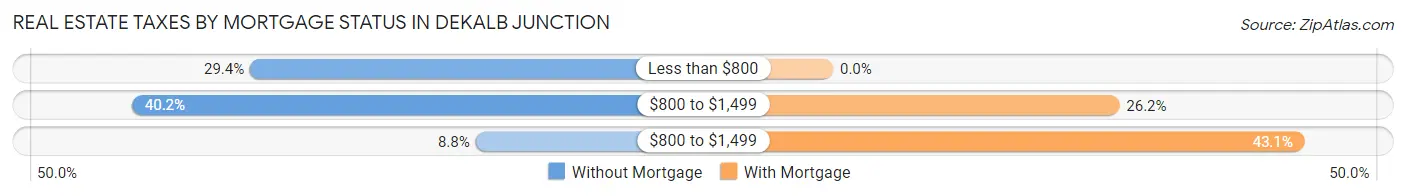
| Property Taxes | Without Mortgage | With Mortgage |
| Less than $800 | 30 (29.4%) | 0 (0.0%) |
| $800 to $1,499 | 41 (40.2%) | 17 (26.2%) |
| $800 to $1,499 | 9 (8.8%) | 28 (43.1%) |
| Total | 102 (100.0%) | 65 (100.0%) |
Health & Disability in DeKalb Junction
Health Insurance Coverage by Age in DeKalb Junction
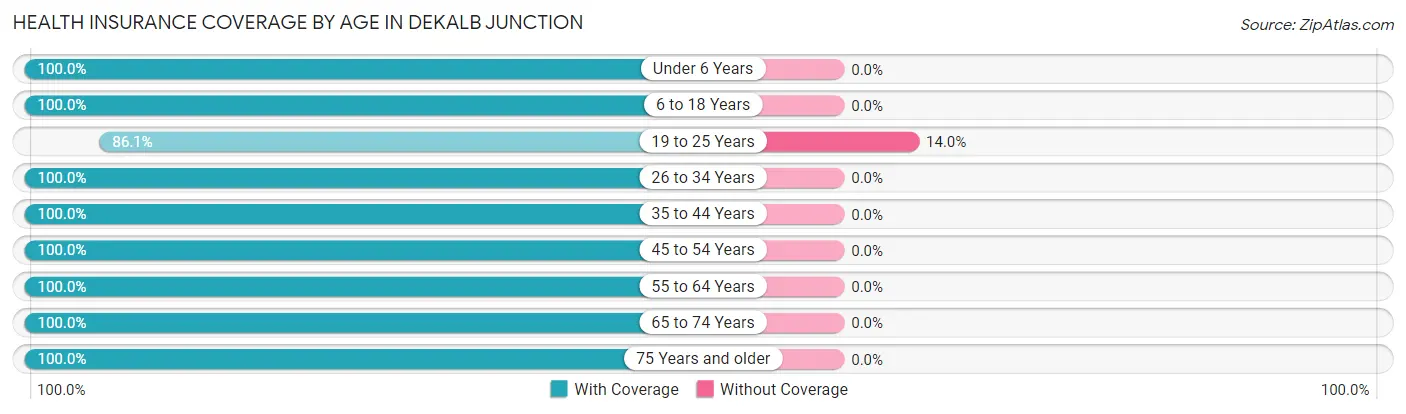
| Age Bracket | With Coverage | Without Coverage |
| Under 6 Years | 12 (100.0%) | 0 (0.0%) |
| 6 to 18 Years | 150 (100.0%) | 0 (0.0%) |
| 19 to 25 Years | 37 (86.1%) | 6 (14.0%) |
| 26 to 34 Years | 64 (100.0%) | 0 (0.0%) |
| 35 to 44 Years | 87 (100.0%) | 0 (0.0%) |
| 45 to 54 Years | 128 (100.0%) | 0 (0.0%) |
| 55 to 64 Years | 36 (100.0%) | 0 (0.0%) |
| 65 to 74 Years | 67 (100.0%) | 0 (0.0%) |
| 75 Years and older | 58 (100.0%) | 0 (0.0%) |
| Total | 639 (99.1%) | 6 (0.9%) |
Health Insurance Coverage by Citizenship Status in DeKalb Junction
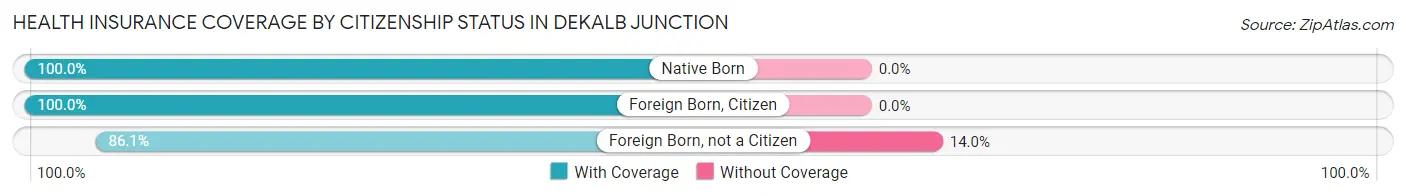
| Citizenship Status | With Coverage | Without Coverage |
| Native Born | 12 (100.0%) | 0 (0.0%) |
| Foreign Born, Citizen | 150 (100.0%) | 0 (0.0%) |
| Foreign Born, not a Citizen | 37 (86.1%) | 6 (14.0%) |
Health Insurance Coverage by Household Income in DeKalb Junction
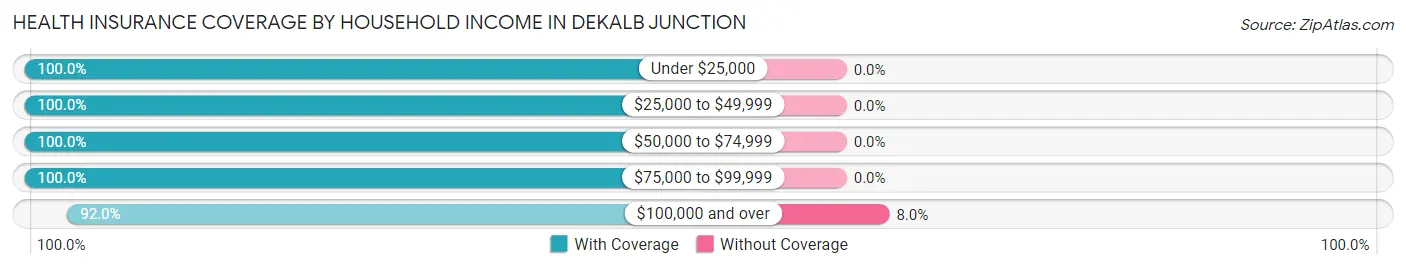
| Household Income | With Coverage | Without Coverage |
| Under $25,000 | 56 (100.0%) | 0 (0.0%) |
| $25,000 to $49,999 | 201 (100.0%) | 0 (0.0%) |
| $50,000 to $74,999 | 79 (100.0%) | 0 (0.0%) |
| $75,000 to $99,999 | 216 (100.0%) | 0 (0.0%) |
| $100,000 and over | 69 (92.0%) | 6 (8.0%) |
Public vs Private Health Insurance Coverage by Age in DeKalb Junction
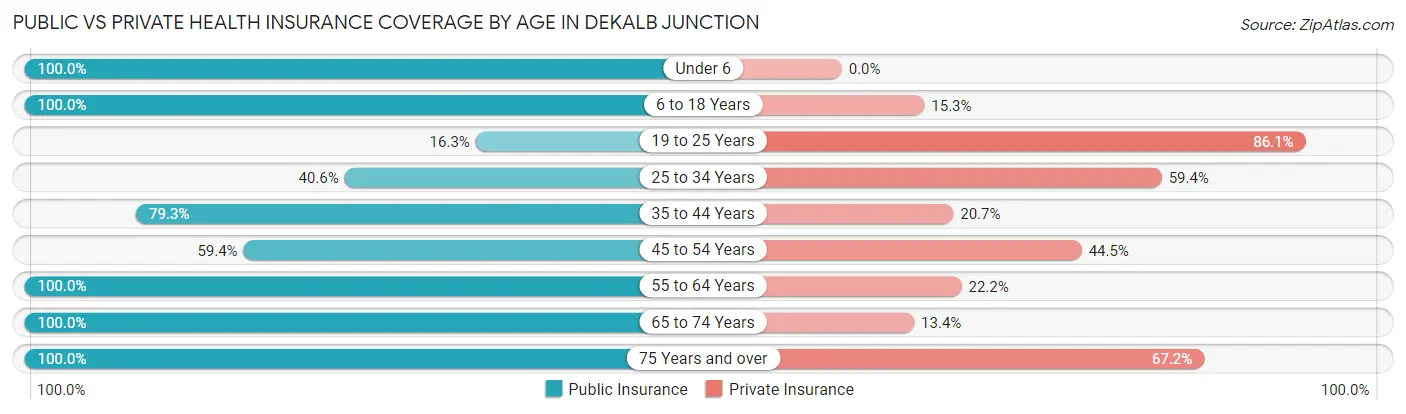
| Age Bracket | Public Insurance | Private Insurance |
| Under 6 | 12 (100.0%) | 0 (0.0%) |
| 6 to 18 Years | 150 (100.0%) | 23 (15.3%) |
| 19 to 25 Years | 7 (16.3%) | 37 (86.1%) |
| 25 to 34 Years | 26 (40.6%) | 38 (59.4%) |
| 35 to 44 Years | 69 (79.3%) | 18 (20.7%) |
| 45 to 54 Years | 76 (59.4%) | 57 (44.5%) |
| 55 to 64 Years | 36 (100.0%) | 8 (22.2%) |
| 65 to 74 Years | 67 (100.0%) | 9 (13.4%) |
| 75 Years and over | 58 (100.0%) | 39 (67.2%) |
| Total | 501 (77.7%) | 229 (35.5%) |
Disability Status by Sex by Age in DeKalb Junction
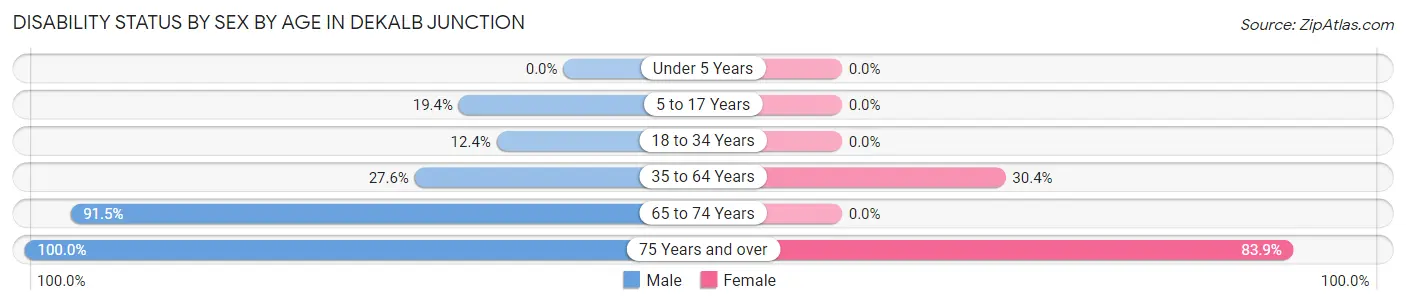
| Age Bracket | Male | Female |
| Under 5 Years | 0 (0.0%) | 0 (0.0%) |
| 5 to 17 Years | 13 (19.4%) | 0 (0.0%) |
| 18 to 34 Years | 13 (12.4%) | 0 (0.0%) |
| 35 to 64 Years | 32 (27.6%) | 41 (30.4%) |
| 65 to 74 Years | 54 (91.5%) | 0 (0.0%) |
| 75 Years and over | 27 (100.0%) | 26 (83.9%) |
Disability Class by Sex by Age in DeKalb Junction
Disability Class: Hearing Difficulty
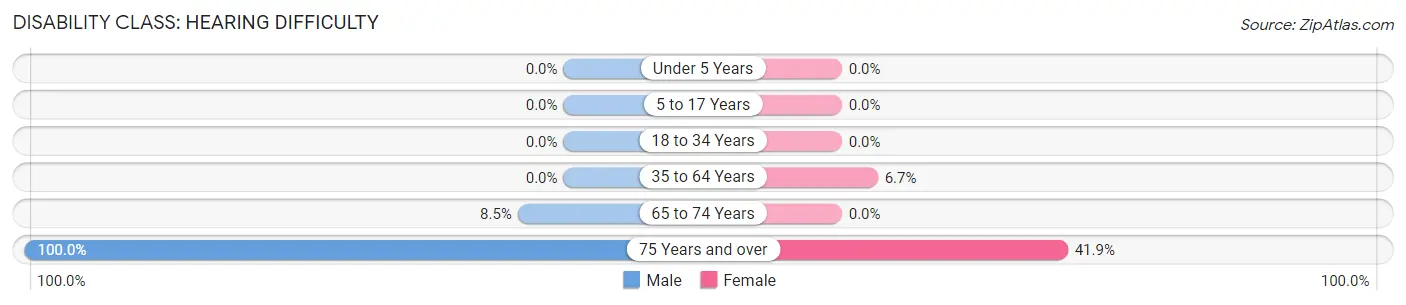
| Age Bracket | Male | Female |
| Under 5 Years | 0 (0.0%) | 0 (0.0%) |
| 5 to 17 Years | 0 (0.0%) | 0 (0.0%) |
| 18 to 34 Years | 0 (0.0%) | 0 (0.0%) |
| 35 to 64 Years | 0 (0.0%) | 9 (6.7%) |
| 65 to 74 Years | 5 (8.5%) | 0 (0.0%) |
| 75 Years and over | 27 (100.0%) | 13 (41.9%) |
Disability Class: Vision Difficulty
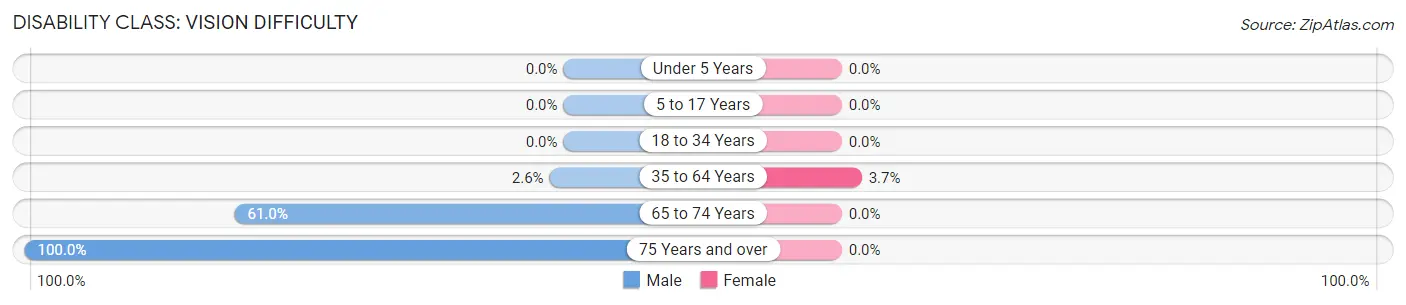
| Age Bracket | Male | Female |
| Under 5 Years | 0 (0.0%) | 0 (0.0%) |
| 5 to 17 Years | 0 (0.0%) | 0 (0.0%) |
| 18 to 34 Years | 0 (0.0%) | 0 (0.0%) |
| 35 to 64 Years | 3 (2.6%) | 5 (3.7%) |
| 65 to 74 Years | 36 (61.0%) | 0 (0.0%) |
| 75 Years and over | 27 (100.0%) | 0 (0.0%) |
Disability Class: Cognitive Difficulty
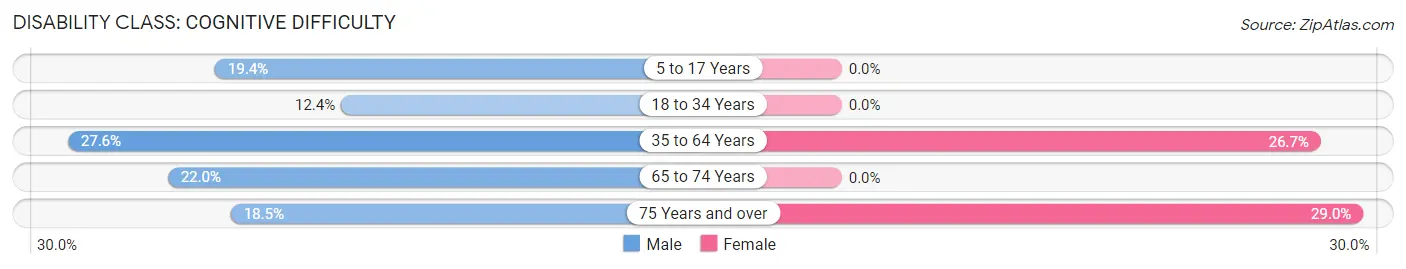
| Age Bracket | Male | Female |
| 5 to 17 Years | 13 (19.4%) | 0 (0.0%) |
| 18 to 34 Years | 13 (12.4%) | 0 (0.0%) |
| 35 to 64 Years | 32 (27.6%) | 36 (26.7%) |
| 65 to 74 Years | 13 (22.0%) | 0 (0.0%) |
| 75 Years and over | 5 (18.5%) | 9 (29.0%) |
Disability Class: Ambulatory Difficulty
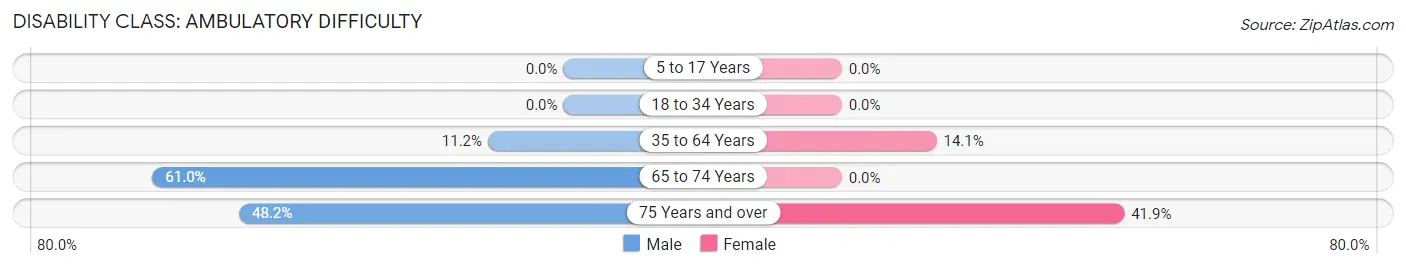
| Age Bracket | Male | Female |
| 5 to 17 Years | 0 (0.0%) | 0 (0.0%) |
| 18 to 34 Years | 0 (0.0%) | 0 (0.0%) |
| 35 to 64 Years | 13 (11.2%) | 19 (14.1%) |
| 65 to 74 Years | 36 (61.0%) | 0 (0.0%) |
| 75 Years and over | 13 (48.1%) | 13 (41.9%) |
Disability Class: Self-Care Difficulty
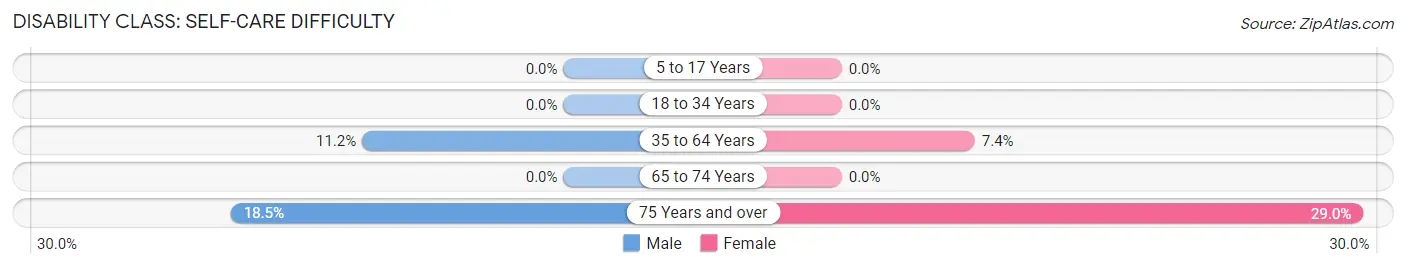
| Age Bracket | Male | Female |
| 5 to 17 Years | 0 (0.0%) | 0 (0.0%) |
| 18 to 34 Years | 0 (0.0%) | 0 (0.0%) |
| 35 to 64 Years | 13 (11.2%) | 10 (7.4%) |
| 65 to 74 Years | 0 (0.0%) | 0 (0.0%) |
| 75 Years and over | 5 (18.5%) | 9 (29.0%) |
Technology Access in DeKalb Junction
Computing Device Access in DeKalb Junction
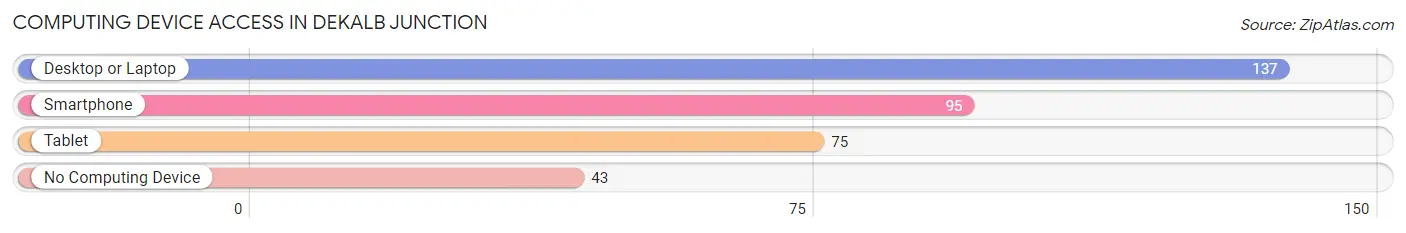
| Device Type | # Households | % Households |
| Desktop or Laptop | 137 | 68.8% |
| Smartphone | 95 | 47.7% |
| Tablet | 75 | 37.7% |
| No Computing Device | 43 | 21.6% |
| Total | 199 | 100.0% |
Internet Access in DeKalb Junction
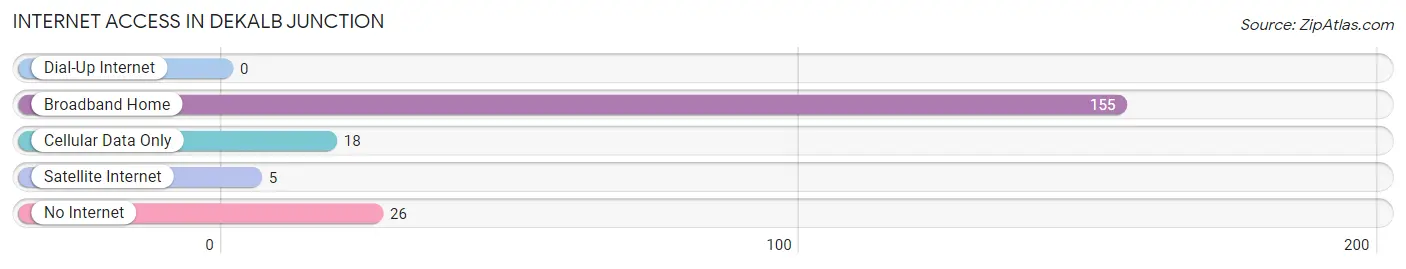
| Internet Type | # Households | % Households |
| Dial-Up Internet | 0 | 0.0% |
| Broadband Home | 155 | 77.9% |
| Cellular Data Only | 18 | 9.0% |
| Satellite Internet | 5 | 2.5% |
| No Internet | 26 | 13.1% |
| Total | 199 | 100.0% |
DeKalb Junction Summary
Dekalb Junction is a small hamlet located in St. Lawrence County, New York. It is situated in the town of DeKalb, which is part of the larger St. Lawrence County. The hamlet is located on the banks of the Oswegatchie River, and is home to a population of approximately 500 people.
Geography
Dekalb Junction is located in the northern part of St. Lawrence County, in the town of DeKalb. It is situated on the banks of the Oswegatchie River, which is a tributary of the St. Lawrence River. The hamlet is located approximately 20 miles south of the Canadian border, and is bordered by the towns of DeKalb, Hermon, and Oswegatchie. The hamlet is located in a rural area, and is surrounded by rolling hills and forests.
History
Dekalb Junction was first settled in the early 19th century by settlers from New England. The hamlet was originally known as “DeKalb”, after the town of DeKalb in which it is located. The hamlet was officially incorporated in 1848, and was named after the nearby Oswegatchie River. The hamlet was a popular stop for travelers on the Oswegatchie River, and was home to a number of businesses, including a hotel, a general store, and a sawmill.
In the late 19th century, the hamlet began to decline in population as the railroad bypassed the area. The hamlet was eventually abandoned in the early 20th century, and the buildings were left to decay. In the late 20th century, the hamlet began to experience a resurgence in population, and the buildings were restored. Today, the hamlet is a popular destination for tourists, and is home to a number of businesses, including a restaurant, a general store, and a bed and breakfast.
Economy
The economy of Dekalb Junction is largely based on tourism. The hamlet is a popular destination for outdoor enthusiasts, and is home to a number of businesses that cater to tourists. These businesses include a restaurant, a general store, and a bed and breakfast. The hamlet is also home to a number of small farms, which produce a variety of crops, including corn, soybeans, and hay.
Demographics
As of the 2010 census, the population of Dekalb Junction was 498. The population is largely white (97.2%), with a small percentage of African Americans (1.2%) and Native Americans (0.6%). The median household income is $41,250, and the median age is 44. The hamlet is home to a number of churches, including the United Methodist Church, the First Baptist Church, and the Church of the Nazarene.
Conclusion
Dekalb Junction is a small hamlet located in St. Lawrence County, New York. It is situated on the banks of the Oswegatchie River, and is home to a population of approximately 500 people. The hamlet is a popular destination for tourists, and is home to a number of businesses, including a restaurant, a general store, and a bed and breakfast. The economy of Dekalb Junction is largely based on tourism, and the population is largely white. The hamlet is home to a number of churches, and is a popular destination for outdoor enthusiasts.
Common Questions
What is Per Capita Income in DeKalb Junction?
Per Capita income in DeKalb Junction is $19,275.
What is the Median Family Income in DeKalb Junction?
Median Family Income in DeKalb Junction is $43,417.
What is the Median Household income in DeKalb Junction?
Median Household Income in DeKalb Junction is $44,583.
What is Income or Wage Gap in DeKalb Junction?
Income or Wage Gap in DeKalb Junction is 41.2%.
Women in DeKalb Junction earn 58.8 cents for every dollar earned by a man.
What is Inequality or Gini Index in DeKalb Junction?
Inequality or Gini Index in DeKalb Junction is 0.36.
What is the Total Population of DeKalb Junction?
Total Population of DeKalb Junction is 645.
What is the Total Male Population of DeKalb Junction?
Total Male Population of DeKalb Junction is 381.
What is the Total Female Population of DeKalb Junction?
Total Female Population of DeKalb Junction is 264.
What is the Ratio of Males per 100 Females in DeKalb Junction?
There are 144.32 Males per 100 Females in DeKalb Junction.
What is the Ratio of Females per 100 Males in DeKalb Junction?
There are 69.29 Females per 100 Males in DeKalb Junction.
What is the Median Population Age in DeKalb Junction?
Median Population Age in DeKalb Junction is 42.4 Years.
What is the Average Family Size in DeKalb Junction
Average Family Size in DeKalb Junction is 3.3 People.
What is the Average Household Size in DeKalb Junction
Average Household Size in DeKalb Junction is 3.1 People.
How Large is the Labor Force in DeKalb Junction?
There are 265 People in the Labor Forcein in DeKalb Junction.
What is the Percentage of People in the Labor Force in DeKalb Junction?
48.8% of People are in the Labor Force in DeKalb Junction.
What is the Unemployment Rate in DeKalb Junction?
Unemployment Rate in DeKalb Junction is 2.6%.