Dover Plains, NY Map & Demographics
Dover Plains Map
Dover Plains Overview
$33,474
PER CAPITA INCOME
$79,214
AVG FAMILY INCOME
$58,750
AVG HOUSEHOLD INCOME
20.8%
WAGE / INCOME GAP [ % ]
79.2¢/ $1
WAGE / INCOME GAP [ $ ]
0.43
INEQUALITY / GINI INDEX
1,154
TOTAL POPULATION
530
MALE POPULATION
624
FEMALE POPULATION
84.94
MALES / 100 FEMALES
117.74
FEMALES / 100 MALES
51.8
MEDIAN AGE
2.8
AVG FAMILY SIZE
2.3
AVG HOUSEHOLD SIZE
562
LABOR FORCE [ PEOPLE ]
56.0%
PERCENT IN LABOR FORCE
3.6%
UNEMPLOYMENT RATE
Dover Plains Zip Codes
Dover Plains Area Codes
Income in Dover Plains
Income Overview in Dover Plains
Per Capita Income in Dover Plains is $33,474, while median incomes of families and households are $79,214 and $58,750 respectively.
| Characteristic | Number | Measure |
| Per Capita Income | 1,154 | $33,474 |
| Median Family Income | 274 | $79,214 |
| Mean Family Income | 274 | $84,600 |
| Median Household Income | 466 | $58,750 |
| Mean Household Income | 466 | $81,395 |
| Income Deficit | 274 | $0 |
| Wage / Income Gap (%) | 1,154 | 20.76% |
| Wage / Income Gap ($) | 1,154 | 79.24¢ per $1 |
| Gini / Inequality Index | 1,154 | 0.43 |
Earnings by Sex in Dover Plains
Average Earnings in Dover Plains are $39,301, $38,233 for men and $48,250 for women, a difference of 20.8%.
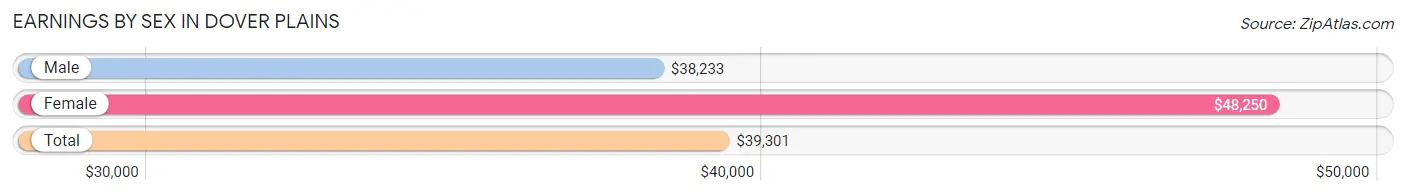
| Sex | Number | Average Earnings |
| Male | 270 (47.0%) | $38,233 |
| Female | 304 (53.0%) | $48,250 |
| Total | 574 (100.0%) | $39,301 |
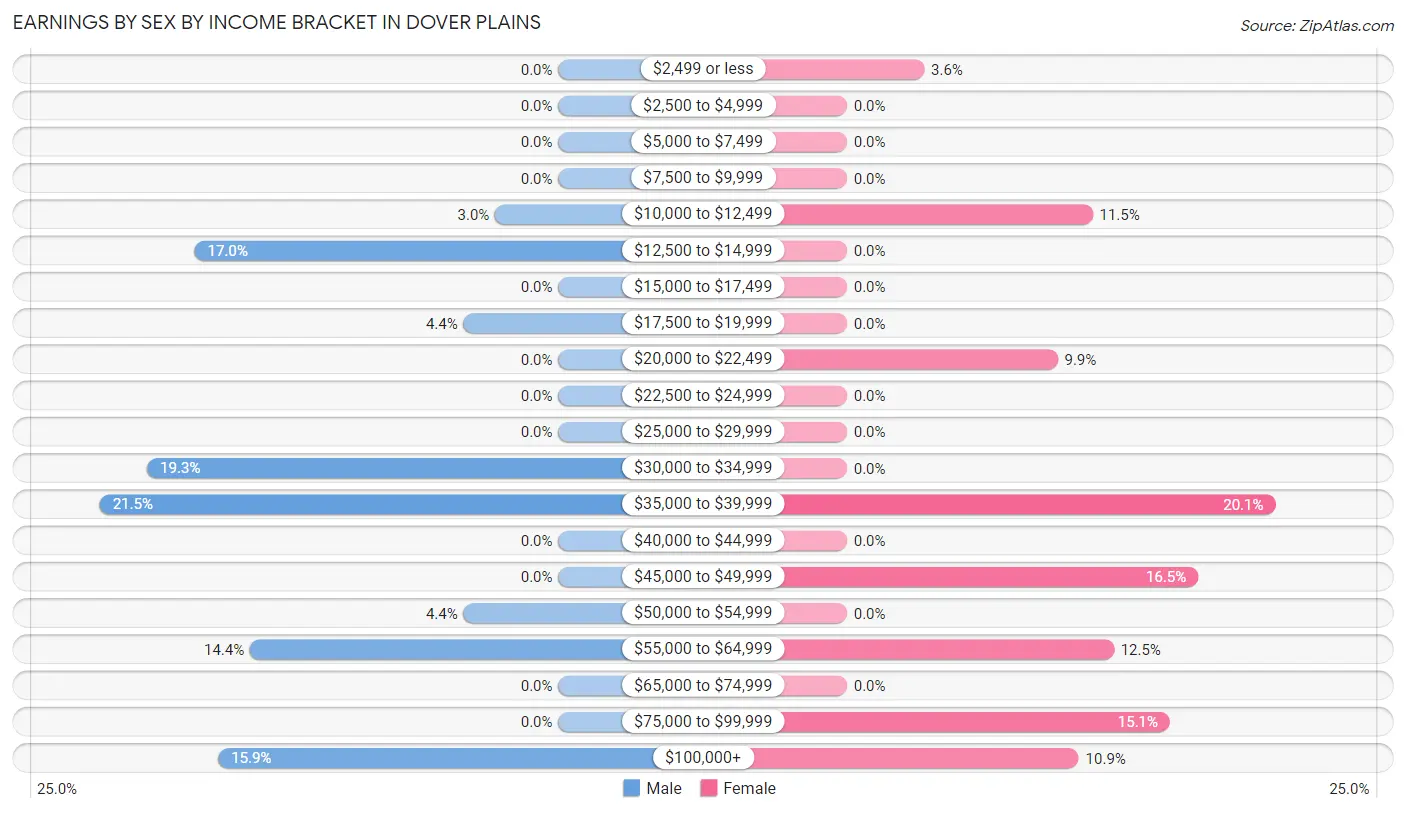
Earnings by Sex by Income Bracket in Dover Plains
The most common earnings brackets in Dover Plains are $35,000 to $39,999 for men (58 | 21.5%) and $35,000 to $39,999 for women (61 | 20.1%).
| Income | Male | Female |
| $2,499 or less | 0 (0.0%) | 11 (3.6%) |
| $2,500 to $4,999 | 0 (0.0%) | 0 (0.0%) |
| $5,000 to $7,499 | 0 (0.0%) | 0 (0.0%) |
| $7,500 to $9,999 | 0 (0.0%) | 0 (0.0%) |
| $10,000 to $12,499 | 8 (3.0%) | 35 (11.5%) |
| $12,500 to $14,999 | 46 (17.0%) | 0 (0.0%) |
| $15,000 to $17,499 | 0 (0.0%) | 0 (0.0%) |
| $17,500 to $19,999 | 12 (4.4%) | 0 (0.0%) |
| $20,000 to $22,499 | 0 (0.0%) | 30 (9.9%) |
| $22,500 to $24,999 | 0 (0.0%) | 0 (0.0%) |
| $25,000 to $29,999 | 0 (0.0%) | 0 (0.0%) |
| $30,000 to $34,999 | 52 (19.3%) | 0 (0.0%) |
| $35,000 to $39,999 | 58 (21.5%) | 61 (20.1%) |
| $40,000 to $44,999 | 0 (0.0%) | 0 (0.0%) |
| $45,000 to $49,999 | 0 (0.0%) | 50 (16.5%) |
| $50,000 to $54,999 | 12 (4.4%) | 0 (0.0%) |
| $55,000 to $64,999 | 39 (14.4%) | 38 (12.5%) |
| $65,000 to $74,999 | 0 (0.0%) | 0 (0.0%) |
| $75,000 to $99,999 | 0 (0.0%) | 46 (15.1%) |
| $100,000+ | 43 (15.9%) | 33 (10.9%) |
| Total | 270 (100.0%) | 304 (100.0%) |
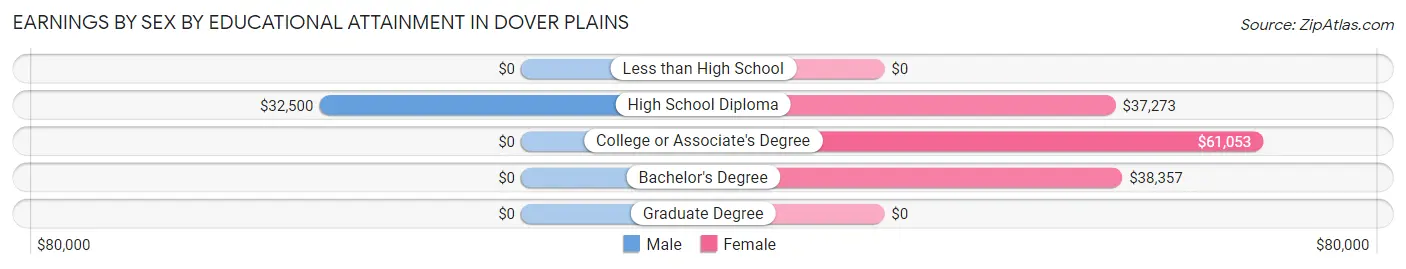
Earnings by Sex by Educational Attainment in Dover Plains
Average earnings in Dover Plains are $38,233 for men and $48,250 for women, a difference of 20.8%. Men with an educational attainment of high school diploma enjoy the highest average annual earnings of $32,500, while those with high school diploma education earn the least with $32,500. Women with an educational attainment of college or associate's degree earn the most with the average annual earnings of $61,053, while those with high school diploma education have the smallest earnings of $37,273.
| Educational Attainment | Male Income | Female Income |
| Less than High School | - | - |
| High School Diploma | $32,500 | $37,273 |
| College or Associate's Degree | - | - |
| Bachelor's Degree | - | - |
| Graduate Degree | - | - |
| Total | $38,233 | $48,250 |
Family Income in Dover Plains
Family Income Brackets in Dover Plains
According to the Dover Plains family income data, there are 69 families falling into the $100,000 to $149,999 income range, which is the most common income bracket and makes up 25.2% of all families.
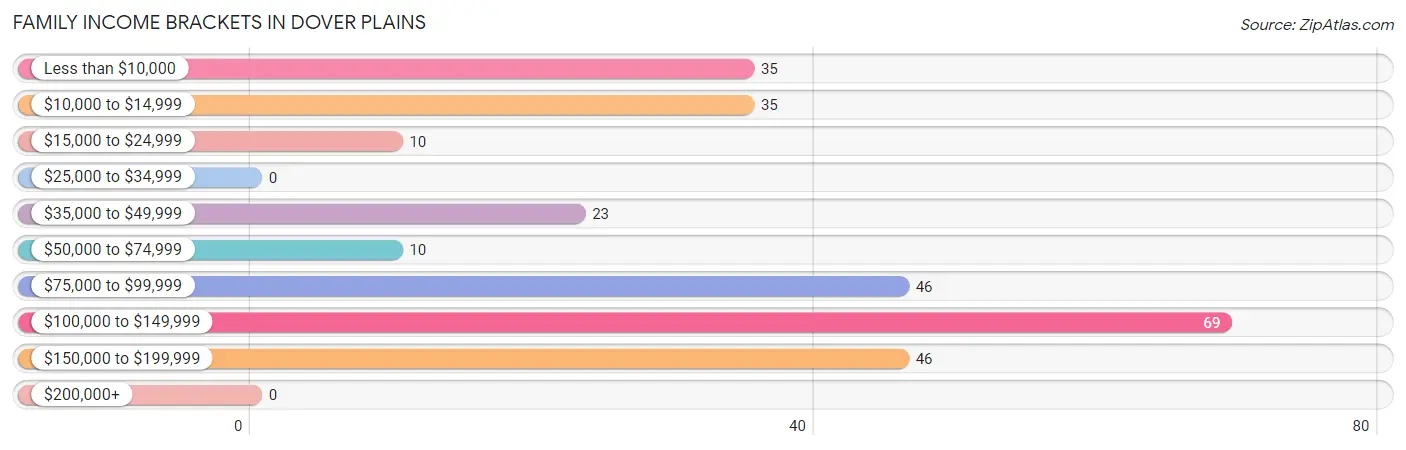
| Income Bracket | # Families | % Families |
| Less than $10,000 | 35 | 12.8% |
| $10,000 to $14,999 | 35 | 12.8% |
| $15,000 to $24,999 | 10 | 3.6% |
| $25,000 to $34,999 | 0 | 0.0% |
| $35,000 to $49,999 | 23 | 8.4% |
| $50,000 to $74,999 | 10 | 3.6% |
| $75,000 to $99,999 | 46 | 16.8% |
| $100,000 to $149,999 | 69 | 25.2% |
| $150,000 to $199,999 | 46 | 16.8% |
| $200,000+ | 0 | 0.0% |
Family Income by Famaliy Size in Dover Plains
2-person families (146 | 53.3%) account for the highest median family income in Dover Plains with $53,750 per family, while 2-person families (146 | 53.3%) have the highest median income of $26,875 per family member.
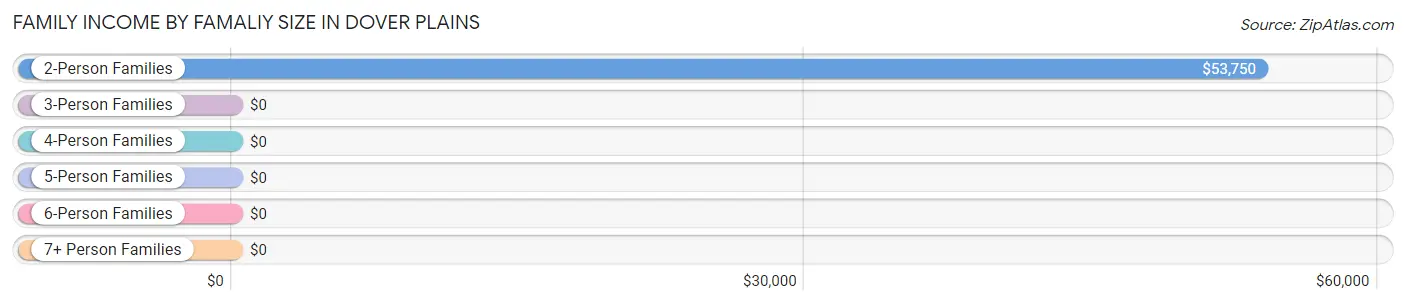
| Income Bracket | # Families | Median Income |
| 2-Person Families | 146 (53.3%) | $53,750 |
| 3-Person Families | 48 (17.5%) | $0 |
| 4-Person Families | 71 (25.9%) | $0 |
| 5-Person Families | 0 (0.0%) | $0 |
| 6-Person Families | 9 (3.3%) | $0 |
| 7+ Person Families | 0 (0.0%) | $0 |
| Total | 274 (100.0%) | $79,214 |
Family Income by Number of Earners in Dover Plains
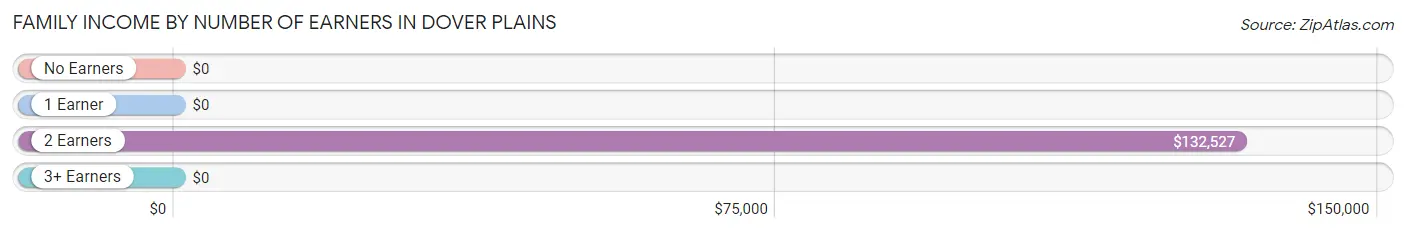
| Number of Earners | # Families | Median Income |
| No Earners | 90 (32.9%) | $0 |
| 1 Earner | 35 (12.8%) | $0 |
| 2 Earners | 113 (41.2%) | $132,527 |
| 3+ Earners | 36 (13.1%) | $0 |
| Total | 274 (100.0%) | $79,214 |
Household Income in Dover Plains
Household Income Brackets in Dover Plains
With 89 households falling in the category, the $100,000 to $149,999 income range is the most frequent in Dover Plains, accounting for 19.1% of all households. In contrast, only 9 households (1.9%) fall into the $10,000 to $14,999 income bracket, making it the least populous group.
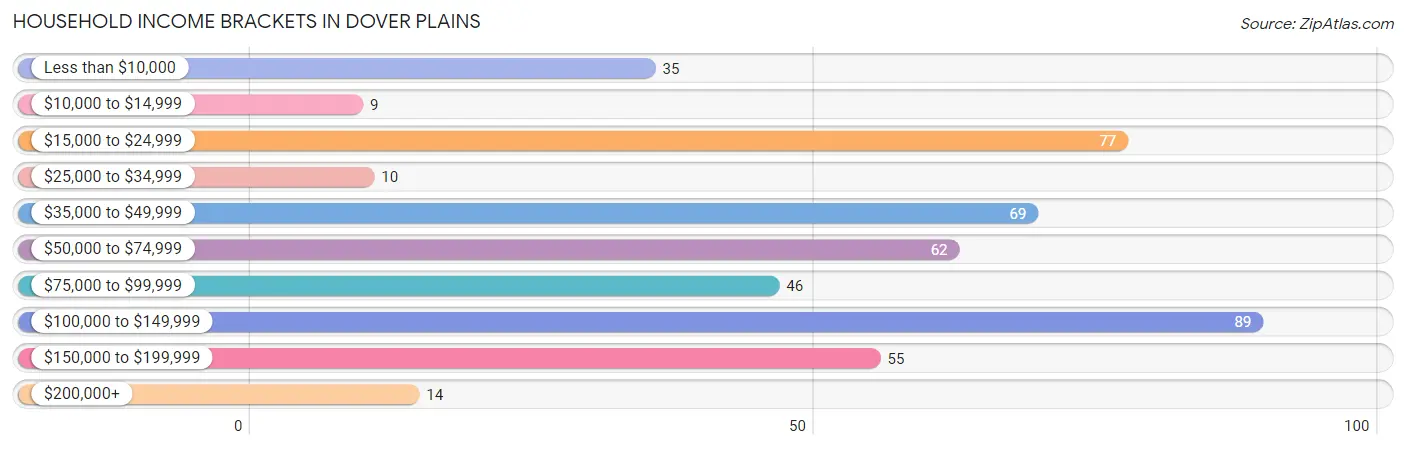
| Income Bracket | # Households | % Households |
| Less than $10,000 | 35 | 7.5% |
| $10,000 to $14,999 | 9 | 1.9% |
| $15,000 to $24,999 | 77 | 16.5% |
| $25,000 to $34,999 | 10 | 2.1% |
| $35,000 to $49,999 | 69 | 14.8% |
| $50,000 to $74,999 | 62 | 13.3% |
| $75,000 to $99,999 | 46 | 9.9% |
| $100,000 to $149,999 | 89 | 19.1% |
| $150,000 to $199,999 | 55 | 11.8% |
| $200,000+ | 14 | 3.0% |
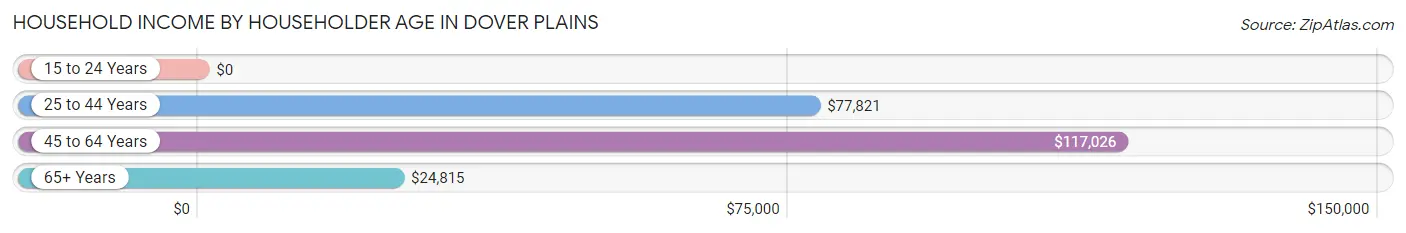
Household Income by Householder Age in Dover Plains
The median household income in Dover Plains is $58,750, with the highest median household income of $117,026 found in the 45 to 64 years age bracket for the primary householder. A total of 197 households (42.3%) fall into this category.
| Income Bracket | # Households | Median Income |
| 15 to 24 Years | 0 (0.0%) | $0 |
| 25 to 44 Years | 109 (23.4%) | $77,821 |
| 45 to 64 Years | 197 (42.3%) | $117,026 |
| 65+ Years | 160 (34.3%) | $24,815 |
| Total | 466 (100.0%) | $58,750 |
Poverty in Dover Plains
Income Below Poverty by Sex and Age in Dover Plains
With 25.5% poverty level for males and 26.4% for females among the residents of Dover Plains, 6 to 11 year old males and 6 to 11 year old females are the most vulnerable to poverty, with 35 males (100.0%) and 35 females (100.0%) in their respective age groups living below the poverty level.
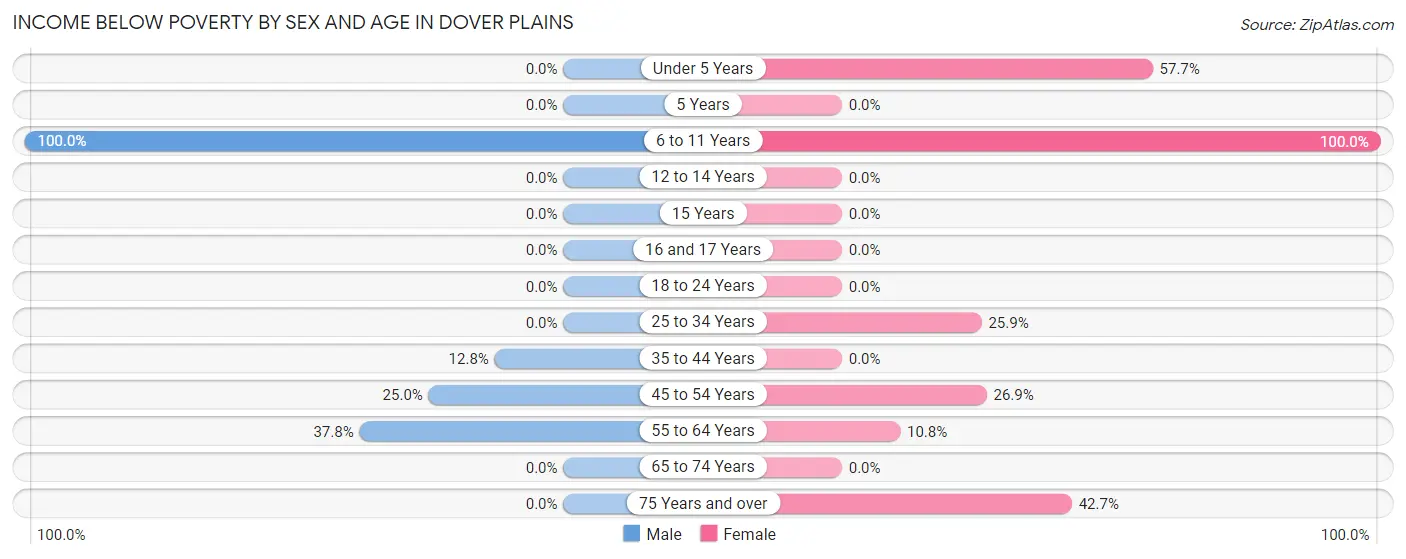
| Age Bracket | Male | Female |
| Under 5 Years | 0 (0.0%) | 30 (57.7%) |
| 5 Years | 0 (0.0%) | 0 (0.0%) |
| 6 to 11 Years | 35 (100.0%) | 35 (100.0%) |
| 12 to 14 Years | 0 (0.0%) | 0 (0.0%) |
| 15 Years | 0 (0.0%) | 0 (0.0%) |
| 16 and 17 Years | 0 (0.0%) | 0 (0.0%) |
| 18 to 24 Years | 0 (0.0%) | 0 (0.0%) |
| 25 to 34 Years | 0 (0.0%) | 35 (25.9%) |
| 35 to 44 Years | 13 (12.8%) | 0 (0.0%) |
| 45 to 54 Years | 17 (25.0%) | 18 (26.9%) |
| 55 to 64 Years | 70 (37.8%) | 12 (10.8%) |
| 65 to 74 Years | 0 (0.0%) | 0 (0.0%) |
| 75 Years and over | 0 (0.0%) | 35 (42.7%) |
| Total | 135 (25.5%) | 165 (26.4%) |
Income Above Poverty by Sex and Age in Dover Plains
According to the poverty statistics in Dover Plains, males aged 25 to 34 years and females aged 12 to 14 years are the age groups that are most secure financially, with 100.0% of males and 100.0% of females in these age groups living above the poverty line.
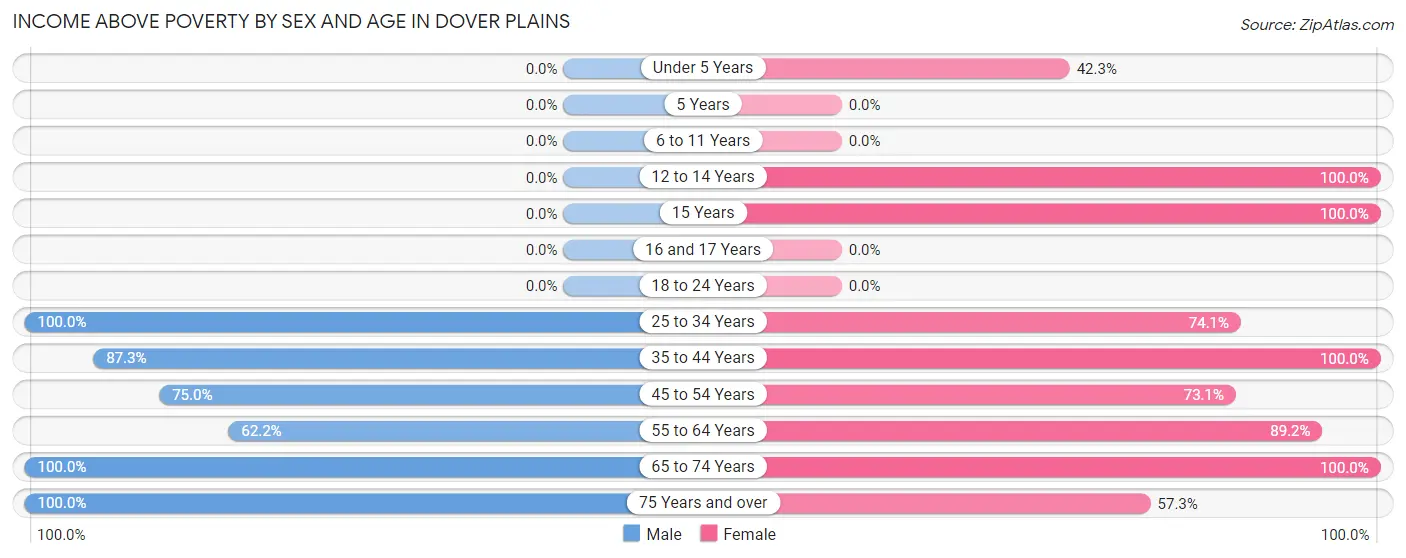
| Age Bracket | Male | Female |
| Under 5 Years | 0 (0.0%) | 22 (42.3%) |
| 5 Years | 0 (0.0%) | 0 (0.0%) |
| 6 to 11 Years | 0 (0.0%) | 0 (0.0%) |
| 12 to 14 Years | 0 (0.0%) | 8 (100.0%) |
| 15 Years | 0 (0.0%) | 21 (100.0%) |
| 16 and 17 Years | 0 (0.0%) | 0 (0.0%) |
| 18 to 24 Years | 0 (0.0%) | 0 (0.0%) |
| 25 to 34 Years | 73 (100.0%) | 100 (74.1%) |
| 35 to 44 Years | 89 (87.3%) | 10 (100.0%) |
| 45 to 54 Years | 51 (75.0%) | 49 (73.1%) |
| 55 to 64 Years | 115 (62.2%) | 99 (89.2%) |
| 65 to 74 Years | 12 (100.0%) | 103 (100.0%) |
| 75 Years and over | 55 (100.0%) | 47 (57.3%) |
| Total | 395 (74.5%) | 459 (73.6%) |
Income Below Poverty Among Married-Couple Families in Dover Plains
The poverty statistics for married-couple families in Dover Plains show that 15.9% or 35 of the total 220 families live below the poverty line. Families with no children have the highest poverty rate of 16.7%, comprising of 35 families. On the other hand, families with 1 or 2 children have the lowest poverty rate of 0.0%, which includes 0 families.
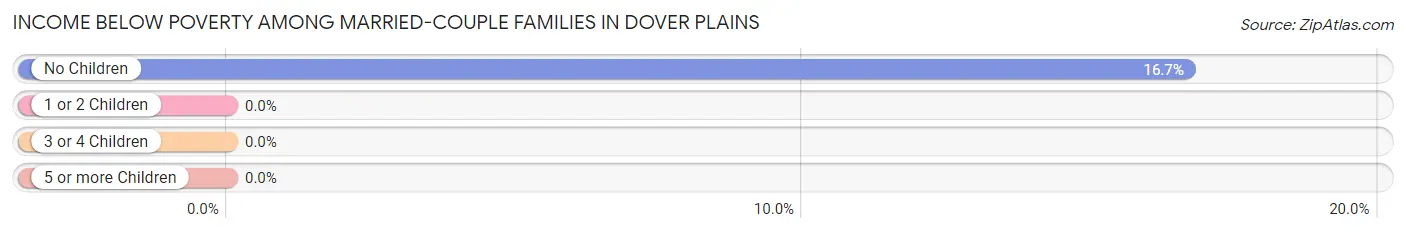
| Children | Above Poverty | Below Poverty |
| No Children | 175 (83.3%) | 35 (16.7%) |
| 1 or 2 Children | 10 (100.0%) | 0 (0.0%) |
| 3 or 4 Children | 0 (0.0%) | 0 (0.0%) |
| 5 or more Children | 0 (0.0%) | 0 (0.0%) |
| Total | 185 (84.1%) | 35 (15.9%) |
Income Below Poverty Among Single-Parent Households in Dover Plains
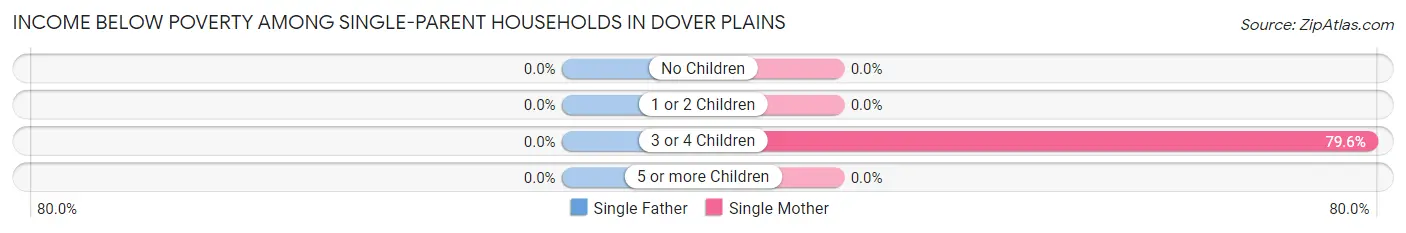
| Children | Single Father | Single Mother |
| No Children | 0 (0.0%) | 0 (0.0%) |
| 1 or 2 Children | 0 (0.0%) | 0 (0.0%) |
| 3 or 4 Children | 0 (0.0%) | 35 (79.5%) |
| 5 or more Children | 0 (0.0%) | 0 (0.0%) |
| Total | 0 (0.0%) | 35 (64.8%) |
Income Below Poverty Among Married-Couple vs Single-Parent Households in Dover Plains
The poverty data for Dover Plains shows that 35 of the married-couple family households (15.9%) and 35 of the single-parent households (64.8%) are living below the poverty level. Within the married-couple family households, those with no children have the highest poverty rate, with 35 households (16.7%) falling below the poverty line. Among the single-parent households, those with 3 or 4 children have the highest poverty rate, with 35 household (79.5%) living below poverty.
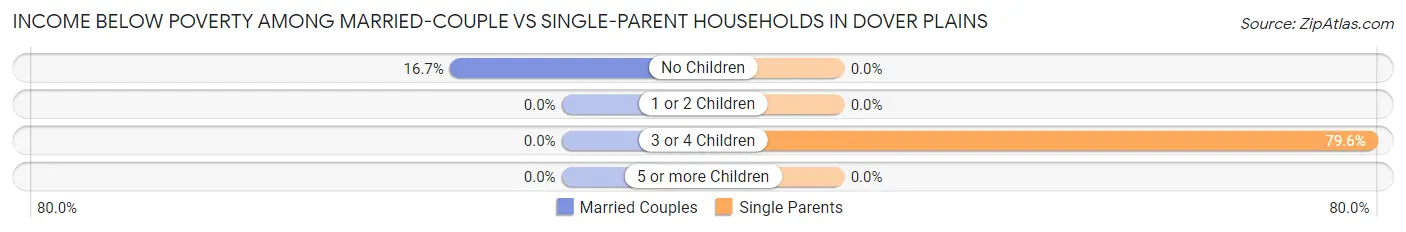
| Children | Married-Couple Families | Single-Parent Households |
| No Children | 35 (16.7%) | 0 (0.0%) |
| 1 or 2 Children | 0 (0.0%) | 0 (0.0%) |
| 3 or 4 Children | 0 (0.0%) | 35 (79.5%) |
| 5 or more Children | 0 (0.0%) | 0 (0.0%) |
| Total | 35 (15.9%) | 35 (64.8%) |
Race in Dover Plains
The most populous races in Dover Plains are White / Caucasian (1,037 | 89.9%), Hispanic or Latino (217 | 18.8%), and Two or more Races (100 | 8.7%).
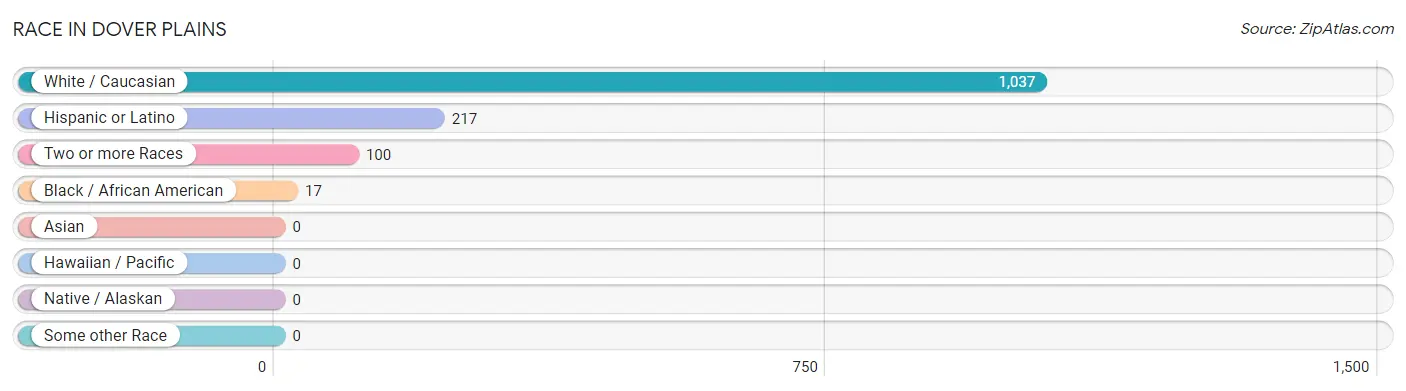
| Race | # Population | % Population |
| Asian | 0 | 0.0% |
| Black / African American | 17 | 1.5% |
| Hawaiian / Pacific | 0 | 0.0% |
| Hispanic or Latino | 217 | 18.8% |
| Native / Alaskan | 0 | 0.0% |
| White / Caucasian | 1,037 | 89.9% |
| Two or more Races | 100 | 8.7% |
| Some other Race | 0 | 0.0% |
| Total | 1,154 | 100.0% |
Ancestry in Dover Plains
The most populous ancestries reported in Dover Plains are Irish (234 | 20.3%), Italian (207 | 17.9%), American (137 | 11.9%), Ecuadorian (111 | 9.6%), and South American (111 | 9.6%), together accounting for 69.3% of all Dover Plains residents.
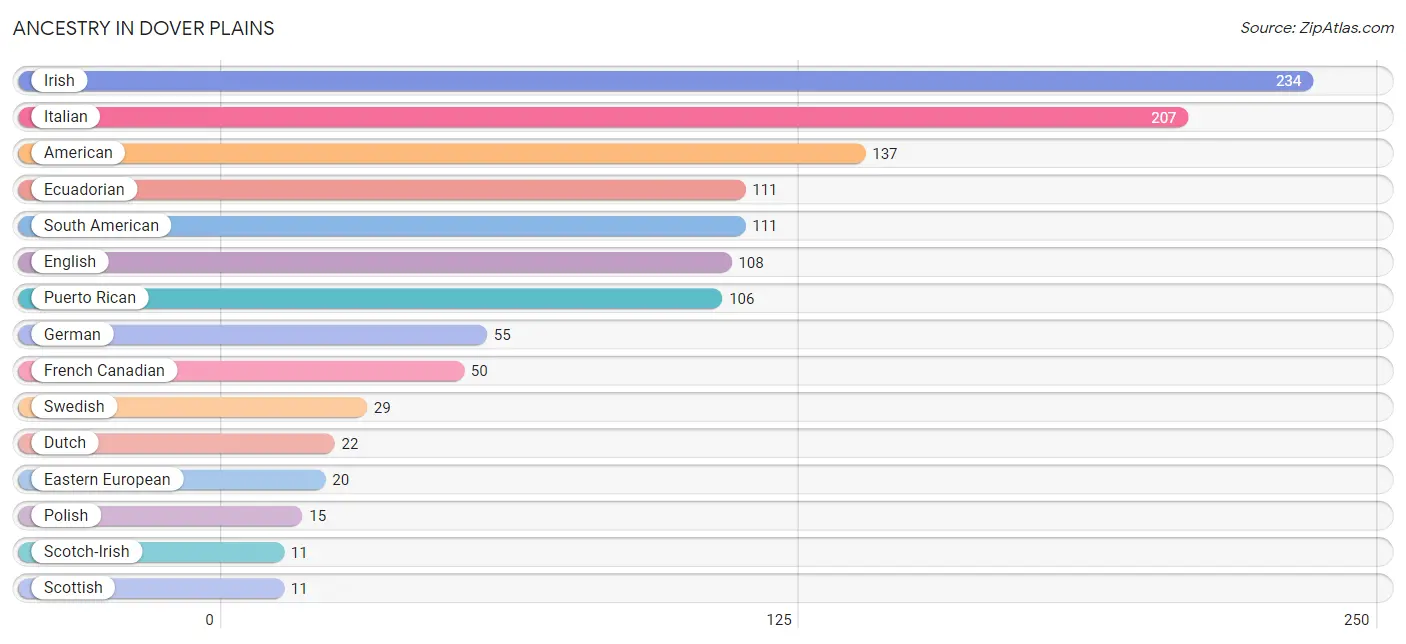
| Ancestry | # Population | % Population |
| American | 137 | 11.9% |
| Dutch | 22 | 1.9% |
| Eastern European | 20 | 1.7% |
| Ecuadorian | 111 | 9.6% |
| English | 108 | 9.4% |
| French Canadian | 50 | 4.3% |
| German | 55 | 4.8% |
| Irish | 234 | 20.3% |
| Italian | 207 | 17.9% |
| Polish | 15 | 1.3% |
| Puerto Rican | 106 | 9.2% |
| Scotch-Irish | 11 | 0.9% |
| Scottish | 11 | 0.9% |
| South American | 111 | 9.6% |
| Swedish | 29 | 2.5% | View All 15 Rows |
Immigrants in Dover Plains
The most numerous immigrant groups reported in Dover Plains came from Latin America (123 | 10.7%), Europe (121 | 10.5%), Ecuador (111 | 9.6%), South America (111 | 9.6%), and Eastern Europe (110 | 9.5%), together accounting for 49.9% of all Dover Plains residents.
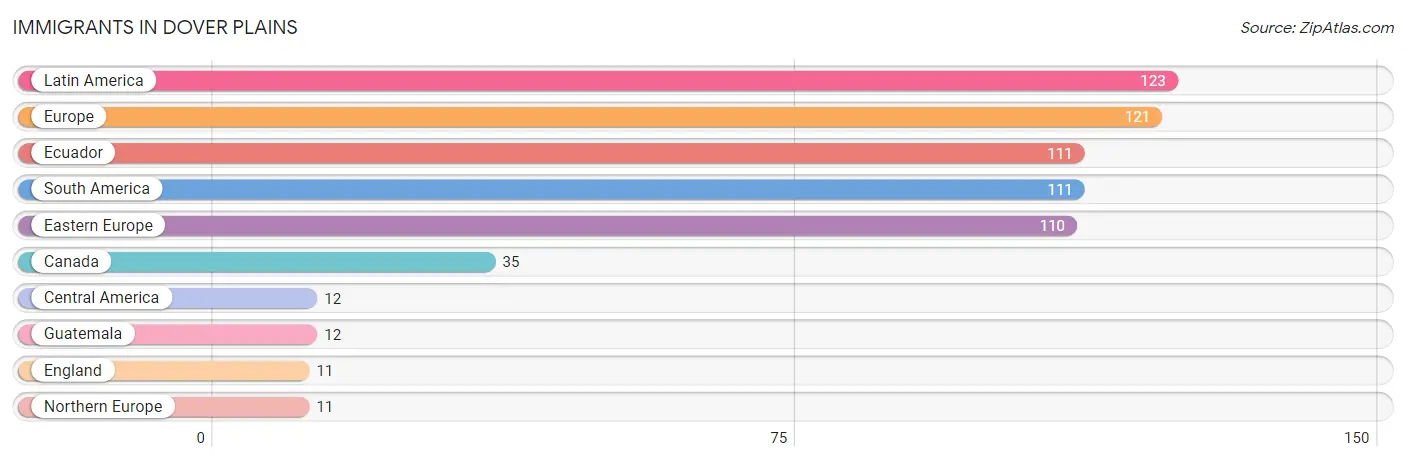
| Immigration Origin | # Population | % Population |
| Canada | 35 | 3.0% |
| Central America | 12 | 1.0% |
| Eastern Europe | 110 | 9.5% |
| Ecuador | 111 | 9.6% |
| England | 11 | 0.9% |
| Europe | 121 | 10.5% |
| Guatemala | 12 | 1.0% |
| Latin America | 123 | 10.7% |
| Northern Europe | 11 | 0.9% |
| South America | 111 | 9.6% | View All 10 Rows |
Sex and Age in Dover Plains
Sex and Age in Dover Plains
The most populous age groups in Dover Plains are 60 to 64 Years (115 | 21.7%) for men and 30 to 34 Years (135 | 21.6%) for women.
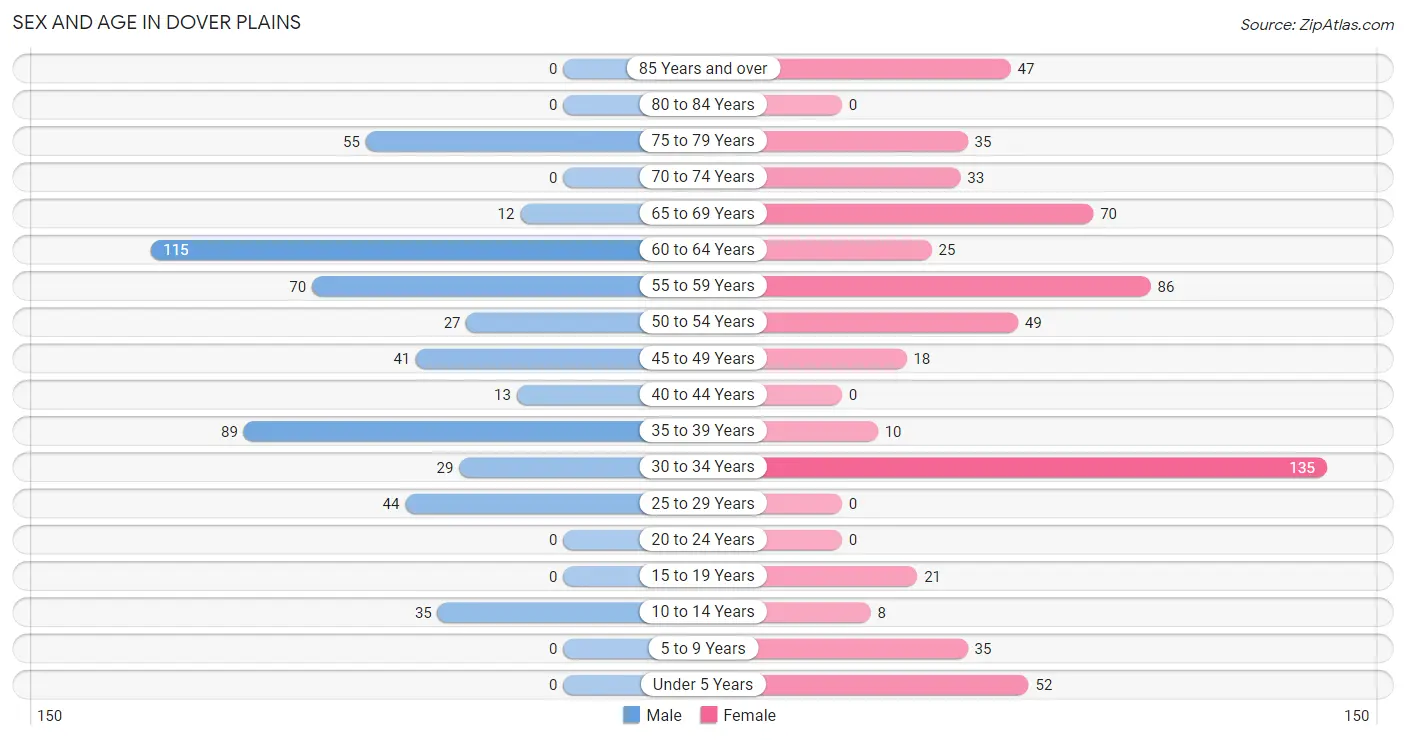
| Age Bracket | Male | Female |
| Under 5 Years | 0 (0.0%) | 52 (8.3%) |
| 5 to 9 Years | 0 (0.0%) | 35 (5.6%) |
| 10 to 14 Years | 35 (6.6%) | 8 (1.3%) |
| 15 to 19 Years | 0 (0.0%) | 21 (3.4%) |
| 20 to 24 Years | 0 (0.0%) | 0 (0.0%) |
| 25 to 29 Years | 44 (8.3%) | 0 (0.0%) |
| 30 to 34 Years | 29 (5.5%) | 135 (21.6%) |
| 35 to 39 Years | 89 (16.8%) | 10 (1.6%) |
| 40 to 44 Years | 13 (2.5%) | 0 (0.0%) |
| 45 to 49 Years | 41 (7.7%) | 18 (2.9%) |
| 50 to 54 Years | 27 (5.1%) | 49 (7.9%) |
| 55 to 59 Years | 70 (13.2%) | 86 (13.8%) |
| 60 to 64 Years | 115 (21.7%) | 25 (4.0%) |
| 65 to 69 Years | 12 (2.3%) | 70 (11.2%) |
| 70 to 74 Years | 0 (0.0%) | 33 (5.3%) |
| 75 to 79 Years | 55 (10.4%) | 35 (5.6%) |
| 80 to 84 Years | 0 (0.0%) | 0 (0.0%) |
| 85 Years and over | 0 (0.0%) | 47 (7.5%) |
| Total | 530 (100.0%) | 624 (100.0%) |
Families and Households in Dover Plains
Median Family Size in Dover Plains
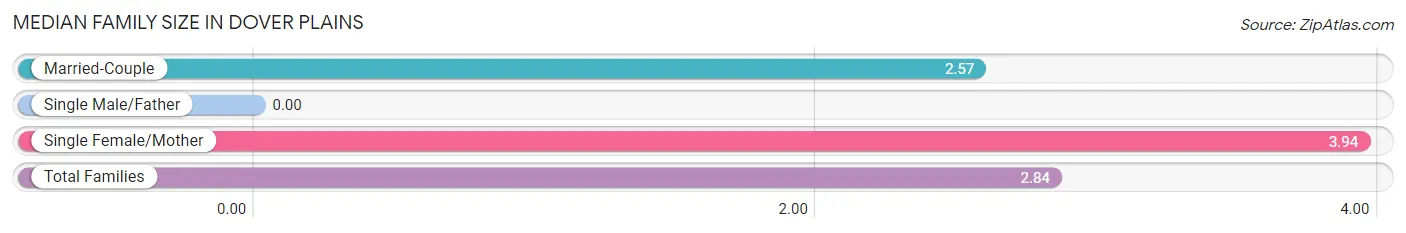
| Family Type | # Families | Family Size |
| Married-Couple | 220 (80.3%) | 2.57 |
| Single Male/Father | 0 (0.0%) | - |
| Single Female/Mother | 54 (19.7%) | 3.94 |
| Total Families | 274 (100.0%) | 2.84 |
Median Household Size in Dover Plains
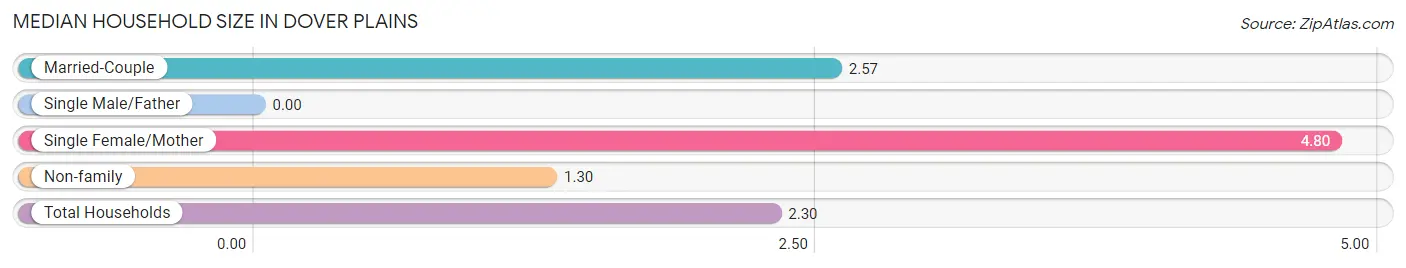
| Household Type | # Households | Household Size |
| Married-Couple | 220 (47.2%) | 2.57 |
| Single Male/Father | 0 (0.0%) | - |
| Single Female/Mother | 54 (11.6%) | 4.80 |
| Non-family | 192 (41.2%) | 1.30 |
| Total Households | 466 (100.0%) | 2.30 |
Household Size by Marriage Status in Dover Plains
Out of a total of 466 households in Dover Plains, 274 (58.8%) are family households, while 192 (41.2%) are nonfamily households. The most numerous type of family households are 2-person households, comprising 146, and the most common type of nonfamily households are 1-person households, comprising 133.
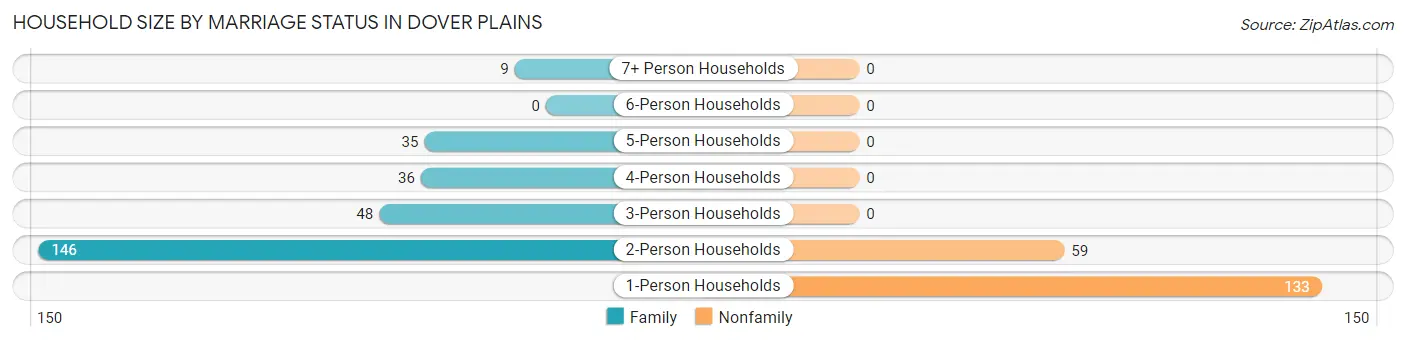
| Household Size | Family Households | Nonfamily Households |
| 1-Person Households | - | 133 (28.5%) |
| 2-Person Households | 146 (31.3%) | 59 (12.7%) |
| 3-Person Households | 48 (10.3%) | 0 (0.0%) |
| 4-Person Households | 36 (7.7%) | 0 (0.0%) |
| 5-Person Households | 35 (7.5%) | 0 (0.0%) |
| 6-Person Households | 0 (0.0%) | 0 (0.0%) |
| 7+ Person Households | 9 (1.9%) | 0 (0.0%) |
| Total | 274 (58.8%) | 192 (41.2%) |
Female Fertility in Dover Plains
Fertility by Age in Dover Plains
| Age Bracket | Women with Births | Births / 1,000 Women |
| 15 to 19 years | 0 (0.0%) | 0.0 |
| 20 to 34 years | 0 (0.0%) | 0.0 |
| 35 to 50 years | 0 (0.0%) | 0.0 |
| Total | 0 (0.0%) | 0.0 |
Fertility by Age by Marriage Status in Dover Plains
| Age Bracket | Married | Unmarried |
| 15 to 19 years | 0 (0.0%) | 0 (0.0%) |
| 20 to 34 years | 0 (0.0%) | 0 (0.0%) |
| 35 to 50 years | 0 (0.0%) | 0 (0.0%) |
| Total | 0 (0.0%) | 0 (0.0%) |
Fertility by Education in Dover Plains
| Educational Attainment | Women with Births | Births / 1,000 Women |
| Less than High School | 0 (0.0%) | 0.0 |
| High School Diploma | 0 (0.0%) | 0.0 |
| College or Associate's Degree | 0 (0.0%) | 0.0 |
| Bachelor's Degree | 0 (0.0%) | 0.0 |
| Graduate Degree | 0 (0.0%) | 0.0 |
| Total | 0 (0.0%) | 0.0 |
Fertility by Education by Marriage Status in Dover Plains
| Educational Attainment | Married | Unmarried |
| Less than High School | 0 (0.0%) | 0 (0.0%) |
| High School Diploma | 0 (0.0%) | 0 (0.0%) |
| College or Associate's Degree | 0 (0.0%) | 0 (0.0%) |
| Bachelor's Degree | 0 (0.0%) | 0 (0.0%) |
| Graduate Degree | 0 (0.0%) | 0 (0.0%) |
| Total | 0 (0.0%) | 0 (0.0%) |
Employment Characteristics in Dover Plains
Employment by Class of Employer in Dover Plains
Among the 532 employed individuals in Dover Plains, private company employees (363 | 68.2%), local government employees (50 | 9.4%), and self-employed (incorporated) (46 | 8.6%) make up the most common classes of employment.
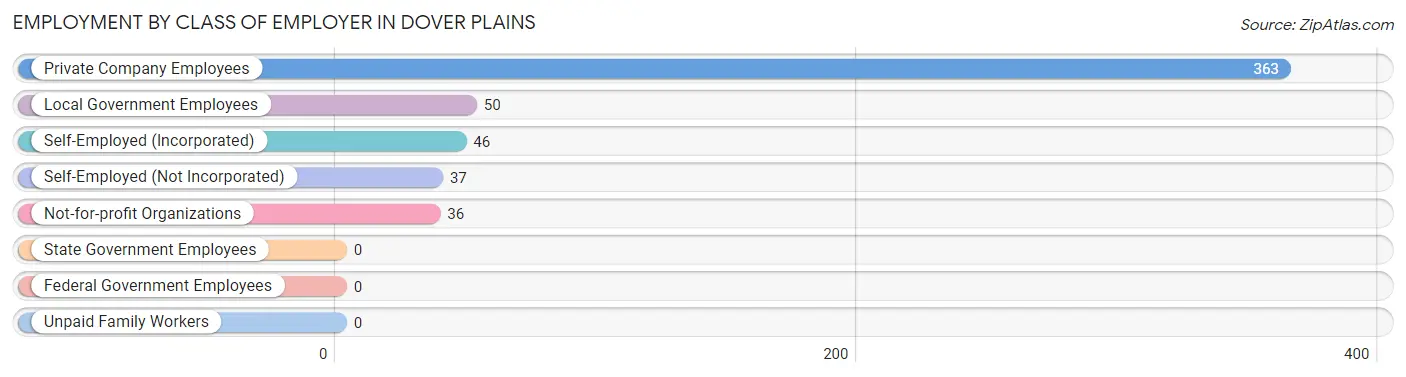
| Employer Class | # Employees | % Employees |
| Private Company Employees | 363 | 68.2% |
| Self-Employed (Incorporated) | 46 | 8.6% |
| Self-Employed (Not Incorporated) | 37 | 7.0% |
| Not-for-profit Organizations | 36 | 6.8% |
| Local Government Employees | 50 | 9.4% |
| State Government Employees | 0 | 0.0% |
| Federal Government Employees | 0 | 0.0% |
| Unpaid Family Workers | 0 | 0.0% |
| Total | 532 | 100.0% |
Employment Status by Age in Dover Plains
According to the labor force statistics for Dover Plains, out of the total population over 16 years of age (1,003), 56.0% or 562 individuals are in the labor force, with 3.6% or 20 of them unemployed. The age group with the highest labor force participation rate is 25 to 29 years, with 100.0% or 44 individuals in the labor force. Within the labor force, the 60 to 64 years age range has the highest percentage of unemployed individuals, with 12.9% or 11 of them being unemployed.
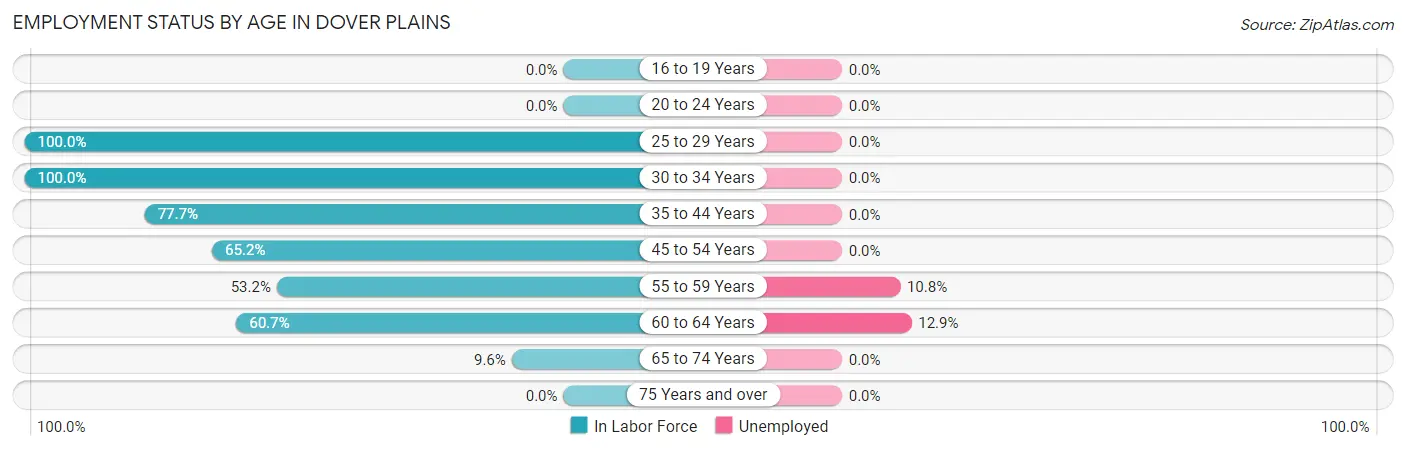
| Age Bracket | In Labor Force | Unemployed |
| 16 to 19 Years | 0 (0.0%) | 0 (0.0%) |
| 20 to 24 Years | 0 (0.0%) | 0 (0.0%) |
| 25 to 29 Years | 44 (100.0%) | 0 (0.0%) |
| 30 to 34 Years | 164 (100.0%) | 0 (0.0%) |
| 35 to 44 Years | 87 (77.7%) | 0 (0.0%) |
| 45 to 54 Years | 88 (65.2%) | 0 (0.0%) |
| 55 to 59 Years | 83 (53.2%) | 9 (10.8%) |
| 60 to 64 Years | 85 (60.7%) | 11 (12.9%) |
| 65 to 74 Years | 11 (9.6%) | 0 (0.0%) |
| 75 Years and over | 0 (0.0%) | 0 (0.0%) |
| Total | 562 (56.0%) | 20 (3.6%) |
Employment Status by Educational Attainment in Dover Plains
According to labor force statistics for Dover Plains, 73.4% of individuals (551) out of the total population between 25 and 64 years of age (751) are in the labor force, with 3.6% or 20 of them being unemployed. The group with the highest labor force participation rate are those with the educational attainment of bachelor's degree or higher, with 95.1% or 215 individuals in the labor force. Within the labor force, individuals with high school diploma education have the highest percentage of unemployment, with 4.6% or 11 of them being unemployed.
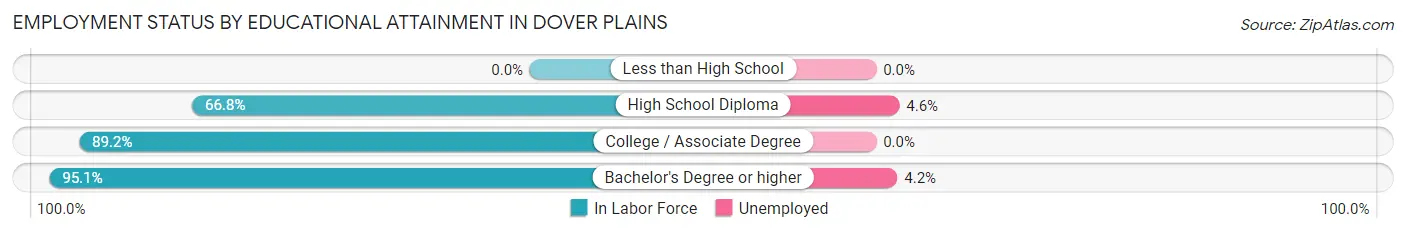
| Educational Attainment | In Labor Force | Unemployed |
| Less than High School | 0 (0.0%) | 0 (0.0%) |
| High School Diploma | 237 (66.8%) | 16 (4.6%) |
| College / Associate Degree | 99 (89.2%) | 0 (0.0%) |
| Bachelor's Degree or higher | 215 (95.1%) | 9 (4.2%) |
| Total | 551 (73.4%) | 27 (3.6%) |
Employment Occupations by Sex in Dover Plains
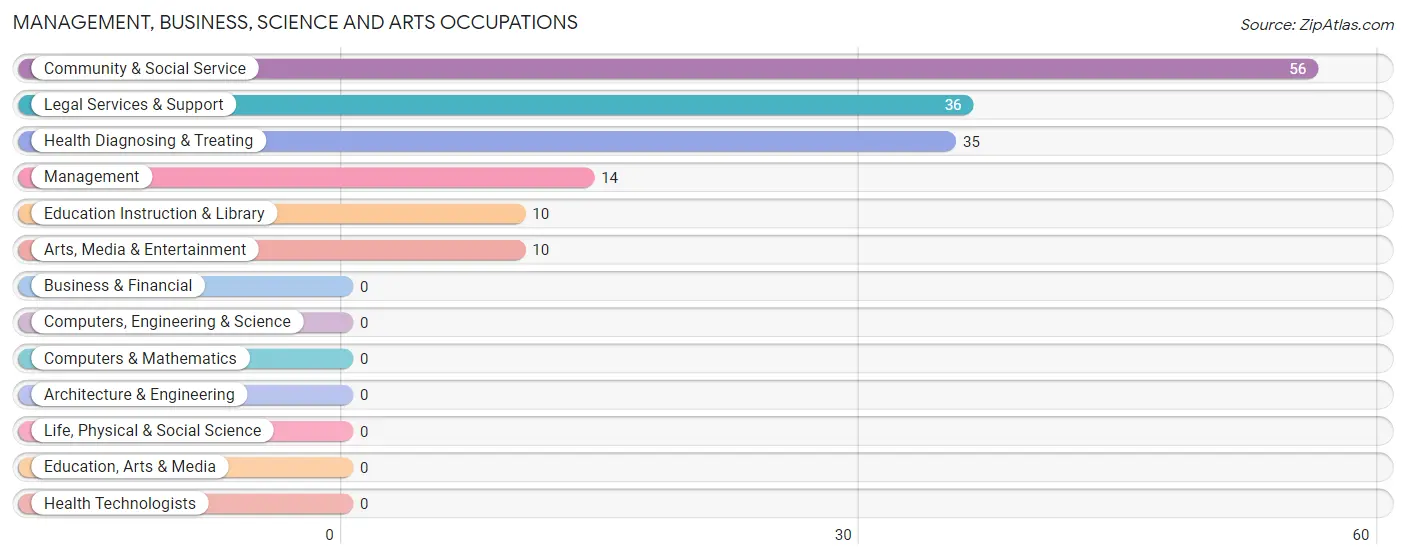
Management, Business, Science and Arts Occupations
The most common Management, Business, Science and Arts occupations in Dover Plains are Community & Social Service (56 | 10.3%), Legal Services & Support (36 | 6.6%), Health Diagnosing & Treating (35 | 6.5%), Management (14 | 2.6%), and Education Instruction & Library (10 | 1.8%).
Management, Business, Science and Arts Occupations by Sex
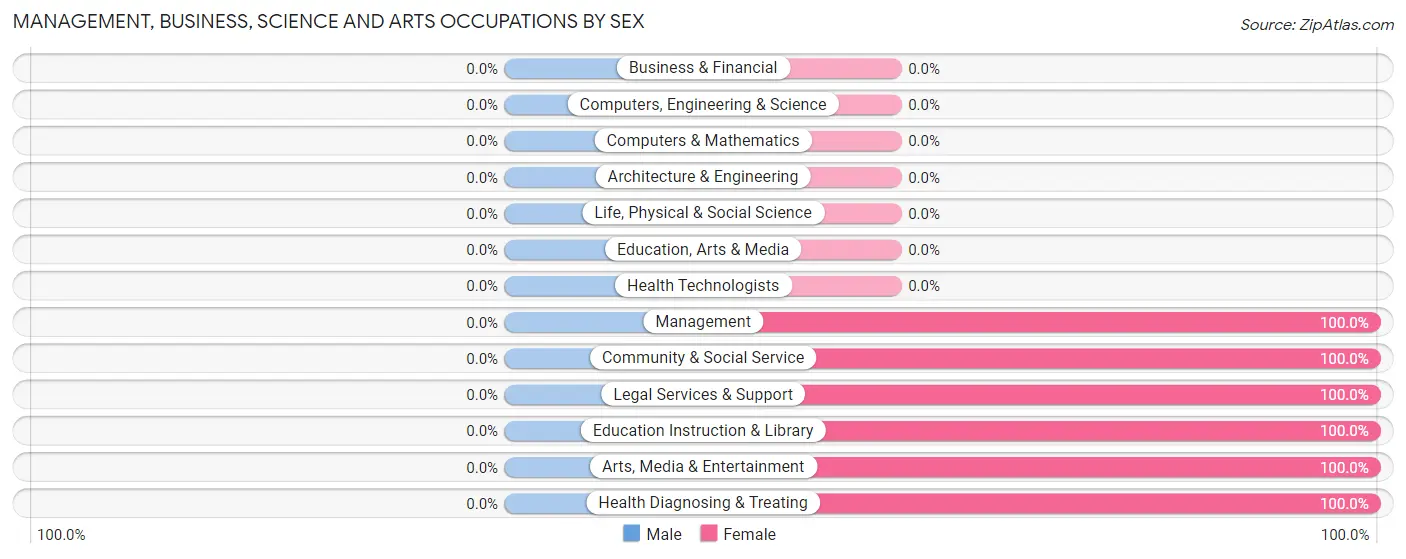
| Occupation | Male | Female |
| Management | 0 (0.0%) | 14 (100.0%) |
| Business & Financial | 0 (0.0%) | 0 (0.0%) |
| Computers, Engineering & Science | 0 (0.0%) | 0 (0.0%) |
| Computers & Mathematics | 0 (0.0%) | 0 (0.0%) |
| Architecture & Engineering | 0 (0.0%) | 0 (0.0%) |
| Life, Physical & Social Science | 0 (0.0%) | 0 (0.0%) |
| Community & Social Service | 0 (0.0%) | 56 (100.0%) |
| Education, Arts & Media | 0 (0.0%) | 0 (0.0%) |
| Legal Services & Support | 0 (0.0%) | 36 (100.0%) |
| Education Instruction & Library | 0 (0.0%) | 10 (100.0%) |
| Arts, Media & Entertainment | 0 (0.0%) | 10 (100.0%) |
| Health Diagnosing & Treating | 0 (0.0%) | 35 (100.0%) |
| Health Technologists | 0 (0.0%) | 0 (0.0%) |
| Total (Category) | 0 (0.0%) | 105 (100.0%) |
| Total (Overall) | 249 (45.9%) | 293 (54.1%) |
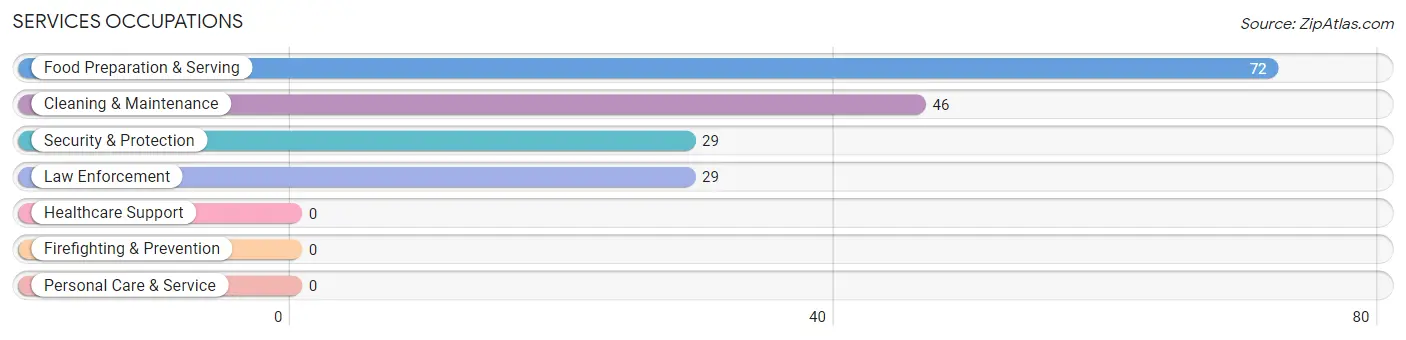
Services Occupations
The most common Services occupations in Dover Plains are Food Preparation & Serving (72 | 13.3%), Cleaning & Maintenance (46 | 8.5%), Security & Protection (29 | 5.3%), and Law Enforcement (29 | 5.3%).
Services Occupations by Sex
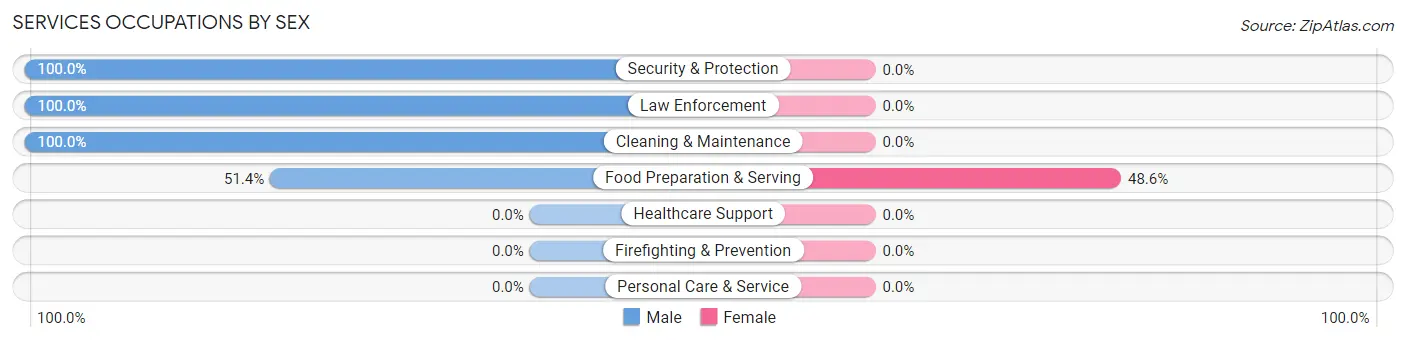
| Occupation | Male | Female |
| Healthcare Support | 0 (0.0%) | 0 (0.0%) |
| Security & Protection | 29 (100.0%) | 0 (0.0%) |
| Firefighting & Prevention | 0 (0.0%) | 0 (0.0%) |
| Law Enforcement | 29 (100.0%) | 0 (0.0%) |
| Food Preparation & Serving | 37 (51.4%) | 35 (48.6%) |
| Cleaning & Maintenance | 46 (100.0%) | 0 (0.0%) |
| Personal Care & Service | 0 (0.0%) | 0 (0.0%) |
| Total (Category) | 112 (76.2%) | 35 (23.8%) |
| Total (Overall) | 249 (45.9%) | 293 (54.1%) |
Sales and Office Occupations
The most common Sales and Office occupations in Dover Plains are Office & Administration (137 | 25.3%), and Sales & Related (19 | 3.5%).
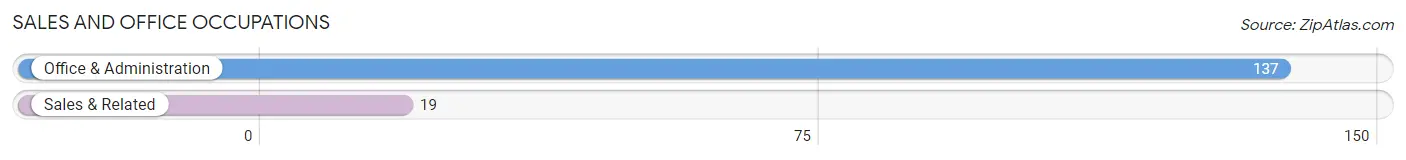
Sales and Office Occupations by Sex

| Occupation | Male | Female |
| Sales & Related | 19 (100.0%) | 0 (0.0%) |
| Office & Administration | 29 (21.2%) | 108 (78.8%) |
| Total (Category) | 48 (30.8%) | 108 (69.2%) |
| Total (Overall) | 249 (45.9%) | 293 (54.1%) |
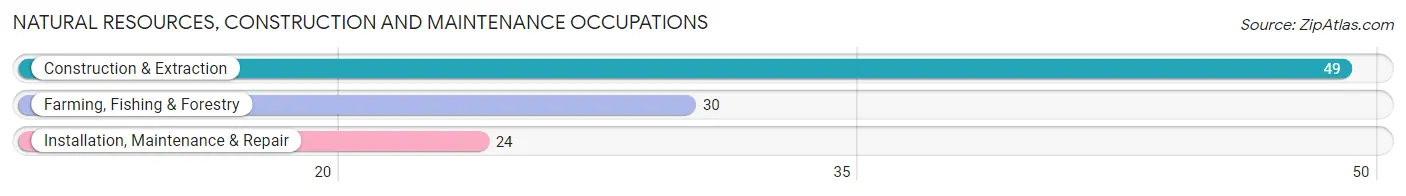
Natural Resources, Construction and Maintenance Occupations
The most common Natural Resources, Construction and Maintenance occupations in Dover Plains are Construction & Extraction (49 | 9.0%), Farming, Fishing & Forestry (30 | 5.5%), and Installation, Maintenance & Repair (24 | 4.4%).
Natural Resources, Construction and Maintenance Occupations by Sex
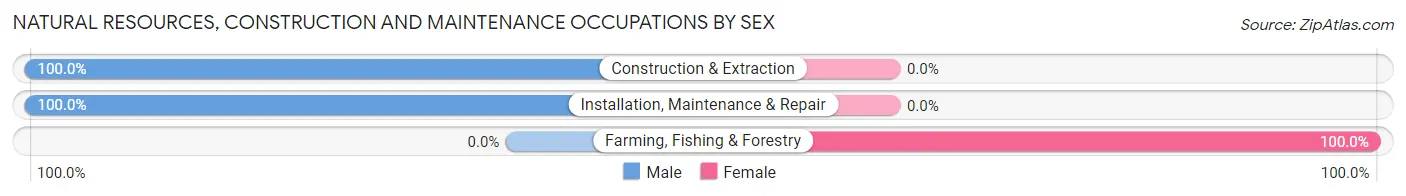
| Occupation | Male | Female |
| Farming, Fishing & Forestry | 0 (0.0%) | 30 (100.0%) |
| Construction & Extraction | 49 (100.0%) | 0 (0.0%) |
| Installation, Maintenance & Repair | 24 (100.0%) | 0 (0.0%) |
| Total (Category) | 73 (70.9%) | 30 (29.1%) |
| Total (Overall) | 249 (45.9%) | 293 (54.1%) |
Production, Transportation and Moving Occupations
The most common Production, Transportation and Moving occupations in Dover Plains are Material Moving (16 | 2.9%), and Production (15 | 2.8%).
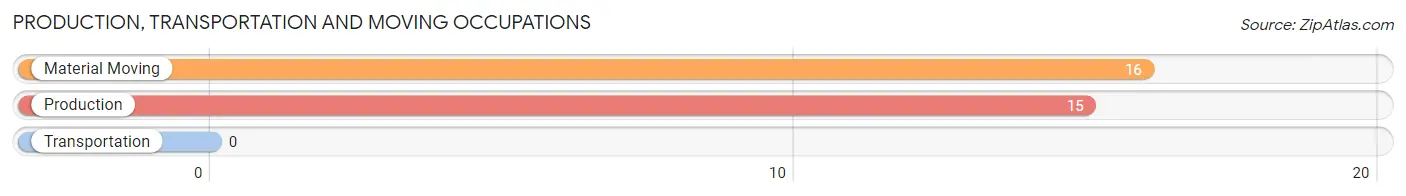
Production, Transportation and Moving Occupations by Sex
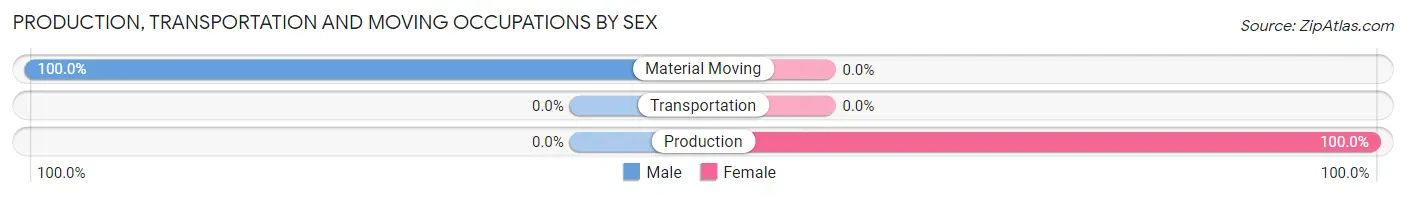
| Occupation | Male | Female |
| Production | 0 (0.0%) | 15 (100.0%) |
| Transportation | 0 (0.0%) | 0 (0.0%) |
| Material Moving | 16 (100.0%) | 0 (0.0%) |
| Total (Category) | 16 (51.6%) | 15 (48.4%) |
| Total (Overall) | 249 (45.9%) | 293 (54.1%) |
Employment Industries by Sex in Dover Plains
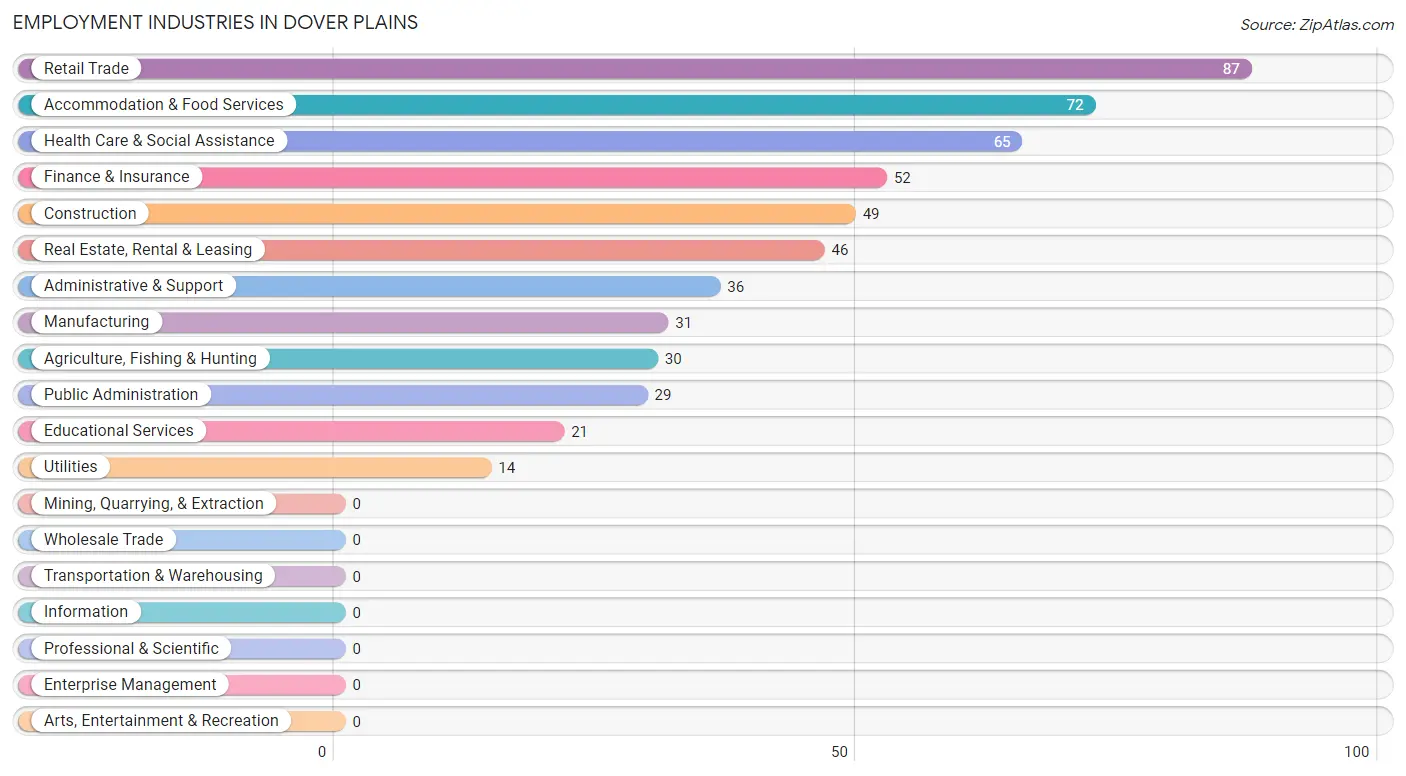
Employment Industries in Dover Plains
The major employment industries in Dover Plains include Retail Trade (87 | 16.1%), Accommodation & Food Services (72 | 13.3%), Health Care & Social Assistance (65 | 12.0%), Finance & Insurance (52 | 9.6%), and Construction (49 | 9.0%).
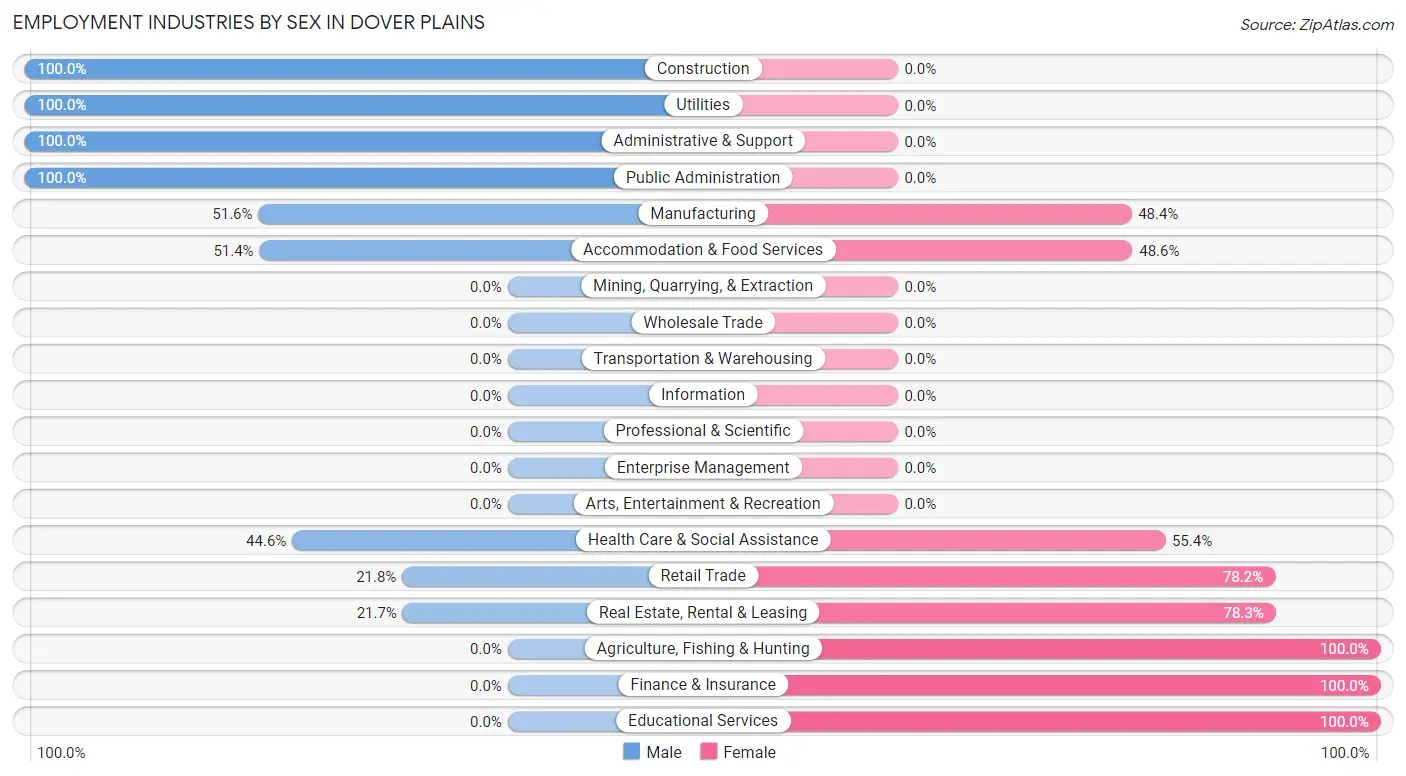
Employment Industries by Sex in Dover Plains
The Dover Plains industries that see more men than women are Construction (100.0%), Utilities (100.0%), and Administrative & Support (100.0%), whereas the industries that tend to have a higher number of women are Agriculture, Fishing & Hunting (100.0%), Finance & Insurance (100.0%), and Educational Services (100.0%).
| Industry | Male | Female |
| Agriculture, Fishing & Hunting | 0 (0.0%) | 30 (100.0%) |
| Mining, Quarrying, & Extraction | 0 (0.0%) | 0 (0.0%) |
| Construction | 49 (100.0%) | 0 (0.0%) |
| Manufacturing | 16 (51.6%) | 15 (48.4%) |
| Wholesale Trade | 0 (0.0%) | 0 (0.0%) |
| Retail Trade | 19 (21.8%) | 68 (78.2%) |
| Transportation & Warehousing | 0 (0.0%) | 0 (0.0%) |
| Utilities | 14 (100.0%) | 0 (0.0%) |
| Information | 0 (0.0%) | 0 (0.0%) |
| Finance & Insurance | 0 (0.0%) | 52 (100.0%) |
| Real Estate, Rental & Leasing | 10 (21.7%) | 36 (78.3%) |
| Professional & Scientific | 0 (0.0%) | 0 (0.0%) |
| Enterprise Management | 0 (0.0%) | 0 (0.0%) |
| Administrative & Support | 36 (100.0%) | 0 (0.0%) |
| Educational Services | 0 (0.0%) | 21 (100.0%) |
| Health Care & Social Assistance | 29 (44.6%) | 36 (55.4%) |
| Arts, Entertainment & Recreation | 0 (0.0%) | 0 (0.0%) |
| Accommodation & Food Services | 37 (51.4%) | 35 (48.6%) |
| Public Administration | 29 (100.0%) | 0 (0.0%) |
| Total | 249 (45.9%) | 293 (54.1%) |
Education in Dover Plains
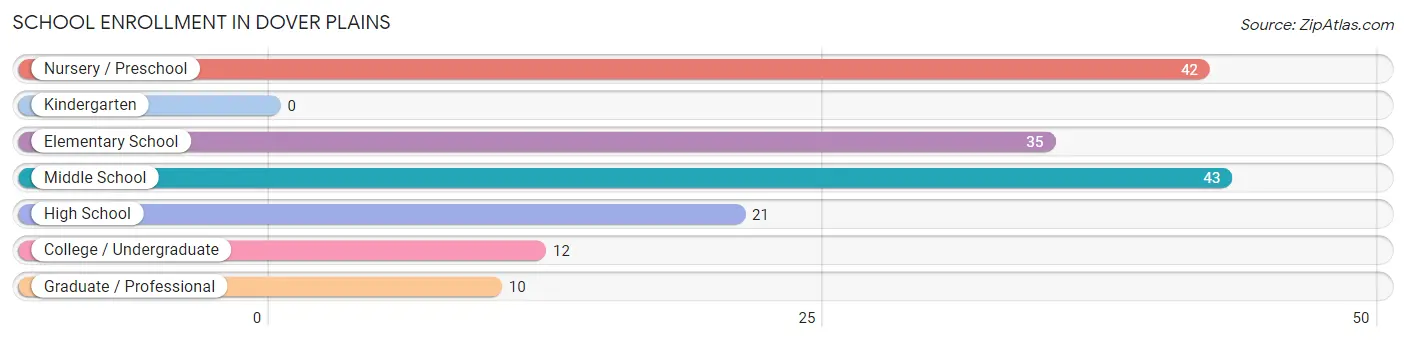
School Enrollment in Dover Plains
The most common levels of schooling among the 163 students in Dover Plains are middle school (43 | 26.4%), nursery / preschool (42 | 25.8%), and elementary school (35 | 21.5%).
| School Level | # Students | % Students |
| Nursery / Preschool | 42 | 25.8% |
| Kindergarten | 0 | 0.0% |
| Elementary School | 35 | 21.5% |
| Middle School | 43 | 26.4% |
| High School | 21 | 12.9% |
| College / Undergraduate | 12 | 7.4% |
| Graduate / Professional | 10 | 6.1% |
| Total | 163 | 100.0% |
School Enrollment by Age by Funding Source in Dover Plains
Out of a total of 163 students who are enrolled in schools in Dover Plains, 22 (13.5%) attend a private institution, while the remaining 141 (86.5%) are enrolled in public schools. The age group of 35 years and over has the highest likelihood of being enrolled in private schools, with 10 (45.5% in the age bracket) enrolled. Conversely, the age group of 5 to 9 year old has the lowest likelihood of being enrolled in a private school, with 35 (100.0% in the age bracket) attending a public institution.
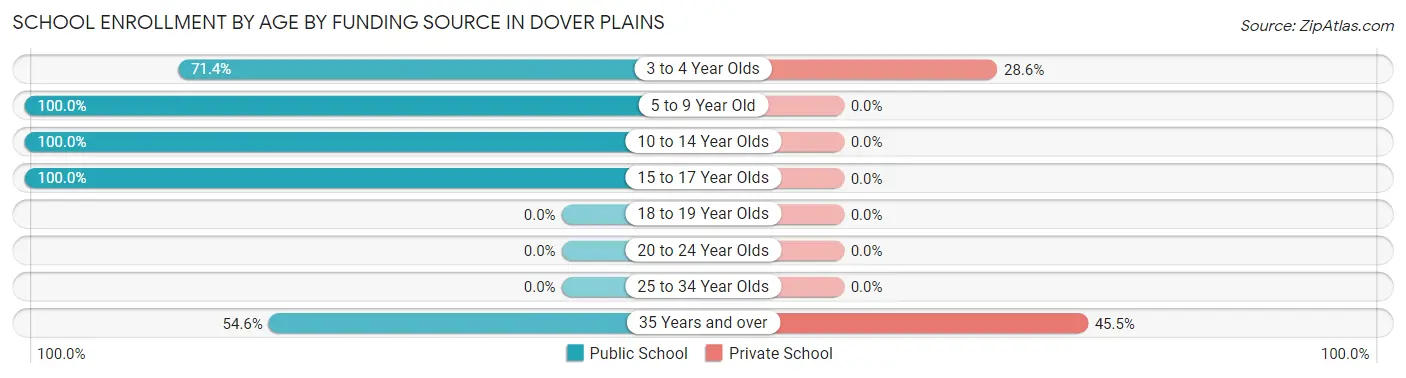
| Age Bracket | Public School | Private School |
| 3 to 4 Year Olds | 30 (71.4%) | 12 (28.6%) |
| 5 to 9 Year Old | 35 (100.0%) | 0 (0.0%) |
| 10 to 14 Year Olds | 43 (100.0%) | 0 (0.0%) |
| 15 to 17 Year Olds | 21 (100.0%) | 0 (0.0%) |
| 18 to 19 Year Olds | 0 (0.0%) | 0 (0.0%) |
| 20 to 24 Year Olds | 0 (0.0%) | 0 (0.0%) |
| 25 to 34 Year Olds | 0 (0.0%) | 0 (0.0%) |
| 35 Years and over | 12 (54.5%) | 10 (45.5%) |
| Total | 141 (86.5%) | 22 (13.5%) |
Educational Attainment by Field of Study in Dover Plains
Business (70 | 28.3%), bio, nature & agricultural (47 | 19.0%), visual & performing arts (46 | 18.6%), social sciences (36 | 14.6%), and arts & humanities (29 | 11.7%) are the most common fields of study among 247 individuals in Dover Plains who have obtained a bachelor's degree or higher.
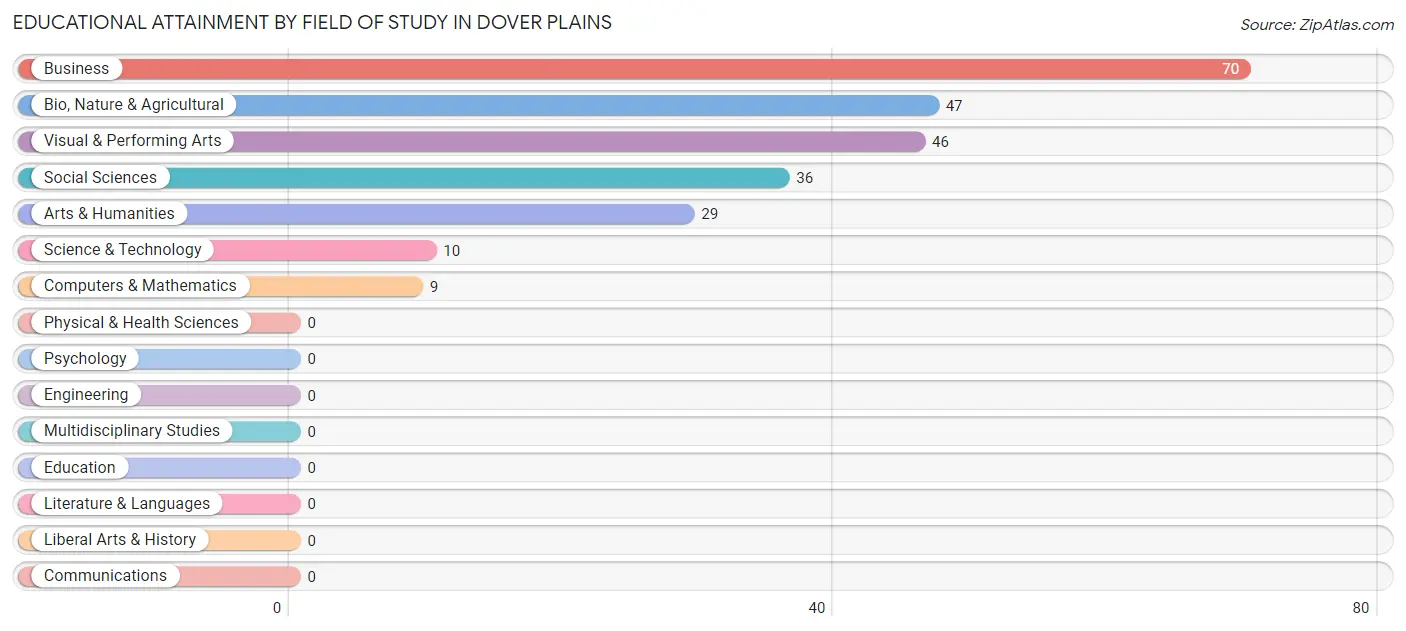
| Field of Study | # Graduates | % Graduates |
| Computers & Mathematics | 9 | 3.6% |
| Bio, Nature & Agricultural | 47 | 19.0% |
| Physical & Health Sciences | 0 | 0.0% |
| Psychology | 0 | 0.0% |
| Social Sciences | 36 | 14.6% |
| Engineering | 0 | 0.0% |
| Multidisciplinary Studies | 0 | 0.0% |
| Science & Technology | 10 | 4.1% |
| Business | 70 | 28.3% |
| Education | 0 | 0.0% |
| Literature & Languages | 0 | 0.0% |
| Liberal Arts & History | 0 | 0.0% |
| Visual & Performing Arts | 46 | 18.6% |
| Communications | 0 | 0.0% |
| Arts & Humanities | 29 | 11.7% |
| Total | 247 | 100.0% |
Transportation & Commute in Dover Plains
Vehicle Availability by Sex in Dover Plains
The most prevalent vehicle ownership categories in Dover Plains are males with 2 vehicles (138, accounting for 55.4%) and females with 2 vehicles (181, making up 48.8%).
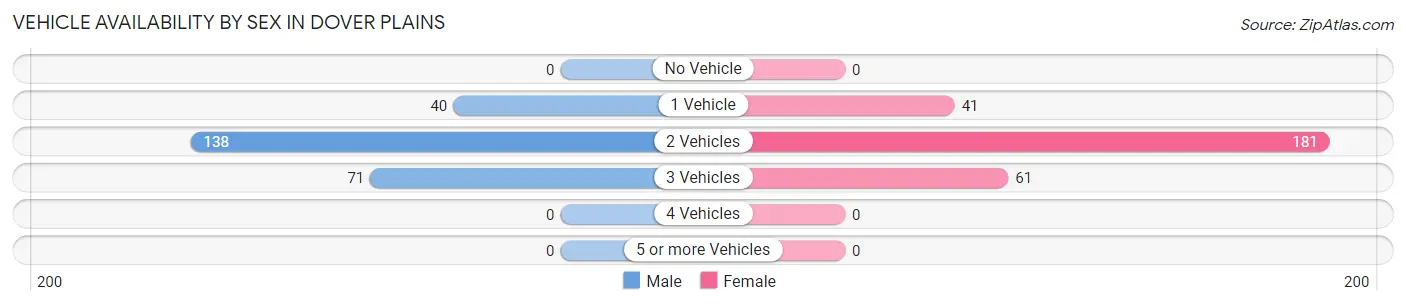
| Vehicles Available | Male | Female |
| No Vehicle | 0 (0.0%) | 0 (0.0%) |
| 1 Vehicle | 40 (16.1%) | 41 (14.5%) |
| 2 Vehicles | 138 (55.4%) | 181 (64.0%) |
| 3 Vehicles | 71 (28.5%) | 61 (21.5%) |
| 4 Vehicles | 0 (0.0%) | 0 (0.0%) |
| 5 or more Vehicles | 0 (0.0%) | 0 (0.0%) |
| Total | 249 (100.0%) | 283 (100.0%) |
Commute Time in Dover Plains
The most frequently occuring commute durations in Dover Plains are 40 to 44 minutes (94 commuters, 17.7%), 90 or more minutes (91 commuters, 17.1%), and 45 to 59 minutes (76 commuters, 14.3%).
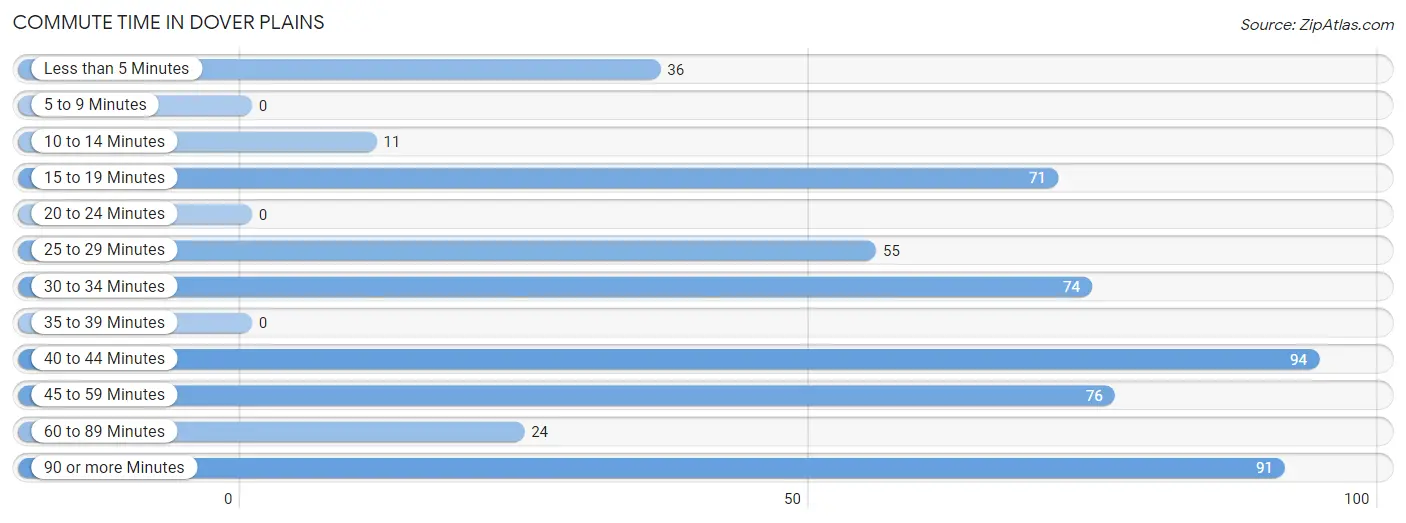
| Commute Time | # Commuters | % Commuters |
| Less than 5 Minutes | 36 | 6.8% |
| 5 to 9 Minutes | 0 | 0.0% |
| 10 to 14 Minutes | 11 | 2.1% |
| 15 to 19 Minutes | 71 | 13.4% |
| 20 to 24 Minutes | 0 | 0.0% |
| 25 to 29 Minutes | 55 | 10.3% |
| 30 to 34 Minutes | 74 | 13.9% |
| 35 to 39 Minutes | 0 | 0.0% |
| 40 to 44 Minutes | 94 | 17.7% |
| 45 to 59 Minutes | 76 | 14.3% |
| 60 to 89 Minutes | 24 | 4.5% |
| 90 or more Minutes | 91 | 17.1% |
Commute Time by Sex in Dover Plains
The most common commute times in Dover Plains are 30 to 34 minutes (74 commuters, 29.7%) for males and 40 to 44 minutes (65 commuters, 23.0%) for females.
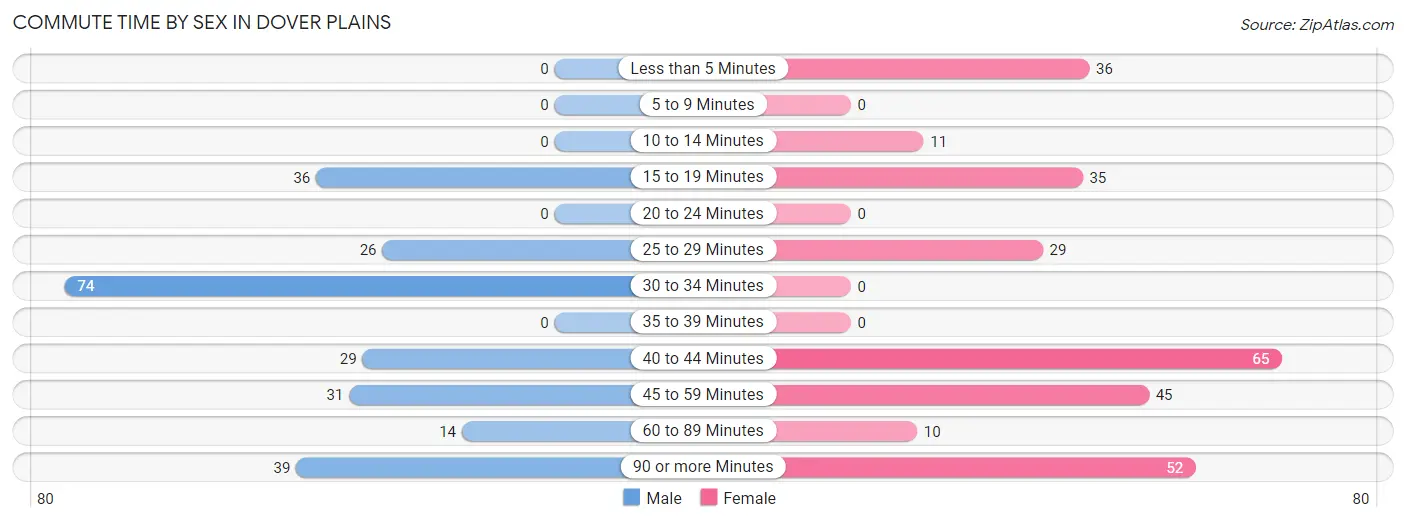
| Commute Time | Male | Female |
| Less than 5 Minutes | 0 (0.0%) | 36 (12.7%) |
| 5 to 9 Minutes | 0 (0.0%) | 0 (0.0%) |
| 10 to 14 Minutes | 0 (0.0%) | 11 (3.9%) |
| 15 to 19 Minutes | 36 (14.5%) | 35 (12.4%) |
| 20 to 24 Minutes | 0 (0.0%) | 0 (0.0%) |
| 25 to 29 Minutes | 26 (10.4%) | 29 (10.2%) |
| 30 to 34 Minutes | 74 (29.7%) | 0 (0.0%) |
| 35 to 39 Minutes | 0 (0.0%) | 0 (0.0%) |
| 40 to 44 Minutes | 29 (11.7%) | 65 (23.0%) |
| 45 to 59 Minutes | 31 (12.4%) | 45 (15.9%) |
| 60 to 89 Minutes | 14 (5.6%) | 10 (3.5%) |
| 90 or more Minutes | 39 (15.7%) | 52 (18.4%) |
Time of Departure to Work by Sex in Dover Plains
The most frequent times of departure to work in Dover Plains are 12:00 AM to 4:59 AM (54, 21.7%) for males and 8:00 AM to 8:29 AM (79, 27.9%) for females.
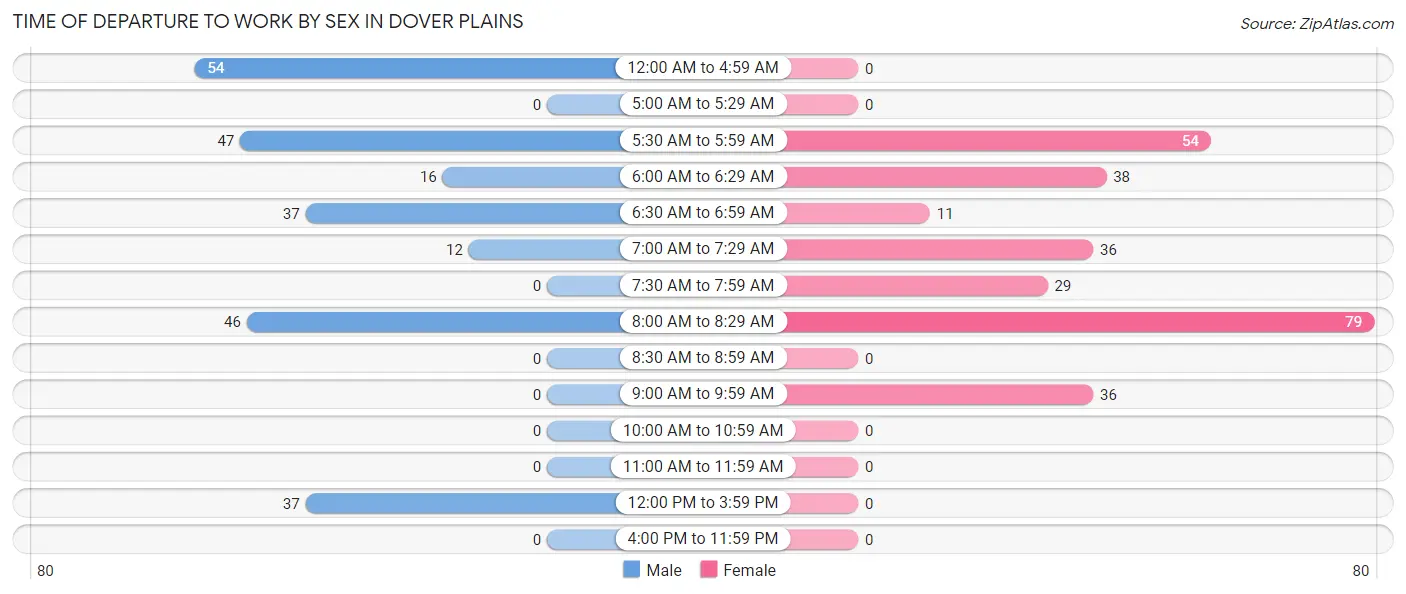
| Time of Departure | Male | Female |
| 12:00 AM to 4:59 AM | 54 (21.7%) | 0 (0.0%) |
| 5:00 AM to 5:29 AM | 0 (0.0%) | 0 (0.0%) |
| 5:30 AM to 5:59 AM | 47 (18.9%) | 54 (19.1%) |
| 6:00 AM to 6:29 AM | 16 (6.4%) | 38 (13.4%) |
| 6:30 AM to 6:59 AM | 37 (14.9%) | 11 (3.9%) |
| 7:00 AM to 7:29 AM | 12 (4.8%) | 36 (12.7%) |
| 7:30 AM to 7:59 AM | 0 (0.0%) | 29 (10.2%) |
| 8:00 AM to 8:29 AM | 46 (18.5%) | 79 (27.9%) |
| 8:30 AM to 8:59 AM | 0 (0.0%) | 0 (0.0%) |
| 9:00 AM to 9:59 AM | 0 (0.0%) | 36 (12.7%) |
| 10:00 AM to 10:59 AM | 0 (0.0%) | 0 (0.0%) |
| 11:00 AM to 11:59 AM | 0 (0.0%) | 0 (0.0%) |
| 12:00 PM to 3:59 PM | 37 (14.9%) | 0 (0.0%) |
| 4:00 PM to 11:59 PM | 0 (0.0%) | 0 (0.0%) |
| Total | 249 (100.0%) | 283 (100.0%) |
Housing Occupancy in Dover Plains
Occupancy by Ownership in Dover Plains
Of the total 466 dwellings in Dover Plains, owner-occupied units account for 245 (52.6%), while renter-occupied units make up 221 (47.4%).
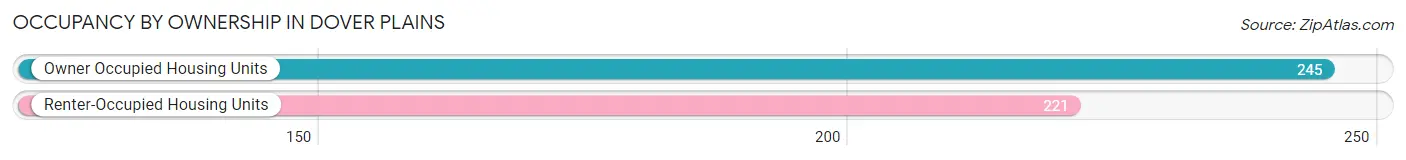
| Occupancy | # Housing Units | % Housing Units |
| Owner Occupied Housing Units | 245 | 52.6% |
| Renter-Occupied Housing Units | 221 | 47.4% |
| Total Occupied Housing Units | 466 | 100.0% |
Occupancy by Household Size in Dover Plains
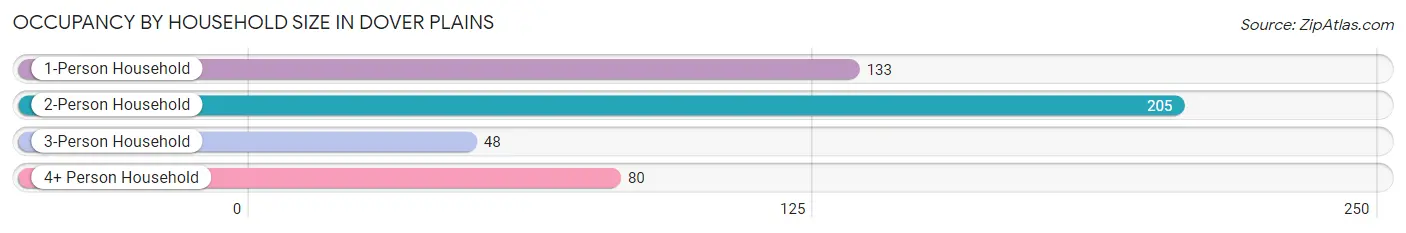
| Household Size | # Housing Units | % Housing Units |
| 1-Person Household | 133 | 28.5% |
| 2-Person Household | 205 | 44.0% |
| 3-Person Household | 48 | 10.3% |
| 4+ Person Household | 80 | 17.2% |
| Total Housing Units | 466 | 100.0% |
Occupancy by Ownership by Household Size in Dover Plains
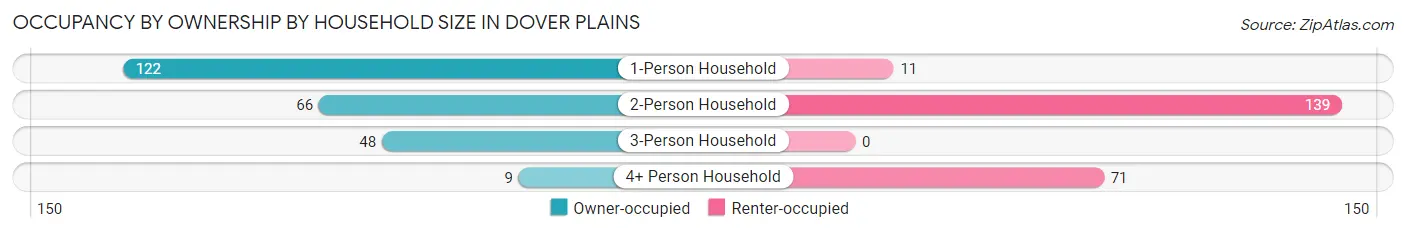
| Household Size | Owner-occupied | Renter-occupied |
| 1-Person Household | 122 (91.7%) | 11 (8.3%) |
| 2-Person Household | 66 (32.2%) | 139 (67.8%) |
| 3-Person Household | 48 (100.0%) | 0 (0.0%) |
| 4+ Person Household | 9 (11.3%) | 71 (88.7%) |
| Total Housing Units | 245 (52.6%) | 221 (47.4%) |
Occupancy by Educational Attainment in Dover Plains
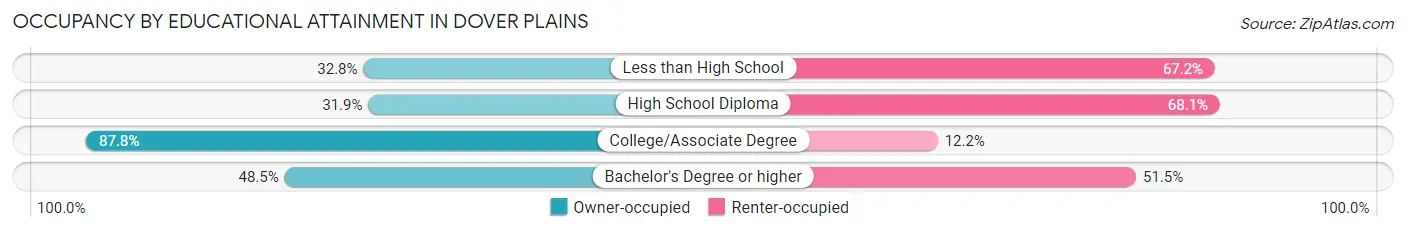
| Household Size | Owner-occupied | Renter-occupied |
| Less than High School | 22 (32.8%) | 45 (67.2%) |
| High School Diploma | 36 (31.9%) | 77 (68.1%) |
| College/Associate Degree | 108 (87.8%) | 15 (12.2%) |
| Bachelor's Degree or higher | 79 (48.5%) | 84 (51.5%) |
Occupancy by Age of Householder in Dover Plains
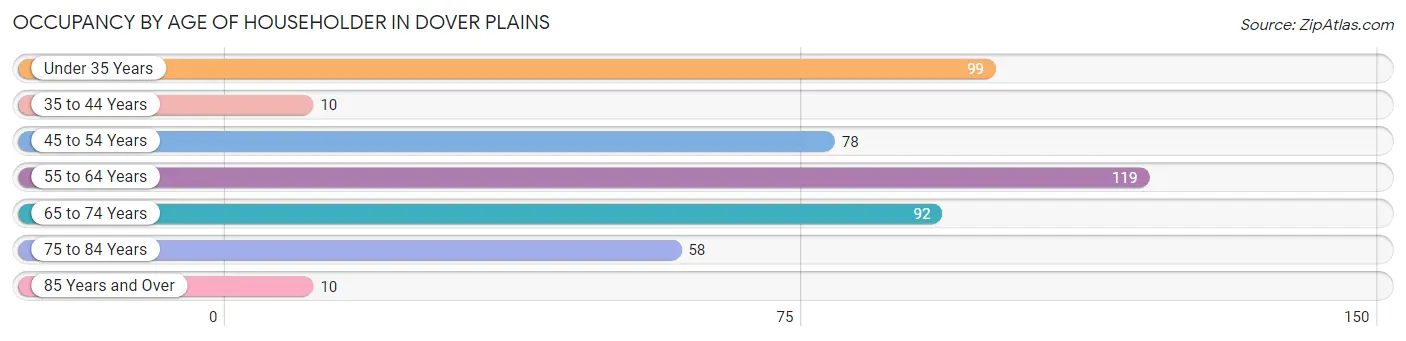
| Age Bracket | # Households | % Households |
| Under 35 Years | 99 | 21.2% |
| 35 to 44 Years | 10 | 2.1% |
| 45 to 54 Years | 78 | 16.7% |
| 55 to 64 Years | 119 | 25.5% |
| 65 to 74 Years | 92 | 19.7% |
| 75 to 84 Years | 58 | 12.4% |
| 85 Years and Over | 10 | 2.1% |
| Total | 466 | 100.0% |
Housing Finances in Dover Plains
Median Income by Occupancy in Dover Plains
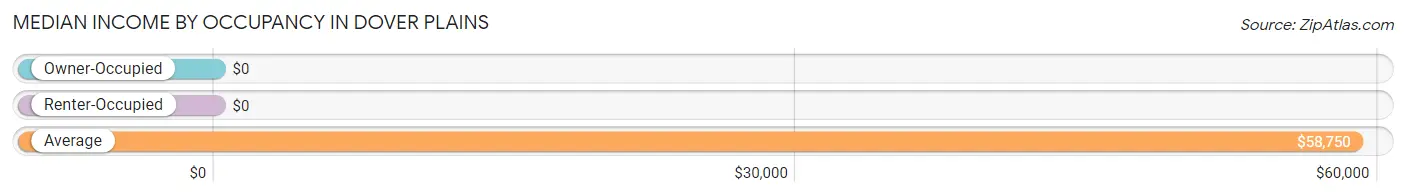
| Occupancy Type | # Households | Median Income |
| Owner-Occupied | 245 (52.6%) | $0 |
| Renter-Occupied | 221 (47.4%) | $0 |
| Average | 466 (100.0%) | $58,750 |
Occupancy by Householder Income Bracket in Dover Plains
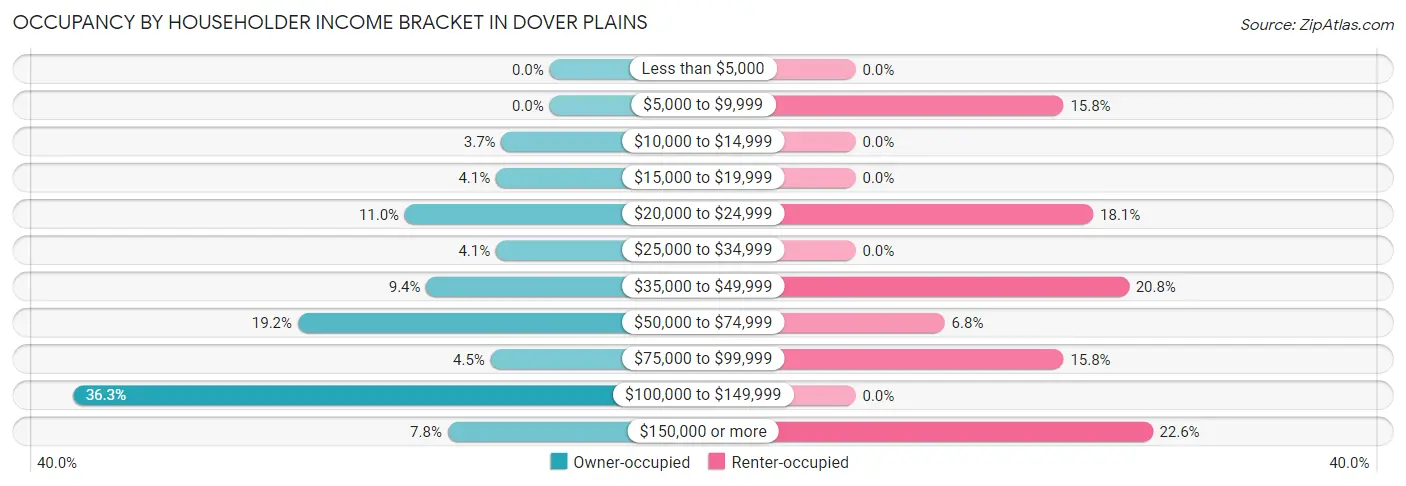
| Income Bracket | Owner-occupied | Renter-occupied |
| Less than $5,000 | 0 (0.0%) | 0 (0.0%) |
| $5,000 to $9,999 | 0 (0.0%) | 35 (15.8%) |
| $10,000 to $14,999 | 9 (3.7%) | 0 (0.0%) |
| $15,000 to $19,999 | 10 (4.1%) | 0 (0.0%) |
| $20,000 to $24,999 | 27 (11.0%) | 40 (18.1%) |
| $25,000 to $34,999 | 10 (4.1%) | 0 (0.0%) |
| $35,000 to $49,999 | 23 (9.4%) | 46 (20.8%) |
| $50,000 to $74,999 | 47 (19.2%) | 15 (6.8%) |
| $75,000 to $99,999 | 11 (4.5%) | 35 (15.8%) |
| $100,000 to $149,999 | 89 (36.3%) | 0 (0.0%) |
| $150,000 or more | 19 (7.8%) | 50 (22.6%) |
| Total | 245 (100.0%) | 221 (100.0%) |
Monthly Housing Cost Tiers in Dover Plains
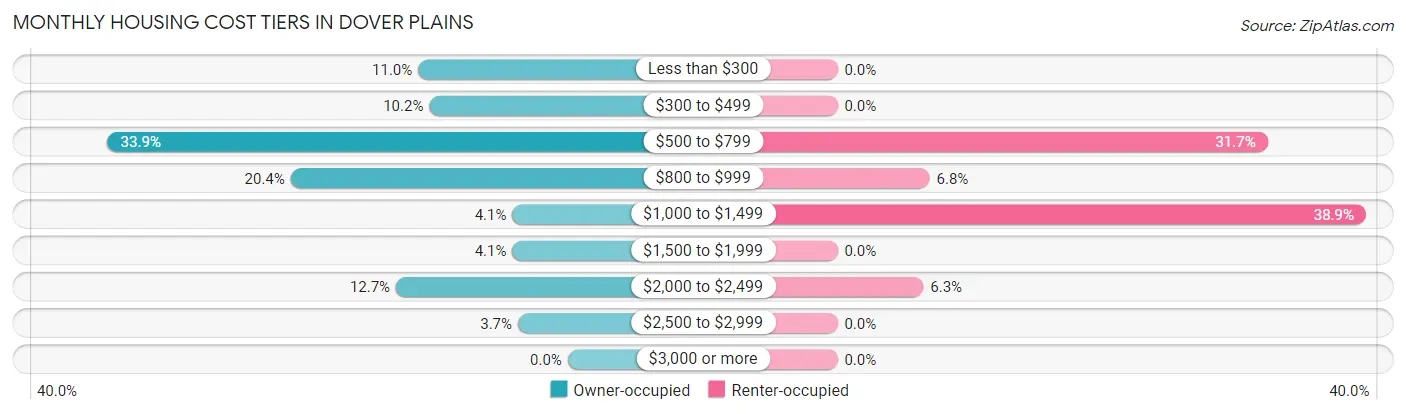
| Monthly Cost | Owner-occupied | Renter-occupied |
| Less than $300 | 27 (11.0%) | 0 (0.0%) |
| $300 to $499 | 25 (10.2%) | 0 (0.0%) |
| $500 to $799 | 83 (33.9%) | 70 (31.7%) |
| $800 to $999 | 50 (20.4%) | 15 (6.8%) |
| $1,000 to $1,499 | 10 (4.1%) | 86 (38.9%) |
| $1,500 to $1,999 | 10 (4.1%) | 0 (0.0%) |
| $2,000 to $2,499 | 31 (12.7%) | 14 (6.3%) |
| $2,500 to $2,999 | 9 (3.7%) | 0 (0.0%) |
| $3,000 or more | 0 (0.0%) | 0 (0.0%) |
| Total | 245 (100.0%) | 221 (100.0%) |
Physical Housing Characteristics in Dover Plains
Housing Structures in Dover Plains
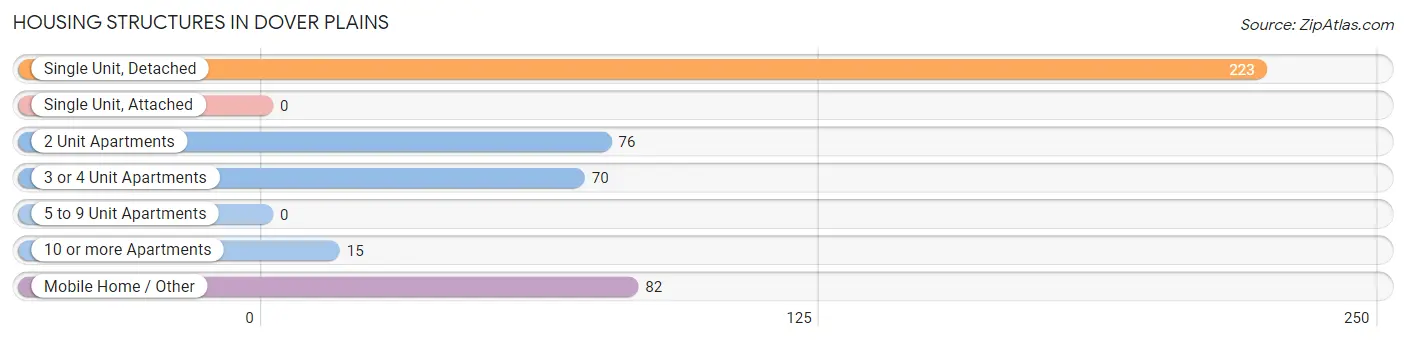
| Structure Type | # Housing Units | % Housing Units |
| Single Unit, Detached | 223 | 47.8% |
| Single Unit, Attached | 0 | 0.0% |
| 2 Unit Apartments | 76 | 16.3% |
| 3 or 4 Unit Apartments | 70 | 15.0% |
| 5 to 9 Unit Apartments | 0 | 0.0% |
| 10 or more Apartments | 15 | 3.2% |
| Mobile Home / Other | 82 | 17.6% |
| Total | 466 | 100.0% |
Housing Structures by Occupancy in Dover Plains
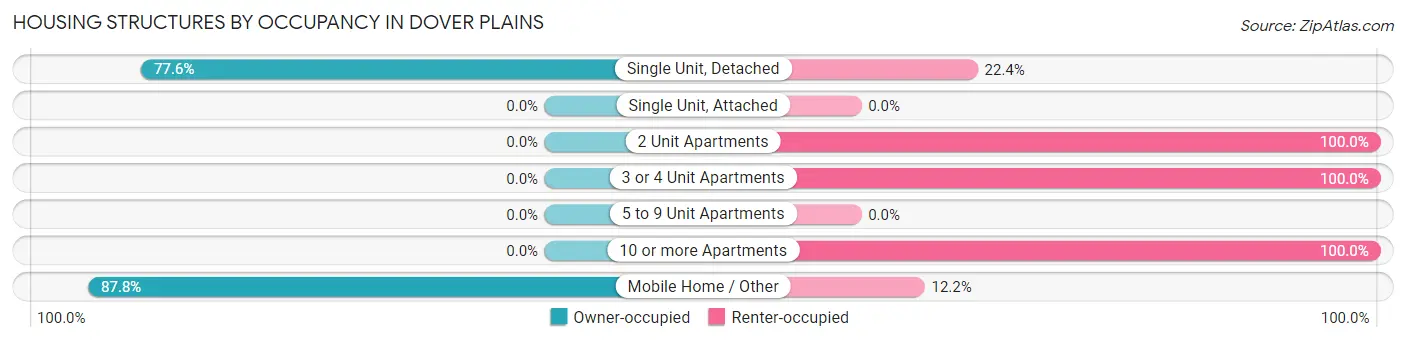
| Structure Type | Owner-occupied | Renter-occupied |
| Single Unit, Detached | 173 (77.6%) | 50 (22.4%) |
| Single Unit, Attached | 0 (0.0%) | 0 (0.0%) |
| 2 Unit Apartments | 0 (0.0%) | 76 (100.0%) |
| 3 or 4 Unit Apartments | 0 (0.0%) | 70 (100.0%) |
| 5 to 9 Unit Apartments | 0 (0.0%) | 0 (0.0%) |
| 10 or more Apartments | 0 (0.0%) | 15 (100.0%) |
| Mobile Home / Other | 72 (87.8%) | 10 (12.2%) |
| Total | 245 (52.6%) | 221 (47.4%) |
Housing Structures by Number of Rooms in Dover Plains
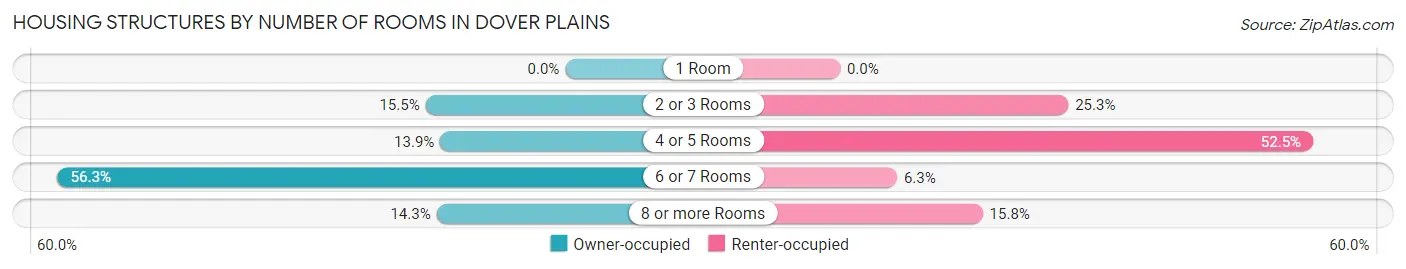
| Number of Rooms | Owner-occupied | Renter-occupied |
| 1 Room | 0 (0.0%) | 0 (0.0%) |
| 2 or 3 Rooms | 38 (15.5%) | 56 (25.3%) |
| 4 or 5 Rooms | 34 (13.9%) | 116 (52.5%) |
| 6 or 7 Rooms | 138 (56.3%) | 14 (6.3%) |
| 8 or more Rooms | 35 (14.3%) | 35 (15.8%) |
| Total | 245 (100.0%) | 221 (100.0%) |
Housing Structure by Heating Type in Dover Plains
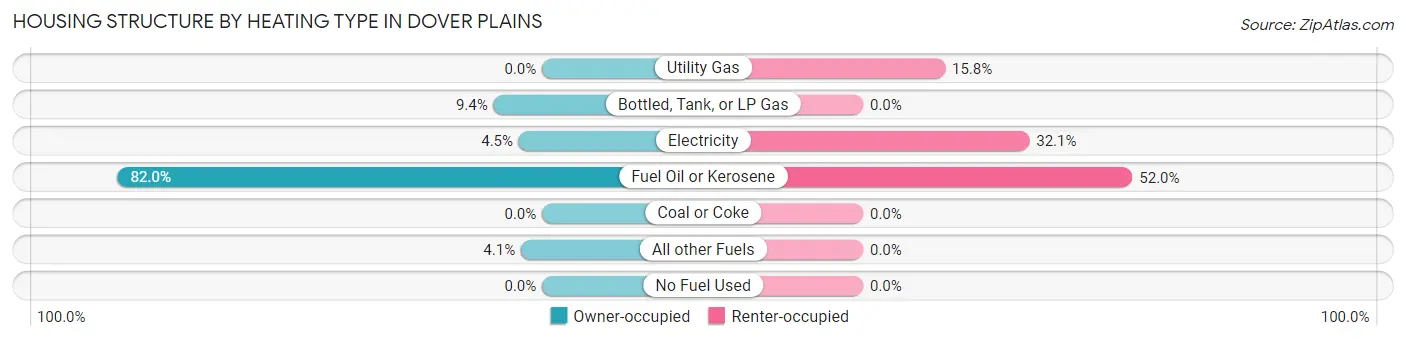
| Heating Type | Owner-occupied | Renter-occupied |
| Utility Gas | 0 (0.0%) | 35 (15.8%) |
| Bottled, Tank, or LP Gas | 23 (9.4%) | 0 (0.0%) |
| Electricity | 11 (4.5%) | 71 (32.1%) |
| Fuel Oil or Kerosene | 201 (82.0%) | 115 (52.0%) |
| Coal or Coke | 0 (0.0%) | 0 (0.0%) |
| All other Fuels | 10 (4.1%) | 0 (0.0%) |
| No Fuel Used | 0 (0.0%) | 0 (0.0%) |
| Total | 245 (100.0%) | 221 (100.0%) |
Household Vehicle Usage in Dover Plains
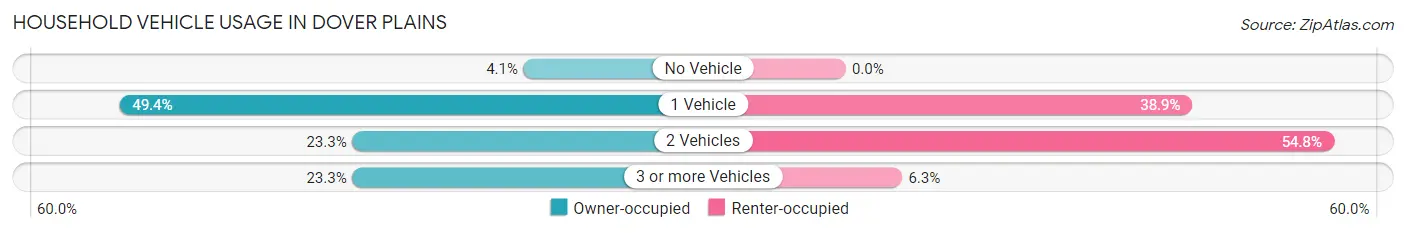
| Vehicles per Household | Owner-occupied | Renter-occupied |
| No Vehicle | 10 (4.1%) | 0 (0.0%) |
| 1 Vehicle | 121 (49.4%) | 86 (38.9%) |
| 2 Vehicles | 57 (23.3%) | 121 (54.7%) |
| 3 or more Vehicles | 57 (23.3%) | 14 (6.3%) |
| Total | 245 (100.0%) | 221 (100.0%) |
Real Estate & Mortgages in Dover Plains
Real Estate and Mortgage Overview in Dover Plains
| Characteristic | Without Mortgage | With Mortgage |
| Housing Units | 185 | 60 |
| Median Property Value | - | - |
| Median Household Income | - | - |
| Monthly Housing Costs | $717 | $0 |
| Real Estate Taxes | $5,913 | $0 |
Property Value by Mortgage Status in Dover Plains
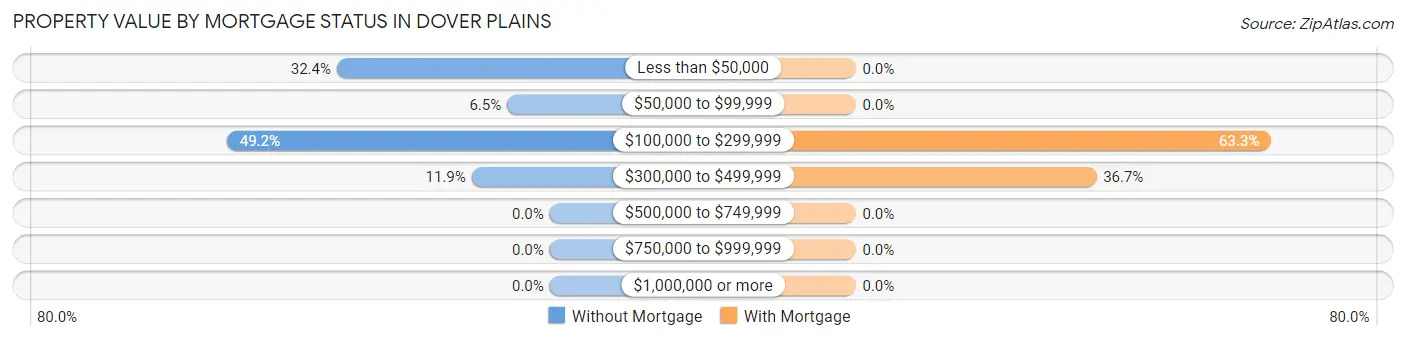
| Property Value | Without Mortgage | With Mortgage |
| Less than $50,000 | 60 (32.4%) | 0 (0.0%) |
| $50,000 to $99,999 | 12 (6.5%) | 0 (0.0%) |
| $100,000 to $299,999 | 91 (49.2%) | 38 (63.3%) |
| $300,000 to $499,999 | 22 (11.9%) | 22 (36.7%) |
| $500,000 to $749,999 | 0 (0.0%) | 0 (0.0%) |
| $750,000 to $999,999 | 0 (0.0%) | 0 (0.0%) |
| $1,000,000 or more | 0 (0.0%) | 0 (0.0%) |
| Total | 185 (100.0%) | 60 (100.0%) |
Household Income by Mortgage Status in Dover Plains
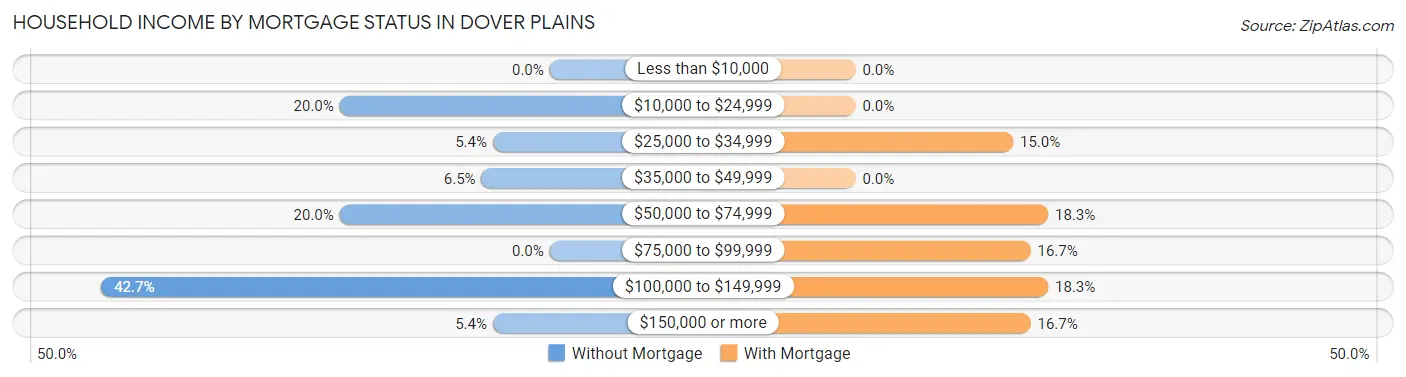
| Household Income | Without Mortgage | With Mortgage |
| Less than $10,000 | 0 (0.0%) | 0 (0.0%) |
| $10,000 to $24,999 | 37 (20.0%) | 0 (0.0%) |
| $25,000 to $34,999 | 10 (5.4%) | 9 (15.0%) |
| $35,000 to $49,999 | 12 (6.5%) | 0 (0.0%) |
| $50,000 to $74,999 | 37 (20.0%) | 11 (18.3%) |
| $75,000 to $99,999 | 0 (0.0%) | 10 (16.7%) |
| $100,000 to $149,999 | 79 (42.7%) | 11 (18.3%) |
| $150,000 or more | 10 (5.4%) | 10 (16.7%) |
| Total | 185 (100.0%) | 60 (100.0%) |
Property Value to Household Income Ratio in Dover Plains
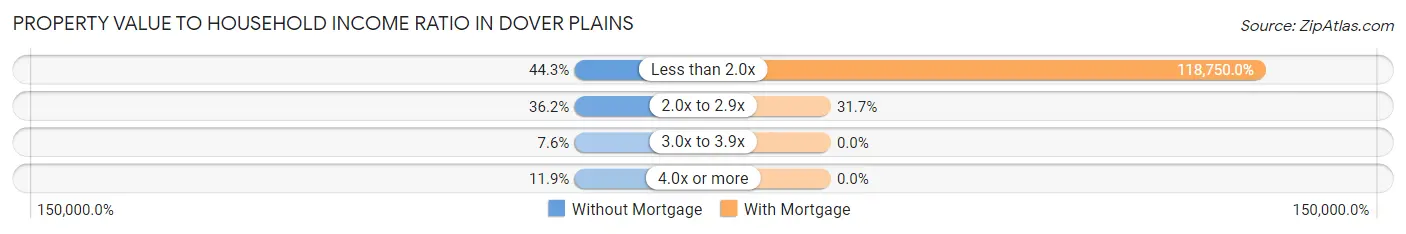
| Value-to-Income Ratio | Without Mortgage | With Mortgage |
| Less than 2.0x | 82 (44.3%) | 71,250 (118,750.0%) |
| 2.0x to 2.9x | 67 (36.2%) | 19 (31.7%) |
| 3.0x to 3.9x | 14 (7.6%) | 0 (0.0%) |
| 4.0x or more | 22 (11.9%) | 0 (0.0%) |
| Total | 185 (100.0%) | 60 (100.0%) |
Real Estate Taxes by Mortgage Status in Dover Plains

| Property Taxes | Without Mortgage | With Mortgage |
| Less than $800 | 0 (0.0%) | 0 (0.0%) |
| $800 to $1,499 | 0 (0.0%) | 0 (0.0%) |
| $800 to $1,499 | 113 (61.1%) | 0 (0.0%) |
| Total | 185 (100.0%) | 60 (100.0%) |
Health & Disability in Dover Plains
Health Insurance Coverage by Age in Dover Plains
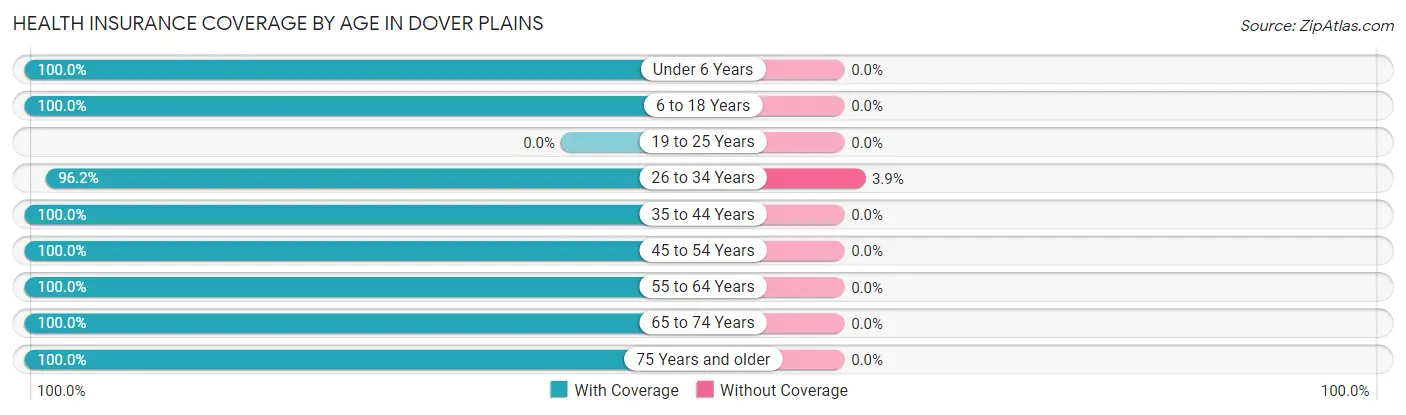
| Age Bracket | With Coverage | Without Coverage |
| Under 6 Years | 52 (100.0%) | 0 (0.0%) |
| 6 to 18 Years | 99 (100.0%) | 0 (0.0%) |
| 19 to 25 Years | 0 (0.0%) | 0 (0.0%) |
| 26 to 34 Years | 200 (96.2%) | 8 (3.8%) |
| 35 to 44 Years | 112 (100.0%) | 0 (0.0%) |
| 45 to 54 Years | 135 (100.0%) | 0 (0.0%) |
| 55 to 64 Years | 296 (100.0%) | 0 (0.0%) |
| 65 to 74 Years | 115 (100.0%) | 0 (0.0%) |
| 75 Years and older | 137 (100.0%) | 0 (0.0%) |
| Total | 1,146 (99.3%) | 8 (0.7%) |
Health Insurance Coverage by Citizenship Status in Dover Plains
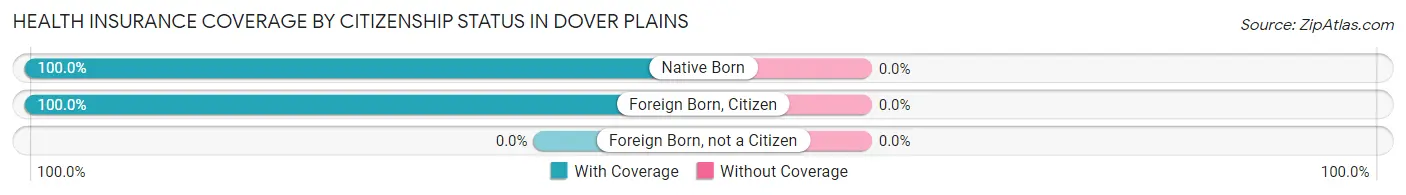
| Citizenship Status | With Coverage | Without Coverage |
| Native Born | 52 (100.0%) | 0 (0.0%) |
| Foreign Born, Citizen | 99 (100.0%) | 0 (0.0%) |
| Foreign Born, not a Citizen | 0 (0.0%) | 0 (0.0%) |
Health Insurance Coverage by Household Income in Dover Plains
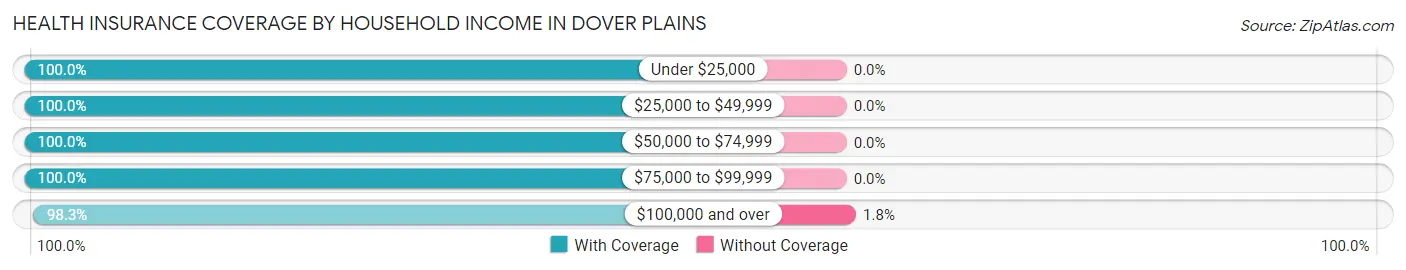
| Household Income | With Coverage | Without Coverage |
| Under $25,000 | 194 (100.0%) | 0 (0.0%) |
| $25,000 to $49,999 | 238 (100.0%) | 0 (0.0%) |
| $50,000 to $74,999 | 89 (100.0%) | 0 (0.0%) |
| $75,000 to $99,999 | 95 (100.0%) | 0 (0.0%) |
| $100,000 and over | 450 (98.3%) | 8 (1.8%) |
Public vs Private Health Insurance Coverage by Age in Dover Plains
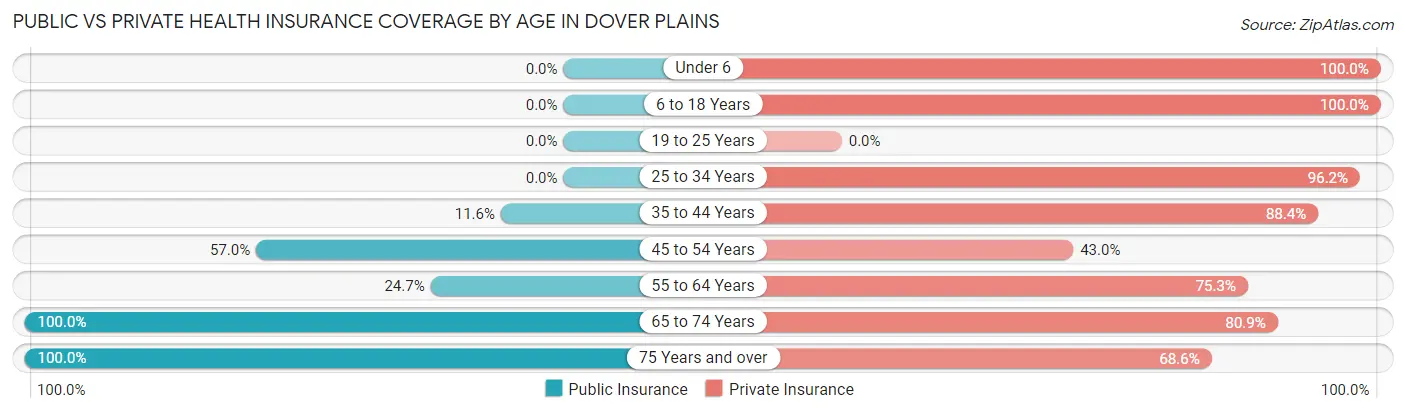
| Age Bracket | Public Insurance | Private Insurance |
| Under 6 | 0 (0.0%) | 52 (100.0%) |
| 6 to 18 Years | 0 (0.0%) | 99 (100.0%) |
| 19 to 25 Years | 0 (0.0%) | 0 (0.0%) |
| 25 to 34 Years | 0 (0.0%) | 200 (96.2%) |
| 35 to 44 Years | 13 (11.6%) | 99 (88.4%) |
| 45 to 54 Years | 77 (57.0%) | 58 (43.0%) |
| 55 to 64 Years | 73 (24.7%) | 223 (75.3%) |
| 65 to 74 Years | 115 (100.0%) | 93 (80.9%) |
| 75 Years and over | 137 (100.0%) | 94 (68.6%) |
| Total | 415 (36.0%) | 918 (79.5%) |
Disability Status by Sex by Age in Dover Plains
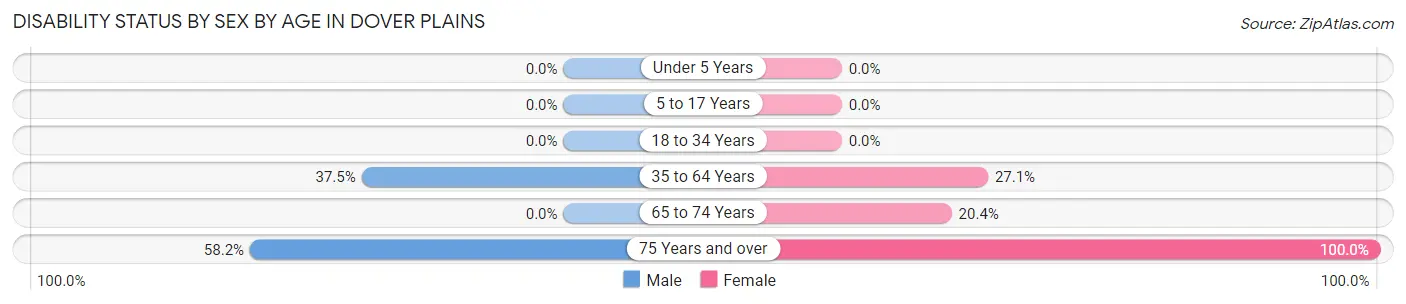
| Age Bracket | Male | Female |
| Under 5 Years | 0 (0.0%) | 0 (0.0%) |
| 5 to 17 Years | 0 (0.0%) | 0 (0.0%) |
| 18 to 34 Years | 0 (0.0%) | 0 (0.0%) |
| 35 to 64 Years | 133 (37.5%) | 51 (27.1%) |
| 65 to 74 Years | 0 (0.0%) | 21 (20.4%) |
| 75 Years and over | 32 (58.2%) | 82 (100.0%) |
Disability Class by Sex by Age in Dover Plains
Disability Class: Hearing Difficulty
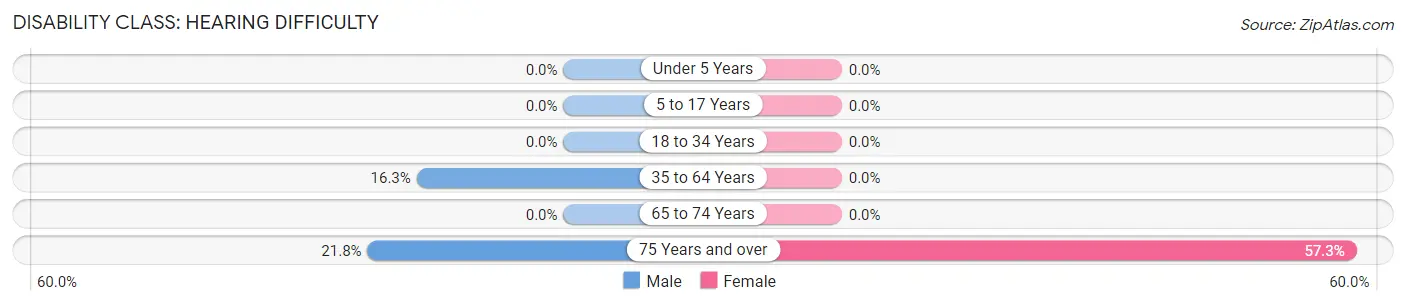
| Age Bracket | Male | Female |
| Under 5 Years | 0 (0.0%) | 0 (0.0%) |
| 5 to 17 Years | 0 (0.0%) | 0 (0.0%) |
| 18 to 34 Years | 0 (0.0%) | 0 (0.0%) |
| 35 to 64 Years | 58 (16.3%) | 0 (0.0%) |
| 65 to 74 Years | 0 (0.0%) | 0 (0.0%) |
| 75 Years and over | 12 (21.8%) | 47 (57.3%) |
Disability Class: Vision Difficulty
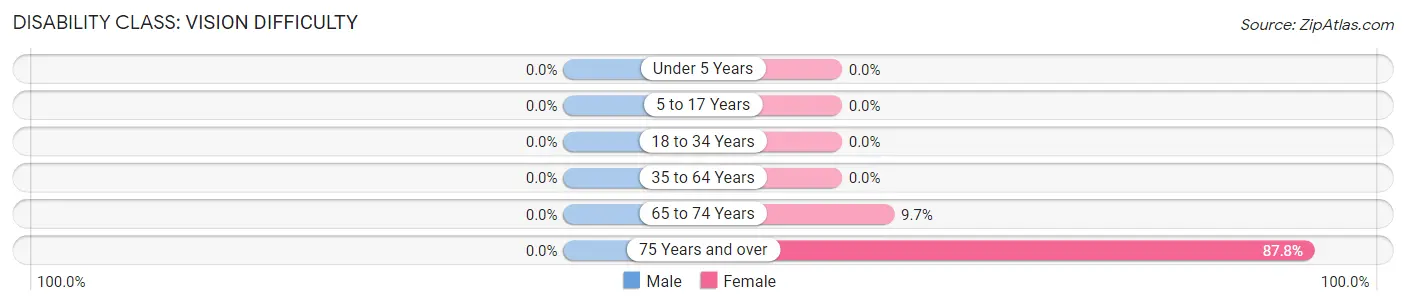
| Age Bracket | Male | Female |
| Under 5 Years | 0 (0.0%) | 0 (0.0%) |
| 5 to 17 Years | 0 (0.0%) | 0 (0.0%) |
| 18 to 34 Years | 0 (0.0%) | 0 (0.0%) |
| 35 to 64 Years | 0 (0.0%) | 0 (0.0%) |
| 65 to 74 Years | 0 (0.0%) | 10 (9.7%) |
| 75 Years and over | 0 (0.0%) | 72 (87.8%) |
Disability Class: Cognitive Difficulty
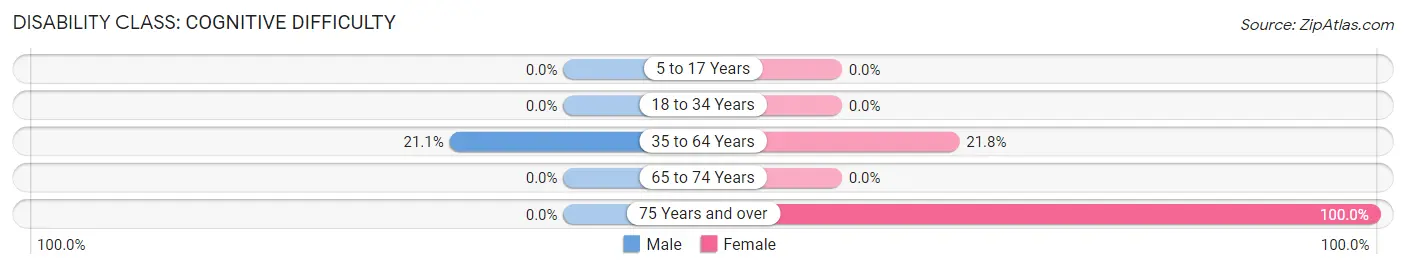
| Age Bracket | Male | Female |
| 5 to 17 Years | 0 (0.0%) | 0 (0.0%) |
| 18 to 34 Years | 0 (0.0%) | 0 (0.0%) |
| 35 to 64 Years | 75 (21.1%) | 41 (21.8%) |
| 65 to 74 Years | 0 (0.0%) | 0 (0.0%) |
| 75 Years and over | 0 (0.0%) | 82 (100.0%) |
Disability Class: Ambulatory Difficulty
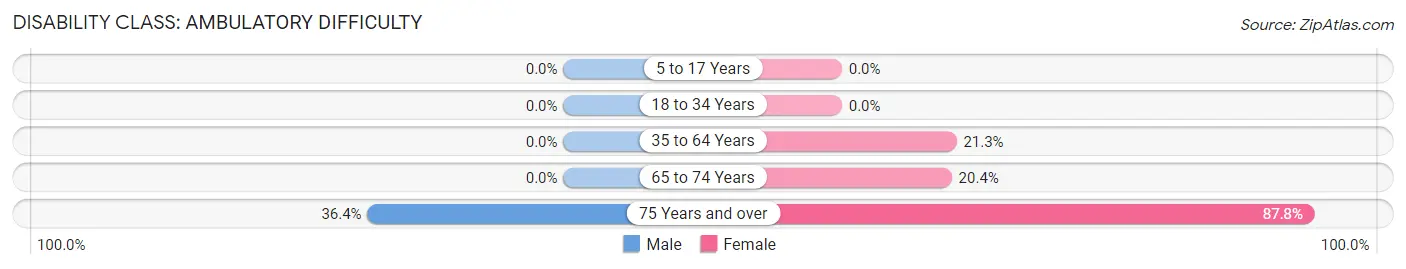
| Age Bracket | Male | Female |
| 5 to 17 Years | 0 (0.0%) | 0 (0.0%) |
| 18 to 34 Years | 0 (0.0%) | 0 (0.0%) |
| 35 to 64 Years | 0 (0.0%) | 40 (21.3%) |
| 65 to 74 Years | 0 (0.0%) | 21 (20.4%) |
| 75 Years and over | 20 (36.4%) | 72 (87.8%) |
Disability Class: Self-Care Difficulty
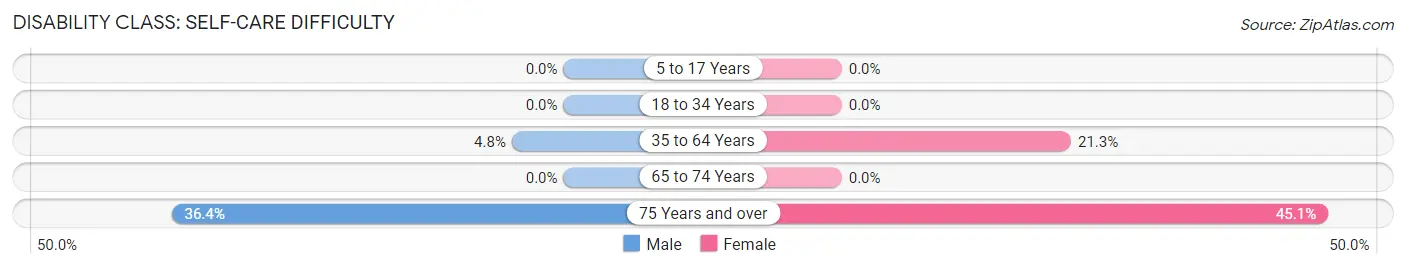
| Age Bracket | Male | Female |
| 5 to 17 Years | 0 (0.0%) | 0 (0.0%) |
| 18 to 34 Years | 0 (0.0%) | 0 (0.0%) |
| 35 to 64 Years | 17 (4.8%) | 40 (21.3%) |
| 65 to 74 Years | 0 (0.0%) | 0 (0.0%) |
| 75 Years and over | 20 (36.4%) | 37 (45.1%) |
Technology Access in Dover Plains
Computing Device Access in Dover Plains
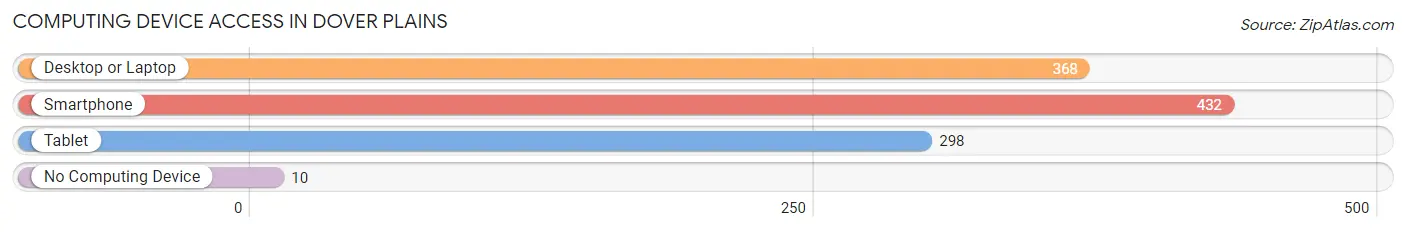
| Device Type | # Households | % Households |
| Desktop or Laptop | 368 | 79.0% |
| Smartphone | 432 | 92.7% |
| Tablet | 298 | 63.9% |
| No Computing Device | 10 | 2.1% |
| Total | 466 | 100.0% |
Internet Access in Dover Plains
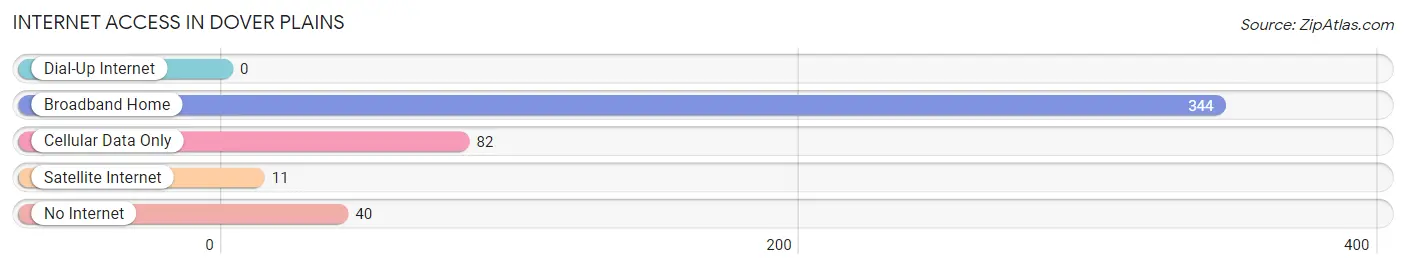
| Internet Type | # Households | % Households |
| Dial-Up Internet | 0 | 0.0% |
| Broadband Home | 344 | 73.8% |
| Cellular Data Only | 82 | 17.6% |
| Satellite Internet | 11 | 2.4% |
| No Internet | 40 | 8.6% |
| Total | 466 | 100.0% |
Dover Plains Summary
Dover Plains is a hamlet located in the town of Dover in Dutchess County, New York. It is situated in the Hudson Valley region of New York, approximately 70 miles north of New York City. The hamlet is located along the banks of the Ten Mile River and is home to a population of approximately 1,500 people.
History
The area that is now Dover Plains was originally inhabited by the Wappinger Indians. The first European settlers arrived in the area in the late 17th century. The hamlet was originally known as “Dover Plains” and was part of the town of Amenia. In 1788, the town of Dover was established and Dover Plains became part of the new town.
In the 19th century, Dover Plains was a thriving agricultural community. The hamlet was home to several mills, including a grist mill, a saw mill, and a paper mill. The paper mill was the largest employer in the area and provided jobs for many of the local residents.
In the late 19th century, the hamlet began to experience a decline in population as many of the residents moved away in search of better economic opportunities. The decline continued into the 20th century and by the 1950s, the population of Dover Plains had dropped to just over 500 people.
Geography
Dover Plains is located in the Hudson Valley region of New York. The hamlet is situated along the banks of the Ten Mile River and is surrounded by rolling hills and forests. The hamlet is located approximately 70 miles north of New York City and is accessible via the Taconic State Parkway and the Metro-North Railroad.
Economy
The economy of Dover Plains is largely based on agriculture and tourism. The hamlet is home to several farms that produce a variety of crops, including apples, peaches, and vegetables. The hamlet is also home to several wineries and breweries, which attract tourists from all over the region.
In addition to agriculture and tourism, Dover Plains is home to several small businesses, including restaurants, shops, and services. The hamlet is also home to a small industrial park, which houses several light manufacturing companies.
Demographics
As of the 2010 census, the population of Dover Plains was 1,500 people. The racial makeup of the hamlet was 94.2% White, 2.7% African American, 0.7% Native American, 0.7% Asian, and 1.7% from other races. The median household income in Dover Plains was $50,000, and the median age was 40 years.
Conclusion
Dover Plains is a small hamlet located in the Hudson Valley region of New York. The hamlet is home to a population of approximately 1,500 people and is largely supported by agriculture and tourism. The hamlet is also home to several small businesses and light manufacturing companies. The hamlet is accessible via the Taconic State Parkway and the Metro-North Railroad and is approximately 70 miles north of New York City.
Common Questions
What is Per Capita Income in Dover Plains?
Per Capita income in Dover Plains is $33,474.
What is the Median Family Income in Dover Plains?
Median Family Income in Dover Plains is $79,214.
What is the Median Household income in Dover Plains?
Median Household Income in Dover Plains is $58,750.
What is Income or Wage Gap in Dover Plains?
Income or Wage Gap in Dover Plains is 20.8%.
Women in Dover Plains earn 79.2 cents for every dollar earned by a man.
What is Inequality or Gini Index in Dover Plains?
Inequality or Gini Index in Dover Plains is 0.43.
What is the Total Population of Dover Plains?
Total Population of Dover Plains is 1,154.
What is the Total Male Population of Dover Plains?
Total Male Population of Dover Plains is 530.
What is the Total Female Population of Dover Plains?
Total Female Population of Dover Plains is 624.
What is the Ratio of Males per 100 Females in Dover Plains?
There are 84.94 Males per 100 Females in Dover Plains.
What is the Ratio of Females per 100 Males in Dover Plains?
There are 117.74 Females per 100 Males in Dover Plains.
What is the Median Population Age in Dover Plains?
Median Population Age in Dover Plains is 51.8 Years.
What is the Average Family Size in Dover Plains
Average Family Size in Dover Plains is 2.8 People.
What is the Average Household Size in Dover Plains
Average Household Size in Dover Plains is 2.3 People.
How Large is the Labor Force in Dover Plains?
There are 562 People in the Labor Forcein in Dover Plains.
What is the Percentage of People in the Labor Force in Dover Plains?
56.0% of People are in the Labor Force in Dover Plains.
What is the Unemployment Rate in Dover Plains?
Unemployment Rate in Dover Plains is 3.6%.