Cities with the Largest Maltese Community in New York
RELATED REPORTS & OPTIONS
Maltese
New York
Compare Cities
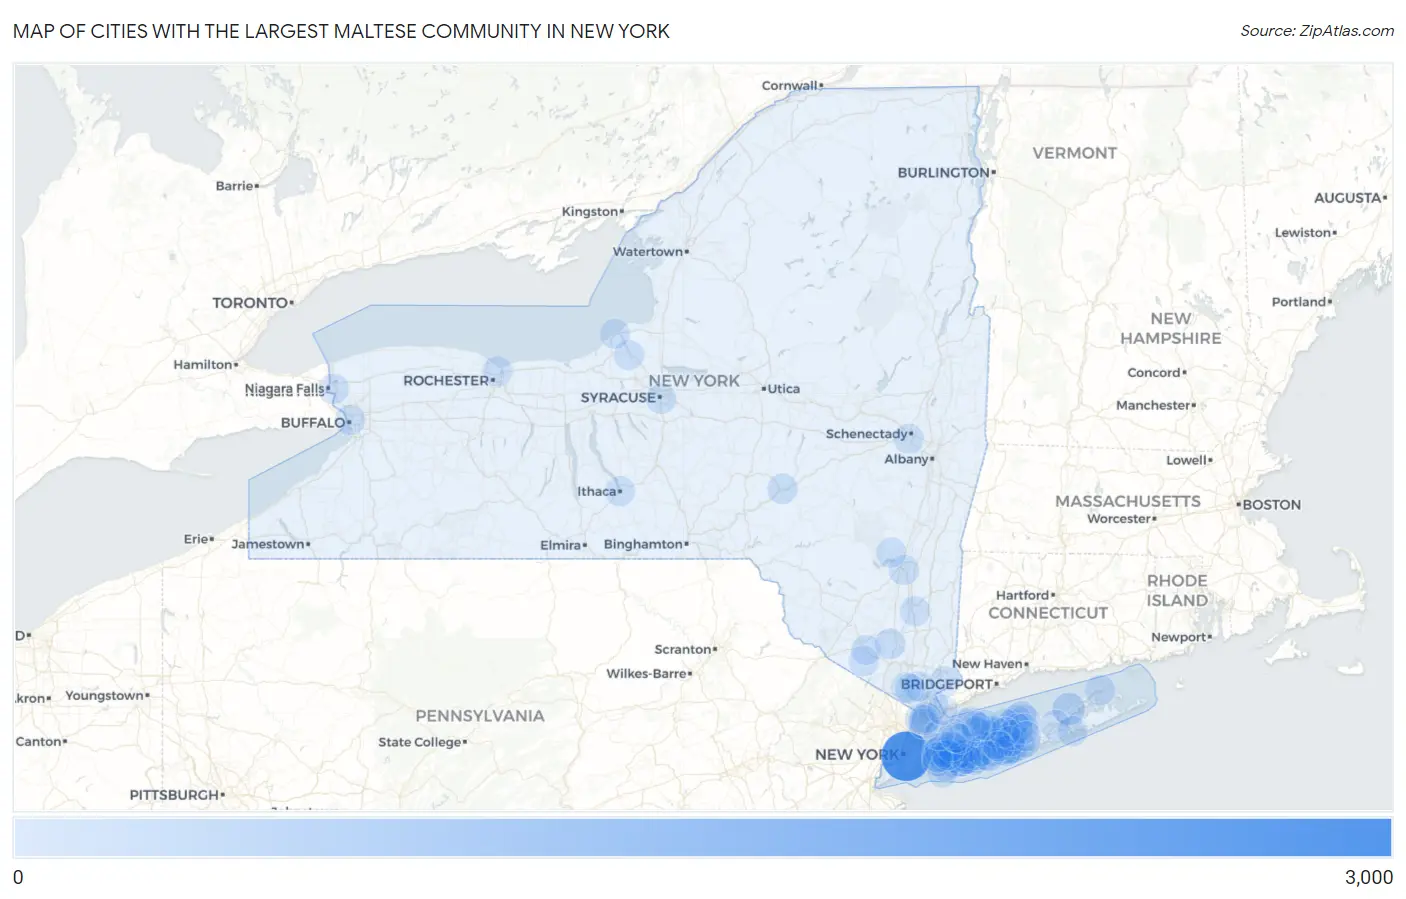
Map of Cities with the Largest Maltese Community in New York
0
3,000
Cities with the Largest Maltese Community in New York
| City | Maltese | vs State | vs National | |
| 1. | New York | 2,588 | 6,135(42.18%)#1 | 41,206(6.28%)#1 |
| 2. | Mattituck | 297 | 6,135(4.84%)#2 | 41,206(0.72%)#10 |
| 3. | Hauppauge | 135 | 6,135(2.20%)#3 | 41,206(0.33%)#41 |
| 4. | East Northport | 130 | 6,135(2.12%)#4 | 41,206(0.32%)#45 |
| 5. | Lindenhurst | 126 | 6,135(2.05%)#5 | 41,206(0.31%)#47 |
| 6. | Smithtown | 116 | 6,135(1.89%)#6 | 41,206(0.28%)#53 |
| 7. | North Bellmore | 111 | 6,135(1.81%)#7 | 41,206(0.27%)#56 |
| 8. | Williston Park | 88 | 6,135(1.43%)#8 | 41,206(0.21%)#64 |
| 9. | Merrick | 80 | 6,135(1.30%)#9 | 41,206(0.19%)#74 |
| 10. | White Plains | 78 | 6,135(1.27%)#10 | 41,206(0.19%)#76 |
| 11. | North New Hyde Park | 70 | 6,135(1.14%)#11 | 41,206(0.17%)#90 |
| 12. | Rocky Point | 67 | 6,135(1.09%)#12 | 41,206(0.16%)#96 |
| 13. | Blue Point | 64 | 6,135(1.04%)#13 | 41,206(0.16%)#104 |
| 14. | Wantagh | 63 | 6,135(1.03%)#14 | 41,206(0.15%)#108 |
| 15. | East Massapequa | 62 | 6,135(1.01%)#15 | 41,206(0.15%)#111 |
| 16. | Franklin Square | 54 | 6,135(0.88%)#16 | 41,206(0.13%)#127 |
| 17. | Ronkonkoma | 54 | 6,135(0.88%)#17 | 41,206(0.13%)#129 |
| 18. | Commack | 51 | 6,135(0.83%)#18 | 41,206(0.12%)#140 |
| 19. | Sayville | 51 | 6,135(0.83%)#19 | 41,206(0.12%)#141 |
| 20. | Beaver Dam Lake | 51 | 6,135(0.83%)#20 | 41,206(0.12%)#142 |
| 21. | Deer Park | 48 | 6,135(0.78%)#21 | 41,206(0.12%)#154 |
| 22. | West Hempstead | 47 | 6,135(0.77%)#22 | 41,206(0.11%)#157 |
| 23. | Terryville | 45 | 6,135(0.73%)#23 | 41,206(0.11%)#162 |
| 24. | Mount Sinai | 43 | 6,135(0.70%)#24 | 41,206(0.10%)#173 |
| 25. | West Islip | 40 | 6,135(0.65%)#25 | 41,206(0.10%)#184 |
| 26. | Oneonta | 37 | 6,135(0.60%)#26 | 41,206(0.09%)#197 |
| 27. | North Massapequa | 36 | 6,135(0.59%)#27 | 41,206(0.09%)#204 |
| 28. | Copiague | 35 | 6,135(0.57%)#28 | 41,206(0.08%)#208 |
| 29. | Levittown | 32 | 6,135(0.52%)#29 | 41,206(0.08%)#223 |
| 30. | Floral Park | 32 | 6,135(0.52%)#30 | 41,206(0.08%)#225 |
| 31. | East Patchogue | 30 | 6,135(0.49%)#31 | 41,206(0.07%)#244 |
| 32. | Plainedge | 29 | 6,135(0.47%)#32 | 41,206(0.07%)#261 |
| 33. | Sound Beach | 28 | 6,135(0.46%)#33 | 41,206(0.07%)#269 |
| 34. | West Babylon | 27 | 6,135(0.44%)#34 | 41,206(0.07%)#272 |
| 35. | Spackenkill | 27 | 6,135(0.44%)#35 | 41,206(0.07%)#274 |
| 36. | Old Bethpage | 26 | 6,135(0.42%)#36 | 41,206(0.06%)#284 |
| 37. | Florida | 26 | 6,135(0.42%)#37 | 41,206(0.06%)#285 |
| 38. | New Hyde Park | 24 | 6,135(0.39%)#38 | 41,206(0.06%)#304 |
| 39. | Stony Brook University | 23 | 6,135(0.37%)#39 | 41,206(0.06%)#316 |
| 40. | Lloyd Harbor | 23 | 6,135(0.37%)#40 | 41,206(0.06%)#317 |
| 41. | Eatons Neck | 23 | 6,135(0.37%)#41 | 41,206(0.06%)#319 |
| 42. | Eastchester | 22 | 6,135(0.36%)#42 | 41,206(0.05%)#328 |
| 43. | Mount Vernon | 21 | 6,135(0.34%)#43 | 41,206(0.05%)#339 |
| 44. | Ossining | 21 | 6,135(0.34%)#44 | 41,206(0.05%)#341 |
| 45. | South Farmingdale | 21 | 6,135(0.34%)#45 | 41,206(0.05%)#342 |
| 46. | Bayport | 21 | 6,135(0.34%)#46 | 41,206(0.05%)#343 |
| 47. | Oakdale | 21 | 6,135(0.34%)#47 | 41,206(0.05%)#344 |
| 48. | Buffalo | 20 | 6,135(0.33%)#48 | 41,206(0.05%)#346 |
| 49. | Syracuse | 20 | 6,135(0.33%)#49 | 41,206(0.05%)#347 |
| 50. | North Merrick | 20 | 6,135(0.33%)#50 | 41,206(0.05%)#356 |
| 51. | Seaford | 19 | 6,135(0.31%)#51 | 41,206(0.05%)#373 |
| 52. | Salisbury | 19 | 6,135(0.31%)#52 | 41,206(0.05%)#378 |
| 53. | Orient | 19 | 6,135(0.31%)#53 | 41,206(0.05%)#382 |
| 54. | Yonkers | 18 | 6,135(0.29%)#54 | 41,206(0.04%)#386 |
| 55. | Long Beach | 18 | 6,135(0.29%)#55 | 41,206(0.04%)#397 |
| 56. | Islip | 18 | 6,135(0.29%)#56 | 41,206(0.04%)#401 |
| 57. | Bronxville | 18 | 6,135(0.29%)#57 | 41,206(0.04%)#404 |
| 58. | Riverside | 18 | 6,135(0.29%)#58 | 41,206(0.04%)#407 |
| 59. | Kingston | 16 | 6,135(0.26%)#59 | 41,206(0.04%)#434 |
| 60. | North Bellport | 15 | 6,135(0.24%)#60 | 41,206(0.04%)#457 |
| 61. | Ithaca | 14 | 6,135(0.23%)#61 | 41,206(0.03%)#469 |
| 62. | Garden City | 14 | 6,135(0.23%)#62 | 41,206(0.03%)#471 |
| 63. | Oceanside | 13 | 6,135(0.21%)#63 | 41,206(0.03%)#495 |
| 64. | North Babylon | 13 | 6,135(0.21%)#64 | 41,206(0.03%)#497 |
| 65. | Hampton Bays | 13 | 6,135(0.21%)#65 | 41,206(0.03%)#499 |
| 66. | Village Of The Branch | 13 | 6,135(0.21%)#66 | 41,206(0.03%)#505 |
| 67. | Irondequoit | 12 | 6,135(0.20%)#67 | 41,206(0.03%)#514 |
| 68. | Massapequa Park | 12 | 6,135(0.20%)#68 | 41,206(0.03%)#524 |
| 69. | Farmingville | 12 | 6,135(0.20%)#69 | 41,206(0.03%)#525 |
| 70. | Greenlawn | 12 | 6,135(0.20%)#70 | 41,206(0.03%)#528 |
| 71. | Upper Brookville | 12 | 6,135(0.20%)#71 | 41,206(0.03%)#536 |
| 72. | Valley Stream | 11 | 6,135(0.18%)#72 | 41,206(0.03%)#543 |
| 73. | Central Islip | 11 | 6,135(0.18%)#73 | 41,206(0.03%)#544 |
| 74. | New City | 11 | 6,135(0.18%)#74 | 41,206(0.03%)#546 |
| 75. | Westbury | 11 | 6,135(0.18%)#75 | 41,206(0.03%)#551 |
| 76. | Fulton | 11 | 6,135(0.18%)#76 | 41,206(0.03%)#557 |
| 77. | Fort Salonga | 11 | 6,135(0.18%)#77 | 41,206(0.03%)#559 |
| 78. | West Sayville | 11 | 6,135(0.18%)#78 | 41,206(0.03%)#562 |
| 79. | Milton Cdp Ulster County | 11 | 6,135(0.18%)#79 | 41,206(0.03%)#565 |
| 80. | Hempstead | 10 | 6,135(0.16%)#80 | 41,206(0.02%)#578 |
| 81. | Coram | 10 | 6,135(0.16%)#81 | 41,206(0.02%)#585 |
| 82. | Rotterdam | 10 | 6,135(0.16%)#82 | 41,206(0.02%)#596 |
| 83. | Middle Island | 10 | 6,135(0.16%)#83 | 41,206(0.02%)#606 |
| 84. | Goshen | 10 | 6,135(0.16%)#84 | 41,206(0.02%)#607 |
| 85. | Holbrook | 9 | 6,135(0.15%)#85 | 41,206(0.02%)#637 |
| 86. | North Valley Stream | 9 | 6,135(0.15%)#86 | 41,206(0.02%)#639 |
| 87. | Syosset | 9 | 6,135(0.15%)#87 | 41,206(0.02%)#640 |
| 88. | Centerport | 9 | 6,135(0.15%)#88 | 41,206(0.02%)#647 |
| 89. | West Bay Shore | 9 | 6,135(0.15%)#89 | 41,206(0.02%)#650 |
| 90. | Port Washington North | 9 | 6,135(0.15%)#90 | 41,206(0.02%)#651 |
| 91. | Yaphank | 8 | 6,135(0.13%)#91 | 41,206(0.02%)#684 |
| 92. | Suny Oswego | 8 | 6,135(0.13%)#92 | 41,206(0.02%)#690 |
| 93. | Bedford | 8 | 6,135(0.13%)#93 | 41,206(0.02%)#692 |
| 94. | Niagara Falls | 7 | 6,135(0.11%)#94 | 41,206(0.02%)#710 |
| 95. | Port Chester | 7 | 6,135(0.11%)#95 | 41,206(0.02%)#714 |
| 96. | Lake Grove | 7 | 6,135(0.11%)#96 | 41,206(0.02%)#721 |
| 97. | Congers | 7 | 6,135(0.11%)#97 | 41,206(0.02%)#723 |
| 98. | Muttontown | 7 | 6,135(0.11%)#98 | 41,206(0.02%)#727 |
| 99. | North Great River | 6 | 6,135(0.10%)#99 | 41,206(0.01%)#745 |
| 100. | Woodstock | 6 | 6,135(0.10%)#100 | 41,206(0.01%)#747 |
Common Questions
What are the Top 10 Cities with the Largest Maltese Community in New York?
Top 10 Cities with the Largest Maltese Community in New York are:
#1
2,588
#2
297
#3
135
#4
130
#5
126
#6
116
#7
111
#8
88
#9
80
#10
78
What city has the Largest Maltese Community in New York?
New York has the Largest Maltese Community in New York with 2,588.
What is the Total Maltese Population in the State of New York?
Total Maltese Population in New York is 6,135.
What is the Total Maltese Population in the United States?
Total Maltese Population in the United States is 41,206.