Zip Codes with the Highest Percentage of Population Employed in Food Preparation & Serving in New Rochelle, NY
RELATED REPORTS & OPTIONS
Food Preparation & Serving
New Rochelle
Compare Zip Codes
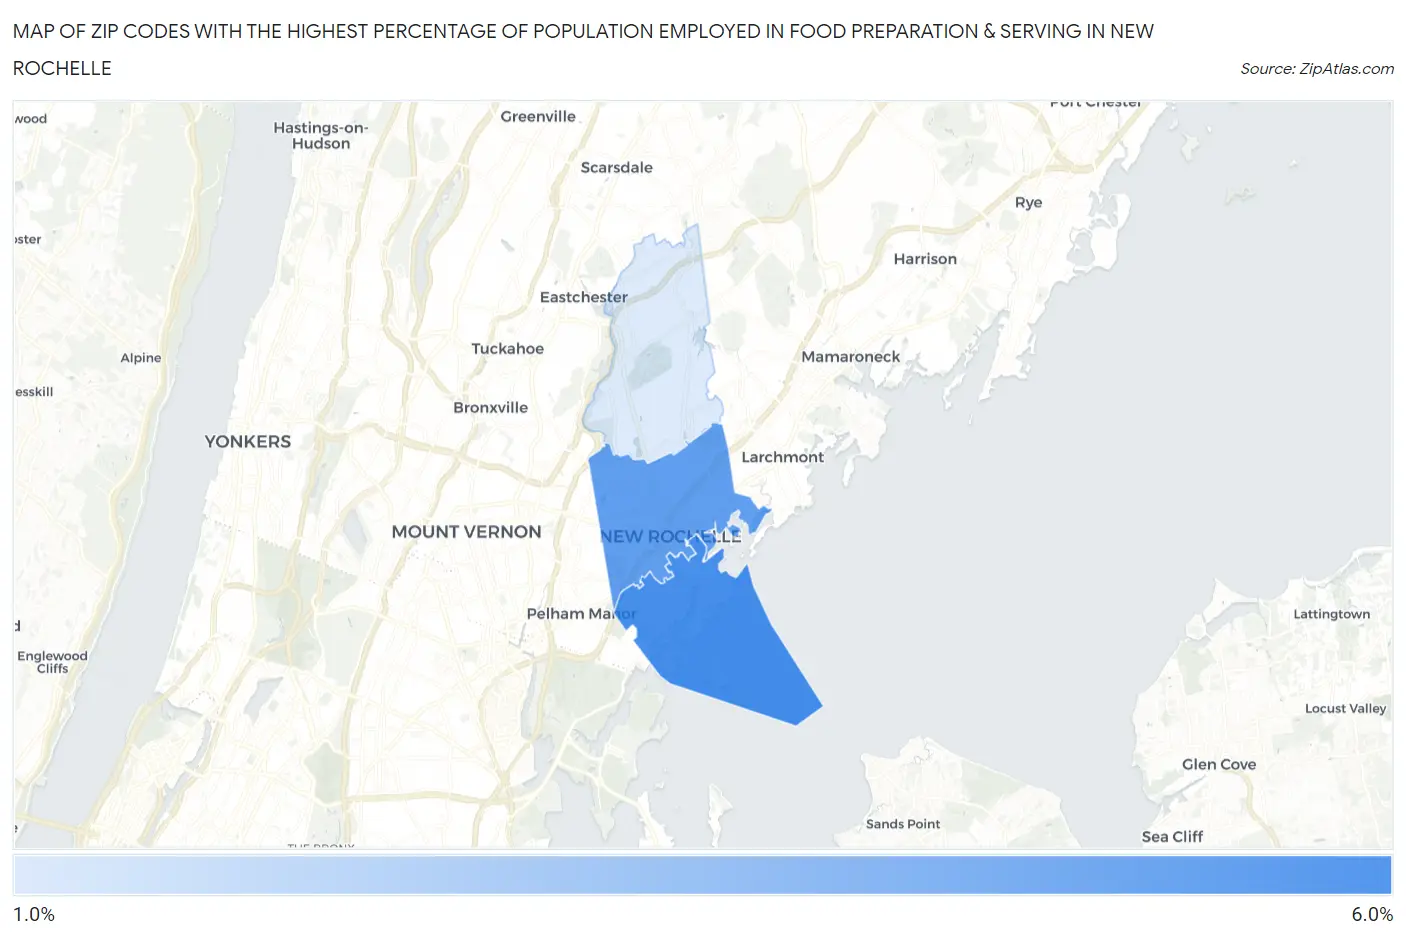
Map of Zip Codes with the Highest Percentage of Population Employed in Food Preparation & Serving in New Rochelle
1.9%
5.7%
Zip Codes with the Highest Percentage of Population Employed in Food Preparation & Serving in New Rochelle, NY
| Zip Code | % Employed | vs State | vs National | |
| 1. | 10805 | 5.7% | 4.8%(+0.878)#512 | 5.3%(+0.407)#10,371 |
| 2. | 10801 | 5.0% | 4.8%(+0.219)#611 | 5.3%(-0.251)#12,809 |
| 3. | 10804 | 1.9% | 4.8%(-2.94)#1,344 | 5.3%(-3.41)#25,059 |
1
Common Questions
What are the Top Zip Codes with the Highest Percentage of Population Employed in Food Preparation & Serving in New Rochelle, NY?
Top Zip Codes with the Highest Percentage of Population Employed in Food Preparation & Serving in New Rochelle, NY are:
What zip code has the Highest Percentage of Population Employed in Food Preparation & Serving in New Rochelle, NY?
10805 has the Highest Percentage of Population Employed in Food Preparation & Serving in New Rochelle, NY with 5.7%.
What is the Percentage of Population Employed in Food Preparation & Serving in New Rochelle, NY?
Percentage of Population Employed in Food Preparation & Serving in New Rochelle is 4.4%.
What is the Percentage of Population Employed in Food Preparation & Serving in New York?
Percentage of Population Employed in Food Preparation & Serving in New York is 4.8%.
What is the Percentage of Population Employed in Food Preparation & Serving in the United States?
Percentage of Population Employed in Food Preparation & Serving in the United States is 5.3%.