Hailesboro, NY Map & Demographics
Hailesboro Map
Hailesboro Overview
$31,504
PER CAPITA INCOME
$68,250
AVG FAMILY INCOME
$58,125
AVG HOUSEHOLD INCOME
42.7%
WAGE / INCOME GAP [ % ]
57.3¢/ $1
WAGE / INCOME GAP [ $ ]
0.37
INEQUALITY / GINI INDEX
627
TOTAL POPULATION
289
MALE POPULATION
338
FEMALE POPULATION
85.50
MALES / 100 FEMALES
116.96
FEMALES / 100 MALES
42.4
MEDIAN AGE
2.6
AVG FAMILY SIZE
2.1
AVG HOUSEHOLD SIZE
287
LABOR FORCE [ PEOPLE ]
56.8%
PERCENT IN LABOR FORCE
6.6%
UNEMPLOYMENT RATE
Hailesboro Area Codes
Income in Hailesboro
Income Overview in Hailesboro
Per Capita Income in Hailesboro is $31,504, while median incomes of families and households are $68,250 and $58,125 respectively.
| Characteristic | Number | Measure |
| Per Capita Income | 627 | $31,504 |
| Median Family Income | 175 | $68,250 |
| Mean Family Income | 175 | $77,261 |
| Median Household Income | 302 | $58,125 |
| Mean Household Income | 302 | $65,798 |
| Income Deficit | 175 | $0 |
| Wage / Income Gap (%) | 627 | 42.71% |
| Wage / Income Gap ($) | 627 | 57.29¢ per $1 |
| Gini / Inequality Index | 627 | 0.37 |
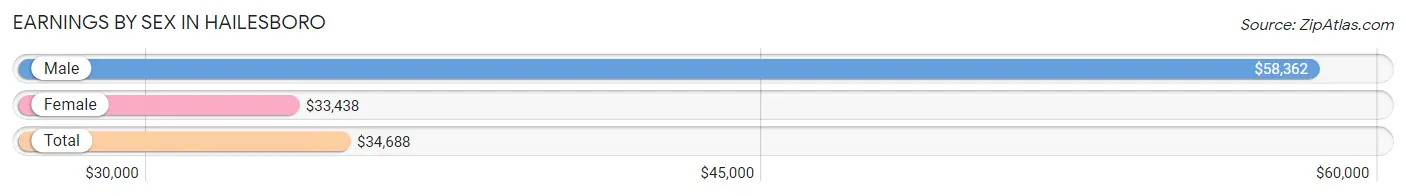
Earnings by Sex in Hailesboro
Average Earnings in Hailesboro are $34,688, $58,362 for men and $33,438 for women, a difference of 42.7%.
| Sex | Number | Average Earnings |
| Male | 96 (32.5%) | $58,362 |
| Female | 199 (67.5%) | $33,438 |
| Total | 295 (100.0%) | $34,688 |
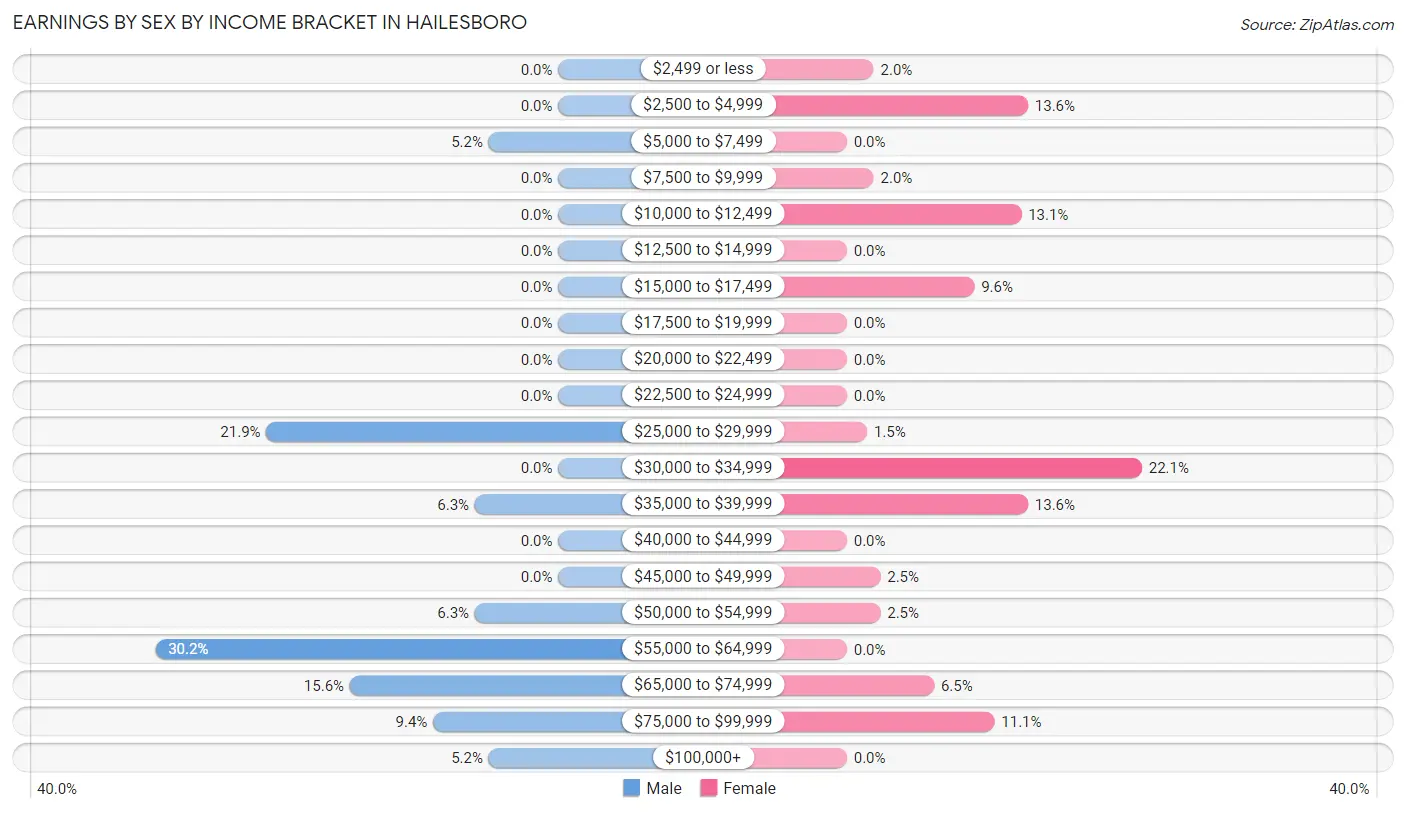
Earnings by Sex by Income Bracket in Hailesboro
The most common earnings brackets in Hailesboro are $55,000 to $64,999 for men (29 | 30.2%) and $30,000 to $34,999 for women (44 | 22.1%).
| Income | Male | Female |
| $2,499 or less | 0 (0.0%) | 4 (2.0%) |
| $2,500 to $4,999 | 0 (0.0%) | 27 (13.6%) |
| $5,000 to $7,499 | 5 (5.2%) | 0 (0.0%) |
| $7,500 to $9,999 | 0 (0.0%) | 4 (2.0%) |
| $10,000 to $12,499 | 0 (0.0%) | 26 (13.1%) |
| $12,500 to $14,999 | 0 (0.0%) | 0 (0.0%) |
| $15,000 to $17,499 | 0 (0.0%) | 19 (9.6%) |
| $17,500 to $19,999 | 0 (0.0%) | 0 (0.0%) |
| $20,000 to $22,499 | 0 (0.0%) | 0 (0.0%) |
| $22,500 to $24,999 | 0 (0.0%) | 0 (0.0%) |
| $25,000 to $29,999 | 21 (21.9%) | 3 (1.5%) |
| $30,000 to $34,999 | 0 (0.0%) | 44 (22.1%) |
| $35,000 to $39,999 | 6 (6.2%) | 27 (13.6%) |
| $40,000 to $44,999 | 0 (0.0%) | 0 (0.0%) |
| $45,000 to $49,999 | 0 (0.0%) | 5 (2.5%) |
| $50,000 to $54,999 | 6 (6.2%) | 5 (2.5%) |
| $55,000 to $64,999 | 29 (30.2%) | 0 (0.0%) |
| $65,000 to $74,999 | 15 (15.6%) | 13 (6.5%) |
| $75,000 to $99,999 | 9 (9.4%) | 22 (11.1%) |
| $100,000+ | 5 (5.2%) | 0 (0.0%) |
| Total | 96 (100.0%) | 199 (100.0%) |
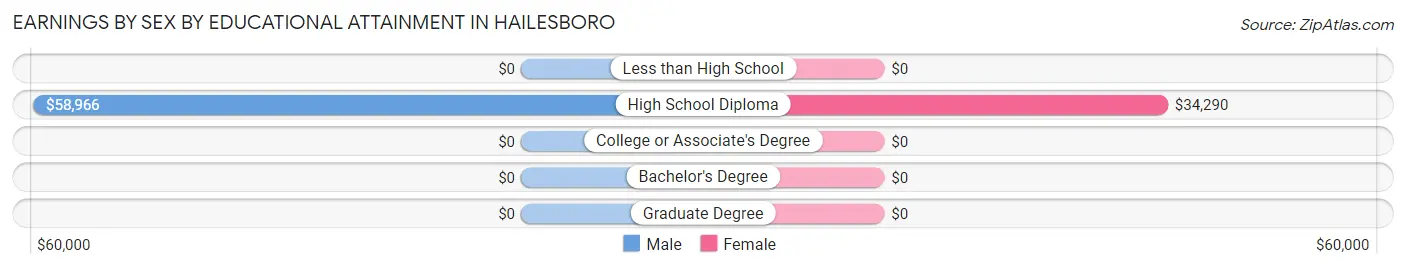
Earnings by Sex by Educational Attainment in Hailesboro
Average earnings in Hailesboro are $58,621 for men and $34,801 for women, a difference of 40.6%. Men with an educational attainment of high school diploma enjoy the highest average annual earnings of $58,966, while those with high school diploma education earn the least with $58,966. Women with an educational attainment of high school diploma earn the most with the average annual earnings of $34,290, while those with high school diploma education have the smallest earnings of $34,290.
| Educational Attainment | Male Income | Female Income |
| Less than High School | - | - |
| High School Diploma | $58,966 | $34,290 |
| College or Associate's Degree | - | - |
| Bachelor's Degree | - | - |
| Graduate Degree | - | - |
| Total | $58,621 | $34,801 |
Family Income in Hailesboro
Family Income Brackets in Hailesboro
According to the Hailesboro family income data, there are 42 families falling into the $35,000 to $49,999 income range, which is the most common income bracket and makes up 24.0% of all families.
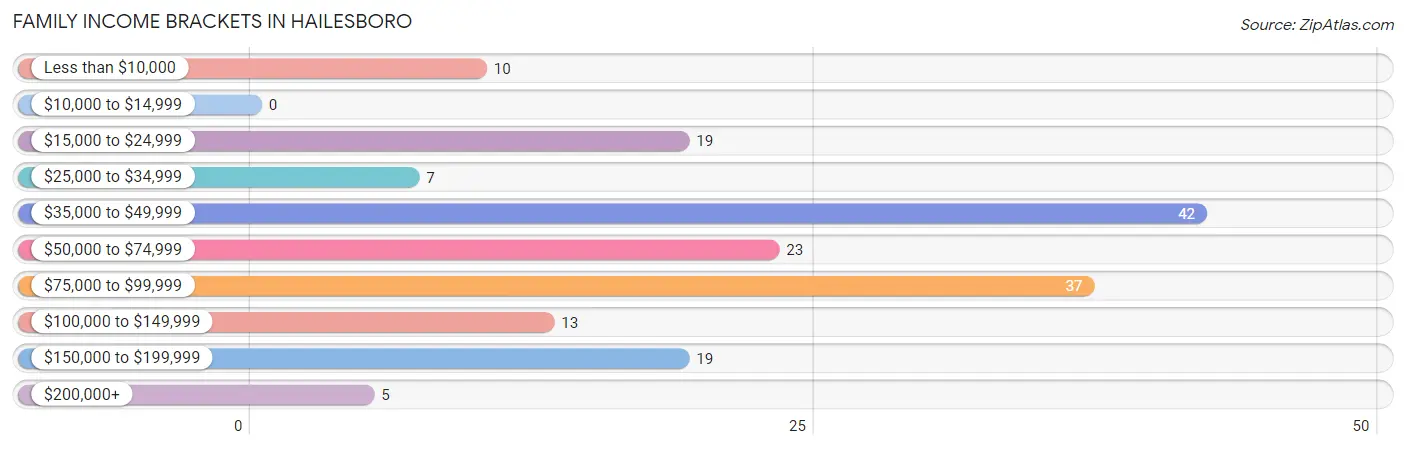
| Income Bracket | # Families | % Families |
| Less than $10,000 | 10 | 5.7% |
| $10,000 to $14,999 | 0 | 0.0% |
| $15,000 to $24,999 | 19 | 10.9% |
| $25,000 to $34,999 | 7 | 4.0% |
| $35,000 to $49,999 | 42 | 24.0% |
| $50,000 to $74,999 | 23 | 13.1% |
| $75,000 to $99,999 | 37 | 21.1% |
| $100,000 to $149,999 | 13 | 7.4% |
| $150,000 to $199,999 | 19 | 10.9% |
| $200,000+ | 5 | 2.9% |
Family Income by Famaliy Size in Hailesboro
3-person families (69 | 39.4%) account for the highest median family income in Hailesboro with $95,388 per family, while 3-person families (69 | 39.4%) have the highest median income of $31,796 per family member.
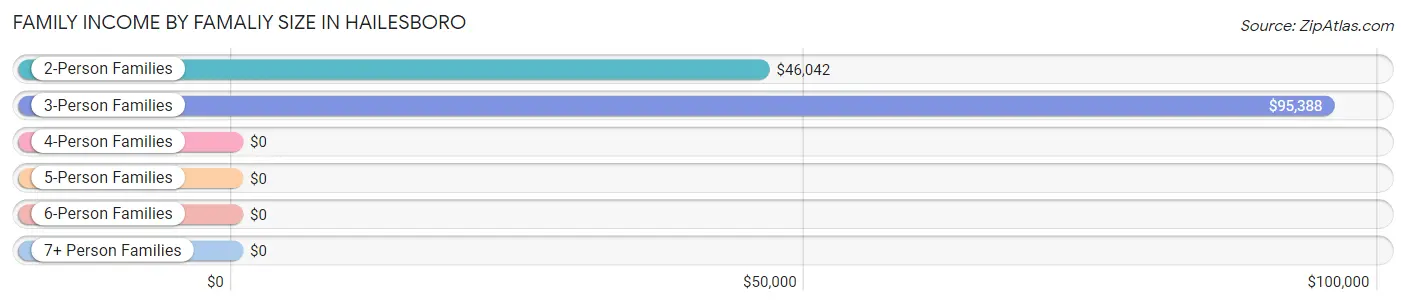
| Income Bracket | # Families | Median Income |
| 2-Person Families | 91 (52.0%) | $46,042 |
| 3-Person Families | 69 (39.4%) | $95,388 |
| 4-Person Families | 5 (2.9%) | $0 |
| 5-Person Families | 10 (5.7%) | $0 |
| 6-Person Families | 0 (0.0%) | $0 |
| 7+ Person Families | 0 (0.0%) | $0 |
| Total | 175 (100.0%) | $68,250 |
Family Income by Number of Earners in Hailesboro
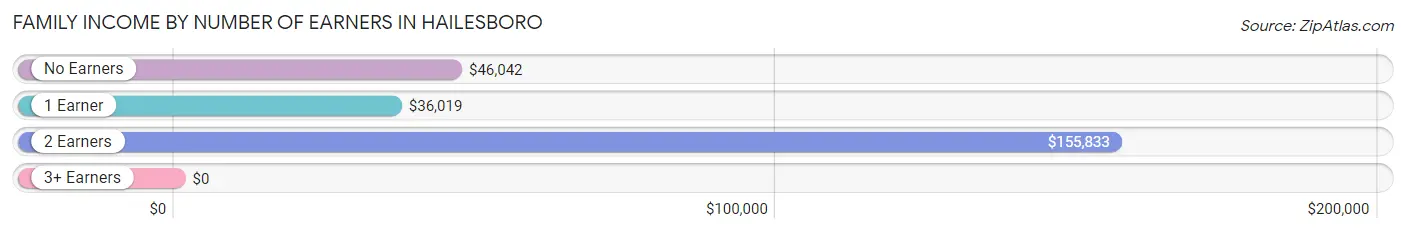
| Number of Earners | # Families | Median Income |
| No Earners | 49 (28.0%) | $46,042 |
| 1 Earner | 68 (38.9%) | $36,019 |
| 2 Earners | 24 (13.7%) | $155,833 |
| 3+ Earners | 34 (19.4%) | $0 |
| Total | 175 (100.0%) | $68,250 |
Household Income in Hailesboro
Household Income Brackets in Hailesboro
With 80 households falling in the category, the $35,000 to $49,999 income range is the most frequent in Hailesboro, accounting for 26.5% of all households. In contrast, only 4 households (1.3%) fall into the $10,000 to $14,999 income bracket, making it the least populous group.
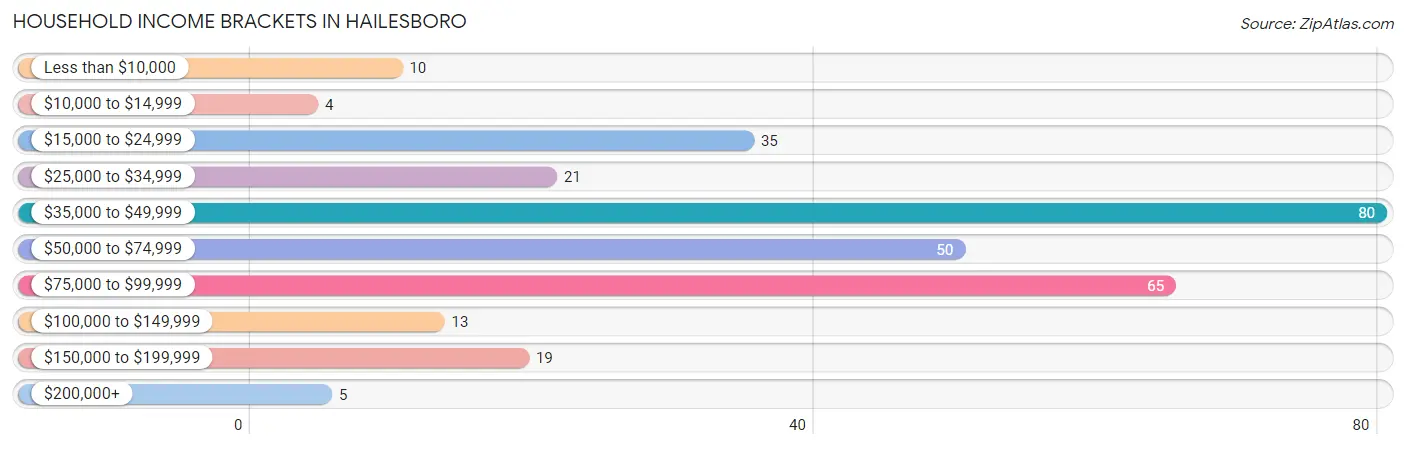
| Income Bracket | # Households | % Households |
| Less than $10,000 | 10 | 3.3% |
| $10,000 to $14,999 | 4 | 1.3% |
| $15,000 to $24,999 | 35 | 11.6% |
| $25,000 to $34,999 | 21 | 7.0% |
| $35,000 to $49,999 | 80 | 26.5% |
| $50,000 to $74,999 | 50 | 16.6% |
| $75,000 to $99,999 | 65 | 21.5% |
| $100,000 to $149,999 | 13 | 4.3% |
| $150,000 to $199,999 | 19 | 6.3% |
| $200,000+ | 5 | 1.7% |
Household Income by Householder Age in Hailesboro
The median household income in Hailesboro is $58,125, with the highest median household income of $61,852 found in the 25 to 44 years age bracket for the primary householder. A total of 86 households (28.5%) fall into this category.
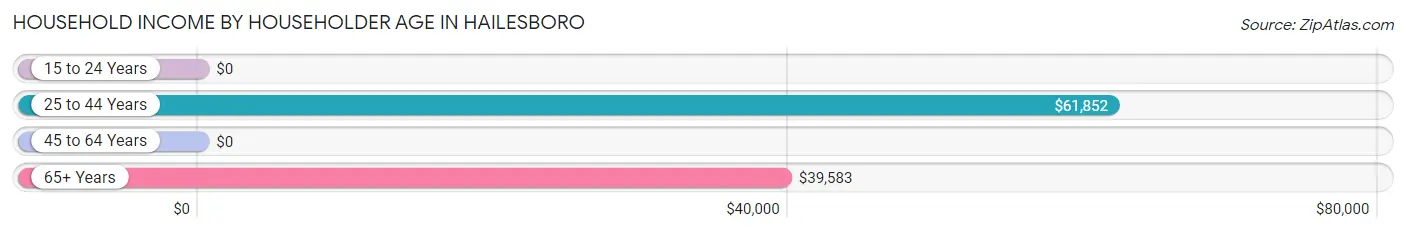
| Income Bracket | # Households | Median Income |
| 15 to 24 Years | 0 (0.0%) | $0 |
| 25 to 44 Years | 86 (28.5%) | $61,852 |
| 45 to 64 Years | 141 (46.7%) | $0 |
| 65+ Years | 75 (24.8%) | $39,583 |
| Total | 302 (100.0%) | $58,125 |
Poverty in Hailesboro
Income Below Poverty by Sex and Age in Hailesboro
With 14.2% poverty level for males and 30.8% for females among the residents of Hailesboro, under 5 year old males and under 5 year old females are the most vulnerable to poverty, with 26 males (68.4%) and 10 females (100.0%) in their respective age groups living below the poverty level.
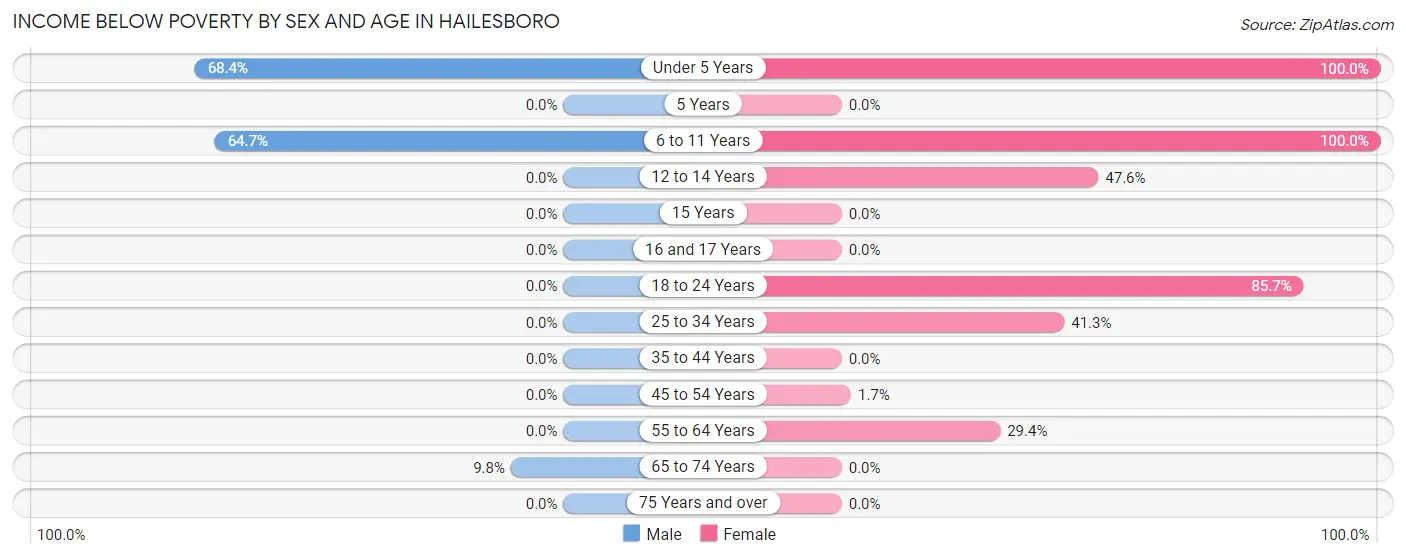
| Age Bracket | Male | Female |
| Under 5 Years | 26 (68.4%) | 10 (100.0%) |
| 5 Years | 0 (0.0%) | 0 (0.0%) |
| 6 to 11 Years | 11 (64.7%) | 36 (100.0%) |
| 12 to 14 Years | 0 (0.0%) | 10 (47.6%) |
| 15 Years | 0 (0.0%) | 0 (0.0%) |
| 16 and 17 Years | 0 (0.0%) | 0 (0.0%) |
| 18 to 24 Years | 0 (0.0%) | 18 (85.7%) |
| 25 to 34 Years | 0 (0.0%) | 19 (41.3%) |
| 35 to 44 Years | 0 (0.0%) | 0 (0.0%) |
| 45 to 54 Years | 0 (0.0%) | 1 (1.7%) |
| 55 to 64 Years | 0 (0.0%) | 10 (29.4%) |
| 65 to 74 Years | 4 (9.8%) | 0 (0.0%) |
| 75 Years and over | 0 (0.0%) | 0 (0.0%) |
| Total | 41 (14.2%) | 104 (30.8%) |
Income Above Poverty by Sex and Age in Hailesboro
According to the poverty statistics in Hailesboro, males aged 18 to 24 years and females aged 16 and 17 years are the age groups that are most secure financially, with 100.0% of males and 100.0% of females in these age groups living above the poverty line.
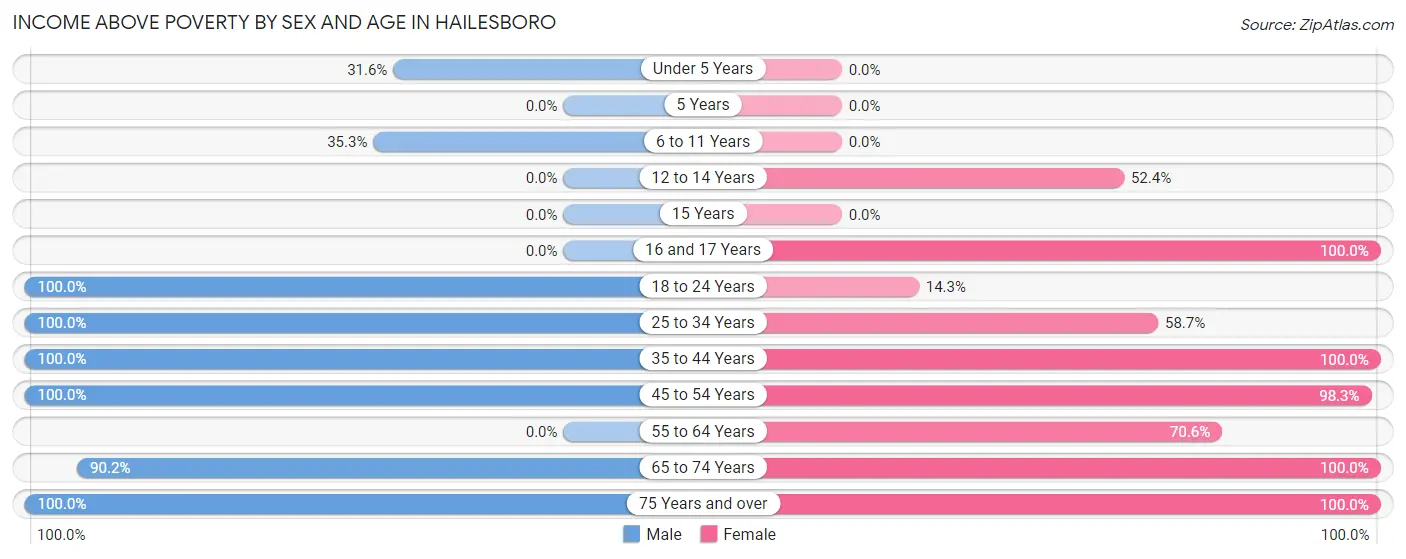
| Age Bracket | Male | Female |
| Under 5 Years | 12 (31.6%) | 0 (0.0%) |
| 5 Years | 0 (0.0%) | 0 (0.0%) |
| 6 to 11 Years | 6 (35.3%) | 0 (0.0%) |
| 12 to 14 Years | 0 (0.0%) | 11 (52.4%) |
| 15 Years | 0 (0.0%) | 0 (0.0%) |
| 16 and 17 Years | 0 (0.0%) | 31 (100.0%) |
| 18 to 24 Years | 6 (100.0%) | 3 (14.3%) |
| 25 to 34 Years | 45 (100.0%) | 27 (58.7%) |
| 35 to 44 Years | 32 (100.0%) | 27 (100.0%) |
| 45 to 54 Years | 94 (100.0%) | 57 (98.3%) |
| 55 to 64 Years | 0 (0.0%) | 24 (70.6%) |
| 65 to 74 Years | 37 (90.2%) | 27 (100.0%) |
| 75 Years and over | 16 (100.0%) | 27 (100.0%) |
| Total | 248 (85.8%) | 234 (69.2%) |
Income Below Poverty Among Married-Couple Families in Hailesboro
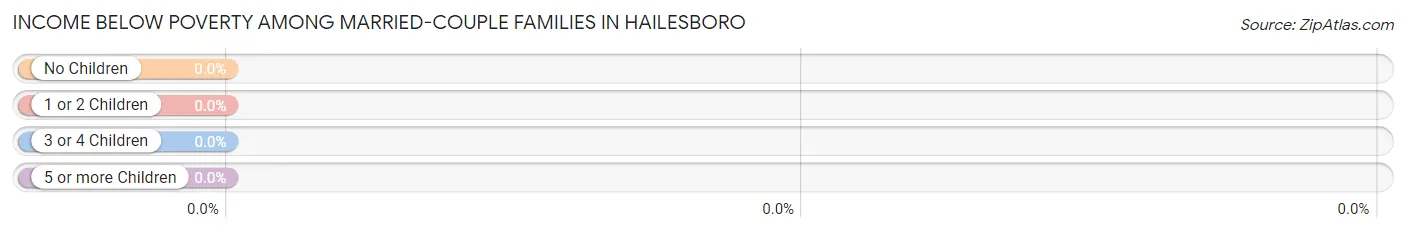
| Children | Above Poverty | Below Poverty |
| No Children | 52 (100.0%) | 0 (0.0%) |
| 1 or 2 Children | 40 (100.0%) | 0 (0.0%) |
| 3 or 4 Children | 0 (0.0%) | 0 (0.0%) |
| 5 or more Children | 0 (0.0%) | 0 (0.0%) |
| Total | 92 (100.0%) | 0 (0.0%) |
Income Below Poverty Among Single-Parent Households in Hailesboro
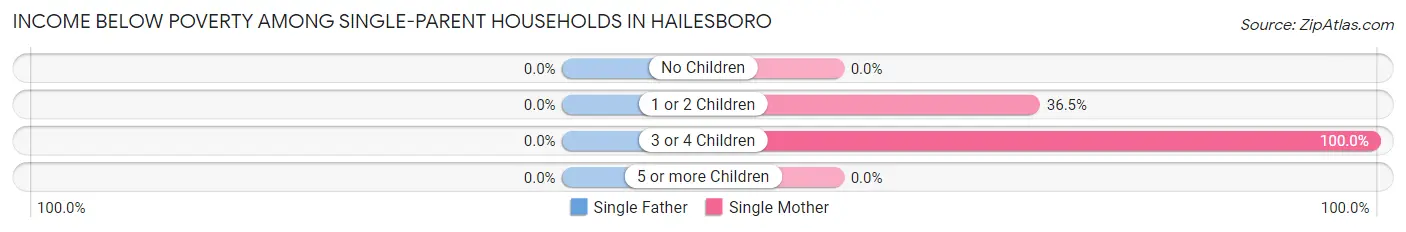
| Children | Single Father | Single Mother |
| No Children | 0 (0.0%) | 0 (0.0%) |
| 1 or 2 Children | 0 (0.0%) | 19 (36.5%) |
| 3 or 4 Children | 0 (0.0%) | 10 (100.0%) |
| 5 or more Children | 0 (0.0%) | 0 (0.0%) |
| Total | 0 (0.0%) | 29 (36.7%) |
Income Below Poverty Among Married-Couple vs Single-Parent Households in Hailesboro
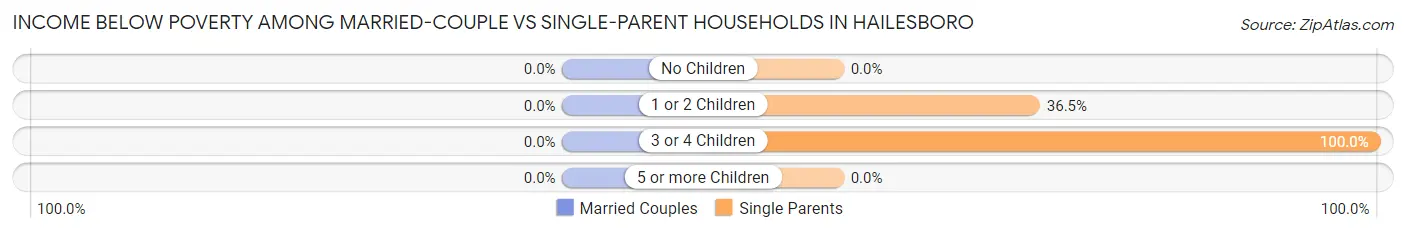
| Children | Married-Couple Families | Single-Parent Households |
| No Children | 0 (0.0%) | 0 (0.0%) |
| 1 or 2 Children | 0 (0.0%) | 19 (36.5%) |
| 3 or 4 Children | 0 (0.0%) | 10 (100.0%) |
| 5 or more Children | 0 (0.0%) | 0 (0.0%) |
| Total | 0 (0.0%) | 29 (34.9%) |
Race in Hailesboro
The most populous races in Hailesboro are White / Caucasian (526 | 83.9%), Two or more Races (99 | 15.8%), and Hispanic or Latino (88 | 14.0%).
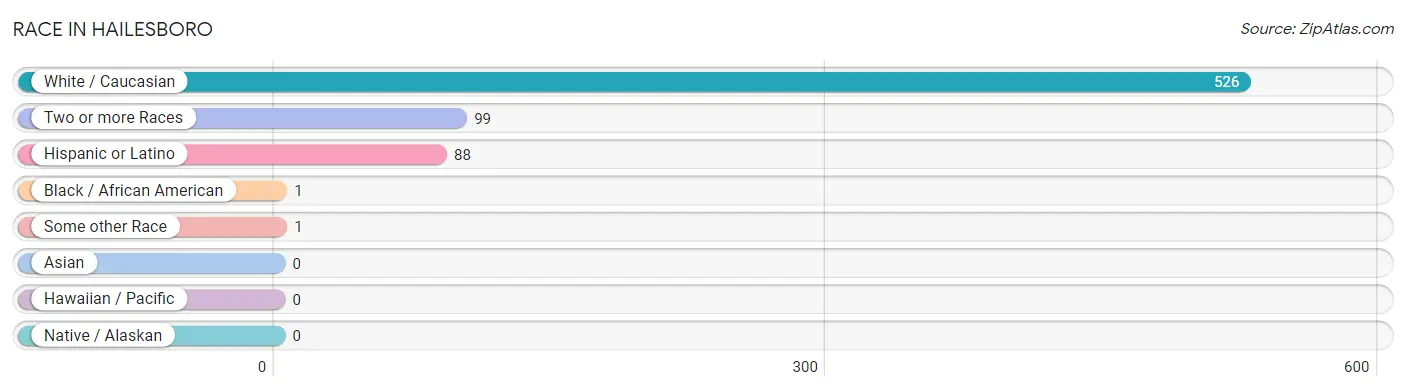
| Race | # Population | % Population |
| Asian | 0 | 0.0% |
| Black / African American | 1 | 0.2% |
| Hawaiian / Pacific | 0 | 0.0% |
| Hispanic or Latino | 88 | 14.0% |
| Native / Alaskan | 0 | 0.0% |
| White / Caucasian | 526 | 83.9% |
| Two or more Races | 99 | 15.8% |
| Some other Race | 1 | 0.2% |
| Total | 627 | 100.0% |
Ancestry in Hailesboro
The most populous ancestries reported in Hailesboro are Italian (78 | 12.4%), Puerto Rican (63 | 10.1%), English (34 | 5.4%), French (31 | 4.9%), and Polish (26 | 4.2%), together accounting for 37.0% of all Hailesboro residents.
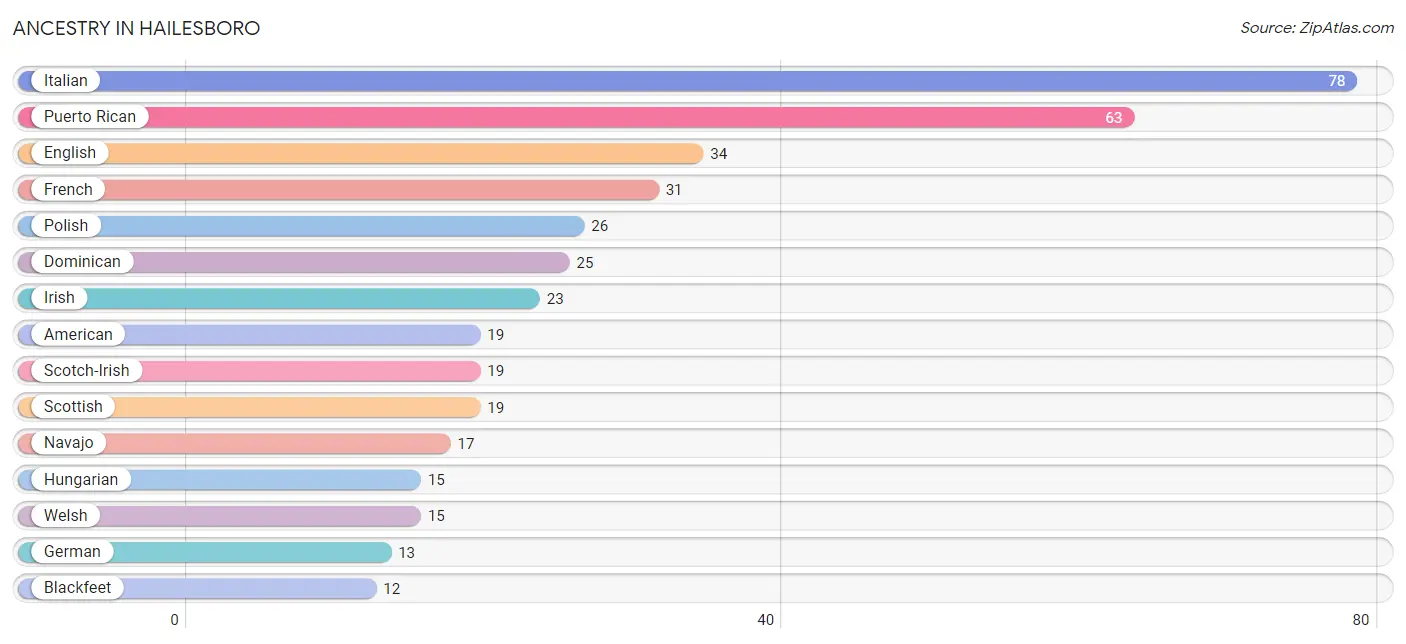
| Ancestry | # Population | % Population |
| American | 19 | 3.0% |
| Blackfeet | 12 | 1.9% |
| Dominican | 25 | 4.0% |
| English | 34 | 5.4% |
| European | 9 | 1.4% |
| French | 31 | 4.9% |
| French Canadian | 4 | 0.6% |
| German | 13 | 2.1% |
| Hungarian | 15 | 2.4% |
| Irish | 23 | 3.7% |
| Iroquois | 12 | 1.9% |
| Italian | 78 | 12.4% |
| Navajo | 17 | 2.7% |
| Northern European | 5 | 0.8% |
| Polish | 26 | 4.2% |
| Puerto Rican | 63 | 10.1% |
| Scotch-Irish | 19 | 3.0% |
| Scottish | 19 | 3.0% |
| Welsh | 15 | 2.4% | View All 19 Rows |
Immigrants in Hailesboro
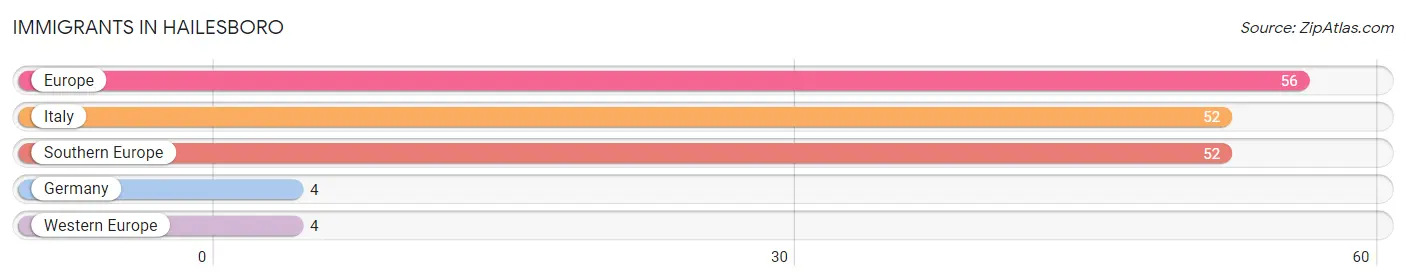
The most numerous immigrant groups reported in Hailesboro came from Europe (56 | 8.9%), Italy (52 | 8.3%), Southern Europe (52 | 8.3%), Germany (4 | 0.6%), and Western Europe (4 | 0.6%), together accounting for 26.8% of all Hailesboro residents.
| Immigration Origin | # Population | % Population |
| Europe | 56 | 8.9% |
| Germany | 4 | 0.6% |
| Italy | 52 | 8.3% |
| Southern Europe | 52 | 8.3% |
| Western Europe | 4 | 0.6% | View All 5 Rows |
Sex and Age in Hailesboro
Sex and Age in Hailesboro
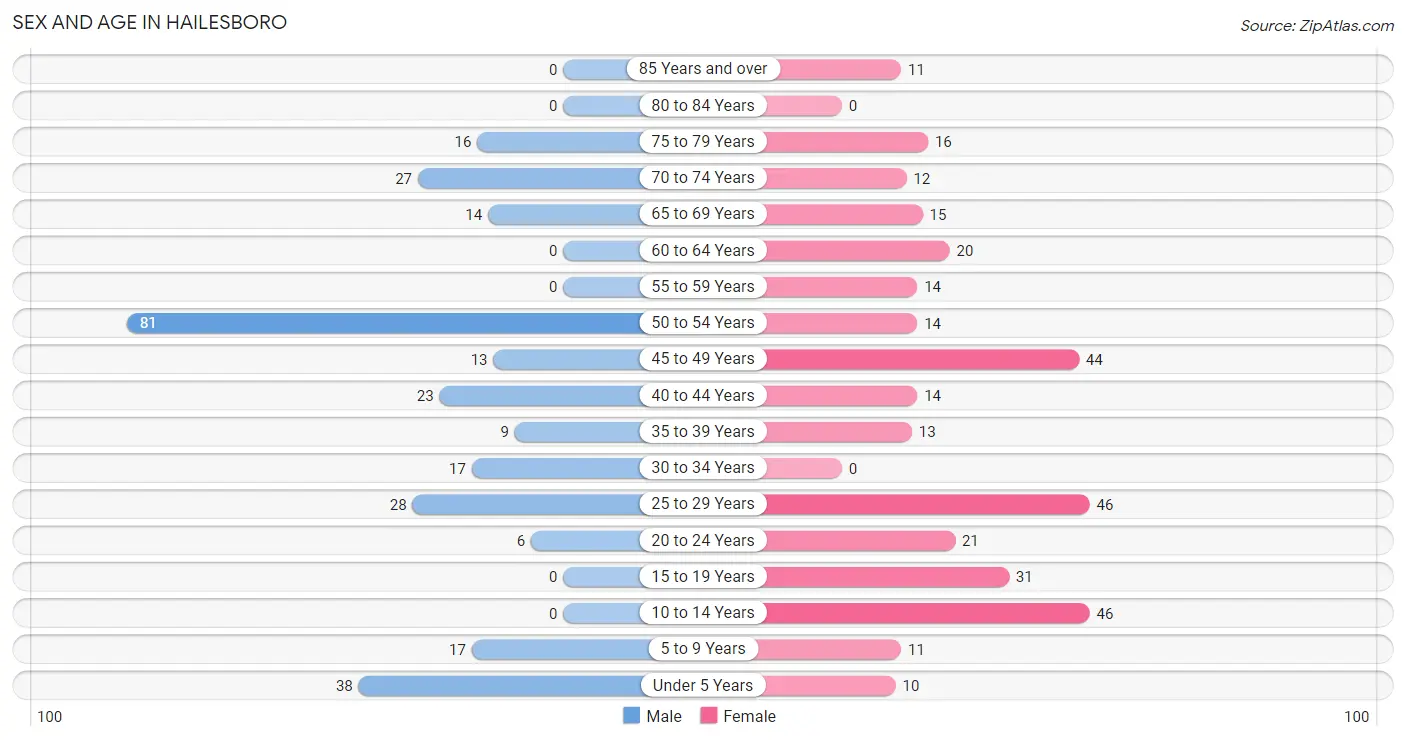
The most populous age groups in Hailesboro are 50 to 54 Years (81 | 28.0%) for men and 10 to 14 Years (46 | 13.6%) for women.
| Age Bracket | Male | Female |
| Under 5 Years | 38 (13.2%) | 10 (3.0%) |
| 5 to 9 Years | 17 (5.9%) | 11 (3.3%) |
| 10 to 14 Years | 0 (0.0%) | 46 (13.6%) |
| 15 to 19 Years | 0 (0.0%) | 31 (9.2%) |
| 20 to 24 Years | 6 (2.1%) | 21 (6.2%) |
| 25 to 29 Years | 28 (9.7%) | 46 (13.6%) |
| 30 to 34 Years | 17 (5.9%) | 0 (0.0%) |
| 35 to 39 Years | 9 (3.1%) | 13 (3.8%) |
| 40 to 44 Years | 23 (8.0%) | 14 (4.1%) |
| 45 to 49 Years | 13 (4.5%) | 44 (13.0%) |
| 50 to 54 Years | 81 (28.0%) | 14 (4.1%) |
| 55 to 59 Years | 0 (0.0%) | 14 (4.1%) |
| 60 to 64 Years | 0 (0.0%) | 20 (5.9%) |
| 65 to 69 Years | 14 (4.8%) | 15 (4.4%) |
| 70 to 74 Years | 27 (9.3%) | 12 (3.5%) |
| 75 to 79 Years | 16 (5.5%) | 16 (4.7%) |
| 80 to 84 Years | 0 (0.0%) | 0 (0.0%) |
| 85 Years and over | 0 (0.0%) | 11 (3.3%) |
| Total | 289 (100.0%) | 338 (100.0%) |
Families and Households in Hailesboro
Median Family Size in Hailesboro
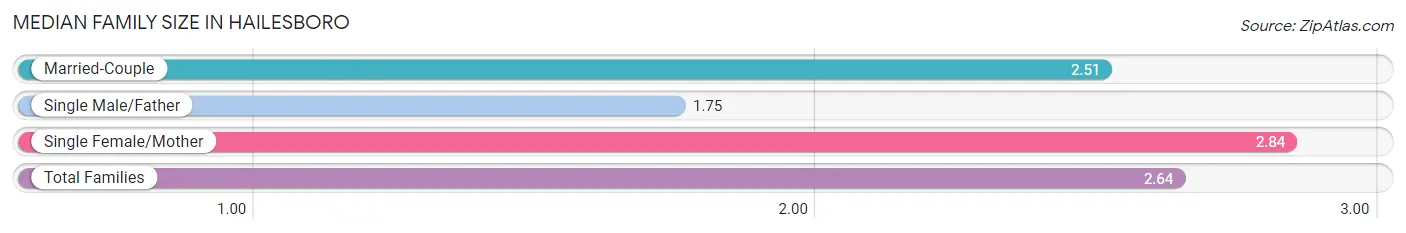
The median family size in Hailesboro is 2.64 persons per family, with single female/mother families (79 | 45.1%) accounting for the largest median family size of 2.84 persons per family. On the other hand, single male/father families (4 | 2.3%) represent the smallest median family size with 1.75 persons per family.
| Family Type | # Families | Family Size |
| Married-Couple | 92 (52.6%) | 2.51 |
| Single Male/Father | 4 (2.3%) | 1.75 |
| Single Female/Mother | 79 (45.1%) | 2.84 |
| Total Families | 175 (100.0%) | 2.64 |
Median Household Size in Hailesboro
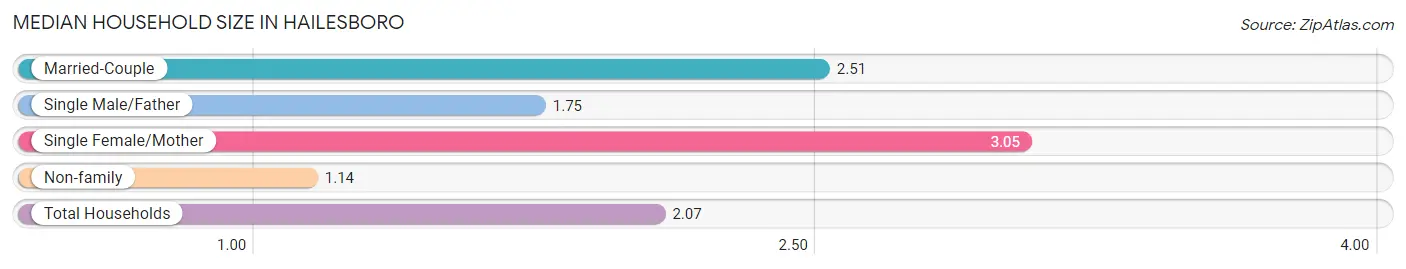
The median household size in Hailesboro is 2.07 persons per household, with single female/mother households (79 | 26.2%) accounting for the largest median household size of 3.05 persons per household. non-family households (127 | 42.0%) represent the smallest median household size with 1.14 persons per household.
| Household Type | # Households | Household Size |
| Married-Couple | 92 (30.5%) | 2.51 |
| Single Male/Father | 4 (1.3%) | 1.75 |
| Single Female/Mother | 79 (26.2%) | 3.05 |
| Non-family | 127 (42.0%) | 1.14 |
| Total Households | 302 (100.0%) | 2.07 |
Household Size by Marriage Status in Hailesboro
Out of a total of 302 households in Hailesboro, 175 (58.0%) are family households, while 127 (42.0%) are nonfamily households. The most numerous type of family households are 3-person households, comprising 96, and the most common type of nonfamily households are 1-person households, comprising 112.
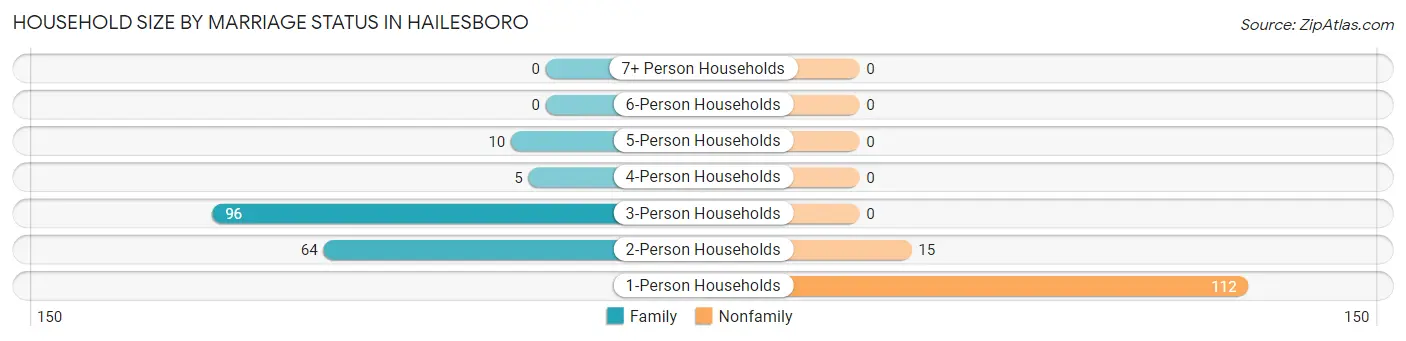
| Household Size | Family Households | Nonfamily Households |
| 1-Person Households | - | 112 (37.1%) |
| 2-Person Households | 64 (21.2%) | 15 (5.0%) |
| 3-Person Households | 96 (31.8%) | 0 (0.0%) |
| 4-Person Households | 5 (1.7%) | 0 (0.0%) |
| 5-Person Households | 10 (3.3%) | 0 (0.0%) |
| 6-Person Households | 0 (0.0%) | 0 (0.0%) |
| 7+ Person Households | 0 (0.0%) | 0 (0.0%) |
| Total | 175 (58.0%) | 127 (42.0%) |
Female Fertility in Hailesboro
Fertility by Age in Hailesboro
Average fertility rate in Hailesboro is 212.0 births per 1,000 women. Women in the age bracket of 35 to 50 years have the highest fertility rate with 500.0 births per 1,000 women. Women in the age bracket of 35 to 50 years acount for 100.0% of all women with births.
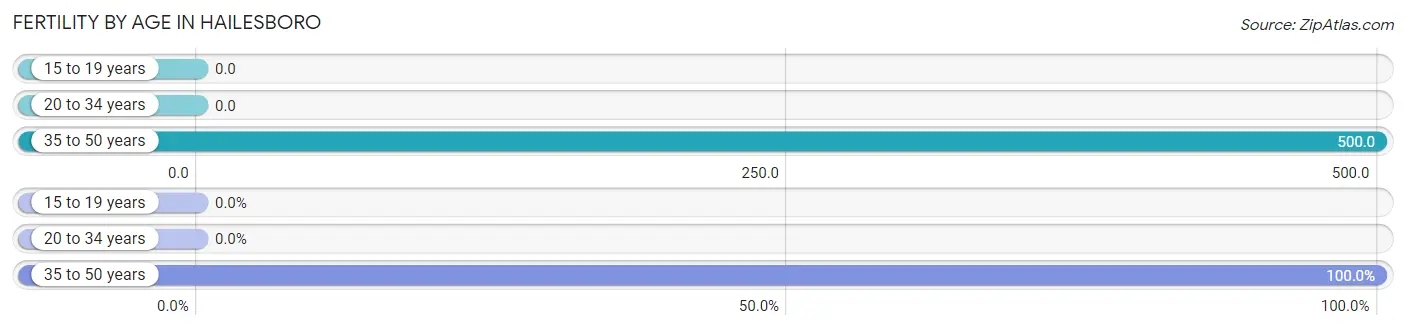
| Age Bracket | Women with Births | Births / 1,000 Women |
| 15 to 19 years | 0 (0.0%) | 0.0 |
| 20 to 34 years | 0 (0.0%) | 0.0 |
| 35 to 50 years | 36 (100.0%) | 500.0 |
| Total | 36 (100.0%) | 212.0 |
Fertility by Age by Marriage Status in Hailesboro
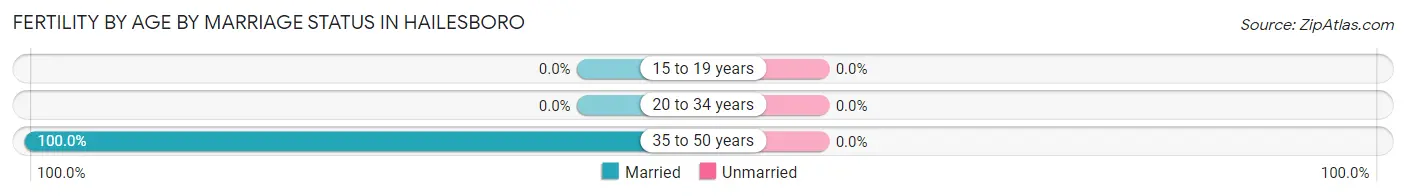
| Age Bracket | Married | Unmarried |
| 15 to 19 years | 0 (0.0%) | 0 (0.0%) |
| 20 to 34 years | 0 (0.0%) | 0 (0.0%) |
| 35 to 50 years | 36 (100.0%) | 0 (0.0%) |
| Total | 36 (100.0%) | 0 (0.0%) |
Fertility by Education in Hailesboro
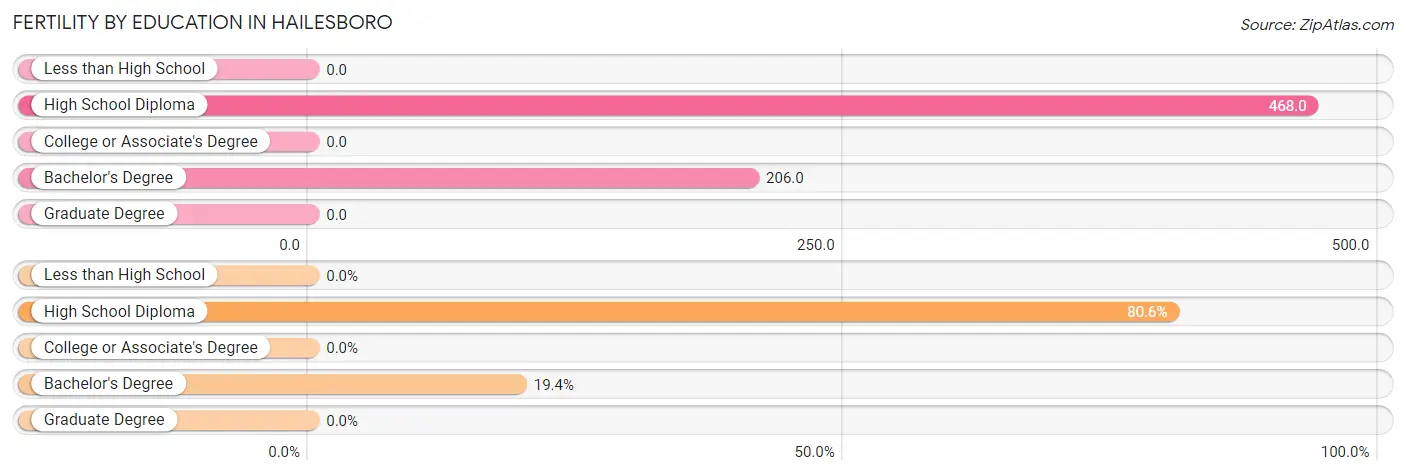
| Educational Attainment | Women with Births | Births / 1,000 Women |
| Less than High School | 0 (0.0%) | 0.0 |
| High School Diploma | 29 (80.6%) | 468.0 |
| College or Associate's Degree | 0 (0.0%) | 0.0 |
| Bachelor's Degree | 7 (19.4%) | 206.0 |
| Graduate Degree | 0 (0.0%) | 0.0 |
| Total | 36 (100.0%) | 212.0 |
Fertility by Education by Marriage Status in Hailesboro
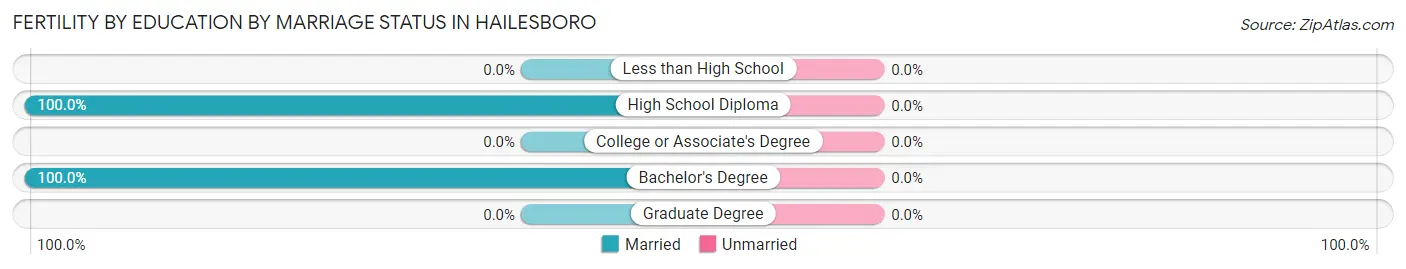
| Educational Attainment | Married | Unmarried |
| Less than High School | 0 (0.0%) | 0 (0.0%) |
| High School Diploma | 29 (100.0%) | 0 (0.0%) |
| College or Associate's Degree | 0 (0.0%) | 0 (0.0%) |
| Bachelor's Degree | 7 (100.0%) | 0 (0.0%) |
| Graduate Degree | 0 (0.0%) | 0 (0.0%) |
| Total | 36 (100.0%) | 0 (0.0%) |
Employment Characteristics in Hailesboro
Employment by Class of Employer in Hailesboro
Among the 268 employed individuals in Hailesboro, private company employees (175 | 65.3%), state government employees (51 | 19.0%), and local government employees (36 | 13.4%) make up the most common classes of employment.
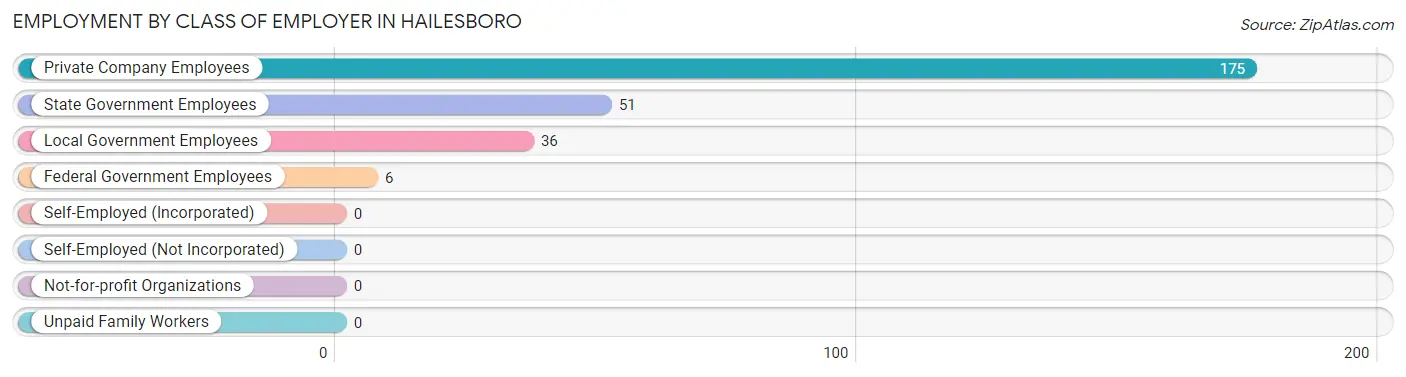
| Employer Class | # Employees | % Employees |
| Private Company Employees | 175 | 65.3% |
| Self-Employed (Incorporated) | 0 | 0.0% |
| Self-Employed (Not Incorporated) | 0 | 0.0% |
| Not-for-profit Organizations | 0 | 0.0% |
| Local Government Employees | 36 | 13.4% |
| State Government Employees | 51 | 19.0% |
| Federal Government Employees | 6 | 2.2% |
| Unpaid Family Workers | 0 | 0.0% |
| Total | 268 | 100.0% |
Employment Status by Age in Hailesboro
According to the labor force statistics for Hailesboro, out of the total population over 16 years of age (505), 56.8% or 287 individuals are in the labor force, with 6.6% or 19 of them unemployed. The age group with the highest labor force participation rate is 20 to 24 years, with 100.0% or 27 individuals in the labor force. Within the labor force, the 25 to 29 years age range has the highest percentage of unemployed individuals, with 28.8% or 19 of them being unemployed.
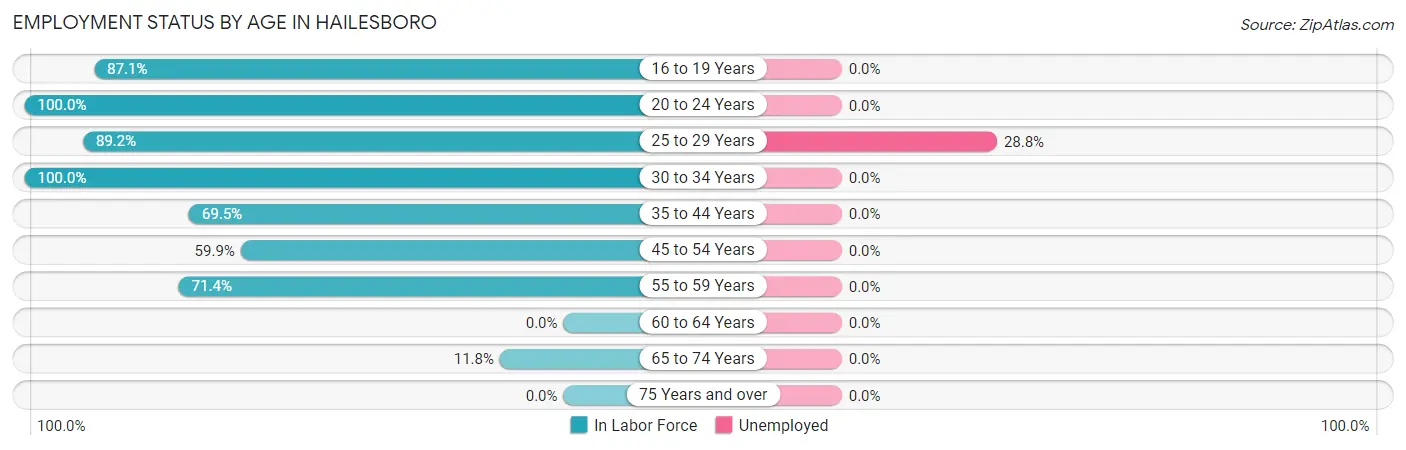
| Age Bracket | In Labor Force | Unemployed |
| 16 to 19 Years | 27 (87.1%) | 0 (0.0%) |
| 20 to 24 Years | 27 (100.0%) | 0 (0.0%) |
| 25 to 29 Years | 66 (89.2%) | 19 (28.8%) |
| 30 to 34 Years | 17 (100.0%) | 0 (0.0%) |
| 35 to 44 Years | 41 (69.5%) | 0 (0.0%) |
| 45 to 54 Years | 91 (59.9%) | 0 (0.0%) |
| 55 to 59 Years | 10 (71.4%) | 0 (0.0%) |
| 60 to 64 Years | 0 (0.0%) | 0 (0.0%) |
| 65 to 74 Years | 8 (11.8%) | 0 (0.0%) |
| 75 Years and over | 0 (0.0%) | 0 (0.0%) |
| Total | 287 (56.8%) | 19 (6.6%) |
Employment Status by Educational Attainment in Hailesboro
According to labor force statistics for Hailesboro, 67.0% of individuals (225) out of the total population between 25 and 64 years of age (336) are in the labor force, with 8.4% or 19 of them being unemployed. The group with the highest labor force participation rate are those with the educational attainment of college / associate degree, with 85.6% or 83 individuals in the labor force. Within the labor force, individuals with college / associate degree education have the highest percentage of unemployment, with 22.9% or 19 of them being unemployed.
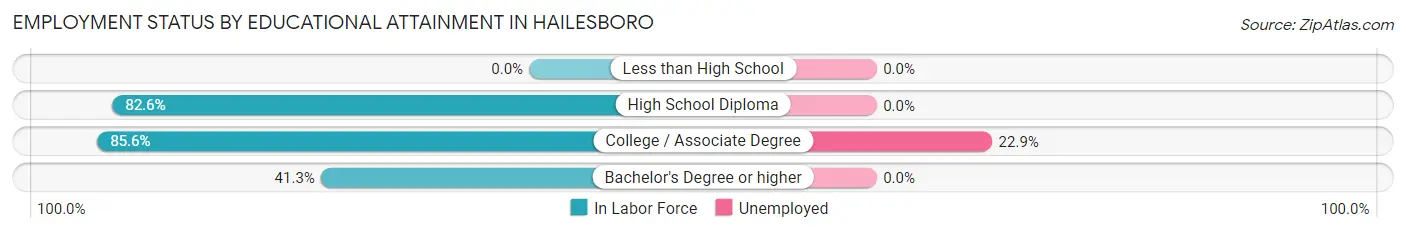
| Educational Attainment | In Labor Force | Unemployed |
| Less than High School | 0 (0.0%) | 0 (0.0%) |
| High School Diploma | 109 (82.6%) | 0 (0.0%) |
| College / Associate Degree | 83 (85.6%) | 22 (22.9%) |
| Bachelor's Degree or higher | 33 (41.3%) | 0 (0.0%) |
| Total | 225 (67.0%) | 28 (8.4%) |
Employment Occupations by Sex in Hailesboro
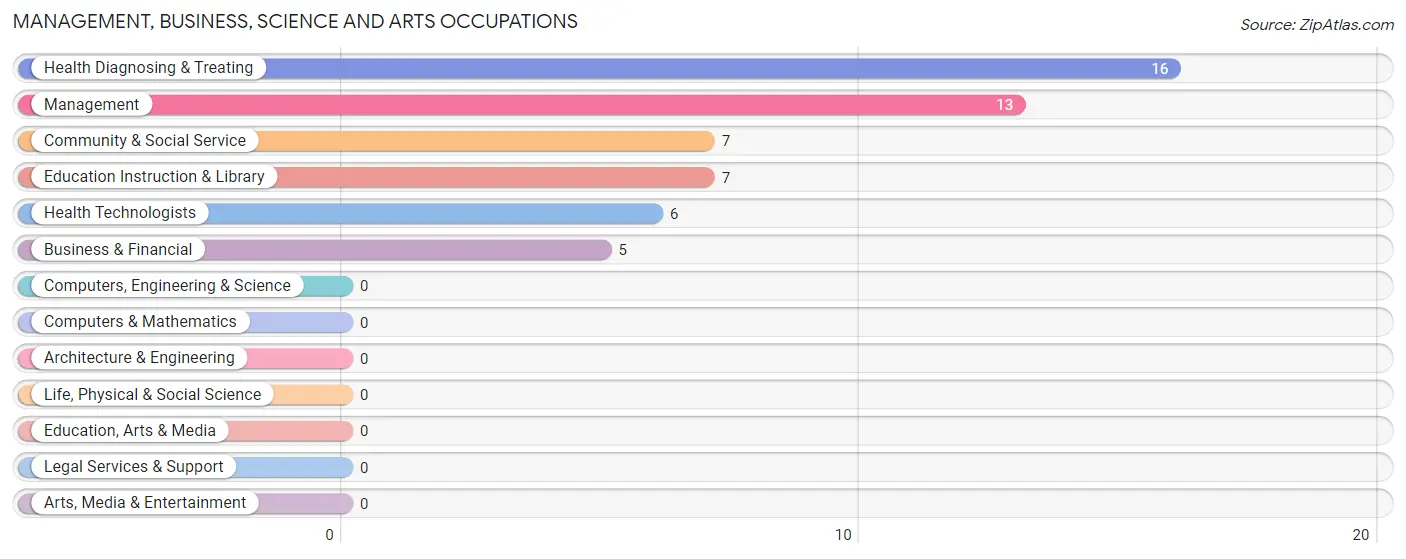
Management, Business, Science and Arts Occupations
The most common Management, Business, Science and Arts occupations in Hailesboro are Health Diagnosing & Treating (16 | 6.0%), Management (13 | 4.9%), Community & Social Service (7 | 2.6%), Education Instruction & Library (7 | 2.6%), and Health Technologists (6 | 2.2%).
Management, Business, Science and Arts Occupations by Sex
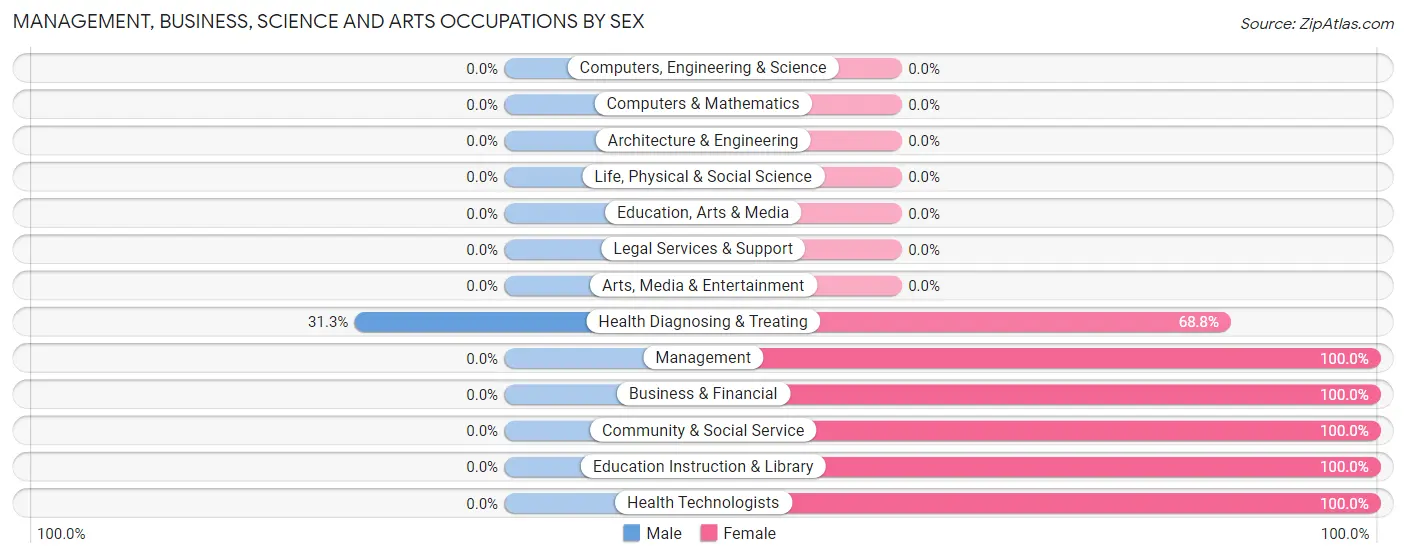
| Occupation | Male | Female |
| Management | 0 (0.0%) | 13 (100.0%) |
| Business & Financial | 0 (0.0%) | 5 (100.0%) |
| Computers, Engineering & Science | 0 (0.0%) | 0 (0.0%) |
| Computers & Mathematics | 0 (0.0%) | 0 (0.0%) |
| Architecture & Engineering | 0 (0.0%) | 0 (0.0%) |
| Life, Physical & Social Science | 0 (0.0%) | 0 (0.0%) |
| Community & Social Service | 0 (0.0%) | 7 (100.0%) |
| Education, Arts & Media | 0 (0.0%) | 0 (0.0%) |
| Legal Services & Support | 0 (0.0%) | 0 (0.0%) |
| Education Instruction & Library | 0 (0.0%) | 7 (100.0%) |
| Arts, Media & Entertainment | 0 (0.0%) | 0 (0.0%) |
| Health Diagnosing & Treating | 5 (31.2%) | 11 (68.8%) |
| Health Technologists | 0 (0.0%) | 6 (100.0%) |
| Total (Category) | 5 (12.2%) | 36 (87.8%) |
| Total (Overall) | 92 (34.3%) | 176 (65.7%) |
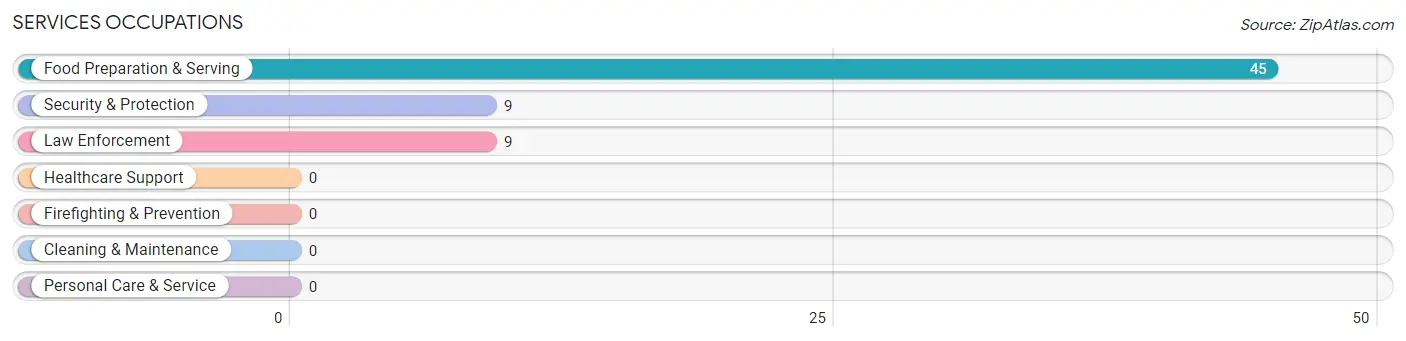
Services Occupations
The most common Services occupations in Hailesboro are Food Preparation & Serving (45 | 16.8%), Security & Protection (9 | 3.4%), and Law Enforcement (9 | 3.4%).
Services Occupations by Sex
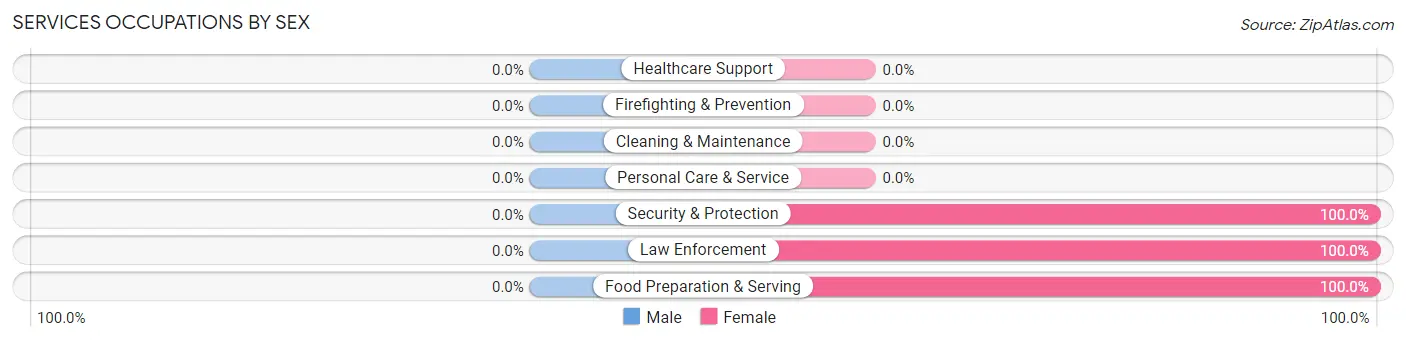
| Occupation | Male | Female |
| Healthcare Support | 0 (0.0%) | 0 (0.0%) |
| Security & Protection | 0 (0.0%) | 9 (100.0%) |
| Firefighting & Prevention | 0 (0.0%) | 0 (0.0%) |
| Law Enforcement | 0 (0.0%) | 9 (100.0%) |
| Food Preparation & Serving | 0 (0.0%) | 45 (100.0%) |
| Cleaning & Maintenance | 0 (0.0%) | 0 (0.0%) |
| Personal Care & Service | 0 (0.0%) | 0 (0.0%) |
| Total (Category) | 0 (0.0%) | 54 (100.0%) |
| Total (Overall) | 92 (34.3%) | 176 (65.7%) |
Sales and Office Occupations
The most common Sales and Office occupations in Hailesboro are Office & Administration (56 | 20.9%), and Sales & Related (4 | 1.5%).
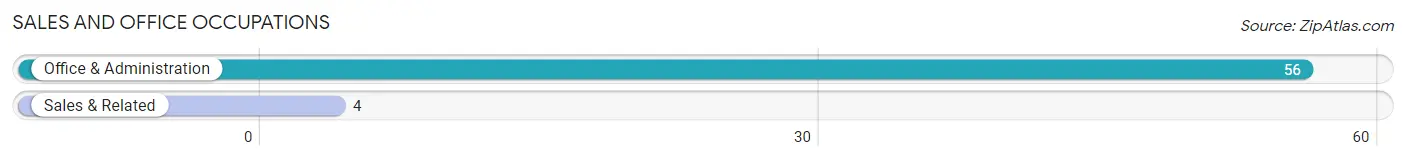
Sales and Office Occupations by Sex
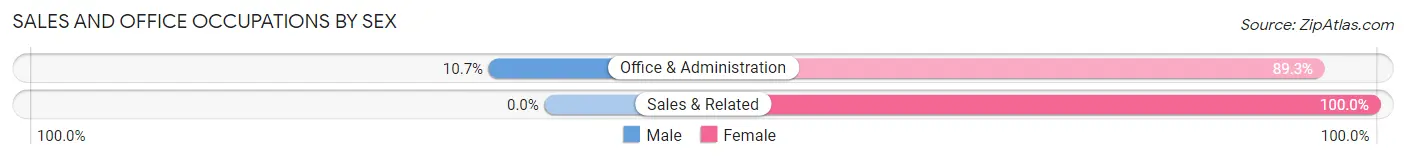
| Occupation | Male | Female |
| Sales & Related | 0 (0.0%) | 4 (100.0%) |
| Office & Administration | 6 (10.7%) | 50 (89.3%) |
| Total (Category) | 6 (10.0%) | 54 (90.0%) |
| Total (Overall) | 92 (34.3%) | 176 (65.7%) |
Natural Resources, Construction and Maintenance Occupations
The most common Natural Resources, Construction and Maintenance occupations in Hailesboro are , and Construction & Extraction (35 | 13.1%).
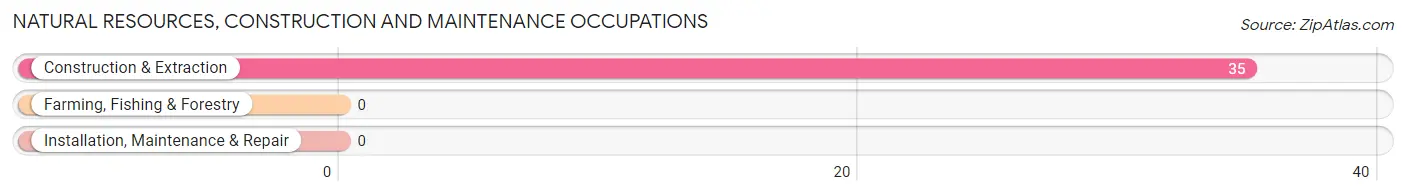
Natural Resources, Construction and Maintenance Occupations by Sex
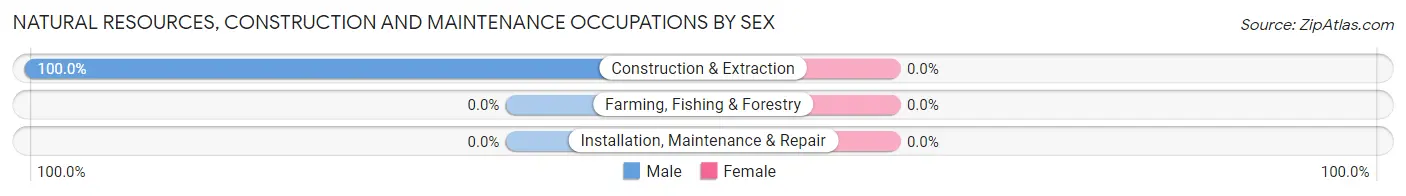
| Occupation | Male | Female |
| Farming, Fishing & Forestry | 0 (0.0%) | 0 (0.0%) |
| Construction & Extraction | 35 (100.0%) | 0 (0.0%) |
| Installation, Maintenance & Repair | 0 (0.0%) | 0 (0.0%) |
| Total (Category) | 35 (100.0%) | 0 (0.0%) |
| Total (Overall) | 92 (34.3%) | 176 (65.7%) |
Production, Transportation and Moving Occupations
The most common Production, Transportation and Moving occupations in Hailesboro are Material Moving (36 | 13.4%), Production (22 | 8.2%), and Transportation (20 | 7.5%).
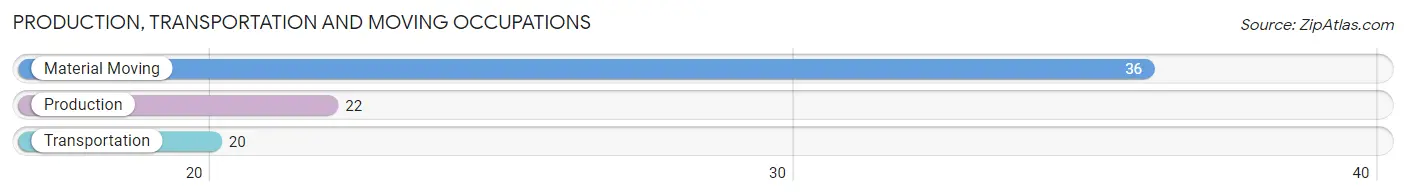
Production, Transportation and Moving Occupations by Sex
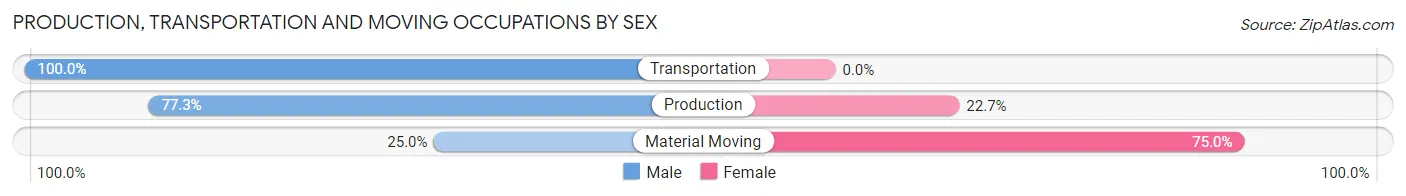
| Occupation | Male | Female |
| Production | 17 (77.3%) | 5 (22.7%) |
| Transportation | 20 (100.0%) | 0 (0.0%) |
| Material Moving | 9 (25.0%) | 27 (75.0%) |
| Total (Category) | 46 (59.0%) | 32 (41.0%) |
| Total (Overall) | 92 (34.3%) | 176 (65.7%) |
Employment Industries by Sex in Hailesboro
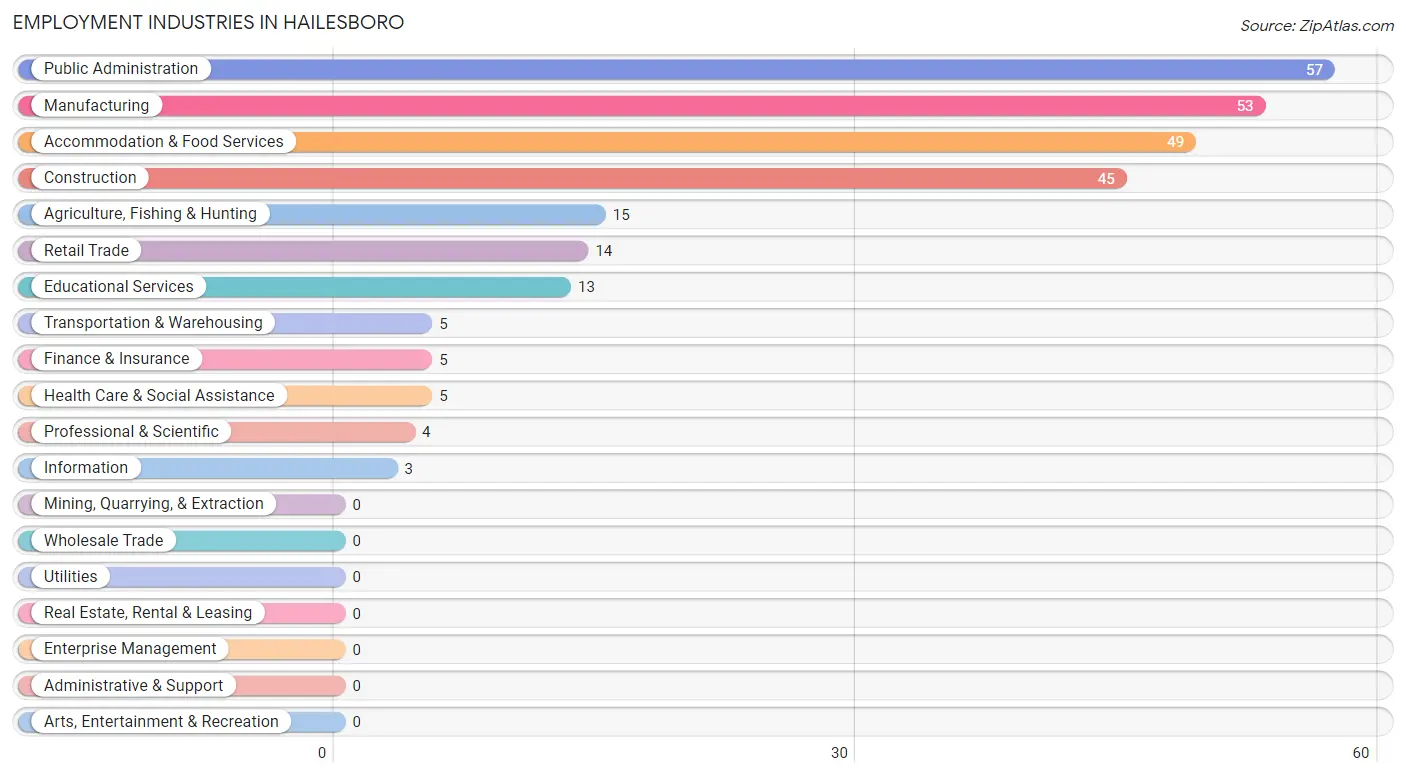
Employment Industries in Hailesboro
The major employment industries in Hailesboro include Public Administration (57 | 21.3%), Manufacturing (53 | 19.8%), Accommodation & Food Services (49 | 18.3%), Construction (45 | 16.8%), and Agriculture, Fishing & Hunting (15 | 5.6%).
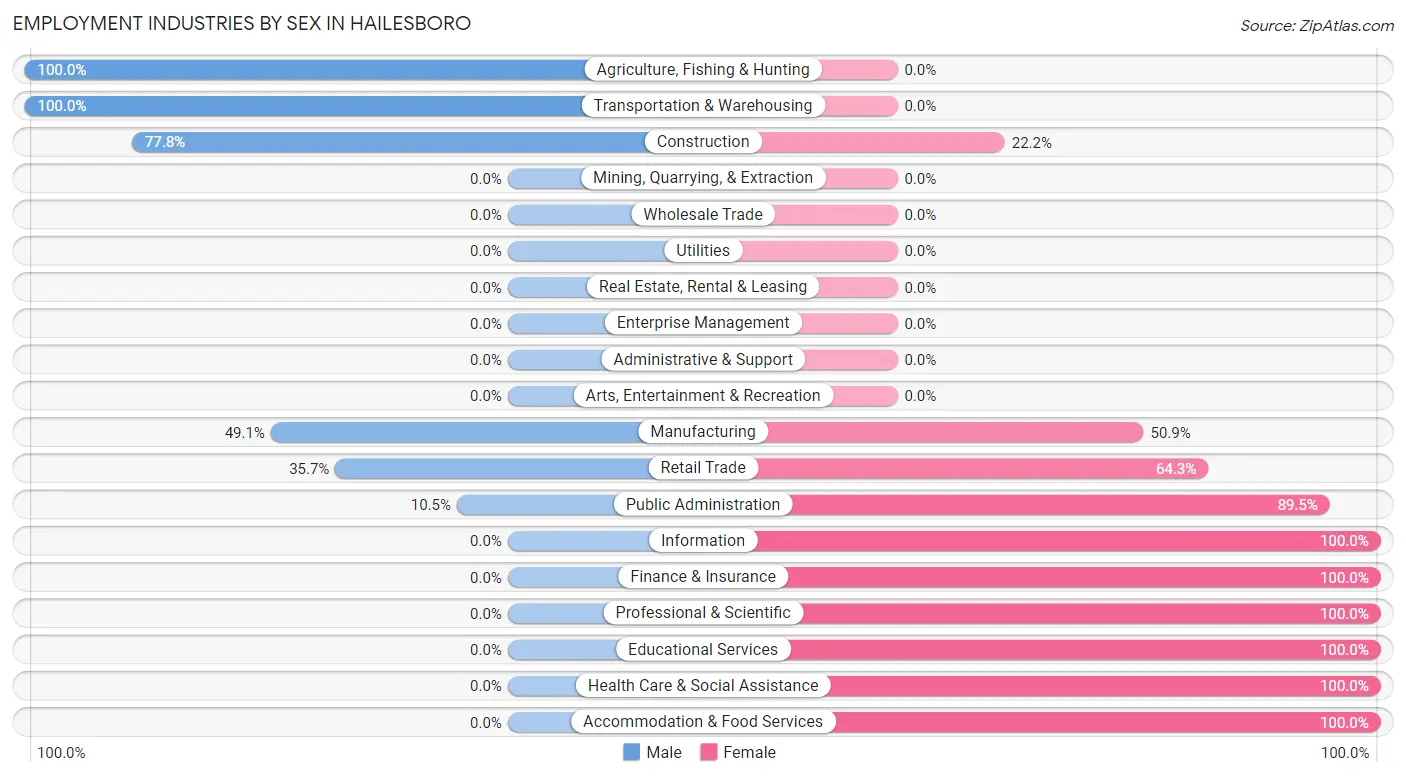
Employment Industries by Sex in Hailesboro
The Hailesboro industries that see more men than women are Agriculture, Fishing & Hunting (100.0%), Transportation & Warehousing (100.0%), and Construction (77.8%), whereas the industries that tend to have a higher number of women are Information (100.0%), Finance & Insurance (100.0%), and Professional & Scientific (100.0%).
| Industry | Male | Female |
| Agriculture, Fishing & Hunting | 15 (100.0%) | 0 (0.0%) |
| Mining, Quarrying, & Extraction | 0 (0.0%) | 0 (0.0%) |
| Construction | 35 (77.8%) | 10 (22.2%) |
| Manufacturing | 26 (49.1%) | 27 (50.9%) |
| Wholesale Trade | 0 (0.0%) | 0 (0.0%) |
| Retail Trade | 5 (35.7%) | 9 (64.3%) |
| Transportation & Warehousing | 5 (100.0%) | 0 (0.0%) |
| Utilities | 0 (0.0%) | 0 (0.0%) |
| Information | 0 (0.0%) | 3 (100.0%) |
| Finance & Insurance | 0 (0.0%) | 5 (100.0%) |
| Real Estate, Rental & Leasing | 0 (0.0%) | 0 (0.0%) |
| Professional & Scientific | 0 (0.0%) | 4 (100.0%) |
| Enterprise Management | 0 (0.0%) | 0 (0.0%) |
| Administrative & Support | 0 (0.0%) | 0 (0.0%) |
| Educational Services | 0 (0.0%) | 13 (100.0%) |
| Health Care & Social Assistance | 0 (0.0%) | 5 (100.0%) |
| Arts, Entertainment & Recreation | 0 (0.0%) | 0 (0.0%) |
| Accommodation & Food Services | 0 (0.0%) | 49 (100.0%) |
| Public Administration | 6 (10.5%) | 51 (89.5%) |
| Total | 92 (34.3%) | 176 (65.7%) |
Education in Hailesboro
School Enrollment in Hailesboro
The most common levels of schooling among the 219 students in Hailesboro are high school (94 | 42.9%), middle school (41 | 18.7%), and elementary school (28 | 12.8%).
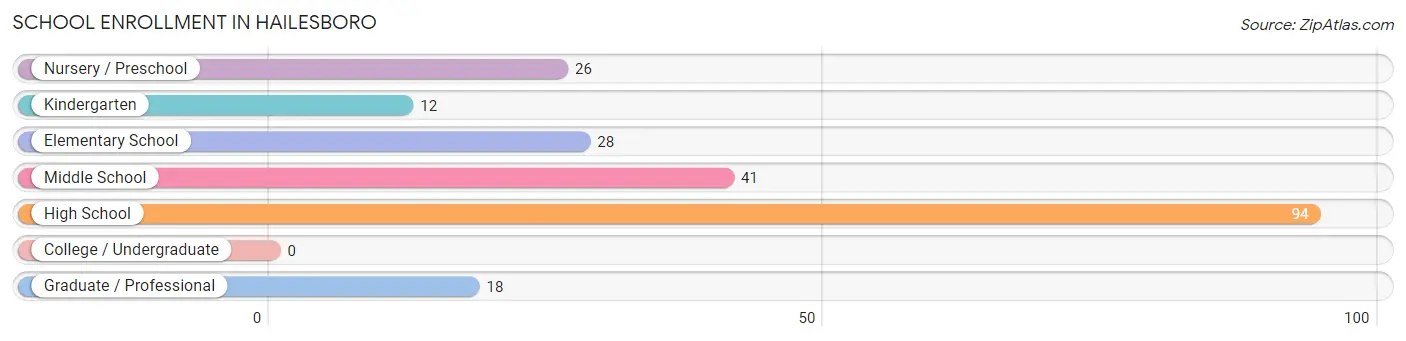
| School Level | # Students | % Students |
| Nursery / Preschool | 26 | 11.9% |
| Kindergarten | 12 | 5.5% |
| Elementary School | 28 | 12.8% |
| Middle School | 41 | 18.7% |
| High School | 94 | 42.9% |
| College / Undergraduate | 0 | 0.0% |
| Graduate / Professional | 18 | 8.2% |
| Total | 219 | 100.0% |
School Enrollment by Age by Funding Source in Hailesboro
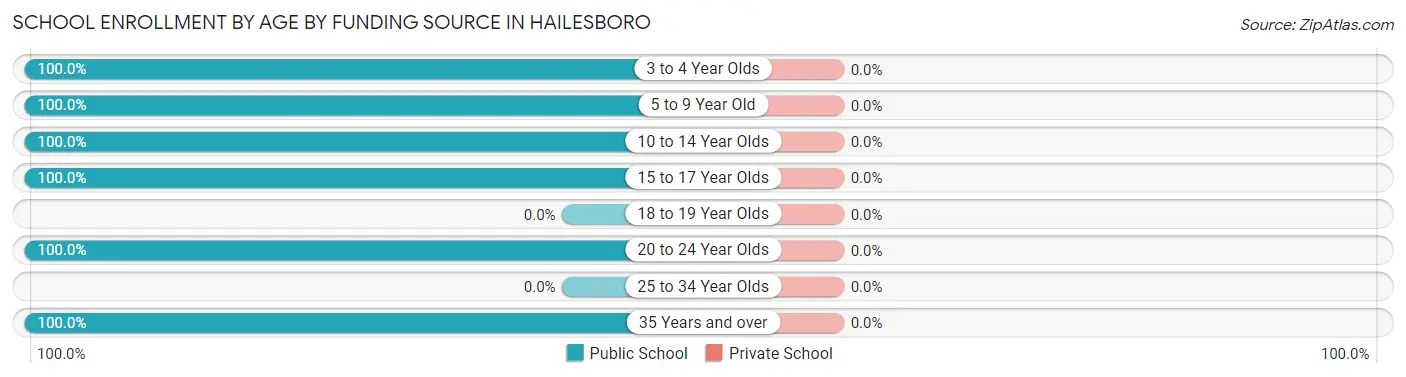
| Age Bracket | Public School | Private School |
| 3 to 4 Year Olds | 38 (100.0%) | 0 (0.0%) |
| 5 to 9 Year Old | 28 (100.0%) | 0 (0.0%) |
| 10 to 14 Year Olds | 46 (100.0%) | 0 (0.0%) |
| 15 to 17 Year Olds | 31 (100.0%) | 0 (0.0%) |
| 18 to 19 Year Olds | 0 (0.0%) | 0 (0.0%) |
| 20 to 24 Year Olds | 18 (100.0%) | 0 (0.0%) |
| 25 to 34 Year Olds | 0 (0.0%) | 0 (0.0%) |
| 35 Years and over | 58 (100.0%) | 0 (0.0%) |
| Total | 219 (100.0%) | 0 (0.0%) |
Educational Attainment by Field of Study in Hailesboro
Engineering (43 | 37.4%), education (25 | 21.7%), liberal arts & history (11 | 9.6%), social sciences (9 | 7.8%), and literature & languages (7 | 6.1%) are the most common fields of study among 115 individuals in Hailesboro who have obtained a bachelor's degree or higher.
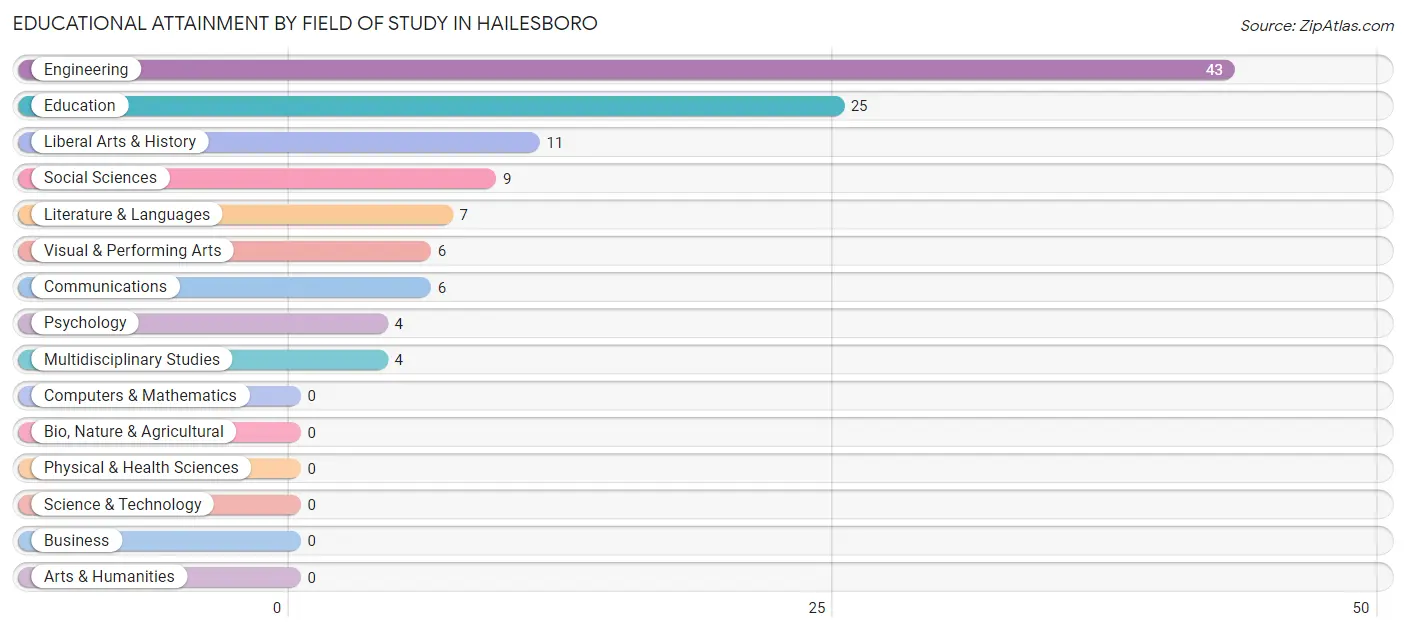
| Field of Study | # Graduates | % Graduates |
| Computers & Mathematics | 0 | 0.0% |
| Bio, Nature & Agricultural | 0 | 0.0% |
| Physical & Health Sciences | 0 | 0.0% |
| Psychology | 4 | 3.5% |
| Social Sciences | 9 | 7.8% |
| Engineering | 43 | 37.4% |
| Multidisciplinary Studies | 4 | 3.5% |
| Science & Technology | 0 | 0.0% |
| Business | 0 | 0.0% |
| Education | 25 | 21.7% |
| Literature & Languages | 7 | 6.1% |
| Liberal Arts & History | 11 | 9.6% |
| Visual & Performing Arts | 6 | 5.2% |
| Communications | 6 | 5.2% |
| Arts & Humanities | 0 | 0.0% |
| Total | 115 | 100.0% |
Transportation & Commute in Hailesboro
Vehicle Availability by Sex in Hailesboro
The most prevalent vehicle ownership categories in Hailesboro are males with 2 vehicles (46, accounting for 50.0%) and females with 2 vehicles (81, making up 26.1%).
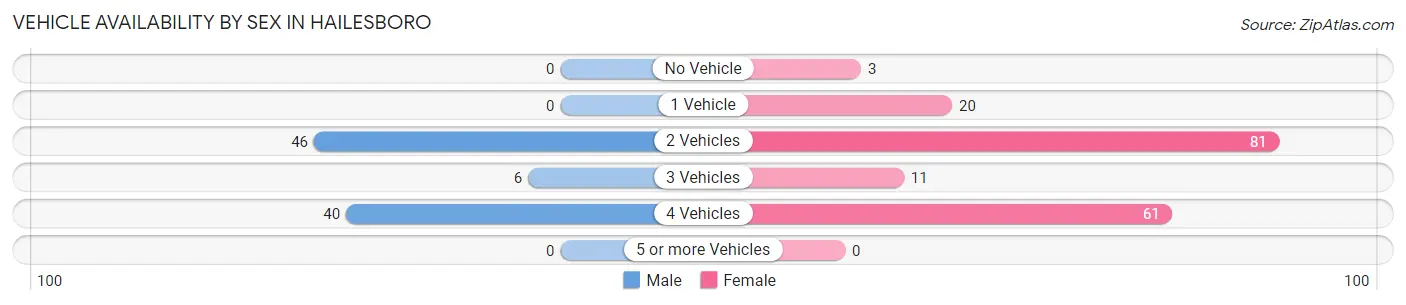
| Vehicles Available | Male | Female |
| No Vehicle | 0 (0.0%) | 3 (1.7%) |
| 1 Vehicle | 0 (0.0%) | 20 (11.4%) |
| 2 Vehicles | 46 (50.0%) | 81 (46.0%) |
| 3 Vehicles | 6 (6.5%) | 11 (6.2%) |
| 4 Vehicles | 40 (43.5%) | 61 (34.7%) |
| 5 or more Vehicles | 0 (0.0%) | 0 (0.0%) |
| Total | 92 (100.0%) | 176 (100.0%) |
Commute Time in Hailesboro
The most frequently occuring commute durations in Hailesboro are 45 to 59 minutes (67 commuters, 25.0%), 10 to 14 minutes (58 commuters, 21.6%), and 5 to 9 minutes (38 commuters, 14.2%).
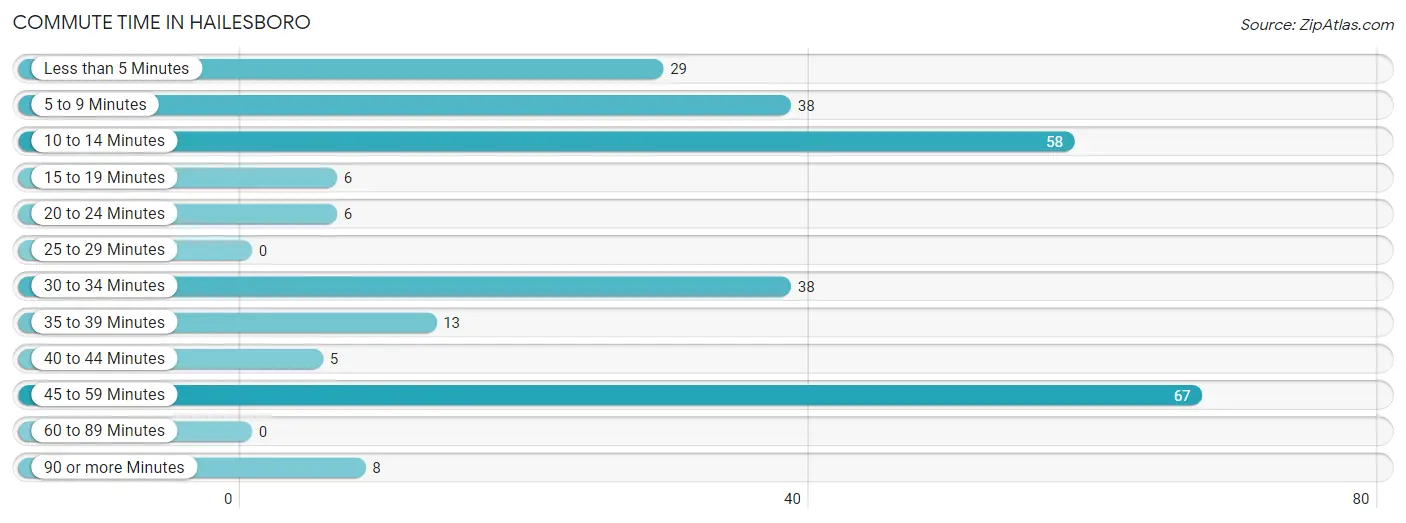
| Commute Time | # Commuters | % Commuters |
| Less than 5 Minutes | 29 | 10.8% |
| 5 to 9 Minutes | 38 | 14.2% |
| 10 to 14 Minutes | 58 | 21.6% |
| 15 to 19 Minutes | 6 | 2.2% |
| 20 to 24 Minutes | 6 | 2.2% |
| 25 to 29 Minutes | 0 | 0.0% |
| 30 to 34 Minutes | 38 | 14.2% |
| 35 to 39 Minutes | 13 | 4.9% |
| 40 to 44 Minutes | 5 | 1.9% |
| 45 to 59 Minutes | 67 | 25.0% |
| 60 to 89 Minutes | 0 | 0.0% |
| 90 or more Minutes | 8 | 3.0% |
Commute Time by Sex in Hailesboro
The most common commute times in Hailesboro are 45 to 59 minutes (32 commuters, 34.8%) for males and 10 to 14 minutes (58 commuters, 33.0%) for females.
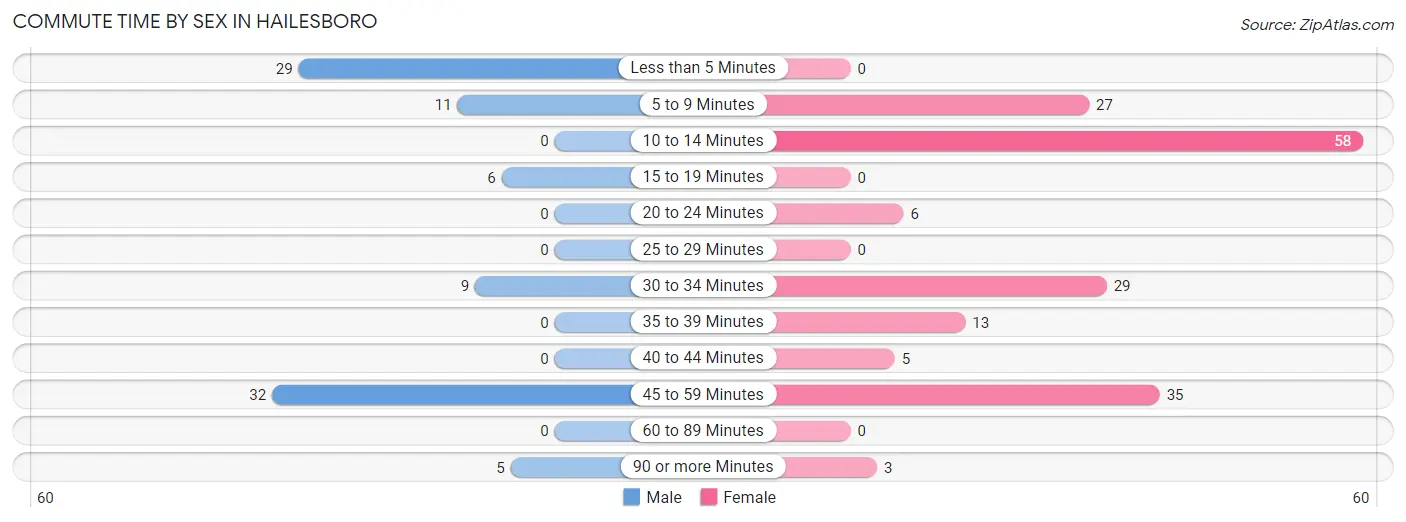
| Commute Time | Male | Female |
| Less than 5 Minutes | 29 (31.5%) | 0 (0.0%) |
| 5 to 9 Minutes | 11 (12.0%) | 27 (15.3%) |
| 10 to 14 Minutes | 0 (0.0%) | 58 (33.0%) |
| 15 to 19 Minutes | 6 (6.5%) | 0 (0.0%) |
| 20 to 24 Minutes | 0 (0.0%) | 6 (3.4%) |
| 25 to 29 Minutes | 0 (0.0%) | 0 (0.0%) |
| 30 to 34 Minutes | 9 (9.8%) | 29 (16.5%) |
| 35 to 39 Minutes | 0 (0.0%) | 13 (7.4%) |
| 40 to 44 Minutes | 0 (0.0%) | 5 (2.8%) |
| 45 to 59 Minutes | 32 (34.8%) | 35 (19.9%) |
| 60 to 89 Minutes | 0 (0.0%) | 0 (0.0%) |
| 90 or more Minutes | 5 (5.4%) | 3 (1.7%) |
Time of Departure to Work by Sex in Hailesboro
The most frequent times of departure to work in Hailesboro are 6:00 AM to 6:29 AM (44, 47.8%) for males and 7:30 AM to 7:59 AM (49, 27.8%) for females.
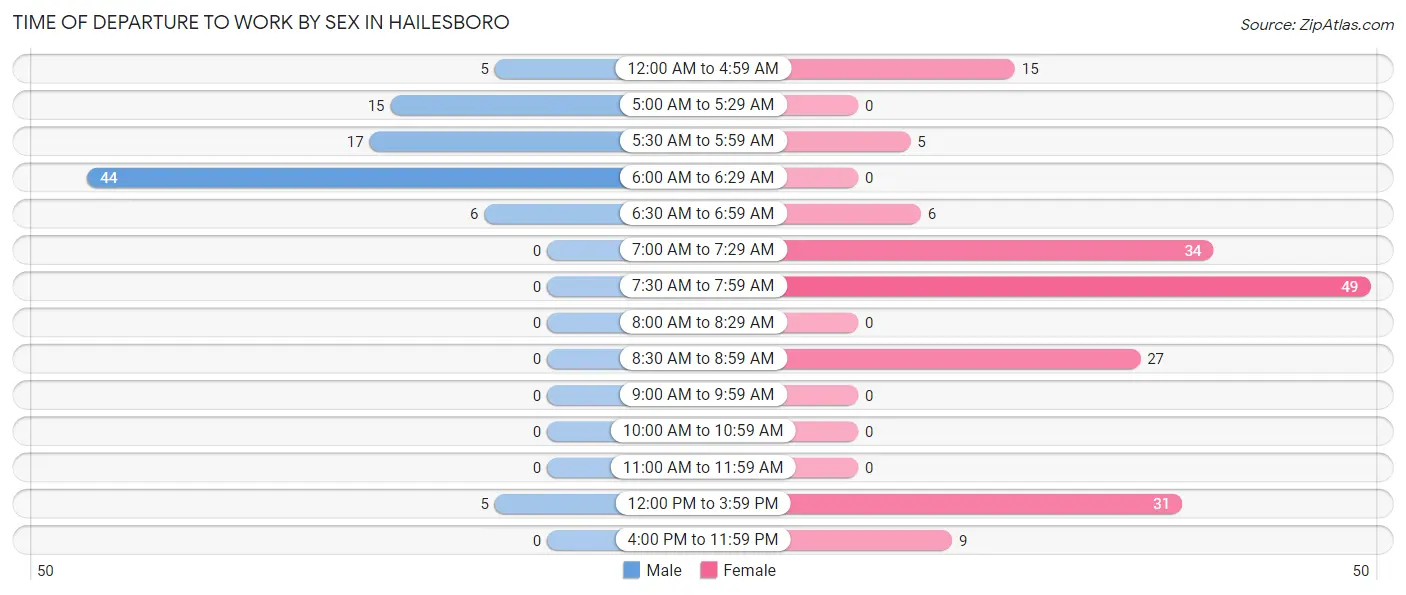
| Time of Departure | Male | Female |
| 12:00 AM to 4:59 AM | 5 (5.4%) | 15 (8.5%) |
| 5:00 AM to 5:29 AM | 15 (16.3%) | 0 (0.0%) |
| 5:30 AM to 5:59 AM | 17 (18.5%) | 5 (2.8%) |
| 6:00 AM to 6:29 AM | 44 (47.8%) | 0 (0.0%) |
| 6:30 AM to 6:59 AM | 6 (6.5%) | 6 (3.4%) |
| 7:00 AM to 7:29 AM | 0 (0.0%) | 34 (19.3%) |
| 7:30 AM to 7:59 AM | 0 (0.0%) | 49 (27.8%) |
| 8:00 AM to 8:29 AM | 0 (0.0%) | 0 (0.0%) |
| 8:30 AM to 8:59 AM | 0 (0.0%) | 27 (15.3%) |
| 9:00 AM to 9:59 AM | 0 (0.0%) | 0 (0.0%) |
| 10:00 AM to 10:59 AM | 0 (0.0%) | 0 (0.0%) |
| 11:00 AM to 11:59 AM | 0 (0.0%) | 0 (0.0%) |
| 12:00 PM to 3:59 PM | 5 (5.4%) | 31 (17.6%) |
| 4:00 PM to 11:59 PM | 0 (0.0%) | 9 (5.1%) |
| Total | 92 (100.0%) | 176 (100.0%) |
Housing Occupancy in Hailesboro
Occupancy by Ownership in Hailesboro
Of the total 302 dwellings in Hailesboro, owner-occupied units account for 211 (69.9%), while renter-occupied units make up 91 (30.1%).
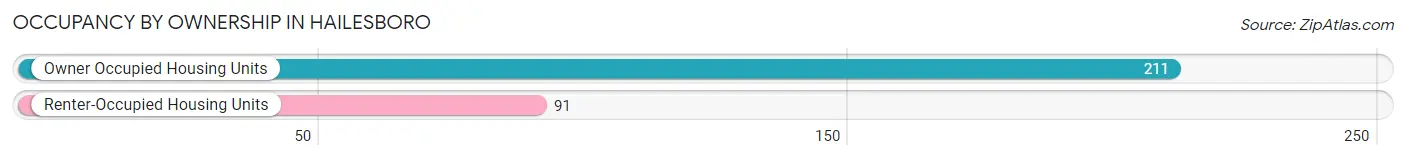
| Occupancy | # Housing Units | % Housing Units |
| Owner Occupied Housing Units | 211 | 69.9% |
| Renter-Occupied Housing Units | 91 | 30.1% |
| Total Occupied Housing Units | 302 | 100.0% |
Occupancy by Household Size in Hailesboro
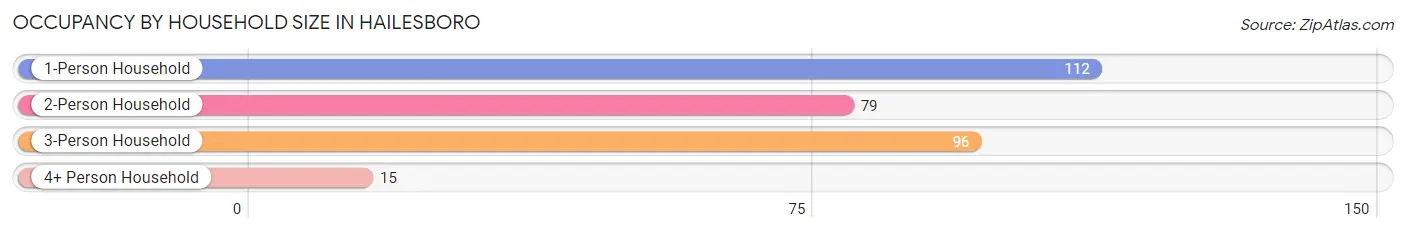
| Household Size | # Housing Units | % Housing Units |
| 1-Person Household | 112 | 37.1% |
| 2-Person Household | 79 | 26.2% |
| 3-Person Household | 96 | 31.8% |
| 4+ Person Household | 15 | 5.0% |
| Total Housing Units | 302 | 100.0% |
Occupancy by Ownership by Household Size in Hailesboro
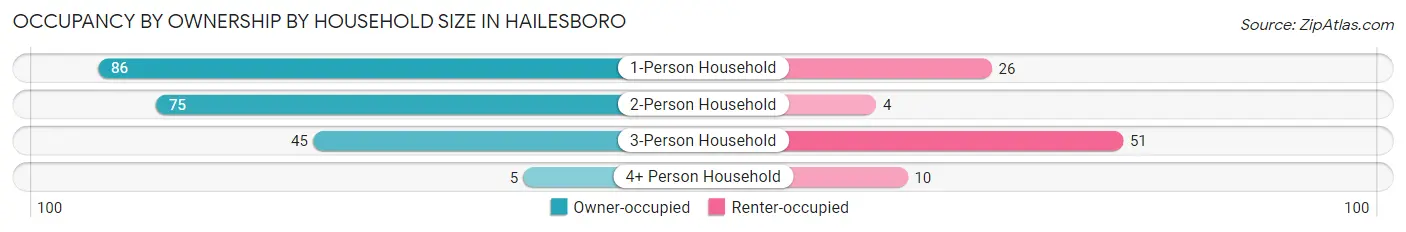
| Household Size | Owner-occupied | Renter-occupied |
| 1-Person Household | 86 (76.8%) | 26 (23.2%) |
| 2-Person Household | 75 (94.9%) | 4 (5.1%) |
| 3-Person Household | 45 (46.9%) | 51 (53.1%) |
| 4+ Person Household | 5 (33.3%) | 10 (66.7%) |
| Total Housing Units | 211 (69.9%) | 91 (30.1%) |
Occupancy by Educational Attainment in Hailesboro
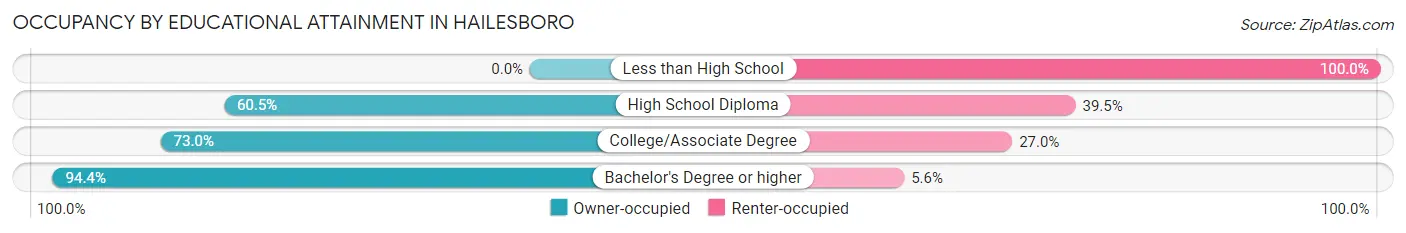
| Household Size | Owner-occupied | Renter-occupied |
| Less than High School | 0 (0.0%) | 12 (100.0%) |
| High School Diploma | 78 (60.5%) | 51 (39.5%) |
| College/Associate Degree | 65 (73.0%) | 24 (27.0%) |
| Bachelor's Degree or higher | 68 (94.4%) | 4 (5.6%) |
Occupancy by Age of Householder in Hailesboro
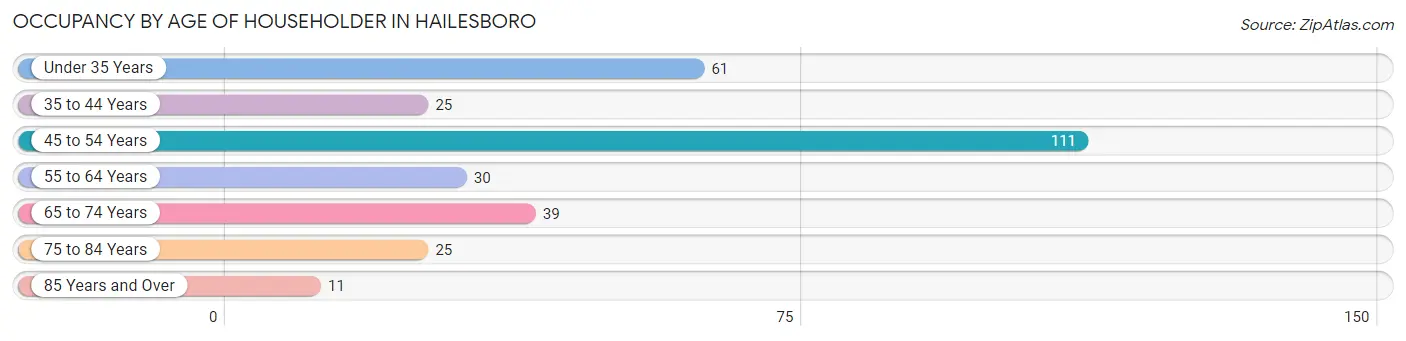
| Age Bracket | # Households | % Households |
| Under 35 Years | 61 | 20.2% |
| 35 to 44 Years | 25 | 8.3% |
| 45 to 54 Years | 111 | 36.7% |
| 55 to 64 Years | 30 | 9.9% |
| 65 to 74 Years | 39 | 12.9% |
| 75 to 84 Years | 25 | 8.3% |
| 85 Years and Over | 11 | 3.6% |
| Total | 302 | 100.0% |
Housing Finances in Hailesboro
Median Income by Occupancy in Hailesboro
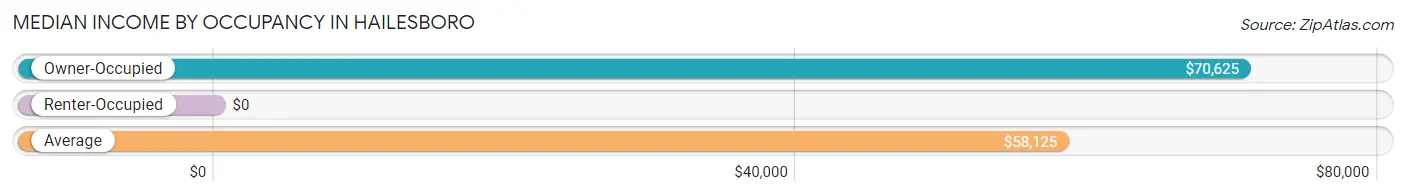
| Occupancy Type | # Households | Median Income |
| Owner-Occupied | 211 (69.9%) | $70,625 |
| Renter-Occupied | 91 (30.1%) | $0 |
| Average | 302 (100.0%) | $58,125 |
Occupancy by Householder Income Bracket in Hailesboro
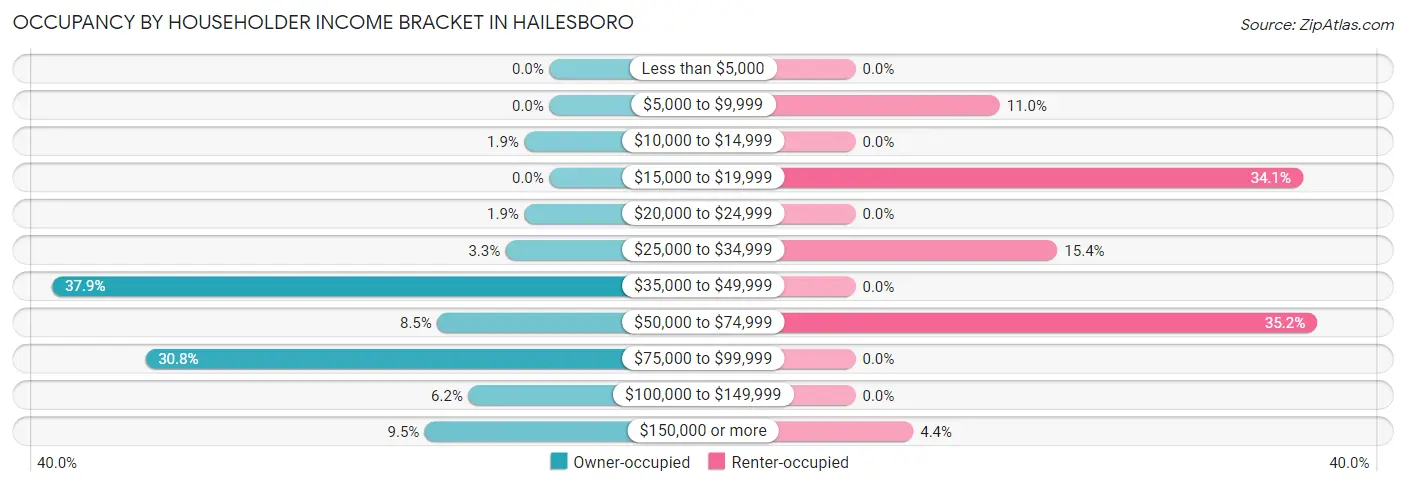
| Income Bracket | Owner-occupied | Renter-occupied |
| Less than $5,000 | 0 (0.0%) | 0 (0.0%) |
| $5,000 to $9,999 | 0 (0.0%) | 10 (11.0%) |
| $10,000 to $14,999 | 4 (1.9%) | 0 (0.0%) |
| $15,000 to $19,999 | 0 (0.0%) | 31 (34.1%) |
| $20,000 to $24,999 | 4 (1.9%) | 0 (0.0%) |
| $25,000 to $34,999 | 7 (3.3%) | 14 (15.4%) |
| $35,000 to $49,999 | 80 (37.9%) | 0 (0.0%) |
| $50,000 to $74,999 | 18 (8.5%) | 32 (35.2%) |
| $75,000 to $99,999 | 65 (30.8%) | 0 (0.0%) |
| $100,000 to $149,999 | 13 (6.2%) | 0 (0.0%) |
| $150,000 or more | 20 (9.5%) | 4 (4.4%) |
| Total | 211 (100.0%) | 91 (100.0%) |
Monthly Housing Cost Tiers in Hailesboro
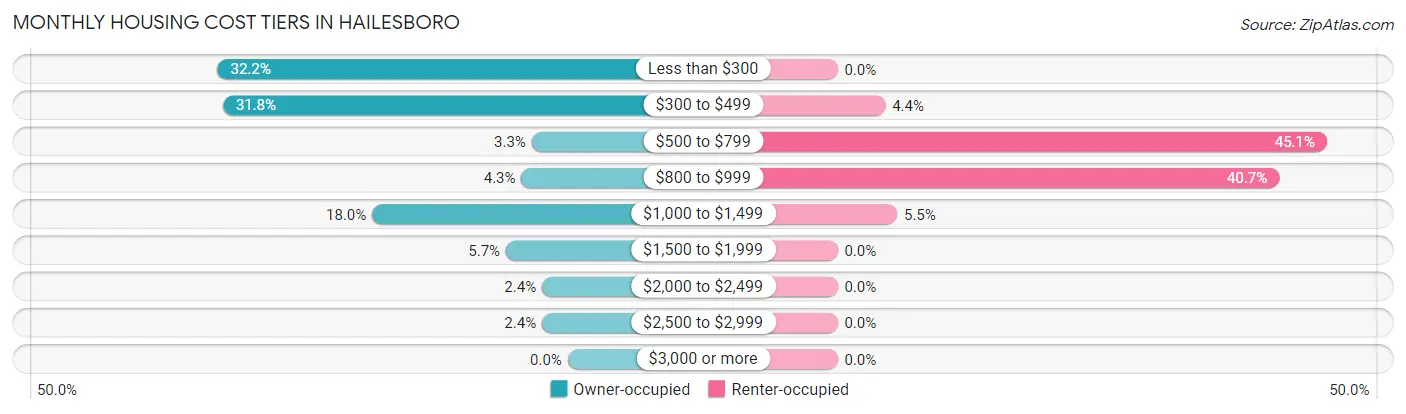
| Monthly Cost | Owner-occupied | Renter-occupied |
| Less than $300 | 68 (32.2%) | 0 (0.0%) |
| $300 to $499 | 67 (31.8%) | 4 (4.4%) |
| $500 to $799 | 7 (3.3%) | 41 (45.1%) |
| $800 to $999 | 9 (4.3%) | 37 (40.7%) |
| $1,000 to $1,499 | 38 (18.0%) | 5 (5.5%) |
| $1,500 to $1,999 | 12 (5.7%) | 0 (0.0%) |
| $2,000 to $2,499 | 5 (2.4%) | 0 (0.0%) |
| $2,500 to $2,999 | 5 (2.4%) | 0 (0.0%) |
| $3,000 or more | 0 (0.0%) | 0 (0.0%) |
| Total | 211 (100.0%) | 91 (100.0%) |
Physical Housing Characteristics in Hailesboro
Housing Structures in Hailesboro
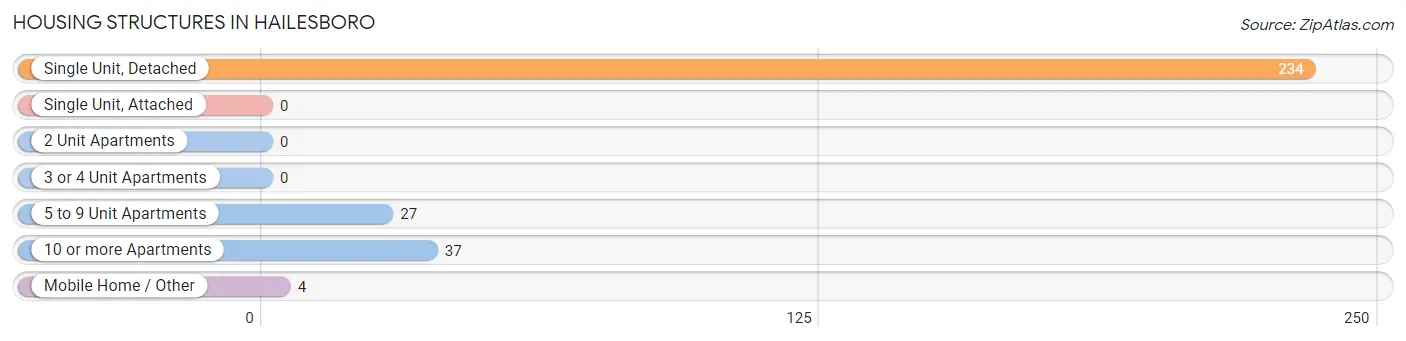
| Structure Type | # Housing Units | % Housing Units |
| Single Unit, Detached | 234 | 77.5% |
| Single Unit, Attached | 0 | 0.0% |
| 2 Unit Apartments | 0 | 0.0% |
| 3 or 4 Unit Apartments | 0 | 0.0% |
| 5 to 9 Unit Apartments | 27 | 8.9% |
| 10 or more Apartments | 37 | 12.2% |
| Mobile Home / Other | 4 | 1.3% |
| Total | 302 | 100.0% |
Housing Structures by Occupancy in Hailesboro
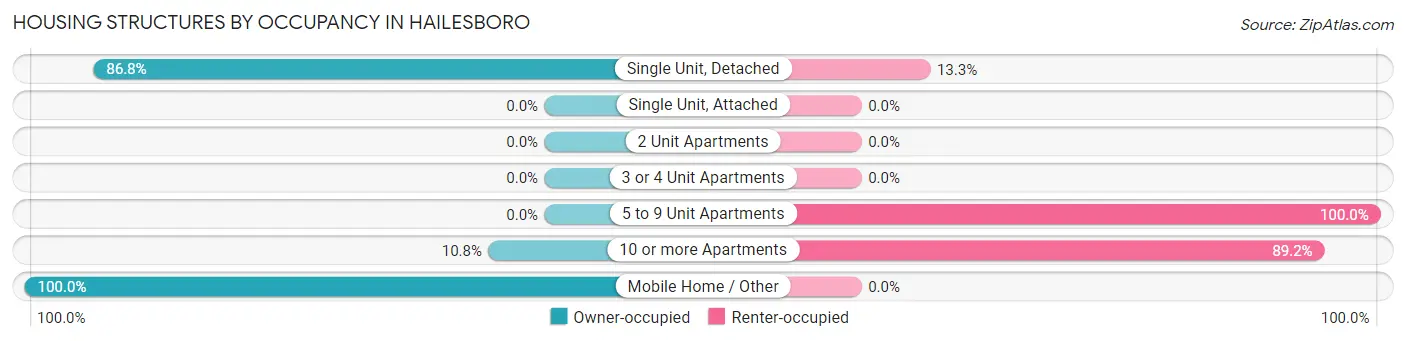
| Structure Type | Owner-occupied | Renter-occupied |
| Single Unit, Detached | 203 (86.8%) | 31 (13.3%) |
| Single Unit, Attached | 0 (0.0%) | 0 (0.0%) |
| 2 Unit Apartments | 0 (0.0%) | 0 (0.0%) |
| 3 or 4 Unit Apartments | 0 (0.0%) | 0 (0.0%) |
| 5 to 9 Unit Apartments | 0 (0.0%) | 27 (100.0%) |
| 10 or more Apartments | 4 (10.8%) | 33 (89.2%) |
| Mobile Home / Other | 4 (100.0%) | 0 (0.0%) |
| Total | 211 (69.9%) | 91 (30.1%) |
Housing Structures by Number of Rooms in Hailesboro
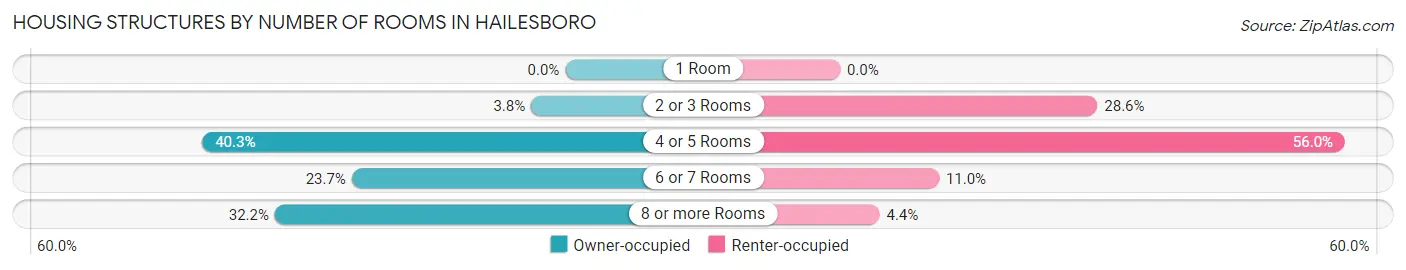
| Number of Rooms | Owner-occupied | Renter-occupied |
| 1 Room | 0 (0.0%) | 0 (0.0%) |
| 2 or 3 Rooms | 8 (3.8%) | 26 (28.6%) |
| 4 or 5 Rooms | 85 (40.3%) | 51 (56.0%) |
| 6 or 7 Rooms | 50 (23.7%) | 10 (11.0%) |
| 8 or more Rooms | 68 (32.2%) | 4 (4.4%) |
| Total | 211 (100.0%) | 91 (100.0%) |
Housing Structure by Heating Type in Hailesboro
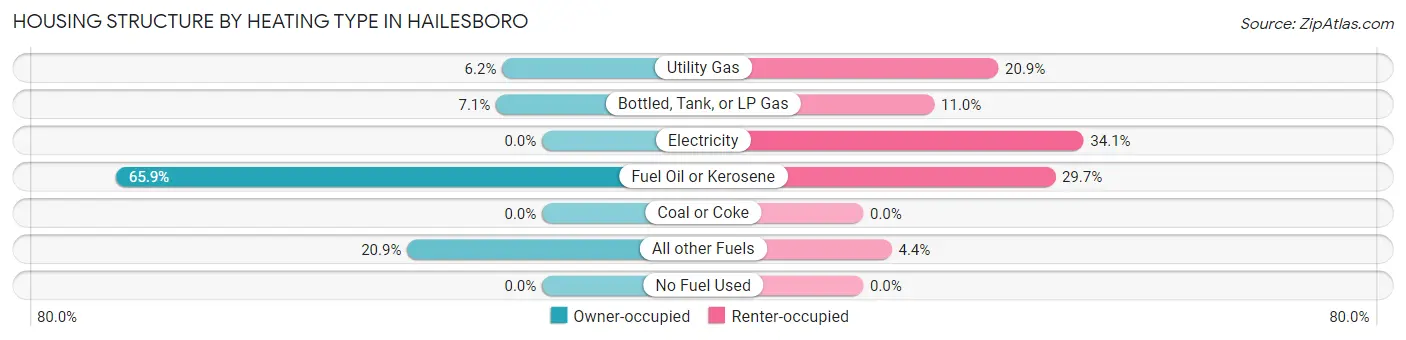
| Heating Type | Owner-occupied | Renter-occupied |
| Utility Gas | 13 (6.2%) | 19 (20.9%) |
| Bottled, Tank, or LP Gas | 15 (7.1%) | 10 (11.0%) |
| Electricity | 0 (0.0%) | 31 (34.1%) |
| Fuel Oil or Kerosene | 139 (65.9%) | 27 (29.7%) |
| Coal or Coke | 0 (0.0%) | 0 (0.0%) |
| All other Fuels | 44 (20.8%) | 4 (4.4%) |
| No Fuel Used | 0 (0.0%) | 0 (0.0%) |
| Total | 211 (100.0%) | 91 (100.0%) |
Household Vehicle Usage in Hailesboro
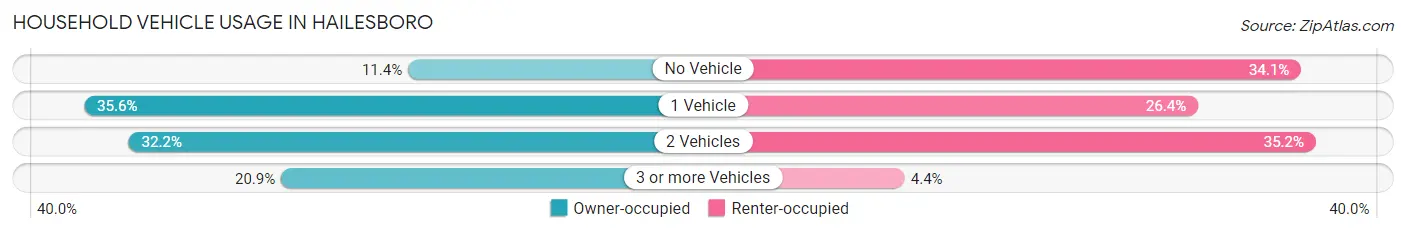
| Vehicles per Household | Owner-occupied | Renter-occupied |
| No Vehicle | 24 (11.4%) | 31 (34.1%) |
| 1 Vehicle | 75 (35.5%) | 24 (26.4%) |
| 2 Vehicles | 68 (32.2%) | 32 (35.2%) |
| 3 or more Vehicles | 44 (20.8%) | 4 (4.4%) |
| Total | 211 (100.0%) | 91 (100.0%) |
Real Estate & Mortgages in Hailesboro
Real Estate and Mortgage Overview in Hailesboro
| Characteristic | Without Mortgage | With Mortgage |
| Housing Units | 140 | 71 |
| Median Property Value | $90,600 | $197,900 |
| Median Household Income | $41,802 | $20 |
| Monthly Housing Costs | $354 | $0 |
| Real Estate Taxes | $1,446 | $6 |
Property Value by Mortgage Status in Hailesboro
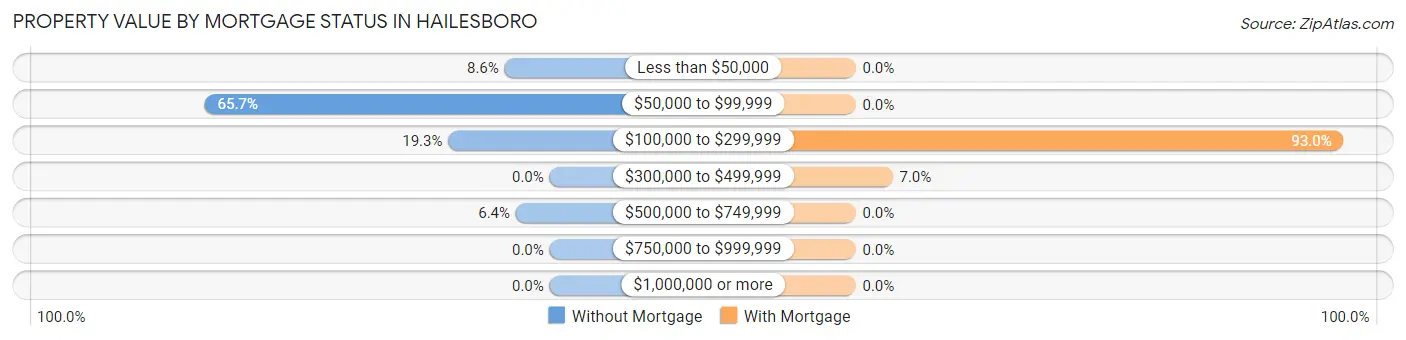
| Property Value | Without Mortgage | With Mortgage |
| Less than $50,000 | 12 (8.6%) | 0 (0.0%) |
| $50,000 to $99,999 | 92 (65.7%) | 0 (0.0%) |
| $100,000 to $299,999 | 27 (19.3%) | 66 (93.0%) |
| $300,000 to $499,999 | 0 (0.0%) | 5 (7.0%) |
| $500,000 to $749,999 | 9 (6.4%) | 0 (0.0%) |
| $750,000 to $999,999 | 0 (0.0%) | 0 (0.0%) |
| $1,000,000 or more | 0 (0.0%) | 0 (0.0%) |
| Total | 140 (100.0%) | 71 (100.0%) |
Household Income by Mortgage Status in Hailesboro
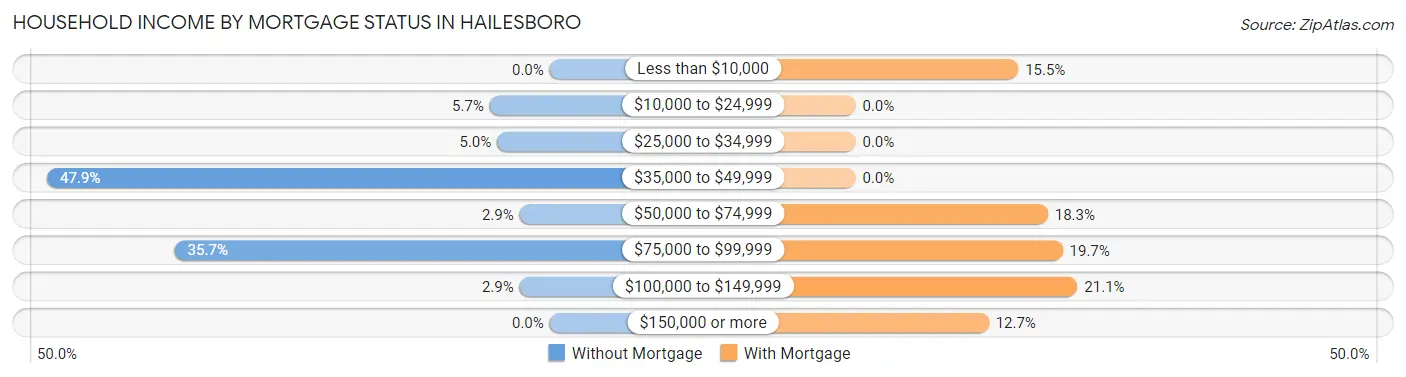
| Household Income | Without Mortgage | With Mortgage |
| Less than $10,000 | 0 (0.0%) | 11 (15.5%) |
| $10,000 to $24,999 | 8 (5.7%) | 0 (0.0%) |
| $25,000 to $34,999 | 7 (5.0%) | 0 (0.0%) |
| $35,000 to $49,999 | 67 (47.9%) | 0 (0.0%) |
| $50,000 to $74,999 | 4 (2.9%) | 13 (18.3%) |
| $75,000 to $99,999 | 50 (35.7%) | 14 (19.7%) |
| $100,000 to $149,999 | 4 (2.9%) | 15 (21.1%) |
| $150,000 or more | 0 (0.0%) | 9 (12.7%) |
| Total | 140 (100.0%) | 71 (100.0%) |
Property Value to Household Income Ratio in Hailesboro
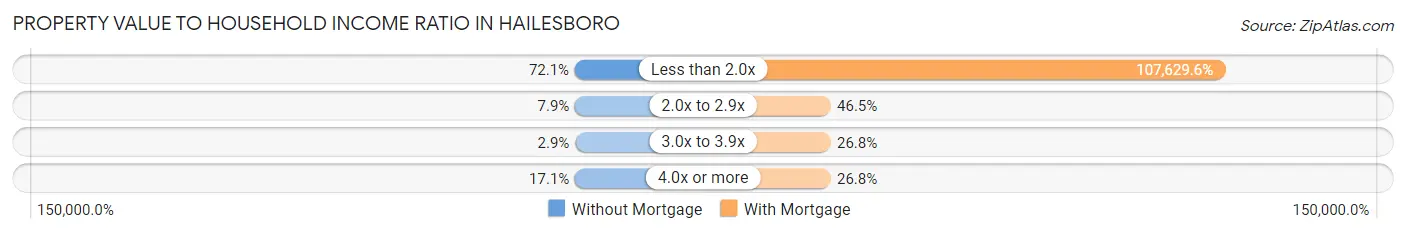
| Value-to-Income Ratio | Without Mortgage | With Mortgage |
| Less than 2.0x | 101 (72.1%) | 76,417 (107,629.6%) |
| 2.0x to 2.9x | 11 (7.9%) | 33 (46.5%) |
| 3.0x to 3.9x | 4 (2.9%) | 19 (26.8%) |
| 4.0x or more | 24 (17.1%) | 19 (26.8%) |
| Total | 140 (100.0%) | 71 (100.0%) |
Real Estate Taxes by Mortgage Status in Hailesboro
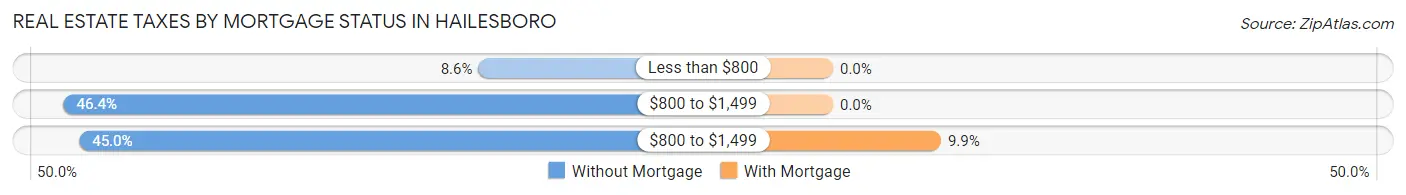
| Property Taxes | Without Mortgage | With Mortgage |
| Less than $800 | 12 (8.6%) | 0 (0.0%) |
| $800 to $1,499 | 65 (46.4%) | 0 (0.0%) |
| $800 to $1,499 | 63 (45.0%) | 7 (9.9%) |
| Total | 140 (100.0%) | 71 (100.0%) |
Health & Disability in Hailesboro
Health Insurance Coverage by Age in Hailesboro
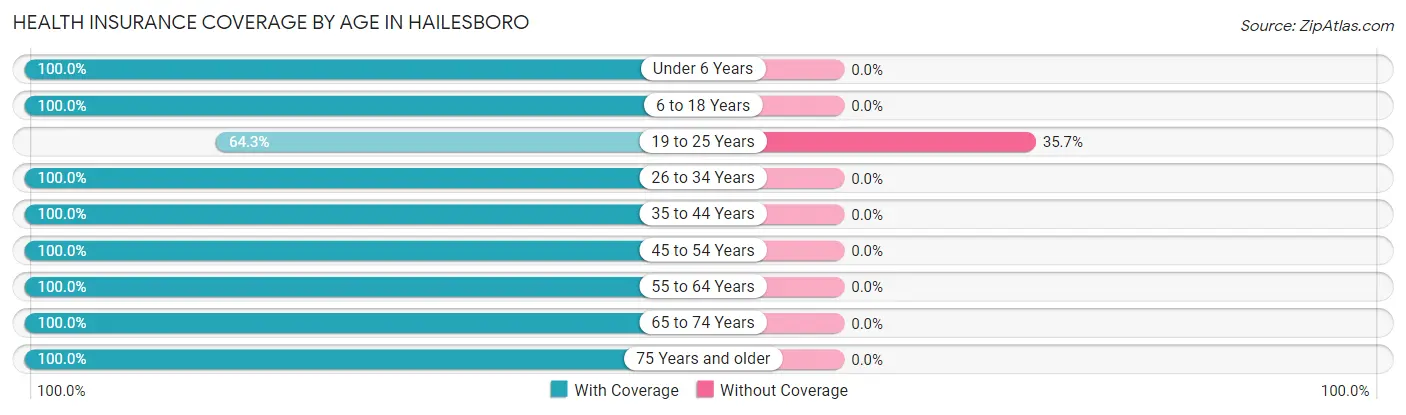
| Age Bracket | With Coverage | Without Coverage |
| Under 6 Years | 48 (100.0%) | 0 (0.0%) |
| 6 to 18 Years | 105 (100.0%) | 0 (0.0%) |
| 19 to 25 Years | 27 (64.3%) | 15 (35.7%) |
| 26 to 34 Years | 76 (100.0%) | 0 (0.0%) |
| 35 to 44 Years | 59 (100.0%) | 0 (0.0%) |
| 45 to 54 Years | 152 (100.0%) | 0 (0.0%) |
| 55 to 64 Years | 34 (100.0%) | 0 (0.0%) |
| 65 to 74 Years | 68 (100.0%) | 0 (0.0%) |
| 75 Years and older | 43 (100.0%) | 0 (0.0%) |
| Total | 612 (97.6%) | 15 (2.4%) |
Health Insurance Coverage by Citizenship Status in Hailesboro
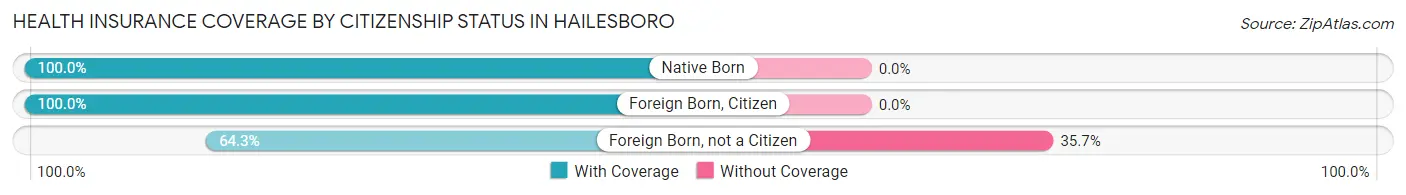
| Citizenship Status | With Coverage | Without Coverage |
| Native Born | 48 (100.0%) | 0 (0.0%) |
| Foreign Born, Citizen | 105 (100.0%) | 0 (0.0%) |
| Foreign Born, not a Citizen | 27 (64.3%) | 15 (35.7%) |
Health Insurance Coverage by Household Income in Hailesboro
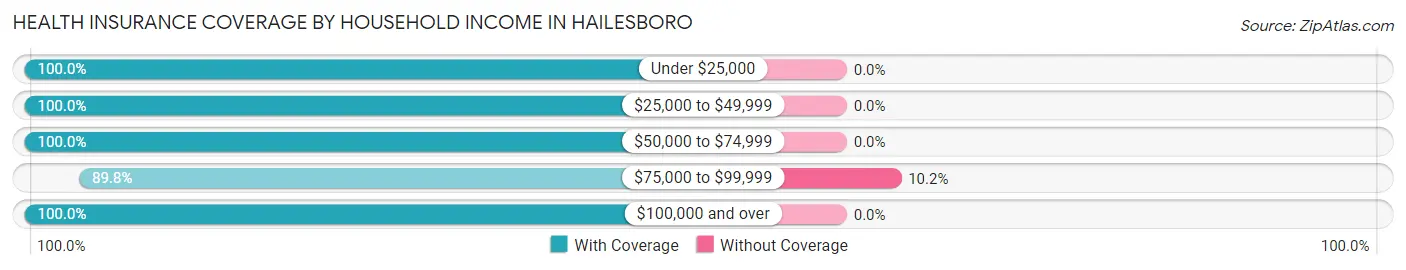
| Household Income | With Coverage | Without Coverage |
| Under $25,000 | 142 (100.0%) | 0 (0.0%) |
| $25,000 to $49,999 | 131 (100.0%) | 0 (0.0%) |
| $50,000 to $74,999 | 110 (100.0%) | 0 (0.0%) |
| $75,000 to $99,999 | 132 (89.8%) | 15 (10.2%) |
| $100,000 and over | 94 (100.0%) | 0 (0.0%) |
Public vs Private Health Insurance Coverage by Age in Hailesboro
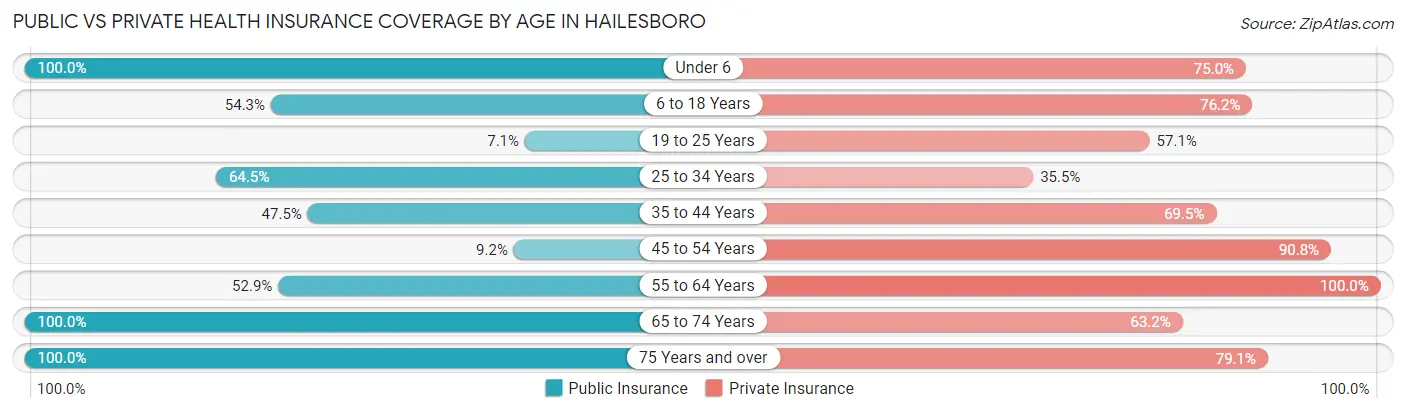
| Age Bracket | Public Insurance | Private Insurance |
| Under 6 | 48 (100.0%) | 36 (75.0%) |
| 6 to 18 Years | 57 (54.3%) | 80 (76.2%) |
| 19 to 25 Years | 3 (7.1%) | 24 (57.1%) |
| 25 to 34 Years | 49 (64.5%) | 27 (35.5%) |
| 35 to 44 Years | 28 (47.5%) | 41 (69.5%) |
| 45 to 54 Years | 14 (9.2%) | 138 (90.8%) |
| 55 to 64 Years | 18 (52.9%) | 34 (100.0%) |
| 65 to 74 Years | 68 (100.0%) | 43 (63.2%) |
| 75 Years and over | 43 (100.0%) | 34 (79.1%) |
| Total | 328 (52.3%) | 457 (72.9%) |
Disability Status by Sex by Age in Hailesboro
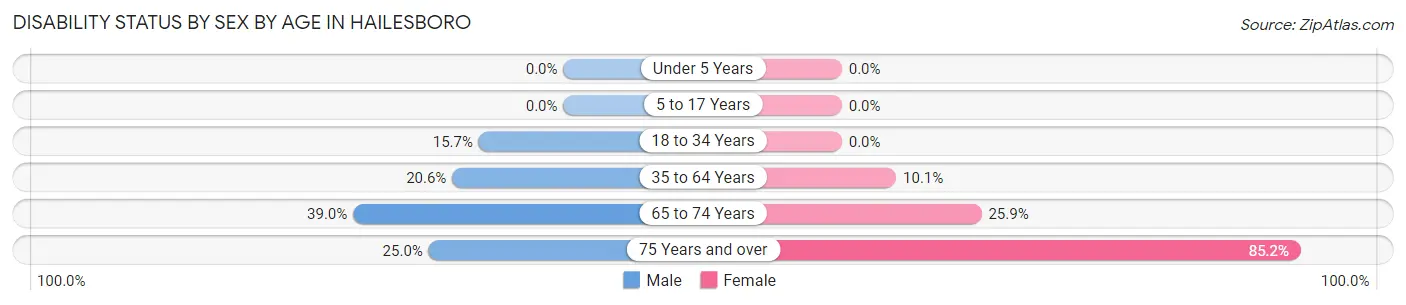
| Age Bracket | Male | Female |
| Under 5 Years | 0 (0.0%) | 0 (0.0%) |
| 5 to 17 Years | 0 (0.0%) | 0 (0.0%) |
| 18 to 34 Years | 8 (15.7%) | 0 (0.0%) |
| 35 to 64 Years | 26 (20.6%) | 12 (10.1%) |
| 65 to 74 Years | 16 (39.0%) | 7 (25.9%) |
| 75 Years and over | 4 (25.0%) | 23 (85.2%) |
Disability Class by Sex by Age in Hailesboro
Disability Class: Hearing Difficulty
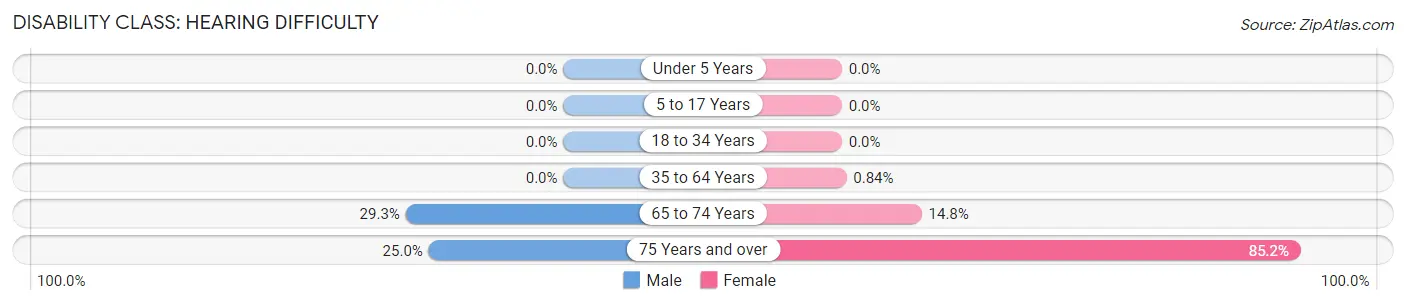
| Age Bracket | Male | Female |
| Under 5 Years | 0 (0.0%) | 0 (0.0%) |
| 5 to 17 Years | 0 (0.0%) | 0 (0.0%) |
| 18 to 34 Years | 0 (0.0%) | 0 (0.0%) |
| 35 to 64 Years | 0 (0.0%) | 1 (0.8%) |
| 65 to 74 Years | 12 (29.3%) | 4 (14.8%) |
| 75 Years and over | 4 (25.0%) | 23 (85.2%) |
Disability Class: Vision Difficulty
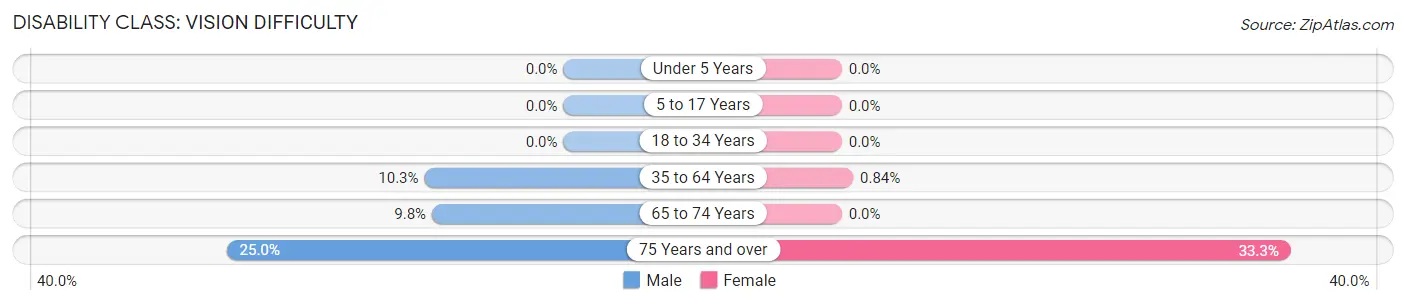
| Age Bracket | Male | Female |
| Under 5 Years | 0 (0.0%) | 0 (0.0%) |
| 5 to 17 Years | 0 (0.0%) | 0 (0.0%) |
| 18 to 34 Years | 0 (0.0%) | 0 (0.0%) |
| 35 to 64 Years | 13 (10.3%) | 1 (0.8%) |
| 65 to 74 Years | 4 (9.8%) | 0 (0.0%) |
| 75 Years and over | 4 (25.0%) | 9 (33.3%) |
Disability Class: Cognitive Difficulty
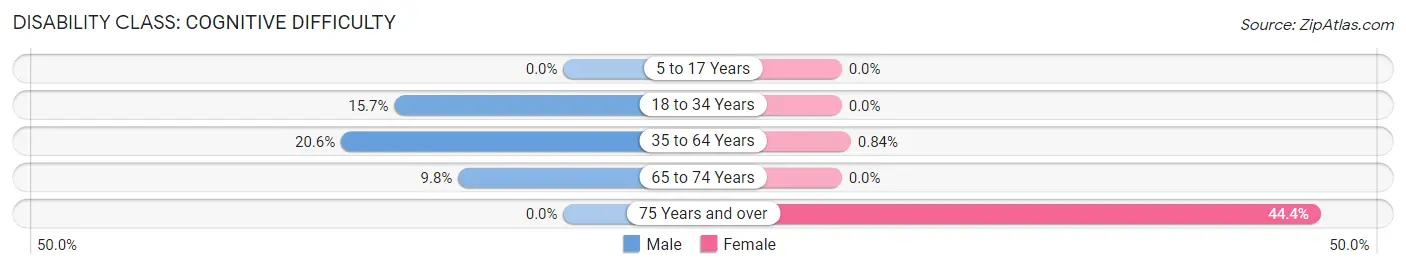
| Age Bracket | Male | Female |
| 5 to 17 Years | 0 (0.0%) | 0 (0.0%) |
| 18 to 34 Years | 8 (15.7%) | 0 (0.0%) |
| 35 to 64 Years | 26 (20.6%) | 1 (0.8%) |
| 65 to 74 Years | 4 (9.8%) | 0 (0.0%) |
| 75 Years and over | 0 (0.0%) | 12 (44.4%) |
Disability Class: Ambulatory Difficulty
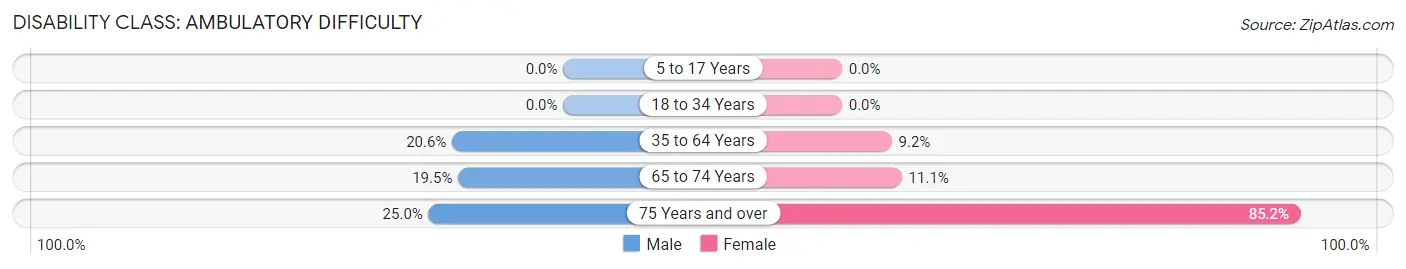
| Age Bracket | Male | Female |
| 5 to 17 Years | 0 (0.0%) | 0 (0.0%) |
| 18 to 34 Years | 0 (0.0%) | 0 (0.0%) |
| 35 to 64 Years | 26 (20.6%) | 11 (9.2%) |
| 65 to 74 Years | 8 (19.5%) | 3 (11.1%) |
| 75 Years and over | 4 (25.0%) | 23 (85.2%) |
Disability Class: Self-Care Difficulty
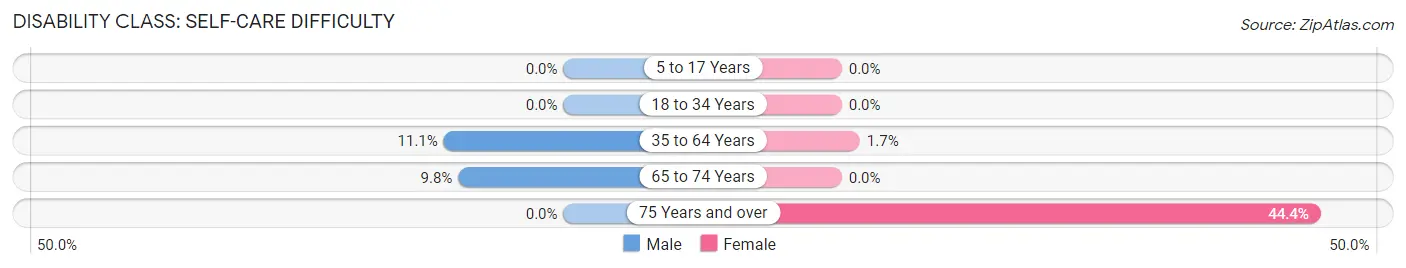
| Age Bracket | Male | Female |
| 5 to 17 Years | 0 (0.0%) | 0 (0.0%) |
| 18 to 34 Years | 0 (0.0%) | 0 (0.0%) |
| 35 to 64 Years | 14 (11.1%) | 2 (1.7%) |
| 65 to 74 Years | 4 (9.8%) | 0 (0.0%) |
| 75 Years and over | 0 (0.0%) | 12 (44.4%) |
Technology Access in Hailesboro
Computing Device Access in Hailesboro
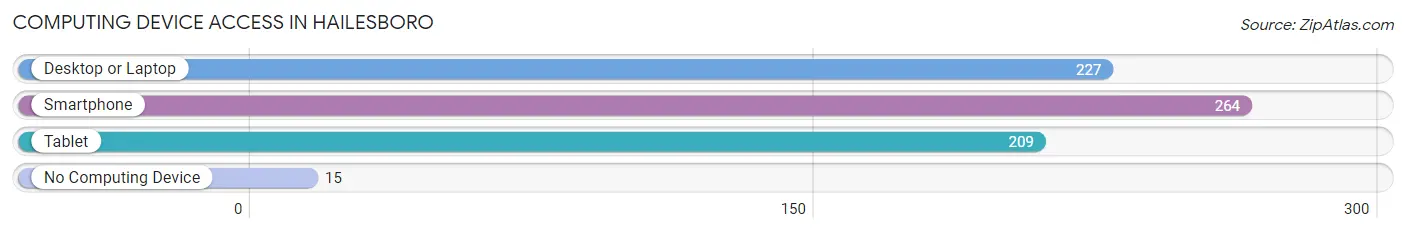
| Device Type | # Households | % Households |
| Desktop or Laptop | 227 | 75.2% |
| Smartphone | 264 | 87.4% |
| Tablet | 209 | 69.2% |
| No Computing Device | 15 | 5.0% |
| Total | 302 | 100.0% |
Internet Access in Hailesboro
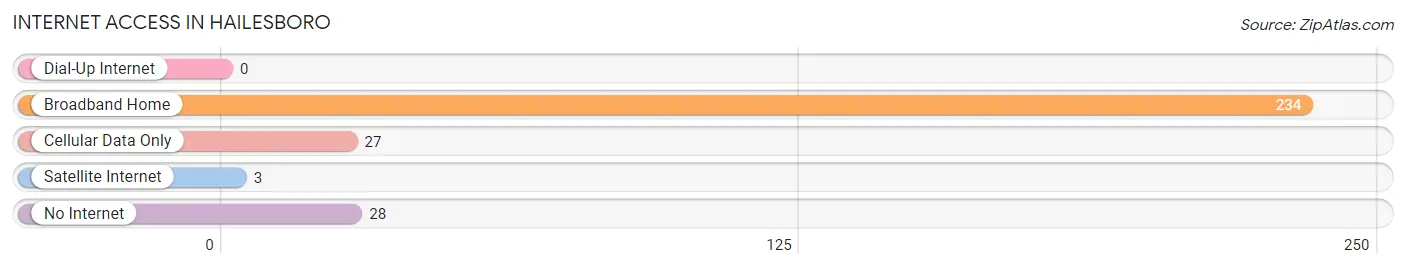
| Internet Type | # Households | % Households |
| Dial-Up Internet | 0 | 0.0% |
| Broadband Home | 234 | 77.5% |
| Cellular Data Only | 27 | 8.9% |
| Satellite Internet | 3 | 1.0% |
| No Internet | 28 | 9.3% |
| Total | 302 | 100.0% |
Hailesboro Summary
Hailesboro is a small town located in St. Lawrence County, New York, United States. The town is situated in the northern part of the county, and is bordered by the towns of Oswegatchie, Rossie, and Macomb. The population of Hailesboro was 1,093 at the 2010 census.
History
Hailesboro was first settled in 1802 by a group of settlers from Massachusetts. The town was named after the original settler, John Hails. The town was officially established in 1817, and the first town meeting was held in 1818.
In the early 19th century, Hailesboro was a thriving agricultural community. The town was home to several sawmills, gristmills, and a tannery. The town also had a post office, a blacksmith shop, and a general store.
Geography
Hailesboro is located in the northern part of St. Lawrence County, New York. The town is bordered by the towns of Oswegatchie, Rossie, and Macomb. The town is situated on the Oswegatchie River, which flows through the town.
The terrain of Hailesboro is mostly flat, with some rolling hills. The town is mostly forested, with some open fields and pastures. The highest point in the town is an unnamed hill, which has an elevation of 1,400 feet (427 m).
Economy
The economy of Hailesboro is largely based on agriculture. The town is home to several dairy farms, as well as some beef and sheep farms. The town also has some small businesses, such as a general store and a post office.
Demographics
As of the 2010 census, there were 1,093 people, 441 households, and 298 families residing in the town. The population density was 28.3 people per square mile (10.9/km2). There were 486 housing units at an average density of 12.5 per square mile (4.8/km2). The racial makeup of the town was 97.3% White, 0.2% African American, 0.2% Native American, 0.2% Asian, 0.2% from other races, and 1.9% from two or more races. Hispanic or Latino of any race were 0.7% of the population.
There were 441 households, out of which 28.2% had children under the age of 18 living with them, 54.2% were married couples living together, 8.6% had a female householder with no husband present, and 32.7% were non-families. 28.2% of all households were made up of individuals, and 14.3% had someone living alone who was 65 years of age or older. The average household size was 2.47 and the average family size was 3.02.
In the town, the population was spread out, with 24.3% under the age of 18, 6.2% from 18 to 24, 25.2% from 25 to 44, 27.2% from 45 to 64, and 17.1% who were 65 years of age or older. The median age was 41 years. For every 100 females, there were 97.2 males. For every 100 females age 18 and over, there were 94.2 males.
The median income for a household in the town was $37,500, and the median income for a family was $45,000. Males had a median income of $31,250 versus $22,500 for females. The per capita income for the town was $17,945. About 8.2% of families and 10.2% of the population were below the poverty line, including 14.3% of those under age 18 and 8.3% of those age 65 or over.
Common Questions
What is Per Capita Income in Hailesboro?
Per Capita income in Hailesboro is $31,504.
What is the Median Family Income in Hailesboro?
Median Family Income in Hailesboro is $68,250.
What is the Median Household income in Hailesboro?
Median Household Income in Hailesboro is $58,125.
What is Income or Wage Gap in Hailesboro?
Income or Wage Gap in Hailesboro is 42.7%.
Women in Hailesboro earn 57.3 cents for every dollar earned by a man.
What is Inequality or Gini Index in Hailesboro?
Inequality or Gini Index in Hailesboro is 0.37.
What is the Total Population of Hailesboro?
Total Population of Hailesboro is 627.
What is the Total Male Population of Hailesboro?
Total Male Population of Hailesboro is 289.
What is the Total Female Population of Hailesboro?
Total Female Population of Hailesboro is 338.
What is the Ratio of Males per 100 Females in Hailesboro?
There are 85.50 Males per 100 Females in Hailesboro.
What is the Ratio of Females per 100 Males in Hailesboro?
There are 116.96 Females per 100 Males in Hailesboro.
What is the Median Population Age in Hailesboro?
Median Population Age in Hailesboro is 42.4 Years.
What is the Average Family Size in Hailesboro
Average Family Size in Hailesboro is 2.6 People.
What is the Average Household Size in Hailesboro
Average Household Size in Hailesboro is 2.1 People.
How Large is the Labor Force in Hailesboro?
There are 287 People in the Labor Forcein in Hailesboro.
What is the Percentage of People in the Labor Force in Hailesboro?
56.8% of People are in the Labor Force in Hailesboro.
What is the Unemployment Rate in Hailesboro?
Unemployment Rate in Hailesboro is 6.6%.