Zip Codes with the Highest Percentage of Population Employed in Food Preparation & Serving in Troy, NY
RELATED REPORTS & OPTIONS
Food Preparation & Serving
Troy
Compare Zip Codes
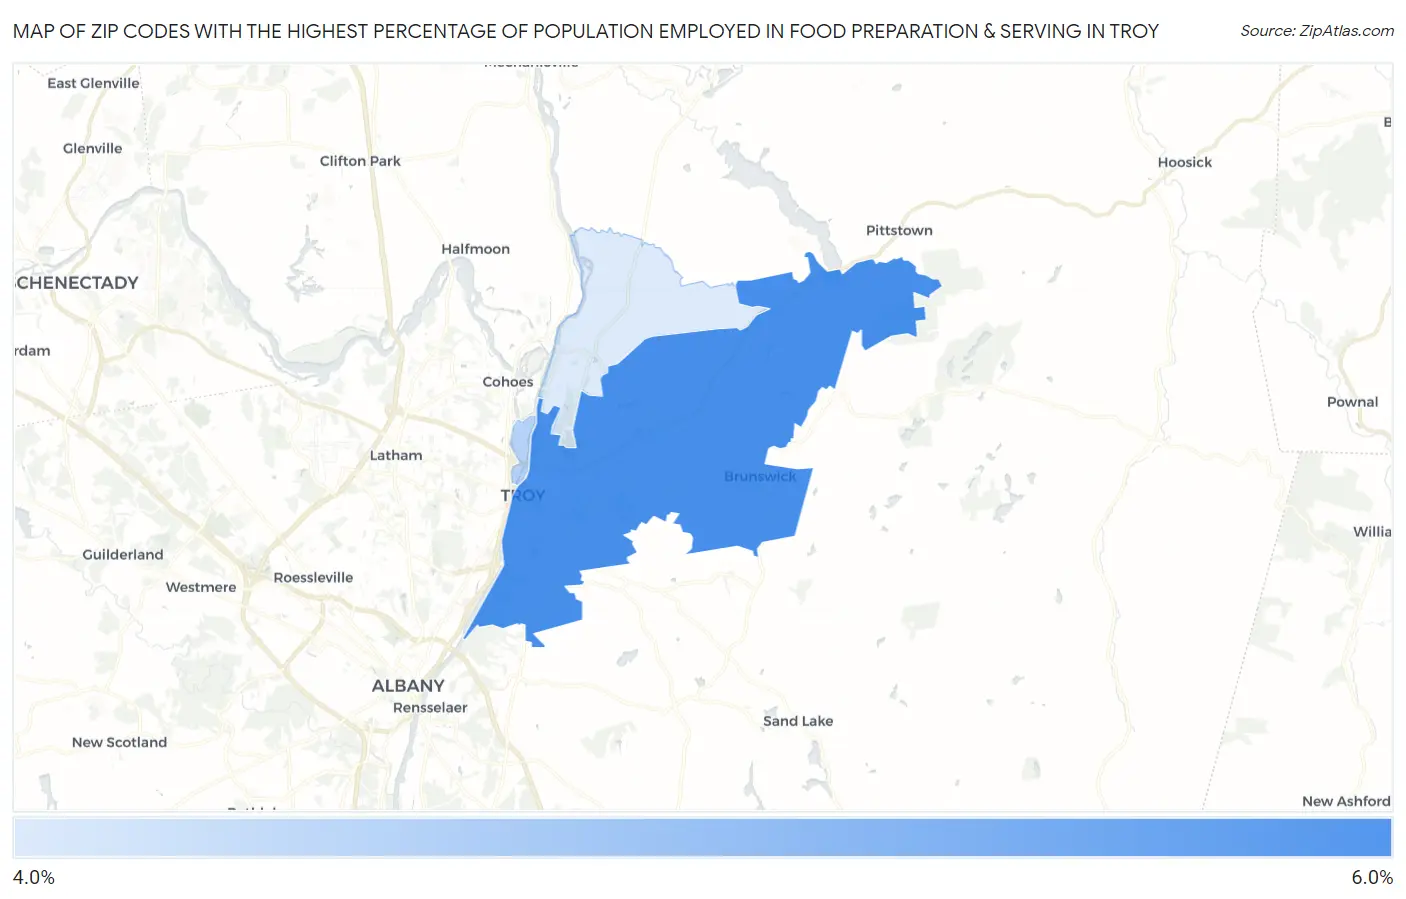
Map of Zip Codes with the Highest Percentage of Population Employed in Food Preparation & Serving in Troy
4.3%
5.3%
Zip Codes with the Highest Percentage of Population Employed in Food Preparation & Serving in Troy, NY
| Zip Code | % Employed | vs State | vs National | |
| 1. | 12180 | 5.3% | 4.8%(+0.458)#570 | 5.3%(-0.013)#11,863 |
| 2. | 12183 | 4.5% | 4.8%(-0.284)#734 | 5.3%(-0.755)#14,891 |
| 3. | 12182 | 4.3% | 4.8%(-0.551)#798 | 5.3%(-1.02)#16,042 |
1
Common Questions
What are the Top Zip Codes with the Highest Percentage of Population Employed in Food Preparation & Serving in Troy, NY?
Top Zip Codes with the Highest Percentage of Population Employed in Food Preparation & Serving in Troy, NY are:
What zip code has the Highest Percentage of Population Employed in Food Preparation & Serving in Troy, NY?
12180 has the Highest Percentage of Population Employed in Food Preparation & Serving in Troy, NY with 5.3%.
What is the Percentage of Population Employed in Food Preparation & Serving in Troy, NY?
Percentage of Population Employed in Food Preparation & Serving in Troy is 6.3%.
What is the Percentage of Population Employed in Food Preparation & Serving in New York?
Percentage of Population Employed in Food Preparation & Serving in New York is 4.8%.
What is the Percentage of Population Employed in Food Preparation & Serving in the United States?
Percentage of Population Employed in Food Preparation & Serving in the United States is 5.3%.