Cherry Valley, NY Map & Demographics
Cherry Valley Map
Cherry Valley Overview
$33,496
PER CAPITA INCOME
$112,833
AVG FAMILY INCOME
$81,042
AVG HOUSEHOLD INCOME
41.1%
WAGE / INCOME GAP [ % ]
58.9¢/ $1
WAGE / INCOME GAP [ $ ]
$4,782
FAMILY INCOME DEFICIT
0.40
INEQUALITY / GINI INDEX
516
TOTAL POPULATION
287
MALE POPULATION
229
FEMALE POPULATION
125.33
MALES / 100 FEMALES
79.79
FEMALES / 100 MALES
37.5
MEDIAN AGE
3.6
AVG FAMILY SIZE
3.2
AVG HOUSEHOLD SIZE
301
LABOR FORCE [ PEOPLE ]
67.3%
PERCENT IN LABOR FORCE
5.6%
UNEMPLOYMENT RATE
Cherry Valley Zip Codes
Cherry Valley Area Codes
Income in Cherry Valley
Income Overview in Cherry Valley
Per Capita Income in Cherry Valley is $33,496, while median incomes of families and households are $112,833 and $81,042 respectively.
| Characteristic | Number | Measure |
| Per Capita Income | 516 | $33,496 |
| Median Family Income | 118 | $112,833 |
| Mean Family Income | 118 | $109,248 |
| Median Household Income | 159 | $81,042 |
| Mean Household Income | 159 | $92,998 |
| Income Deficit | 118 | $4,782 |
| Wage / Income Gap (%) | 516 | 41.09% |
| Wage / Income Gap ($) | 516 | 58.91¢ per $1 |
| Gini / Inequality Index | 516 | 0.40 |
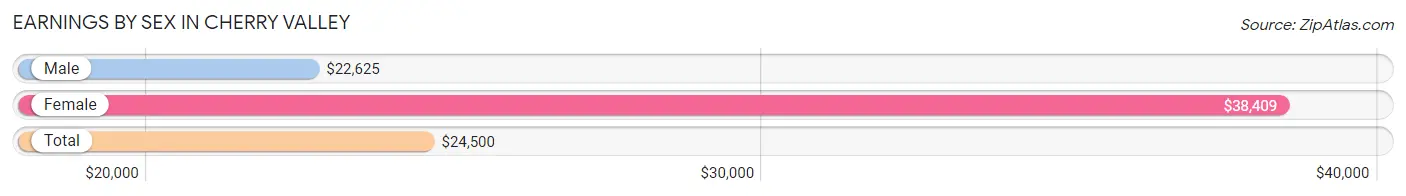
Earnings by Sex in Cherry Valley
Average Earnings in Cherry Valley are $24,500, $22,625 for men and $38,409 for women, a difference of 41.1%.
| Sex | Number | Average Earnings |
| Male | 198 (60.7%) | $22,625 |
| Female | 128 (39.3%) | $38,409 |
| Total | 326 (100.0%) | $24,500 |
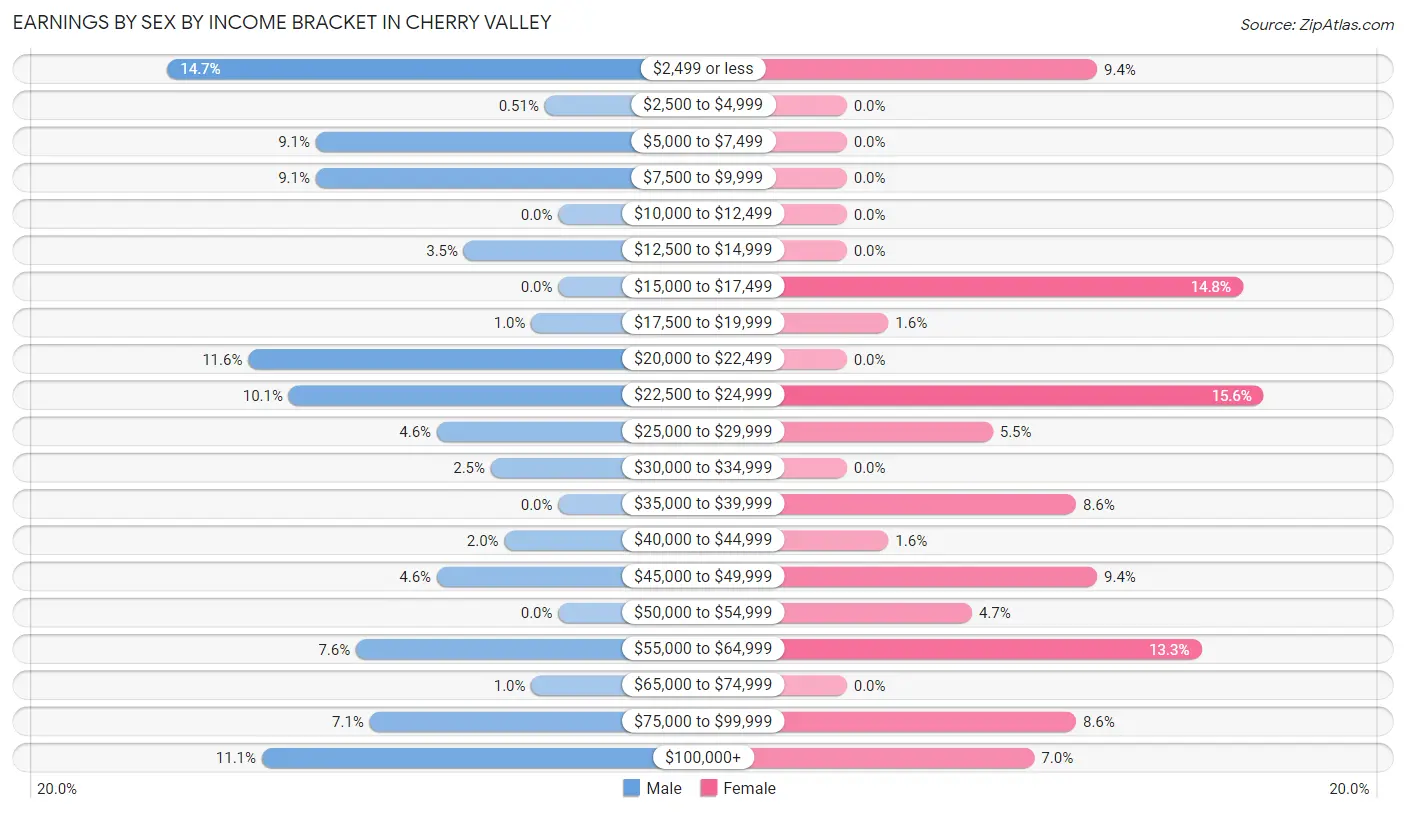
Earnings by Sex by Income Bracket in Cherry Valley
The most common earnings brackets in Cherry Valley are $2,499 or less for men (29 | 14.6%) and $22,500 to $24,999 for women (20 | 15.6%).
| Income | Male | Female |
| $2,499 or less | 29 (14.6%) | 12 (9.4%) |
| $2,500 to $4,999 | 1 (0.5%) | 0 (0.0%) |
| $5,000 to $7,499 | 18 (9.1%) | 0 (0.0%) |
| $7,500 to $9,999 | 18 (9.1%) | 0 (0.0%) |
| $10,000 to $12,499 | 0 (0.0%) | 0 (0.0%) |
| $12,500 to $14,999 | 7 (3.5%) | 0 (0.0%) |
| $15,000 to $17,499 | 0 (0.0%) | 19 (14.8%) |
| $17,500 to $19,999 | 2 (1.0%) | 2 (1.6%) |
| $20,000 to $22,499 | 23 (11.6%) | 0 (0.0%) |
| $22,500 to $24,999 | 20 (10.1%) | 20 (15.6%) |
| $25,000 to $29,999 | 9 (4.5%) | 7 (5.5%) |
| $30,000 to $34,999 | 5 (2.5%) | 0 (0.0%) |
| $35,000 to $39,999 | 0 (0.0%) | 11 (8.6%) |
| $40,000 to $44,999 | 4 (2.0%) | 2 (1.6%) |
| $45,000 to $49,999 | 9 (4.5%) | 12 (9.4%) |
| $50,000 to $54,999 | 0 (0.0%) | 6 (4.7%) |
| $55,000 to $64,999 | 15 (7.6%) | 17 (13.3%) |
| $65,000 to $74,999 | 2 (1.0%) | 0 (0.0%) |
| $75,000 to $99,999 | 14 (7.1%) | 11 (8.6%) |
| $100,000+ | 22 (11.1%) | 9 (7.0%) |
| Total | 198 (100.0%) | 128 (100.0%) |
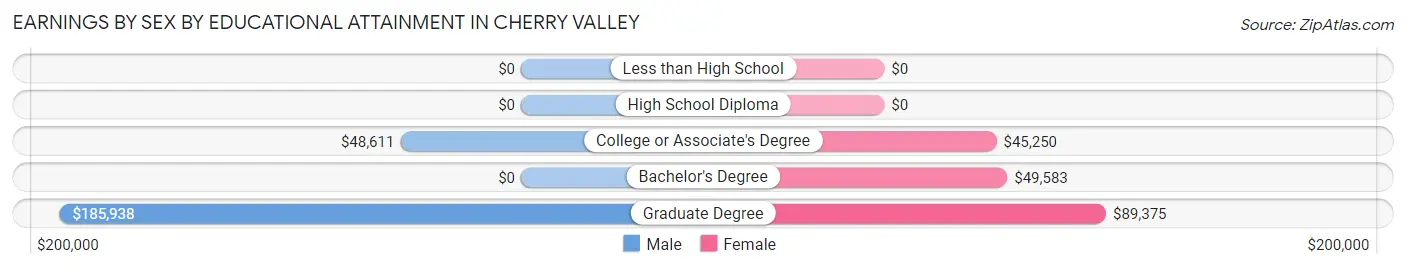
Earnings by Sex by Educational Attainment in Cherry Valley
Average earnings in Cherry Valley are $55,455 for men and $47,857 for women, a difference of 13.7%. Men with an educational attainment of graduate degree enjoy the highest average annual earnings of $185,938, while those with college or associate's degree education earn the least with $48,611. Women with an educational attainment of graduate degree earn the most with the average annual earnings of $89,375, while those with college or associate's degree education have the smallest earnings of $45,250.
| Educational Attainment | Male Income | Female Income |
| Less than High School | - | - |
| High School Diploma | - | - |
| College or Associate's Degree | $48,611 | $45,250 |
| Bachelor's Degree | - | - |
| Graduate Degree | $185,938 | $89,375 |
| Total | $55,455 | $47,857 |
Family Income in Cherry Valley
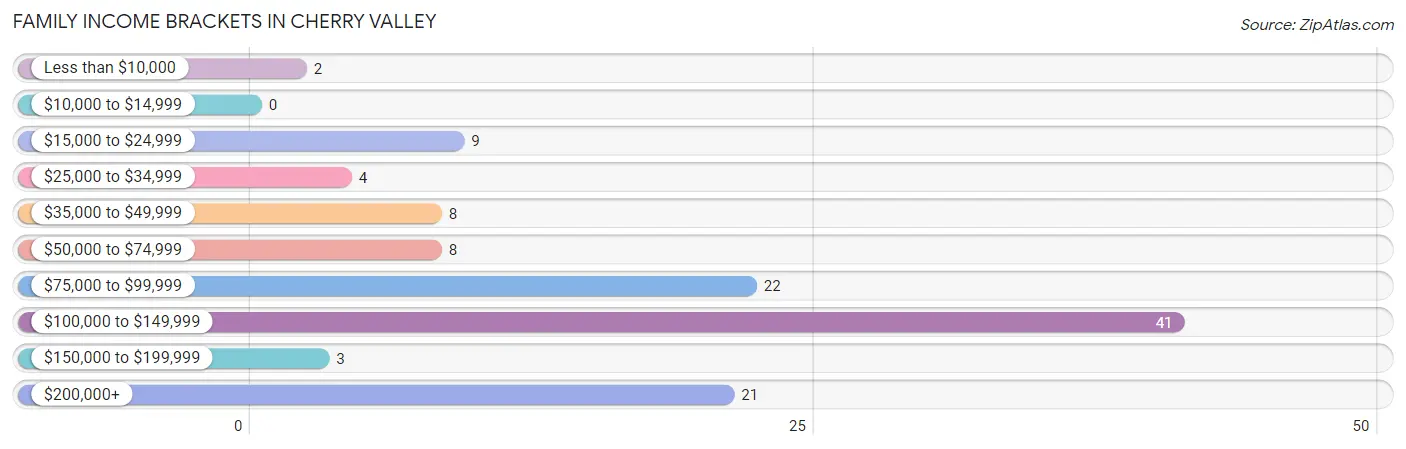
Family Income Brackets in Cherry Valley
According to the Cherry Valley family income data, there are 41 families falling into the $100,000 to $149,999 income range, which is the most common income bracket and makes up 34.7% of all families.
| Income Bracket | # Families | % Families |
| Less than $10,000 | 2 | 1.7% |
| $10,000 to $14,999 | 0 | 0.0% |
| $15,000 to $24,999 | 9 | 7.6% |
| $25,000 to $34,999 | 4 | 3.4% |
| $35,000 to $49,999 | 8 | 6.8% |
| $50,000 to $74,999 | 8 | 6.8% |
| $75,000 to $99,999 | 22 | 18.6% |
| $100,000 to $149,999 | 41 | 34.7% |
| $150,000 to $199,999 | 3 | 2.5% |
| $200,000+ | 21 | 17.8% |
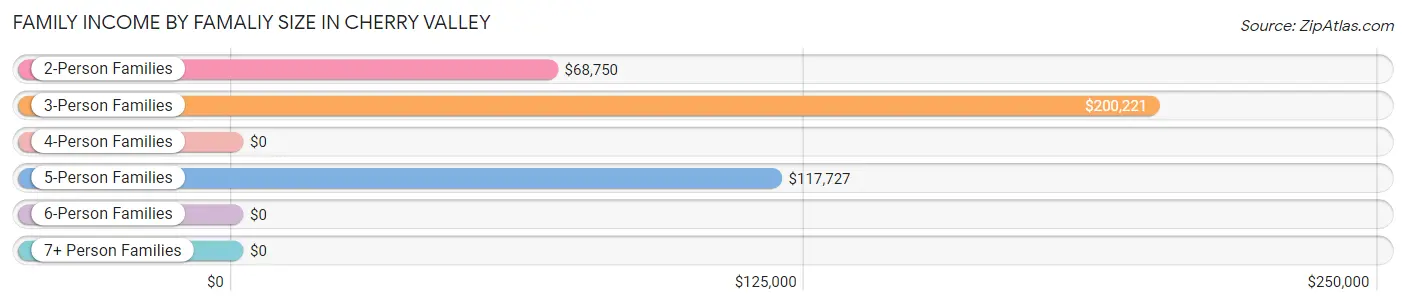
Family Income by Famaliy Size in Cherry Valley
3-person families (39 | 33.1%) account for the highest median family income in Cherry Valley with $200,221 per family, while 3-person families (39 | 33.1%) have the highest median income of $66,740 per family member.
| Income Bracket | # Families | Median Income |
| 2-Person Families | 51 (43.2%) | $68,750 |
| 3-Person Families | 39 (33.1%) | $200,221 |
| 4-Person Families | 4 (3.4%) | $0 |
| 5-Person Families | 24 (20.3%) | $117,727 |
| 6-Person Families | 0 (0.0%) | $0 |
| 7+ Person Families | 0 (0.0%) | $0 |
| Total | 118 (100.0%) | $112,833 |
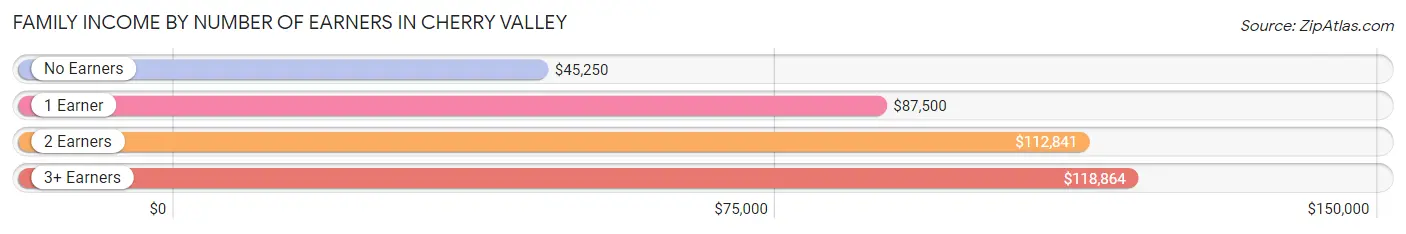
Family Income by Number of Earners in Cherry Valley
The median family income in Cherry Valley is $112,833, with families comprising 3+ earners (26) having the highest median family income of $118,864, while families with no earners (13) have the lowest median family income of $45,250, accounting for 22.0% and 11.0% of families, respectively.
| Number of Earners | # Families | Median Income |
| No Earners | 13 (11.0%) | $45,250 |
| 1 Earner | 50 (42.4%) | $87,500 |
| 2 Earners | 29 (24.6%) | $112,841 |
| 3+ Earners | 26 (22.0%) | $118,864 |
| Total | 118 (100.0%) | $112,833 |
Household Income in Cherry Valley
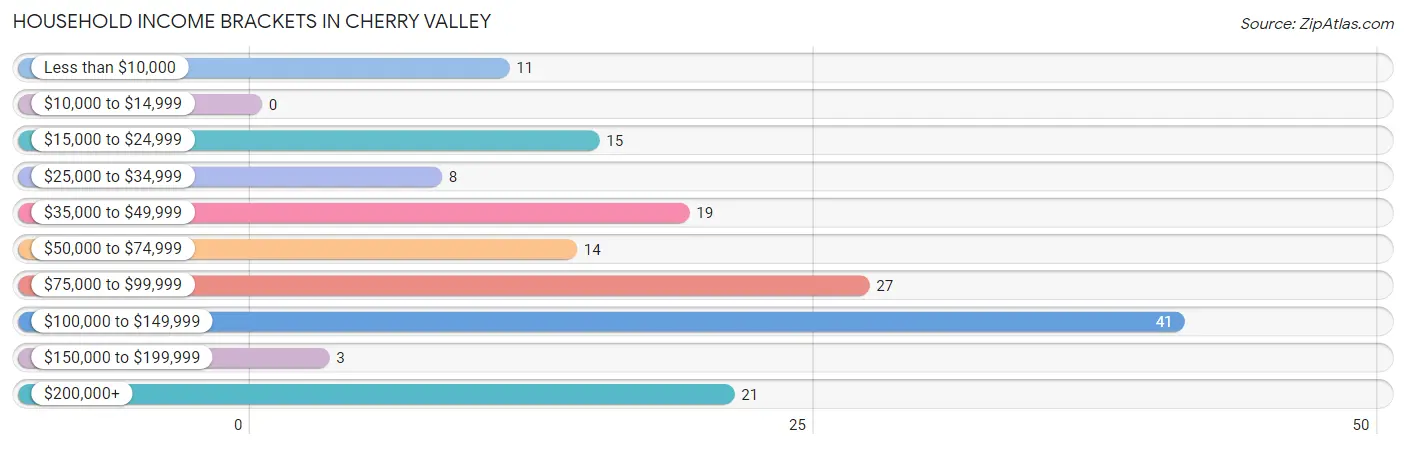
Household Income Brackets in Cherry Valley
With 41 households falling in the category, the $100,000 to $149,999 income range is the most frequent in Cherry Valley, accounting for 25.8% of all households.
| Income Bracket | # Households | % Households |
| Less than $10,000 | 11 | 6.9% |
| $10,000 to $14,999 | 0 | 0.0% |
| $15,000 to $24,999 | 15 | 9.4% |
| $25,000 to $34,999 | 8 | 5.0% |
| $35,000 to $49,999 | 19 | 11.9% |
| $50,000 to $74,999 | 14 | 8.8% |
| $75,000 to $99,999 | 27 | 17.0% |
| $100,000 to $149,999 | 41 | 25.8% |
| $150,000 to $199,999 | 3 | 1.9% |
| $200,000+ | 21 | 13.2% |
Household Income by Householder Age in Cherry Valley
The median household income in Cherry Valley is $81,042, with the highest median household income of $113,523 found in the 25 to 44 years age bracket for the primary householder. A total of 55 households (34.6%) fall into this category.
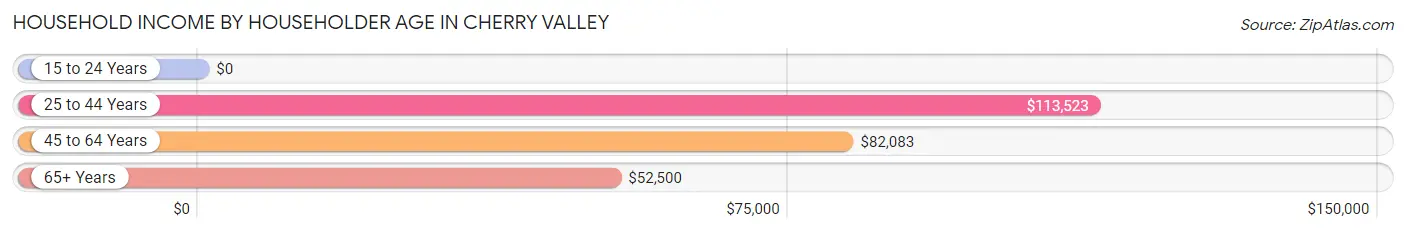
| Income Bracket | # Households | Median Income |
| 15 to 24 Years | 0 (0.0%) | $0 |
| 25 to 44 Years | 55 (34.6%) | $113,523 |
| 45 to 64 Years | 60 (37.7%) | $82,083 |
| 65+ Years | 44 (27.7%) | $52,500 |
| Total | 159 (100.0%) | $81,042 |
Poverty in Cherry Valley
Income Below Poverty by Sex and Age in Cherry Valley
With 5.6% poverty level for males and 14.4% for females among the residents of Cherry Valley, 15 year old males and 25 to 34 year old females are the most vulnerable to poverty, with 7 males (100.0%) and 14 females (32.6%) in their respective age groups living below the poverty level.
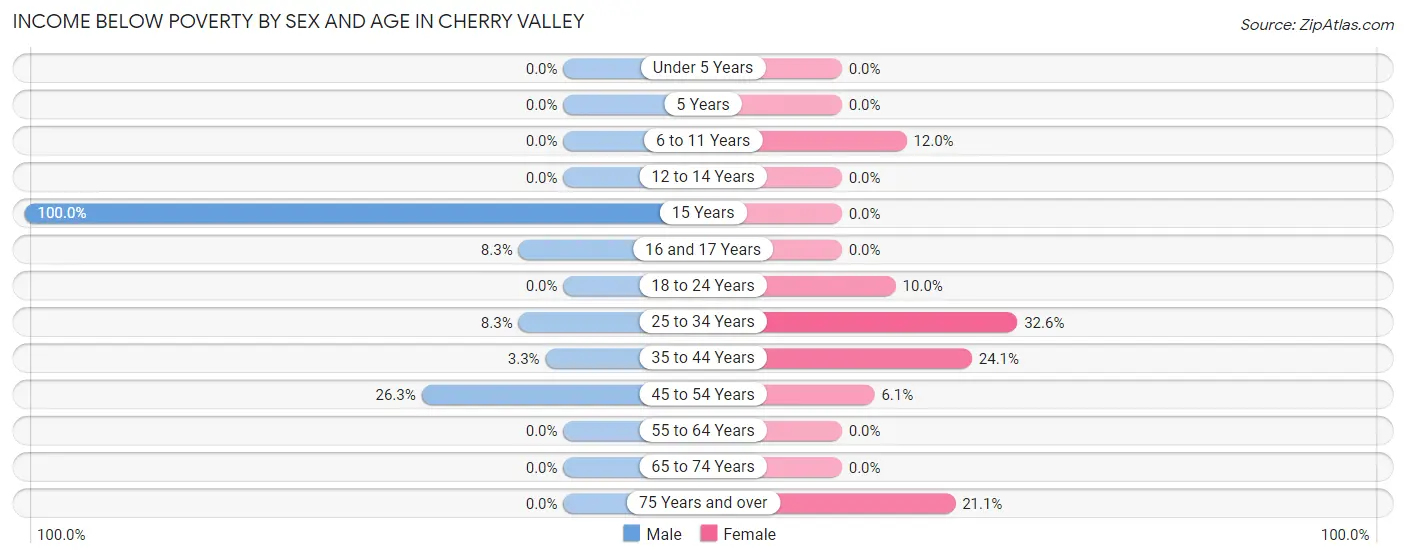
| Age Bracket | Male | Female |
| Under 5 Years | 0 (0.0%) | 0 (0.0%) |
| 5 Years | 0 (0.0%) | 0 (0.0%) |
| 6 to 11 Years | 0 (0.0%) | 3 (12.0%) |
| 12 to 14 Years | 0 (0.0%) | 0 (0.0%) |
| 15 Years | 7 (100.0%) | 0 (0.0%) |
| 16 and 17 Years | 2 (8.3%) | 0 (0.0%) |
| 18 to 24 Years | 0 (0.0%) | 3 (10.0%) |
| 25 to 34 Years | 1 (8.3%) | 14 (32.6%) |
| 35 to 44 Years | 1 (3.3%) | 7 (24.1%) |
| 45 to 54 Years | 5 (26.3%) | 2 (6.1%) |
| 55 to 64 Years | 0 (0.0%) | 0 (0.0%) |
| 65 to 74 Years | 0 (0.0%) | 0 (0.0%) |
| 75 Years and over | 0 (0.0%) | 4 (21.0%) |
| Total | 16 (5.6%) | 33 (14.4%) |
Income Above Poverty by Sex and Age in Cherry Valley
According to the poverty statistics in Cherry Valley, males aged under 5 years and females aged 16 and 17 years are the age groups that are most secure financially, with 100.0% of males and 100.0% of females in these age groups living above the poverty line.
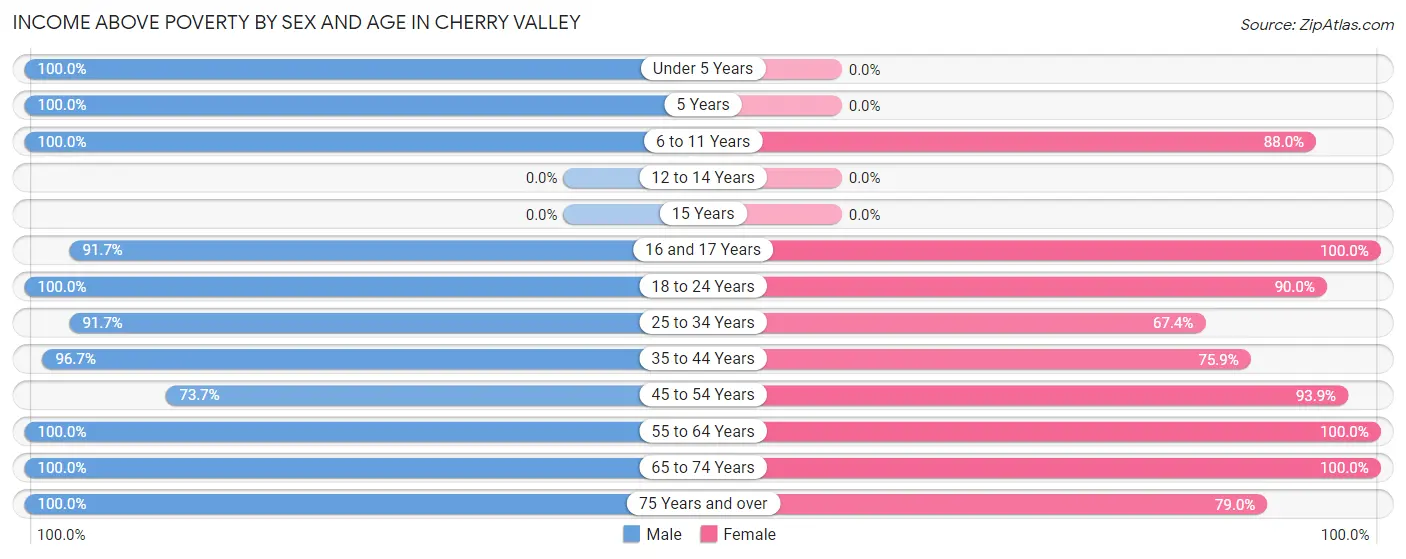
| Age Bracket | Male | Female |
| Under 5 Years | 22 (100.0%) | 0 (0.0%) |
| 5 Years | 6 (100.0%) | 0 (0.0%) |
| 6 to 11 Years | 6 (100.0%) | 22 (88.0%) |
| 12 to 14 Years | 0 (0.0%) | 0 (0.0%) |
| 15 Years | 0 (0.0%) | 0 (0.0%) |
| 16 and 17 Years | 22 (91.7%) | 3 (100.0%) |
| 18 to 24 Years | 74 (100.0%) | 27 (90.0%) |
| 25 to 34 Years | 11 (91.7%) | 29 (67.4%) |
| 35 to 44 Years | 29 (96.7%) | 22 (75.9%) |
| 45 to 54 Years | 14 (73.7%) | 31 (93.9%) |
| 55 to 64 Years | 43 (100.0%) | 29 (100.0%) |
| 65 to 74 Years | 21 (100.0%) | 18 (100.0%) |
| 75 Years and over | 20 (100.0%) | 15 (78.9%) |
| Total | 268 (94.4%) | 196 (85.6%) |
Income Below Poverty Among Married-Couple Families in Cherry Valley
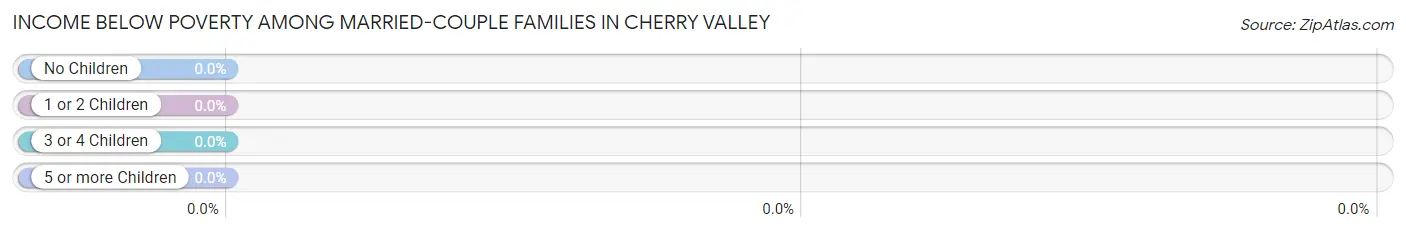
| Children | Above Poverty | Below Poverty |
| No Children | 51 (100.0%) | 0 (0.0%) |
| 1 or 2 Children | 32 (100.0%) | 0 (0.0%) |
| 3 or 4 Children | 13 (100.0%) | 0 (0.0%) |
| 5 or more Children | 0 (0.0%) | 0 (0.0%) |
| Total | 96 (100.0%) | 0 (0.0%) |
Income Below Poverty Among Single-Parent Households in Cherry Valley
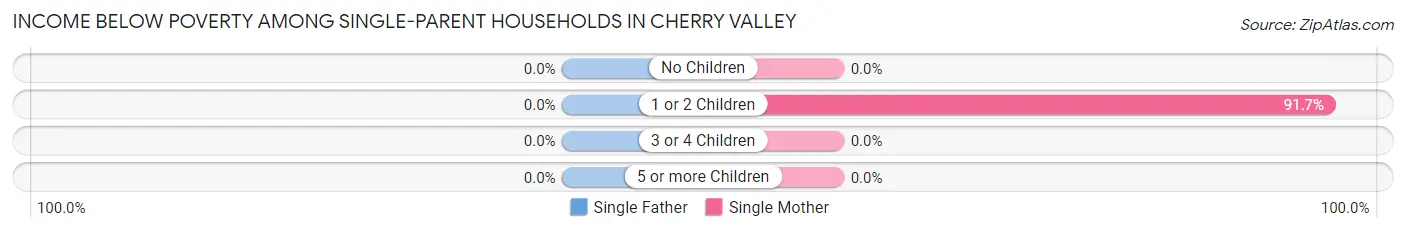
| Children | Single Father | Single Mother |
| No Children | 0 (0.0%) | 0 (0.0%) |
| 1 or 2 Children | 0 (0.0%) | 11 (91.7%) |
| 3 or 4 Children | 0 (0.0%) | 0 (0.0%) |
| 5 or more Children | 0 (0.0%) | 0 (0.0%) |
| Total | 0 (0.0%) | 11 (78.6%) |
Income Below Poverty Among Married-Couple vs Single-Parent Households in Cherry Valley
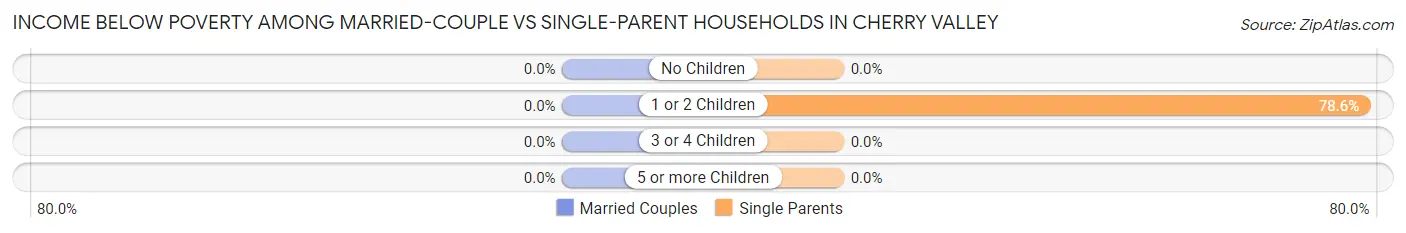
| Children | Married-Couple Families | Single-Parent Households |
| No Children | 0 (0.0%) | 0 (0.0%) |
| 1 or 2 Children | 0 (0.0%) | 11 (78.6%) |
| 3 or 4 Children | 0 (0.0%) | 0 (0.0%) |
| 5 or more Children | 0 (0.0%) | 0 (0.0%) |
| Total | 0 (0.0%) | 11 (50.0%) |
Race in Cherry Valley
The most populous races in Cherry Valley are White / Caucasian (500 | 96.9%), Two or more Races (11 | 2.1%), and Hispanic or Latino (6 | 1.2%).
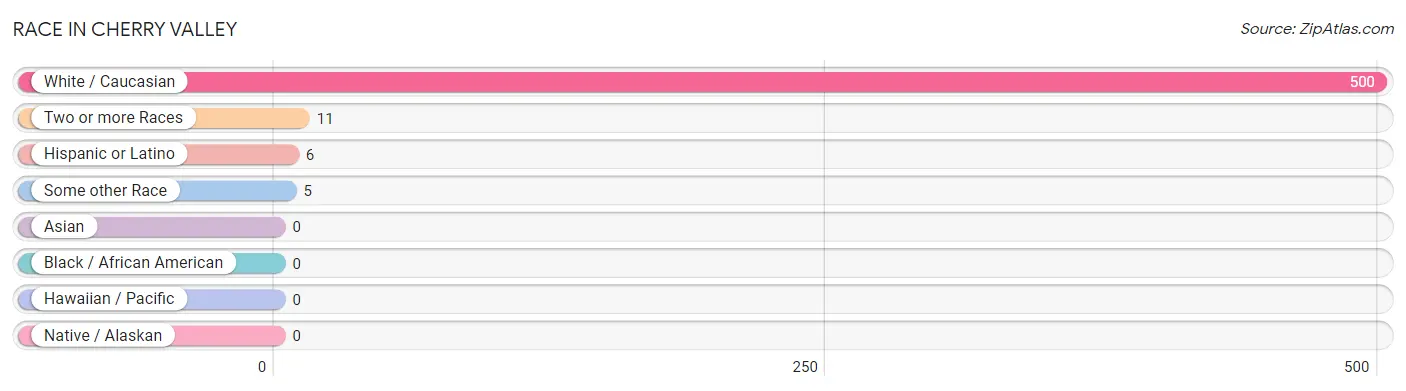
| Race | # Population | % Population |
| Asian | 0 | 0.0% |
| Black / African American | 0 | 0.0% |
| Hawaiian / Pacific | 0 | 0.0% |
| Hispanic or Latino | 6 | 1.2% |
| Native / Alaskan | 0 | 0.0% |
| White / Caucasian | 500 | 96.9% |
| Two or more Races | 11 | 2.1% |
| Some other Race | 5 | 1.0% |
| Total | 516 | 100.0% |
Ancestry in Cherry Valley
The most populous ancestries reported in Cherry Valley are English (169 | 32.8%), German (99 | 19.2%), European (61 | 11.8%), Italian (52 | 10.1%), and Irish (44 | 8.5%), together accounting for 82.4% of all Cherry Valley residents.
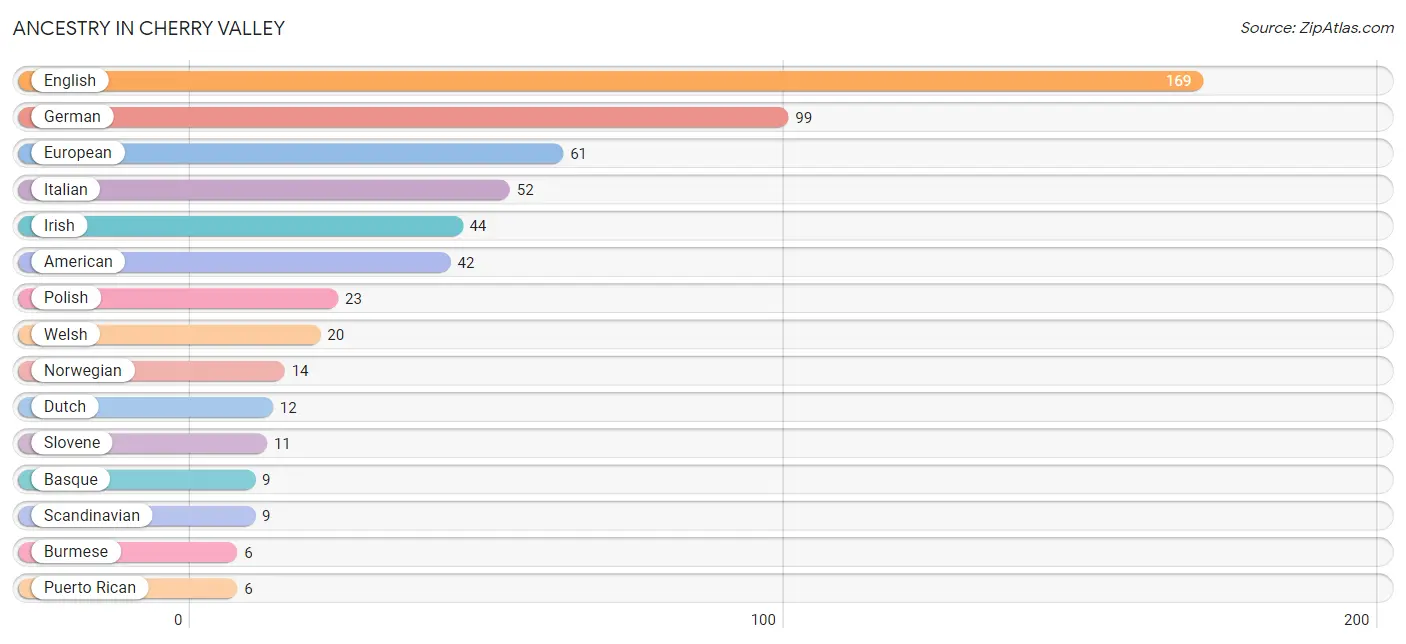
| Ancestry | # Population | % Population |
| American | 42 | 8.1% |
| Austrian | 3 | 0.6% |
| Basque | 9 | 1.7% |
| British | 3 | 0.6% |
| Burmese | 6 | 1.2% |
| Dutch | 12 | 2.3% |
| English | 169 | 32.8% |
| European | 61 | 11.8% |
| French | 4 | 0.8% |
| German | 99 | 19.2% |
| Hungarian | 2 | 0.4% |
| Irish | 44 | 8.5% |
| Italian | 52 | 10.1% |
| Norwegian | 14 | 2.7% |
| Polish | 23 | 4.5% |
| Puerto Rican | 6 | 1.2% |
| Russian | 3 | 0.6% |
| Scandinavian | 9 | 1.7% |
| Scottish | 5 | 1.0% |
| Slovak | 3 | 0.6% |
| Slovene | 11 | 2.1% |
| Swedish | 4 | 0.8% |
| Welsh | 20 | 3.9% | View All 23 Rows |
Immigrants in Cherry Valley
The most numerous immigrant groups reported in Cherry Valley came from Europe (12 | 2.3%), Eastern Europe (7 | 1.4%), Poland (7 | 1.4%), Northern Europe (5 | 1.0%), and Sweden (2 | 0.4%), together accounting for 6.4% of all Cherry Valley residents.
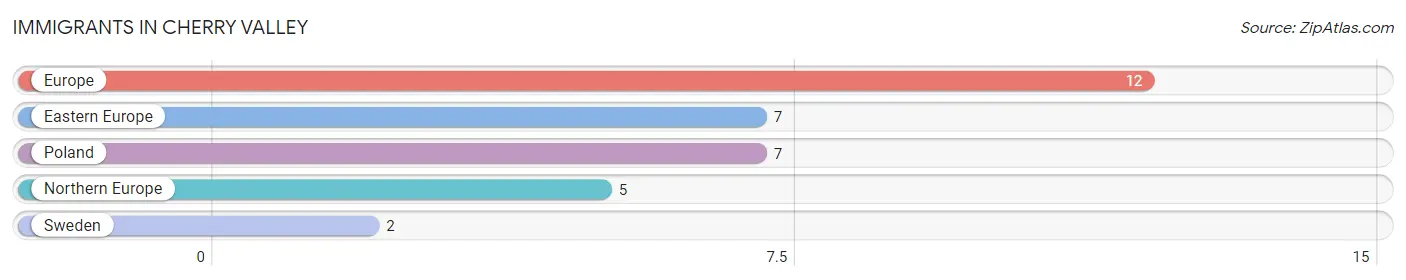
| Immigration Origin | # Population | % Population |
| Eastern Europe | 7 | 1.4% |
| Europe | 12 | 2.3% |
| Northern Europe | 5 | 1.0% |
| Poland | 7 | 1.4% |
| Sweden | 2 | 0.4% | View All 5 Rows |
Sex and Age in Cherry Valley
Sex and Age in Cherry Valley
The most populous age groups in Cherry Valley are 20 to 24 Years (58 | 20.2%) for men and 25 to 29 Years (26 | 11.4%) for women.
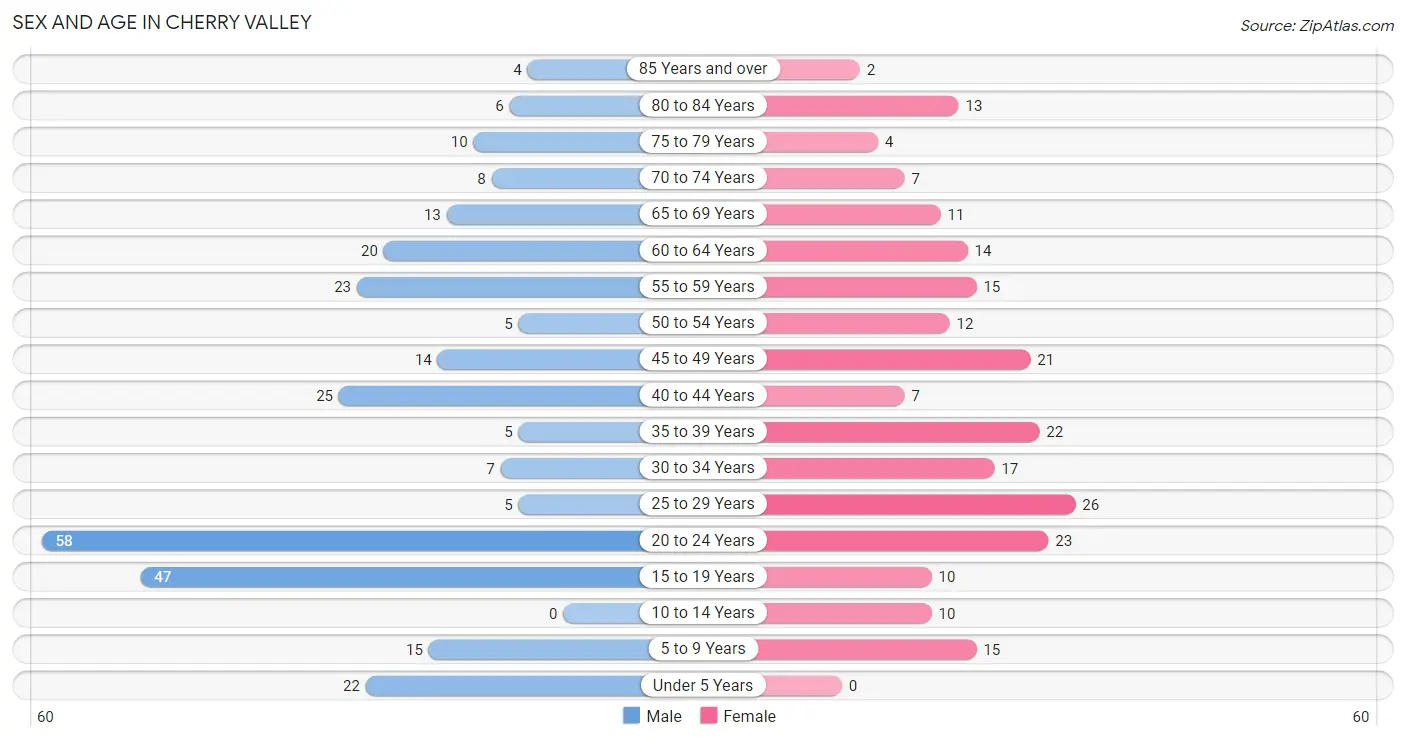
| Age Bracket | Male | Female |
| Under 5 Years | 22 (7.7%) | 0 (0.0%) |
| 5 to 9 Years | 15 (5.2%) | 15 (6.6%) |
| 10 to 14 Years | 0 (0.0%) | 10 (4.4%) |
| 15 to 19 Years | 47 (16.4%) | 10 (4.4%) |
| 20 to 24 Years | 58 (20.2%) | 23 (10.0%) |
| 25 to 29 Years | 5 (1.7%) | 26 (11.4%) |
| 30 to 34 Years | 7 (2.4%) | 17 (7.4%) |
| 35 to 39 Years | 5 (1.7%) | 22 (9.6%) |
| 40 to 44 Years | 25 (8.7%) | 7 (3.1%) |
| 45 to 49 Years | 14 (4.9%) | 21 (9.2%) |
| 50 to 54 Years | 5 (1.7%) | 12 (5.2%) |
| 55 to 59 Years | 23 (8.0%) | 15 (6.6%) |
| 60 to 64 Years | 20 (7.0%) | 14 (6.1%) |
| 65 to 69 Years | 13 (4.5%) | 11 (4.8%) |
| 70 to 74 Years | 8 (2.8%) | 7 (3.1%) |
| 75 to 79 Years | 10 (3.5%) | 4 (1.8%) |
| 80 to 84 Years | 6 (2.1%) | 13 (5.7%) |
| 85 Years and over | 4 (1.4%) | 2 (0.9%) |
| Total | 287 (100.0%) | 229 (100.0%) |
Families and Households in Cherry Valley
Median Family Size in Cherry Valley
The median family size in Cherry Valley is 3.56 persons per family, with married-couple families (96 | 81.4%) accounting for the largest median family size of 3.78 persons per family. On the other hand, single female/mother families (14 | 11.9%) represent the smallest median family size with 2.50 persons per family.
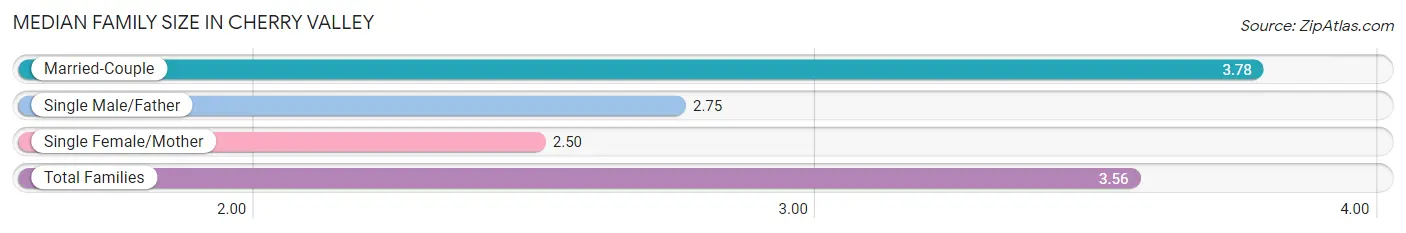
| Family Type | # Families | Family Size |
| Married-Couple | 96 (81.4%) | 3.78 |
| Single Male/Father | 8 (6.8%) | 2.75 |
| Single Female/Mother | 14 (11.9%) | 2.50 |
| Total Families | 118 (100.0%) | 3.56 |
Median Household Size in Cherry Valley
The median household size in Cherry Valley is 3.22 persons per household, with married-couple households (96 | 60.4%) accounting for the largest median household size of 4.09 persons per household. non-family households (41 | 25.8%) represent the smallest median household size with 1.44 persons per household.
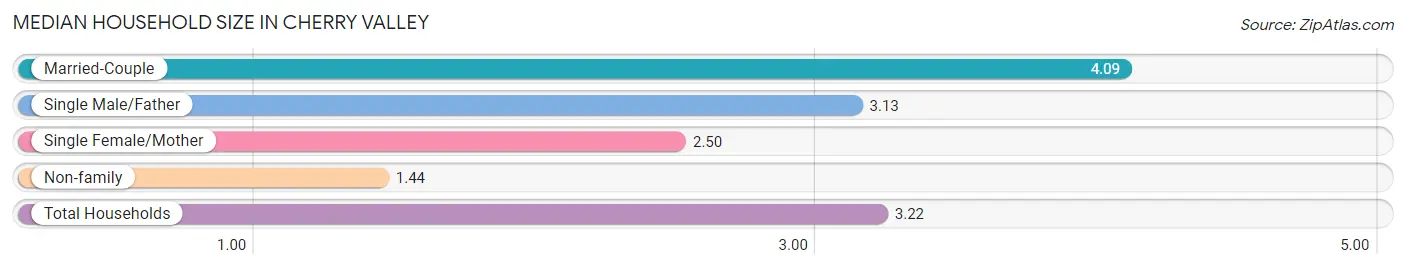
| Household Type | # Households | Household Size |
| Married-Couple | 96 (60.4%) | 4.09 |
| Single Male/Father | 8 (5.0%) | 3.13 |
| Single Female/Mother | 14 (8.8%) | 2.50 |
| Non-family | 41 (25.8%) | 1.44 |
| Total Households | 159 (100.0%) | 3.22 |
Household Size by Marriage Status in Cherry Valley
Out of a total of 159 households in Cherry Valley, 118 (74.2%) are family households, while 41 (25.8%) are nonfamily households. The most numerous type of family households are 2-person households, comprising 49, and the most common type of nonfamily households are 1-person households, comprising 32.
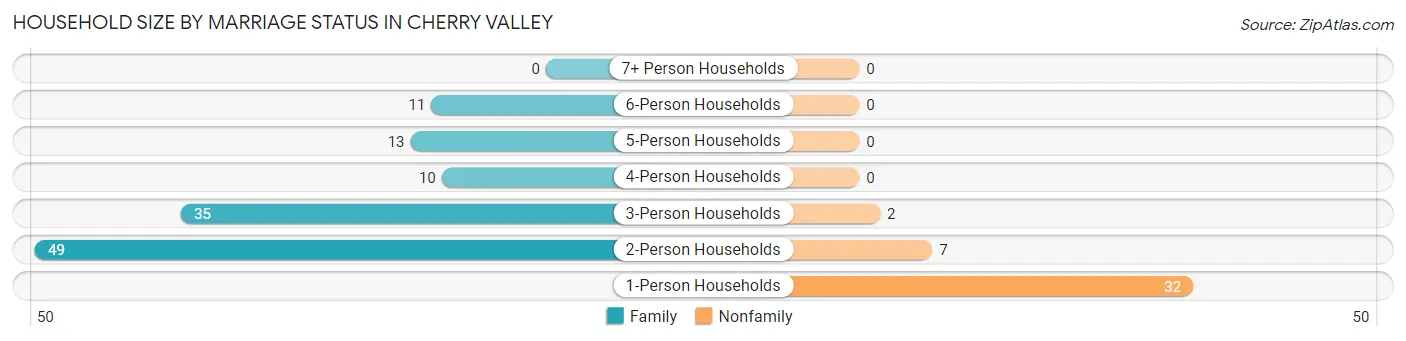
| Household Size | Family Households | Nonfamily Households |
| 1-Person Households | - | 32 (20.1%) |
| 2-Person Households | 49 (30.8%) | 7 (4.4%) |
| 3-Person Households | 35 (22.0%) | 2 (1.3%) |
| 4-Person Households | 10 (6.3%) | 0 (0.0%) |
| 5-Person Households | 13 (8.2%) | 0 (0.0%) |
| 6-Person Households | 11 (6.9%) | 0 (0.0%) |
| 7+ Person Households | 0 (0.0%) | 0 (0.0%) |
| Total | 118 (74.2%) | 41 (25.8%) |
Female Fertility in Cherry Valley
Fertility by Age in Cherry Valley
Average fertility rate in Cherry Valley is 135.0 births per 1,000 women. Women in the age bracket of 20 to 34 years have the highest fertility rate with 258.0 births per 1,000 women. Women in the age bracket of 20 to 34 years acount for 100.0% of all women with births.
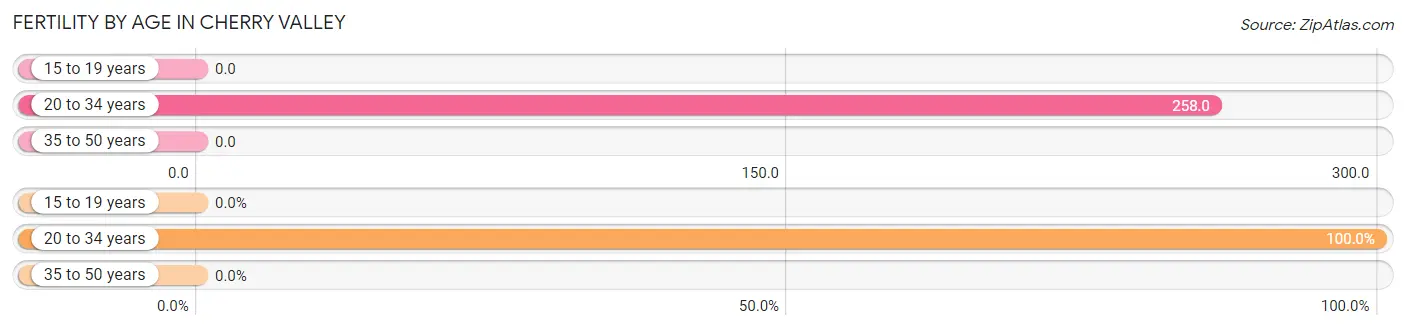
| Age Bracket | Women with Births | Births / 1,000 Women |
| 15 to 19 years | 0 (0.0%) | 0.0 |
| 20 to 34 years | 17 (100.0%) | 258.0 |
| 35 to 50 years | 0 (0.0%) | 0.0 |
| Total | 17 (100.0%) | 135.0 |
Fertility by Age by Marriage Status in Cherry Valley
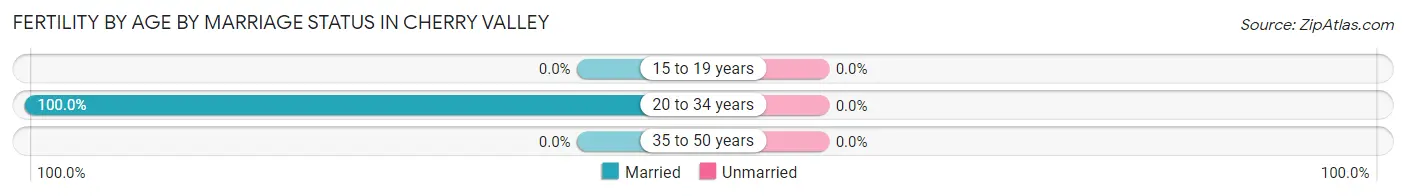
| Age Bracket | Married | Unmarried |
| 15 to 19 years | 0 (0.0%) | 0 (0.0%) |
| 20 to 34 years | 17 (100.0%) | 0 (0.0%) |
| 35 to 50 years | 0 (0.0%) | 0 (0.0%) |
| Total | 17 (100.0%) | 0 (0.0%) |
Fertility by Education in Cherry Valley
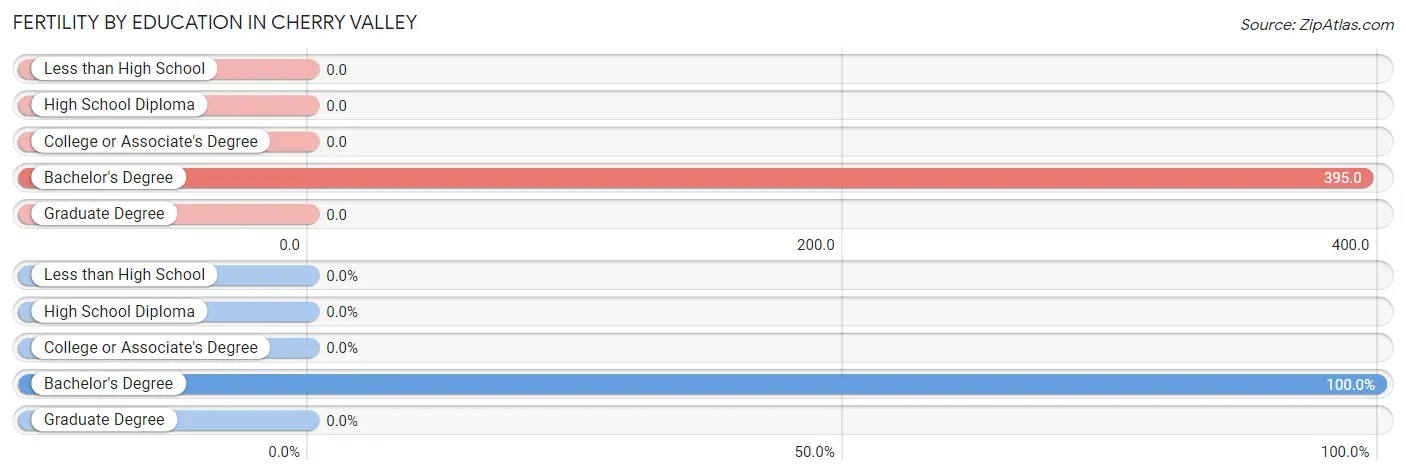
| Educational Attainment | Women with Births | Births / 1,000 Women |
| Less than High School | 0 (0.0%) | 0.0 |
| High School Diploma | 0 (0.0%) | 0.0 |
| College or Associate's Degree | 0 (0.0%) | 0.0 |
| Bachelor's Degree | 17 (100.0%) | 395.0 |
| Graduate Degree | 0 (0.0%) | 0.0 |
| Total | 17 (100.0%) | 135.0 |
Fertility by Education by Marriage Status in Cherry Valley
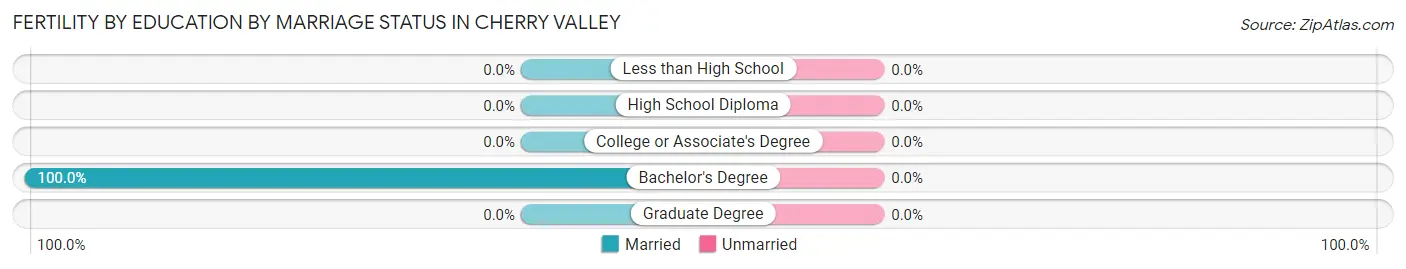
| Educational Attainment | Married | Unmarried |
| Less than High School | 0 (0.0%) | 0 (0.0%) |
| High School Diploma | 0 (0.0%) | 0 (0.0%) |
| College or Associate's Degree | 0 (0.0%) | 0 (0.0%) |
| Bachelor's Degree | 17 (100.0%) | 0 (0.0%) |
| Graduate Degree | 0 (0.0%) | 0 (0.0%) |
| Total | 17 (100.0%) | 0 (0.0%) |
Employment Characteristics in Cherry Valley
Employment by Class of Employer in Cherry Valley
Among the 271 employed individuals in Cherry Valley, private company employees (117 | 43.2%), not-for-profit organizations (79 | 29.1%), and local government employees (24 | 8.9%) make up the most common classes of employment.
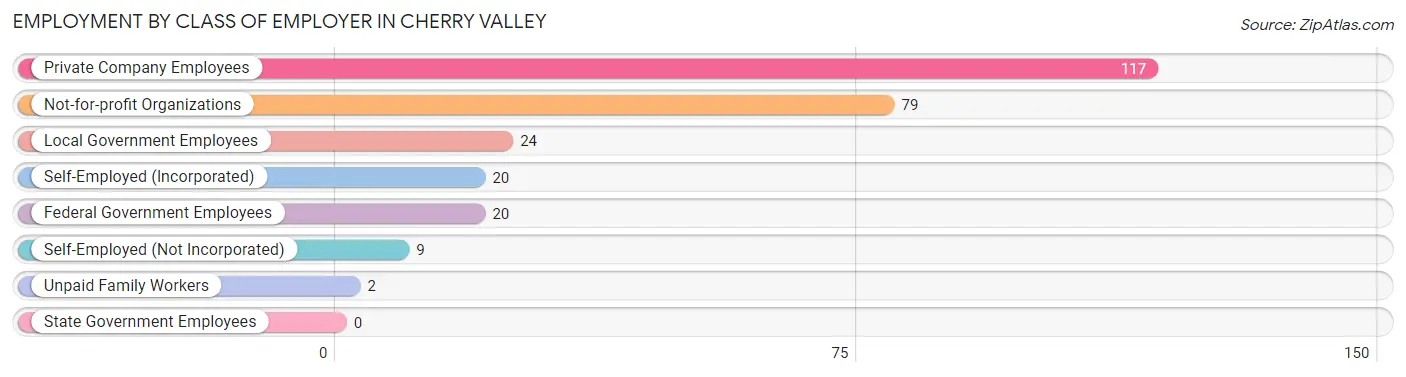
| Employer Class | # Employees | % Employees |
| Private Company Employees | 117 | 43.2% |
| Self-Employed (Incorporated) | 20 | 7.4% |
| Self-Employed (Not Incorporated) | 9 | 3.3% |
| Not-for-profit Organizations | 79 | 29.1% |
| Local Government Employees | 24 | 8.9% |
| State Government Employees | 0 | 0.0% |
| Federal Government Employees | 20 | 7.4% |
| Unpaid Family Workers | 2 | 0.7% |
| Total | 271 | 100.0% |
Employment Status by Age in Cherry Valley
According to the labor force statistics for Cherry Valley, out of the total population over 16 years of age (447), 67.3% or 301 individuals are in the labor force, with 5.6% or 17 of them unemployed. The age group with the highest labor force participation rate is 35 to 44 years, with 98.3% or 58 individuals in the labor force. Within the labor force, the 30 to 34 years age range has the highest percentage of unemployed individuals, with 71.4% or 5 of them being unemployed.
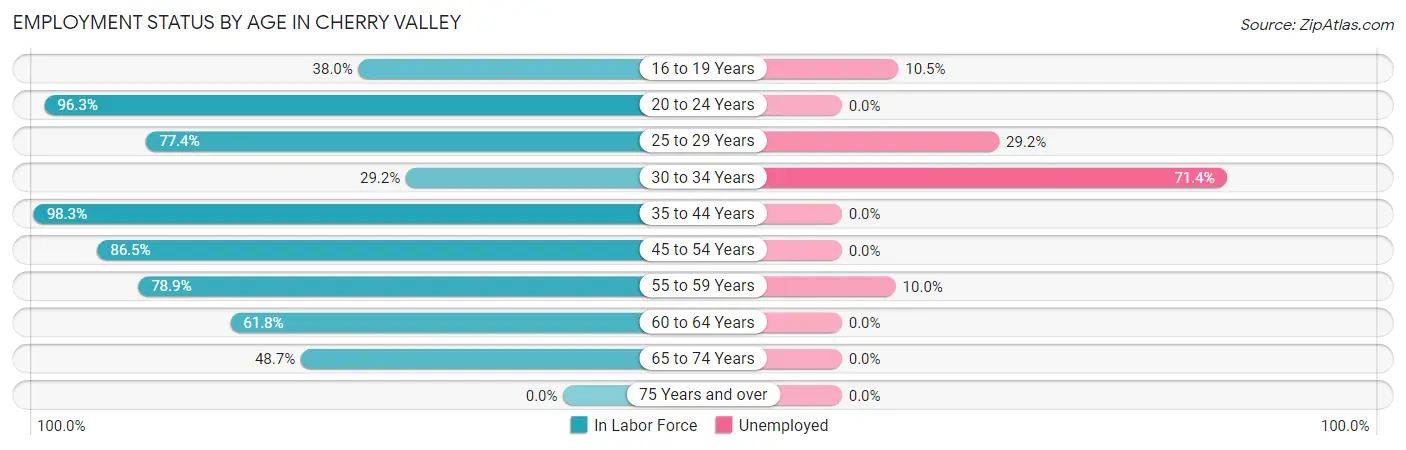
| Age Bracket | In Labor Force | Unemployed |
| 16 to 19 Years | 19 (38.0%) | 2 (10.5%) |
| 20 to 24 Years | 78 (96.3%) | 0 (0.0%) |
| 25 to 29 Years | 24 (77.4%) | 7 (29.2%) |
| 30 to 34 Years | 7 (29.2%) | 5 (71.4%) |
| 35 to 44 Years | 58 (98.3%) | 0 (0.0%) |
| 45 to 54 Years | 45 (86.5%) | 0 (0.0%) |
| 55 to 59 Years | 30 (78.9%) | 3 (10.0%) |
| 60 to 64 Years | 21 (61.8%) | 0 (0.0%) |
| 65 to 74 Years | 19 (48.7%) | 0 (0.0%) |
| 75 Years and over | 0 (0.0%) | 0 (0.0%) |
| Total | 301 (67.3%) | 17 (5.6%) |
Employment Status by Educational Attainment in Cherry Valley
According to labor force statistics for Cherry Valley, 77.7% of individuals (185) out of the total population between 25 and 64 years of age (238) are in the labor force, with 8.1% or 15 of them being unemployed. The group with the highest labor force participation rate are those with the educational attainment of college / associate degree, with 84.7% or 61 individuals in the labor force. Within the labor force, individuals with less than high school education have the highest percentage of unemployment, with 71.4% or 5 of them being unemployed.
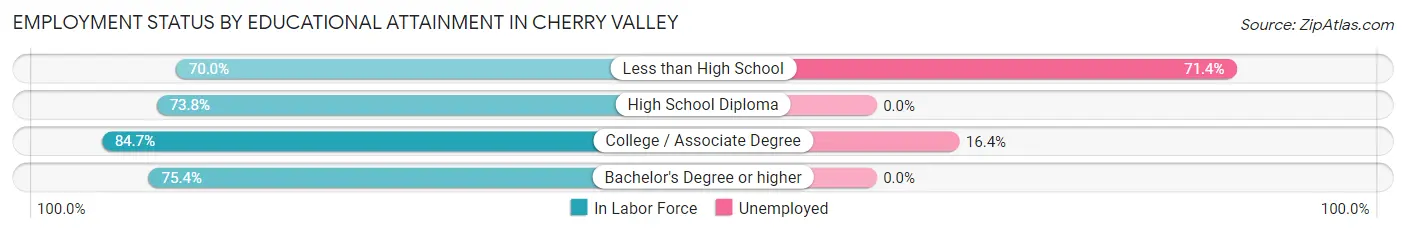
| Educational Attainment | In Labor Force | Unemployed |
| Less than High School | 7 (70.0%) | 7 (71.4%) |
| High School Diploma | 31 (73.8%) | 0 (0.0%) |
| College / Associate Degree | 61 (84.7%) | 12 (16.4%) |
| Bachelor's Degree or higher | 86 (75.4%) | 0 (0.0%) |
| Total | 185 (77.7%) | 19 (8.1%) |
Employment Occupations by Sex in Cherry Valley
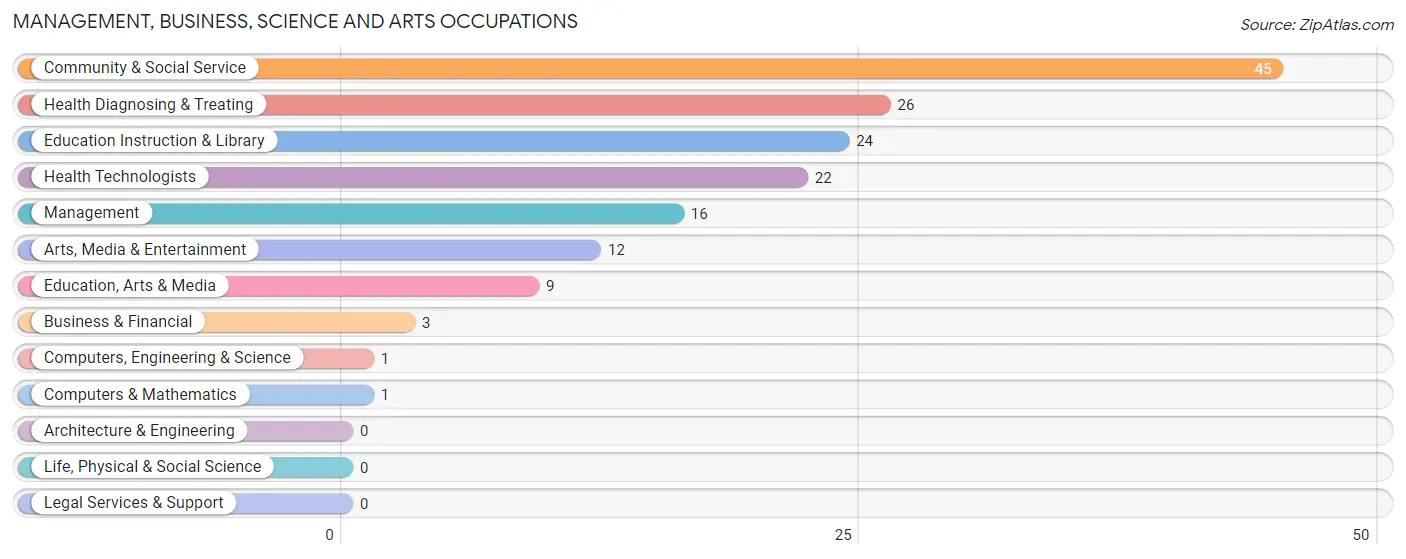
Management, Business, Science and Arts Occupations
The most common Management, Business, Science and Arts occupations in Cherry Valley are Community & Social Service (45 | 15.9%), Health Diagnosing & Treating (26 | 9.1%), Education Instruction & Library (24 | 8.5%), Health Technologists (22 | 7.7%), and Management (16 | 5.6%).
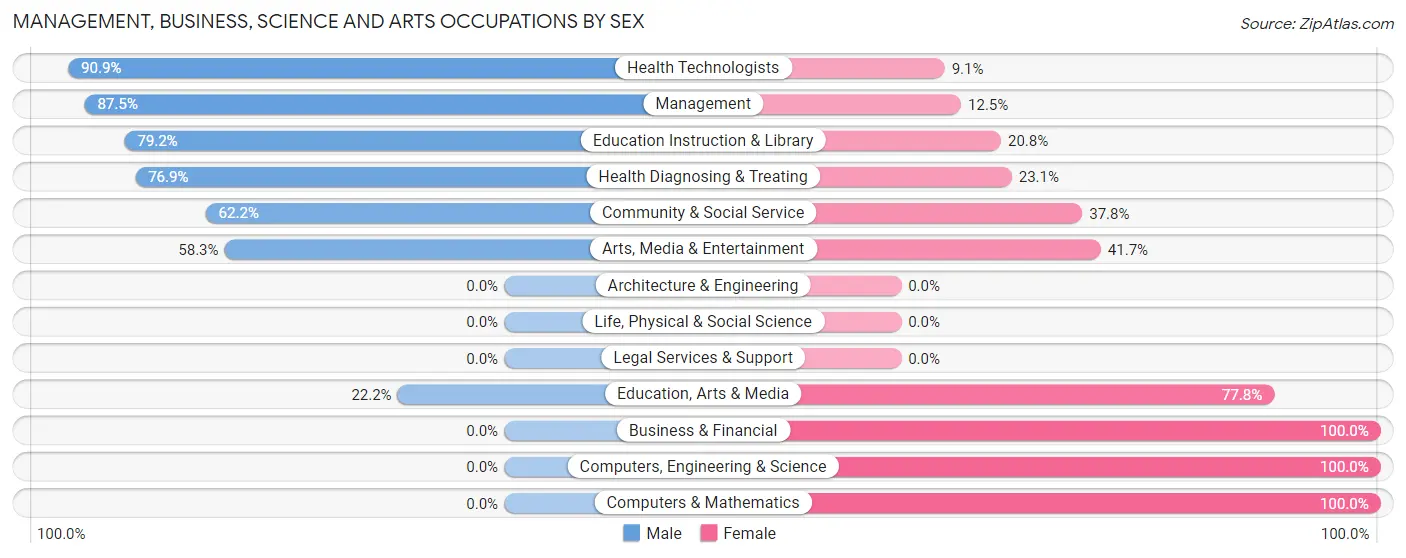
Management, Business, Science and Arts Occupations by Sex
Within the Management, Business, Science and Arts occupations in Cherry Valley, the most male-oriented occupations are Health Technologists (90.9%), Management (87.5%), and Education Instruction & Library (79.2%), while the most female-oriented occupations are Business & Financial (100.0%), Computers, Engineering & Science (100.0%), and Computers & Mathematics (100.0%).
| Occupation | Male | Female |
| Management | 14 (87.5%) | 2 (12.5%) |
| Business & Financial | 0 (0.0%) | 3 (100.0%) |
| Computers, Engineering & Science | 0 (0.0%) | 1 (100.0%) |
| Computers & Mathematics | 0 (0.0%) | 1 (100.0%) |
| Architecture & Engineering | 0 (0.0%) | 0 (0.0%) |
| Life, Physical & Social Science | 0 (0.0%) | 0 (0.0%) |
| Community & Social Service | 28 (62.2%) | 17 (37.8%) |
| Education, Arts & Media | 2 (22.2%) | 7 (77.8%) |
| Legal Services & Support | 0 (0.0%) | 0 (0.0%) |
| Education Instruction & Library | 19 (79.2%) | 5 (20.8%) |
| Arts, Media & Entertainment | 7 (58.3%) | 5 (41.7%) |
| Health Diagnosing & Treating | 20 (76.9%) | 6 (23.1%) |
| Health Technologists | 20 (90.9%) | 2 (9.1%) |
| Total (Category) | 62 (68.1%) | 29 (31.9%) |
| Total (Overall) | 164 (57.8%) | 120 (42.2%) |
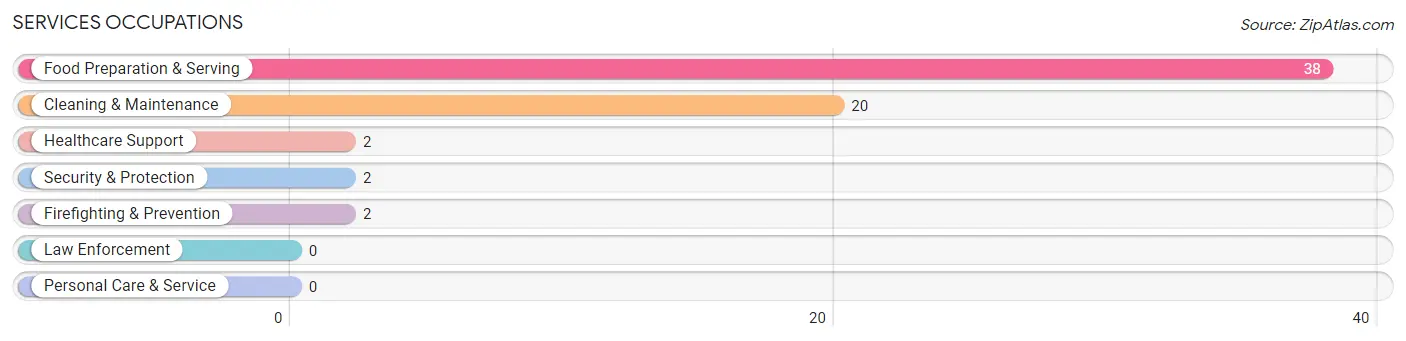
Services Occupations
The most common Services occupations in Cherry Valley are Food Preparation & Serving (38 | 13.4%), Cleaning & Maintenance (20 | 7.0%), Healthcare Support (2 | 0.7%), Security & Protection (2 | 0.7%), and Firefighting & Prevention (2 | 0.7%).
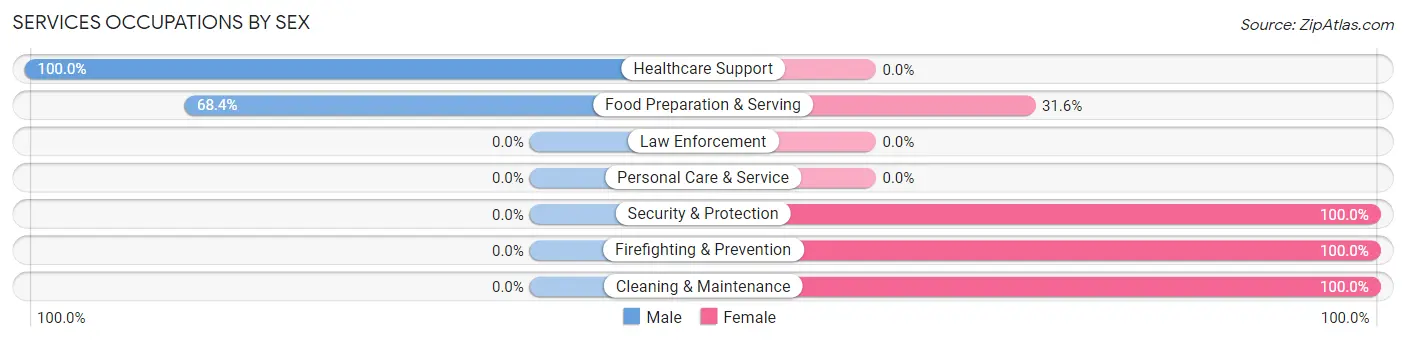
Services Occupations by Sex
Within the Services occupations in Cherry Valley, the most male-oriented occupations are Healthcare Support (100.0%), and Food Preparation & Serving (68.4%), while the most female-oriented occupations are Security & Protection (100.0%), Firefighting & Prevention (100.0%), and Cleaning & Maintenance (100.0%).
| Occupation | Male | Female |
| Healthcare Support | 2 (100.0%) | 0 (0.0%) |
| Security & Protection | 0 (0.0%) | 2 (100.0%) |
| Firefighting & Prevention | 0 (0.0%) | 2 (100.0%) |
| Law Enforcement | 0 (0.0%) | 0 (0.0%) |
| Food Preparation & Serving | 26 (68.4%) | 12 (31.6%) |
| Cleaning & Maintenance | 0 (0.0%) | 20 (100.0%) |
| Personal Care & Service | 0 (0.0%) | 0 (0.0%) |
| Total (Category) | 28 (45.2%) | 34 (54.8%) |
| Total (Overall) | 164 (57.8%) | 120 (42.2%) |
Sales and Office Occupations
The most common Sales and Office occupations in Cherry Valley are Office & Administration (57 | 20.1%), and Sales & Related (24 | 8.5%).
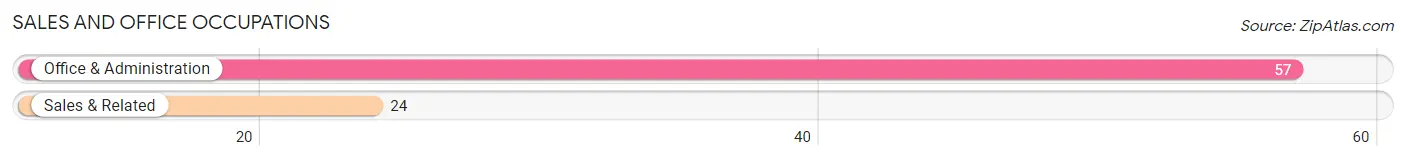
Sales and Office Occupations by Sex
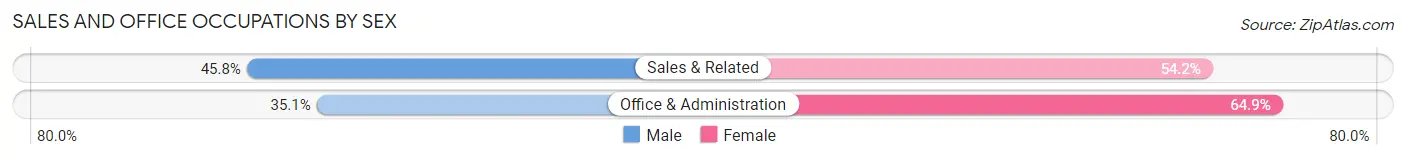
| Occupation | Male | Female |
| Sales & Related | 11 (45.8%) | 13 (54.2%) |
| Office & Administration | 20 (35.1%) | 37 (64.9%) |
| Total (Category) | 31 (38.3%) | 50 (61.7%) |
| Total (Overall) | 164 (57.8%) | 120 (42.2%) |
Natural Resources, Construction and Maintenance Occupations
The most common Natural Resources, Construction and Maintenance occupations in Cherry Valley are , and Construction & Extraction (7 | 2.5%).
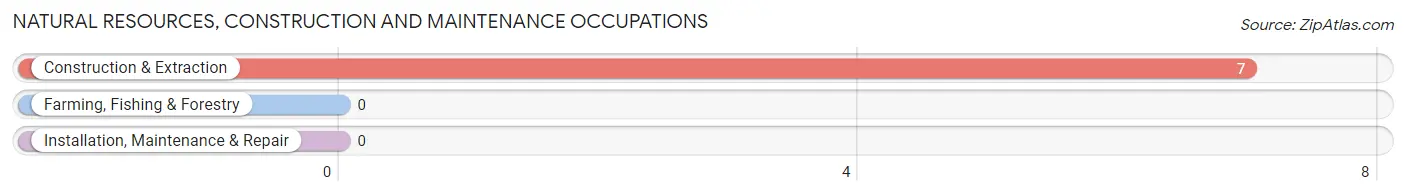
Natural Resources, Construction and Maintenance Occupations by Sex
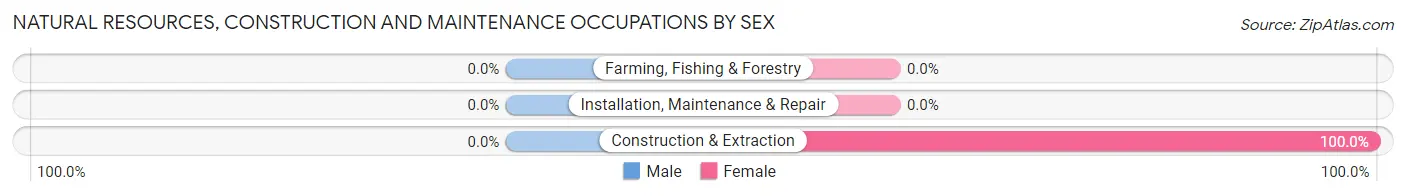
| Occupation | Male | Female |
| Farming, Fishing & Forestry | 0 (0.0%) | 0 (0.0%) |
| Construction & Extraction | 0 (0.0%) | 7 (100.0%) |
| Installation, Maintenance & Repair | 0 (0.0%) | 0 (0.0%) |
| Total (Category) | 0 (0.0%) | 7 (100.0%) |
| Total (Overall) | 164 (57.8%) | 120 (42.2%) |
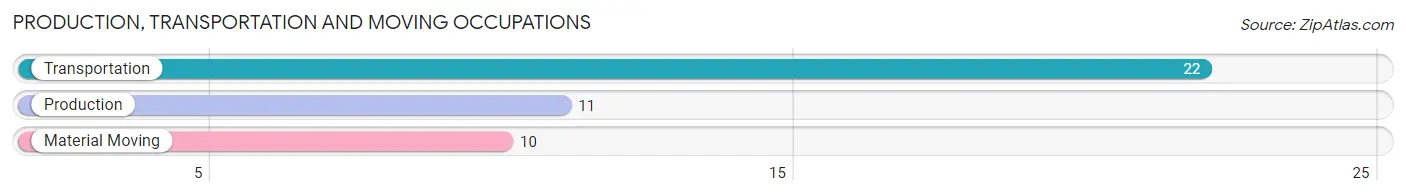
Production, Transportation and Moving Occupations
The most common Production, Transportation and Moving occupations in Cherry Valley are Transportation (22 | 7.7%), Production (11 | 3.9%), and Material Moving (10 | 3.5%).
Production, Transportation and Moving Occupations by Sex
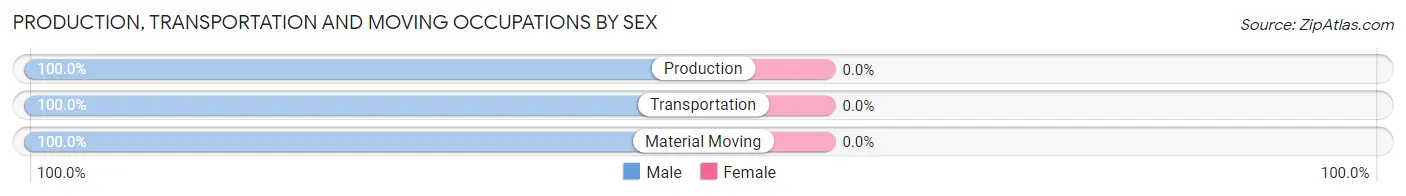
| Occupation | Male | Female |
| Production | 11 (100.0%) | 0 (0.0%) |
| Transportation | 22 (100.0%) | 0 (0.0%) |
| Material Moving | 10 (100.0%) | 0 (0.0%) |
| Total (Category) | 43 (100.0%) | 0 (0.0%) |
| Total (Overall) | 164 (57.8%) | 120 (42.2%) |
Employment Industries by Sex in Cherry Valley
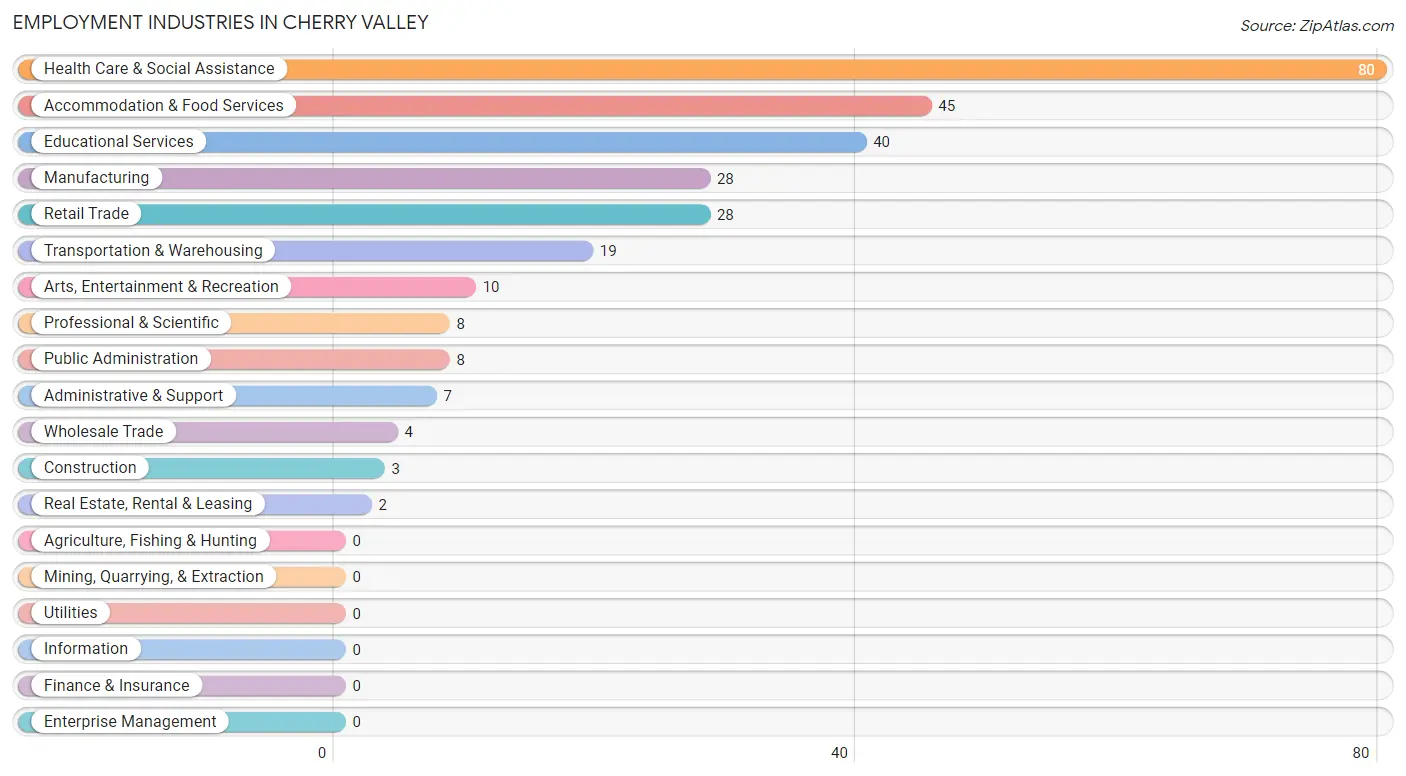
Employment Industries in Cherry Valley
The major employment industries in Cherry Valley include Health Care & Social Assistance (80 | 28.2%), Accommodation & Food Services (45 | 15.9%), Educational Services (40 | 14.1%), Manufacturing (28 | 9.9%), and Retail Trade (28 | 9.9%).
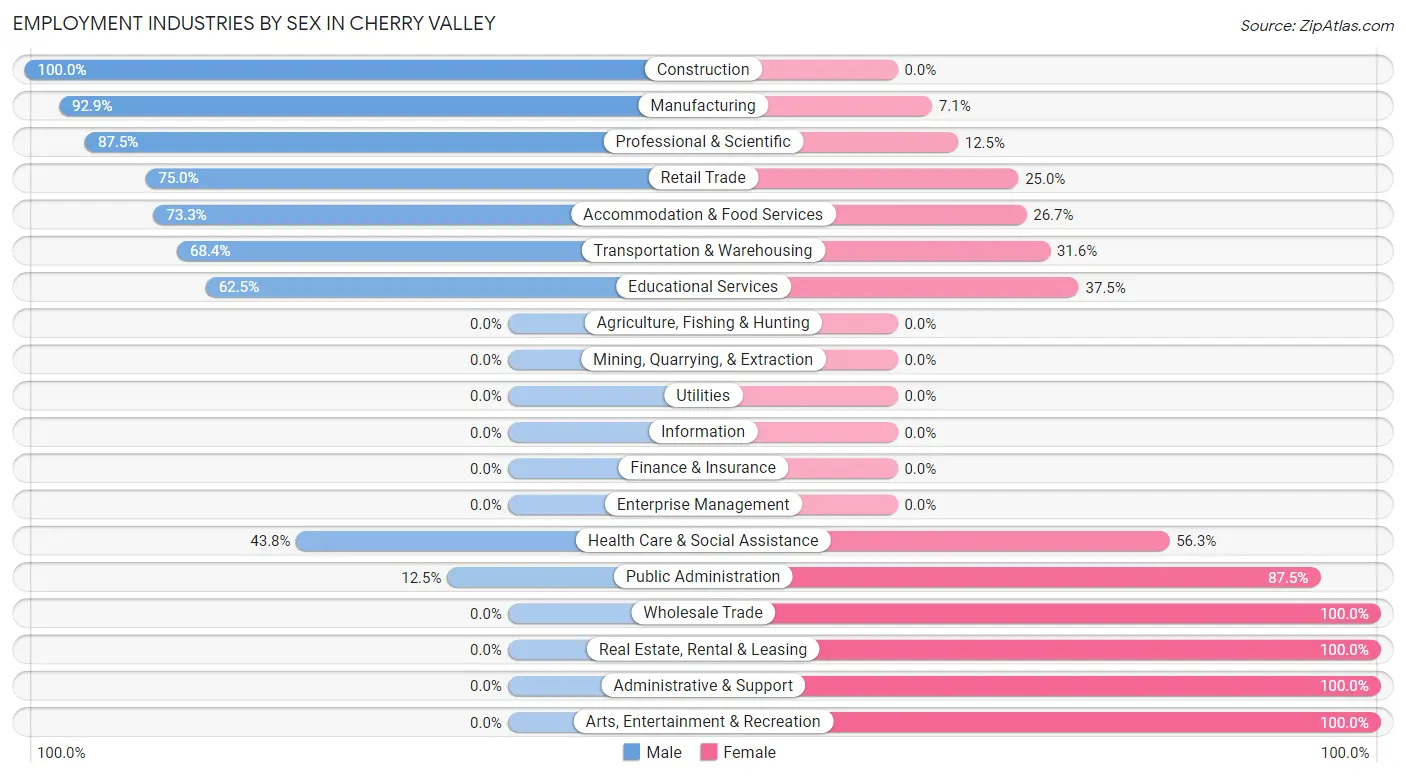
Employment Industries by Sex in Cherry Valley
The Cherry Valley industries that see more men than women are Construction (100.0%), Manufacturing (92.9%), and Professional & Scientific (87.5%), whereas the industries that tend to have a higher number of women are Wholesale Trade (100.0%), Real Estate, Rental & Leasing (100.0%), and Administrative & Support (100.0%).
| Industry | Male | Female |
| Agriculture, Fishing & Hunting | 0 (0.0%) | 0 (0.0%) |
| Mining, Quarrying, & Extraction | 0 (0.0%) | 0 (0.0%) |
| Construction | 3 (100.0%) | 0 (0.0%) |
| Manufacturing | 26 (92.9%) | 2 (7.1%) |
| Wholesale Trade | 0 (0.0%) | 4 (100.0%) |
| Retail Trade | 21 (75.0%) | 7 (25.0%) |
| Transportation & Warehousing | 13 (68.4%) | 6 (31.6%) |
| Utilities | 0 (0.0%) | 0 (0.0%) |
| Information | 0 (0.0%) | 0 (0.0%) |
| Finance & Insurance | 0 (0.0%) | 0 (0.0%) |
| Real Estate, Rental & Leasing | 0 (0.0%) | 2 (100.0%) |
| Professional & Scientific | 7 (87.5%) | 1 (12.5%) |
| Enterprise Management | 0 (0.0%) | 0 (0.0%) |
| Administrative & Support | 0 (0.0%) | 7 (100.0%) |
| Educational Services | 25 (62.5%) | 15 (37.5%) |
| Health Care & Social Assistance | 35 (43.8%) | 45 (56.2%) |
| Arts, Entertainment & Recreation | 0 (0.0%) | 10 (100.0%) |
| Accommodation & Food Services | 33 (73.3%) | 12 (26.7%) |
| Public Administration | 1 (12.5%) | 7 (87.5%) |
| Total | 164 (57.8%) | 120 (42.2%) |
Education in Cherry Valley
School Enrollment in Cherry Valley
The most common levels of schooling among the 76 students in Cherry Valley are high school (41 | 53.9%), college / undergraduate (23 | 30.3%), and elementary school (12 | 15.8%).
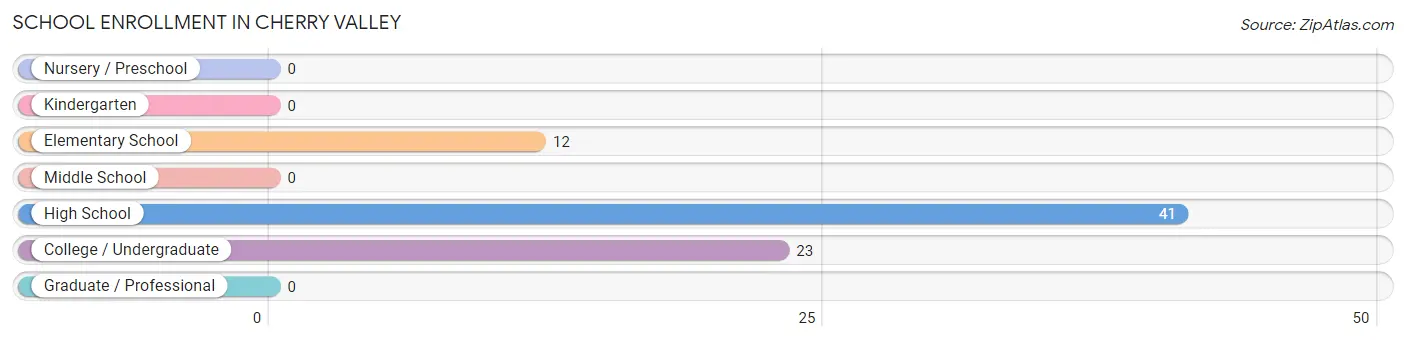
| School Level | # Students | % Students |
| Nursery / Preschool | 0 | 0.0% |
| Kindergarten | 0 | 0.0% |
| Elementary School | 12 | 15.8% |
| Middle School | 0 | 0.0% |
| High School | 41 | 53.9% |
| College / Undergraduate | 23 | 30.3% |
| Graduate / Professional | 0 | 0.0% |
| Total | 76 | 100.0% |
School Enrollment by Age by Funding Source in Cherry Valley
Out of a total of 76 students who are enrolled in schools in Cherry Valley, 8 (10.5%) attend a private institution, while the remaining 68 (89.5%) are enrolled in public schools. The age group of 20 to 24 year olds has the highest likelihood of being enrolled in private schools, with 8 (100.0% in the age bracket) enrolled. Conversely, the age group of 5 to 9 year old has the lowest likelihood of being enrolled in a private school, with 12 (100.0% in the age bracket) attending a public institution.
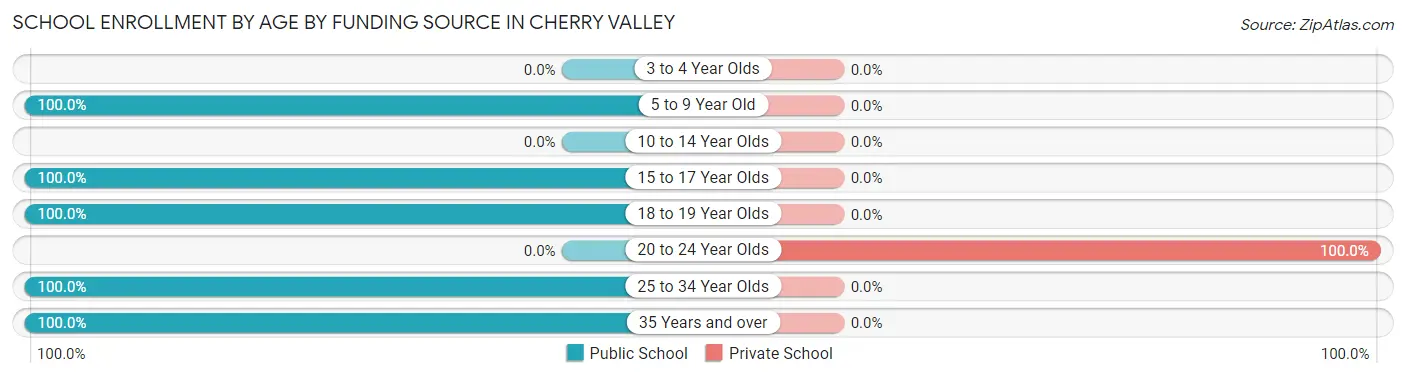
| Age Bracket | Public School | Private School |
| 3 to 4 Year Olds | 0 (0.0%) | 0 (0.0%) |
| 5 to 9 Year Old | 12 (100.0%) | 0 (0.0%) |
| 10 to 14 Year Olds | 0 (0.0%) | 0 (0.0%) |
| 15 to 17 Year Olds | 34 (100.0%) | 0 (0.0%) |
| 18 to 19 Year Olds | 13 (100.0%) | 0 (0.0%) |
| 20 to 24 Year Olds | 0 (0.0%) | 8 (100.0%) |
| 25 to 34 Year Olds | 1 (100.0%) | 0 (0.0%) |
| 35 Years and over | 8 (100.0%) | 0 (0.0%) |
| Total | 68 (89.5%) | 8 (10.5%) |
Educational Attainment by Field of Study in Cherry Valley
Visual & performing arts (51 | 33.3%), business (29 | 19.0%), science & technology (24 | 15.7%), arts & humanities (14 | 9.1%), and education (10 | 6.5%) are the most common fields of study among 153 individuals in Cherry Valley who have obtained a bachelor's degree or higher.
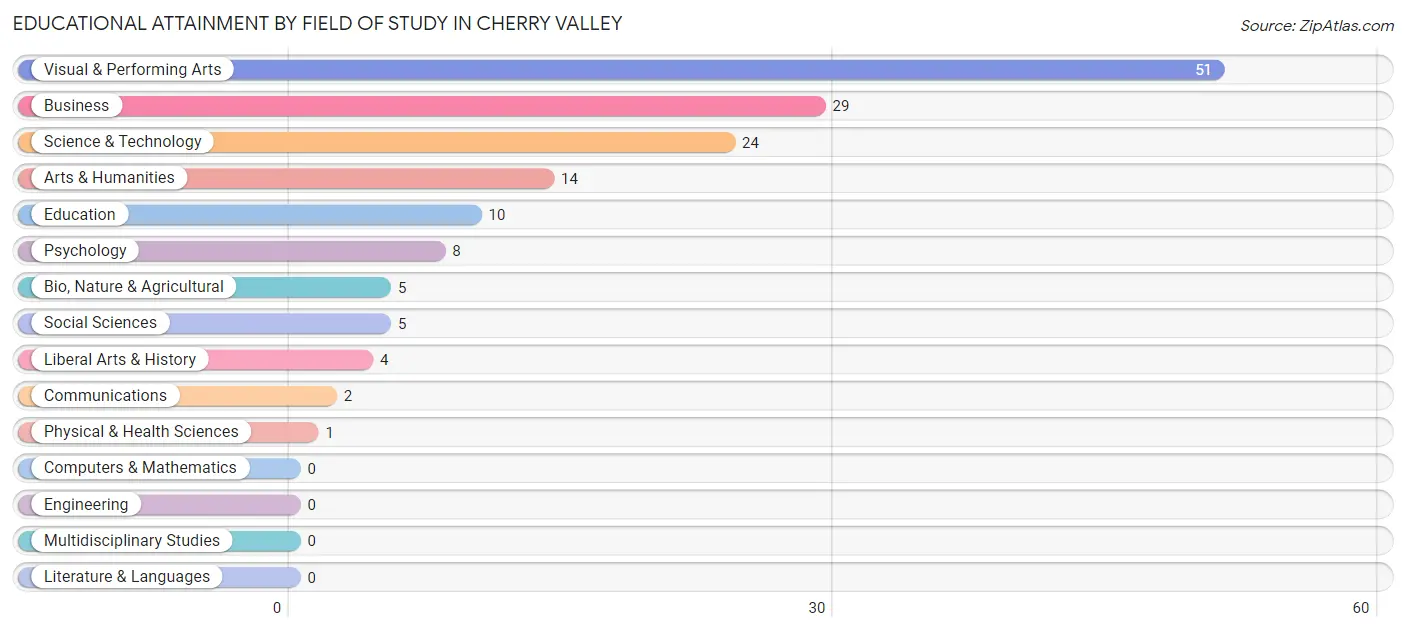
| Field of Study | # Graduates | % Graduates |
| Computers & Mathematics | 0 | 0.0% |
| Bio, Nature & Agricultural | 5 | 3.3% |
| Physical & Health Sciences | 1 | 0.6% |
| Psychology | 8 | 5.2% |
| Social Sciences | 5 | 3.3% |
| Engineering | 0 | 0.0% |
| Multidisciplinary Studies | 0 | 0.0% |
| Science & Technology | 24 | 15.7% |
| Business | 29 | 19.0% |
| Education | 10 | 6.5% |
| Literature & Languages | 0 | 0.0% |
| Liberal Arts & History | 4 | 2.6% |
| Visual & Performing Arts | 51 | 33.3% |
| Communications | 2 | 1.3% |
| Arts & Humanities | 14 | 9.1% |
| Total | 153 | 100.0% |
Transportation & Commute in Cherry Valley
Vehicle Availability by Sex in Cherry Valley
The most prevalent vehicle ownership categories in Cherry Valley are males with 3 vehicles (77, accounting for 51.0%) and females with 3 vehicles (36, making up 65.8%).
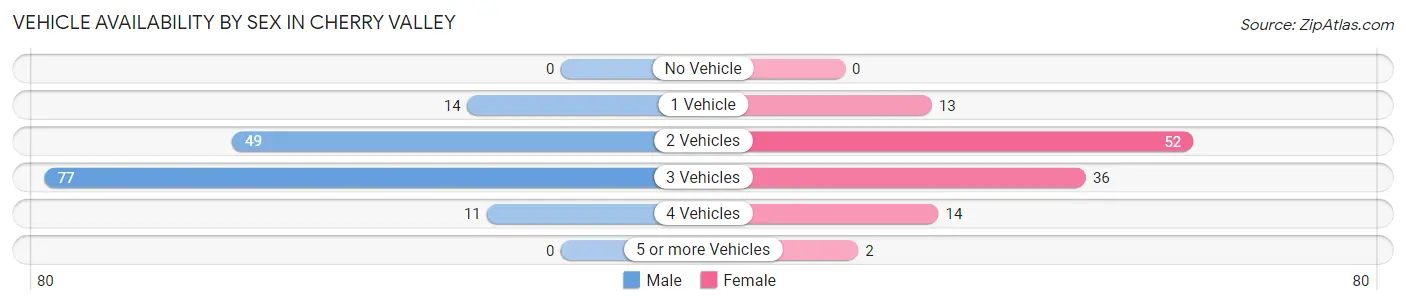
| Vehicles Available | Male | Female |
| No Vehicle | 0 (0.0%) | 0 (0.0%) |
| 1 Vehicle | 14 (9.3%) | 13 (11.1%) |
| 2 Vehicles | 49 (32.5%) | 52 (44.4%) |
| 3 Vehicles | 77 (51.0%) | 36 (30.8%) |
| 4 Vehicles | 11 (7.3%) | 14 (12.0%) |
| 5 or more Vehicles | 0 (0.0%) | 2 (1.7%) |
| Total | 151 (100.0%) | 117 (100.0%) |
Commute Time in Cherry Valley
The most frequently occuring commute durations in Cherry Valley are 20 to 24 minutes (102 commuters, 39.1%), 15 to 19 minutes (42 commuters, 16.1%), and 25 to 29 minutes (35 commuters, 13.4%).
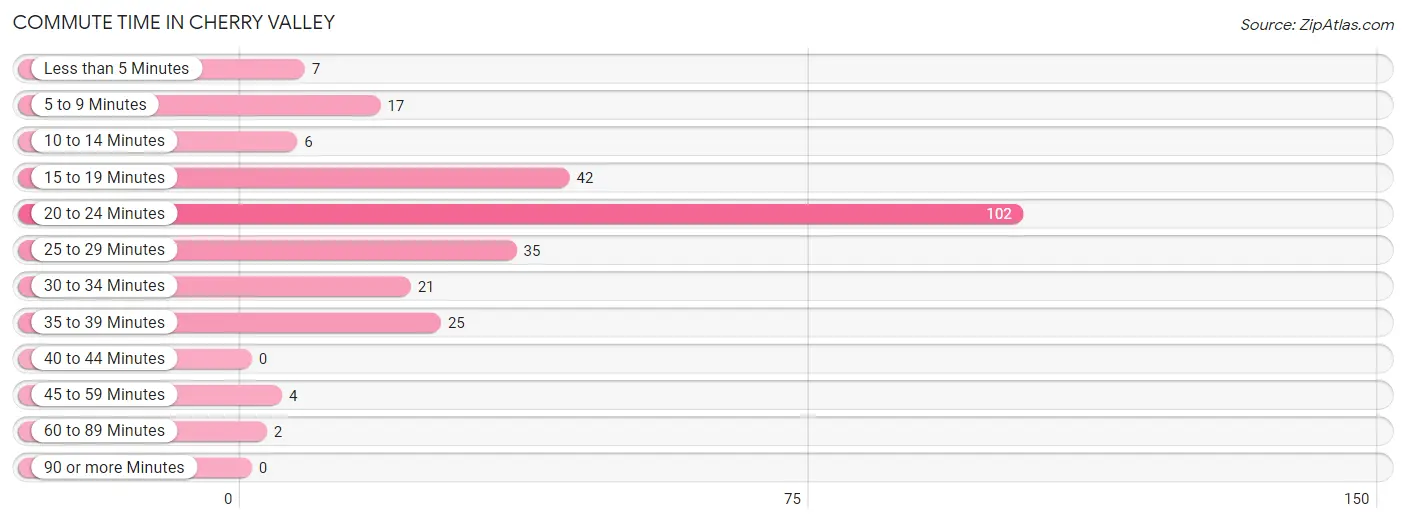
| Commute Time | # Commuters | % Commuters |
| Less than 5 Minutes | 7 | 2.7% |
| 5 to 9 Minutes | 17 | 6.5% |
| 10 to 14 Minutes | 6 | 2.3% |
| 15 to 19 Minutes | 42 | 16.1% |
| 20 to 24 Minutes | 102 | 39.1% |
| 25 to 29 Minutes | 35 | 13.4% |
| 30 to 34 Minutes | 21 | 8.1% |
| 35 to 39 Minutes | 25 | 9.6% |
| 40 to 44 Minutes | 0 | 0.0% |
| 45 to 59 Minutes | 4 | 1.5% |
| 60 to 89 Minutes | 2 | 0.8% |
| 90 or more Minutes | 0 | 0.0% |
Commute Time by Sex in Cherry Valley
The most common commute times in Cherry Valley are 20 to 24 minutes (71 commuters, 48.6%) for males and 15 to 19 minutes (33 commuters, 28.7%) for females.
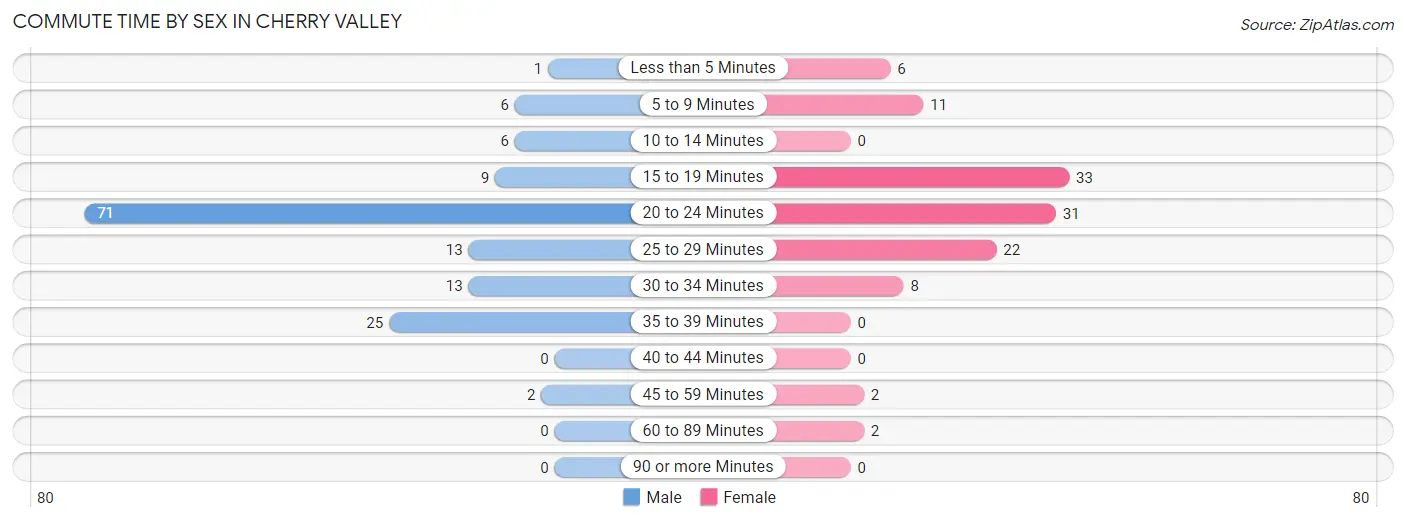
| Commute Time | Male | Female |
| Less than 5 Minutes | 1 (0.7%) | 6 (5.2%) |
| 5 to 9 Minutes | 6 (4.1%) | 11 (9.6%) |
| 10 to 14 Minutes | 6 (4.1%) | 0 (0.0%) |
| 15 to 19 Minutes | 9 (6.2%) | 33 (28.7%) |
| 20 to 24 Minutes | 71 (48.6%) | 31 (27.0%) |
| 25 to 29 Minutes | 13 (8.9%) | 22 (19.1%) |
| 30 to 34 Minutes | 13 (8.9%) | 8 (7.0%) |
| 35 to 39 Minutes | 25 (17.1%) | 0 (0.0%) |
| 40 to 44 Minutes | 0 (0.0%) | 0 (0.0%) |
| 45 to 59 Minutes | 2 (1.4%) | 2 (1.7%) |
| 60 to 89 Minutes | 0 (0.0%) | 2 (1.7%) |
| 90 or more Minutes | 0 (0.0%) | 0 (0.0%) |
Time of Departure to Work by Sex in Cherry Valley
The most frequent times of departure to work in Cherry Valley are 7:30 AM to 7:59 AM (63, 43.1%) for males and 7:00 AM to 7:29 AM (45, 39.1%) for females.

| Time of Departure | Male | Female |
| 12:00 AM to 4:59 AM | 1 (0.7%) | 0 (0.0%) |
| 5:00 AM to 5:29 AM | 3 (2.1%) | 0 (0.0%) |
| 5:30 AM to 5:59 AM | 6 (4.1%) | 0 (0.0%) |
| 6:00 AM to 6:29 AM | 4 (2.7%) | 24 (20.9%) |
| 6:30 AM to 6:59 AM | 28 (19.2%) | 5 (4.3%) |
| 7:00 AM to 7:29 AM | 11 (7.5%) | 45 (39.1%) |
| 7:30 AM to 7:59 AM | 63 (43.1%) | 14 (12.2%) |
| 8:00 AM to 8:29 AM | 0 (0.0%) | 9 (7.8%) |
| 8:30 AM to 8:59 AM | 6 (4.1%) | 0 (0.0%) |
| 9:00 AM to 9:59 AM | 9 (6.2%) | 0 (0.0%) |
| 10:00 AM to 10:59 AM | 0 (0.0%) | 0 (0.0%) |
| 11:00 AM to 11:59 AM | 0 (0.0%) | 0 (0.0%) |
| 12:00 PM to 3:59 PM | 15 (10.3%) | 10 (8.7%) |
| 4:00 PM to 11:59 PM | 0 (0.0%) | 8 (7.0%) |
| Total | 146 (100.0%) | 115 (100.0%) |
Housing Occupancy in Cherry Valley
Occupancy by Ownership in Cherry Valley
Of the total 159 dwellings in Cherry Valley, owner-occupied units account for 137 (86.2%), while renter-occupied units make up 22 (13.8%).
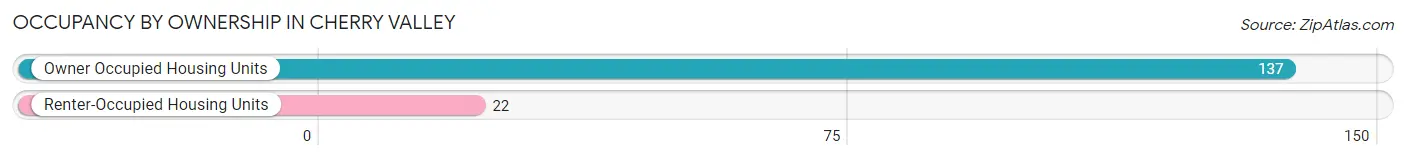
| Occupancy | # Housing Units | % Housing Units |
| Owner Occupied Housing Units | 137 | 86.2% |
| Renter-Occupied Housing Units | 22 | 13.8% |
| Total Occupied Housing Units | 159 | 100.0% |
Occupancy by Household Size in Cherry Valley
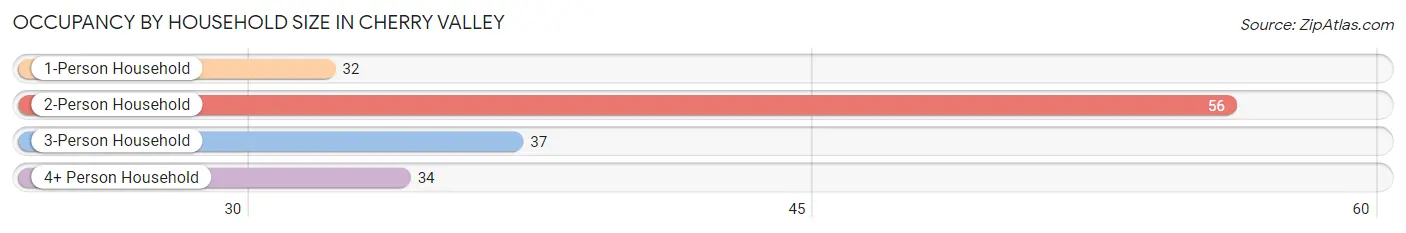
| Household Size | # Housing Units | % Housing Units |
| 1-Person Household | 32 | 20.1% |
| 2-Person Household | 56 | 35.2% |
| 3-Person Household | 37 | 23.3% |
| 4+ Person Household | 34 | 21.4% |
| Total Housing Units | 159 | 100.0% |
Occupancy by Ownership by Household Size in Cherry Valley
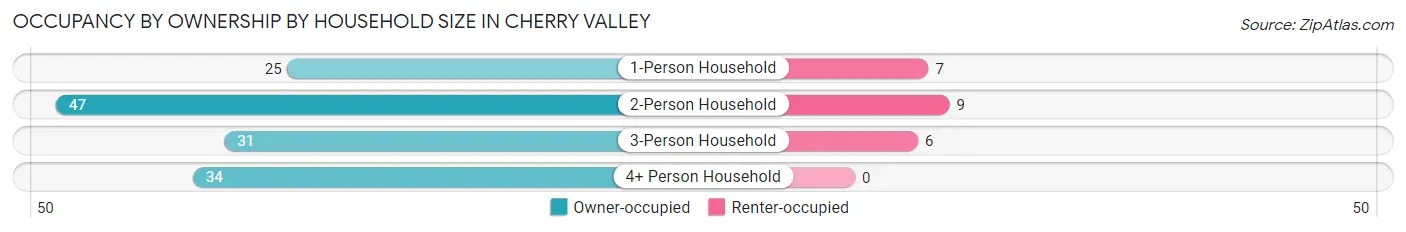
| Household Size | Owner-occupied | Renter-occupied |
| 1-Person Household | 25 (78.1%) | 7 (21.9%) |
| 2-Person Household | 47 (83.9%) | 9 (16.1%) |
| 3-Person Household | 31 (83.8%) | 6 (16.2%) |
| 4+ Person Household | 34 (100.0%) | 0 (0.0%) |
| Total Housing Units | 137 (86.2%) | 22 (13.8%) |
Occupancy by Educational Attainment in Cherry Valley
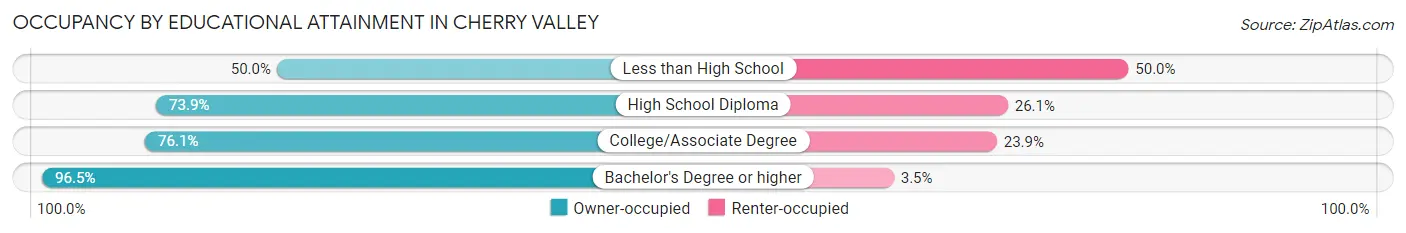
| Household Size | Owner-occupied | Renter-occupied |
| Less than High School | 2 (50.0%) | 2 (50.0%) |
| High School Diploma | 17 (73.9%) | 6 (26.1%) |
| College/Associate Degree | 35 (76.1%) | 11 (23.9%) |
| Bachelor's Degree or higher | 83 (96.5%) | 3 (3.5%) |
Occupancy by Age of Householder in Cherry Valley
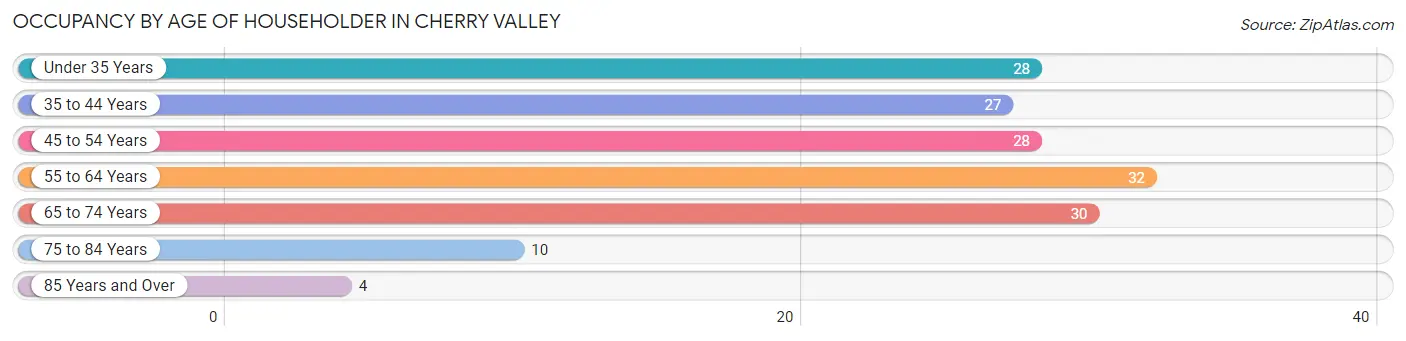
| Age Bracket | # Households | % Households |
| Under 35 Years | 28 | 17.6% |
| 35 to 44 Years | 27 | 17.0% |
| 45 to 54 Years | 28 | 17.6% |
| 55 to 64 Years | 32 | 20.1% |
| 65 to 74 Years | 30 | 18.9% |
| 75 to 84 Years | 10 | 6.3% |
| 85 Years and Over | 4 | 2.5% |
| Total | 159 | 100.0% |
Housing Finances in Cherry Valley
Median Income by Occupancy in Cherry Valley
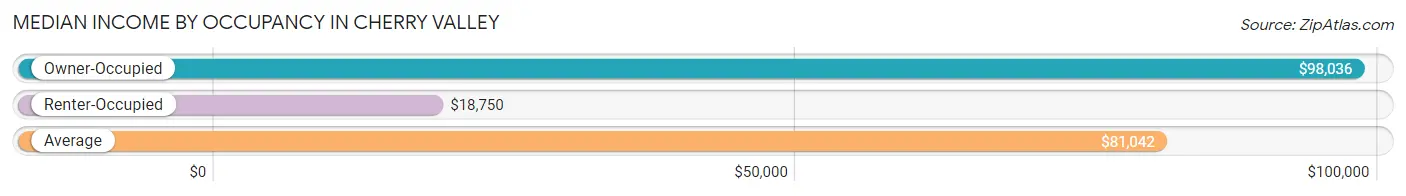
| Occupancy Type | # Households | Median Income |
| Owner-Occupied | 137 (86.2%) | $98,036 |
| Renter-Occupied | 22 (13.8%) | $18,750 |
| Average | 159 (100.0%) | $81,042 |
Occupancy by Householder Income Bracket in Cherry Valley
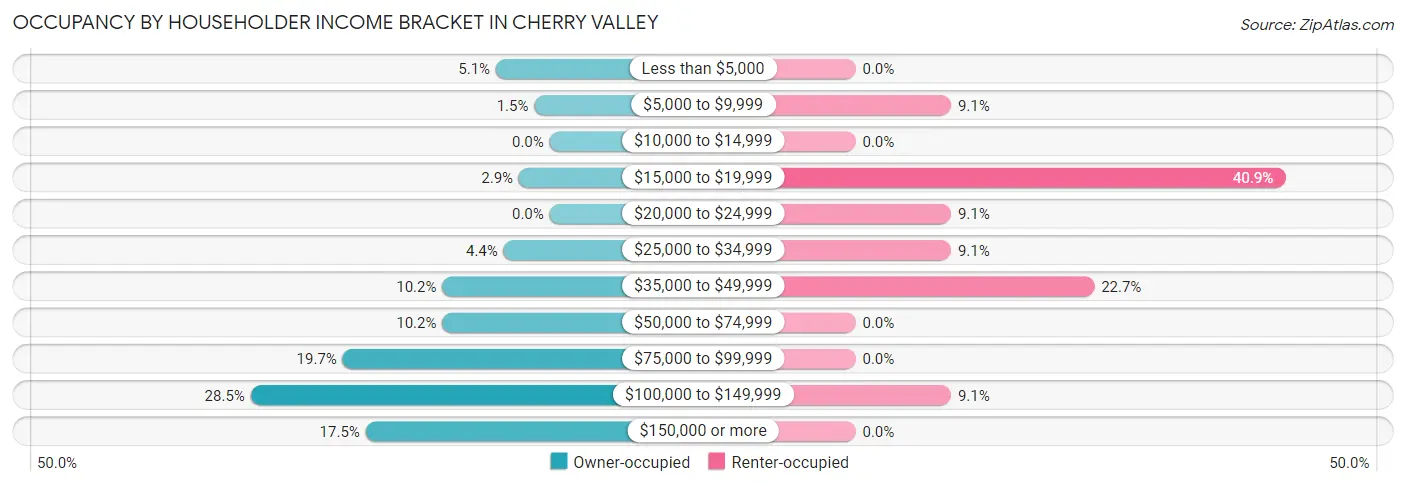
| Income Bracket | Owner-occupied | Renter-occupied |
| Less than $5,000 | 7 (5.1%) | 0 (0.0%) |
| $5,000 to $9,999 | 2 (1.5%) | 2 (9.1%) |
| $10,000 to $14,999 | 0 (0.0%) | 0 (0.0%) |
| $15,000 to $19,999 | 4 (2.9%) | 9 (40.9%) |
| $20,000 to $24,999 | 0 (0.0%) | 2 (9.1%) |
| $25,000 to $34,999 | 6 (4.4%) | 2 (9.1%) |
| $35,000 to $49,999 | 14 (10.2%) | 5 (22.7%) |
| $50,000 to $74,999 | 14 (10.2%) | 0 (0.0%) |
| $75,000 to $99,999 | 27 (19.7%) | 0 (0.0%) |
| $100,000 to $149,999 | 39 (28.5%) | 2 (9.1%) |
| $150,000 or more | 24 (17.5%) | 0 (0.0%) |
| Total | 137 (100.0%) | 22 (100.0%) |
Monthly Housing Cost Tiers in Cherry Valley
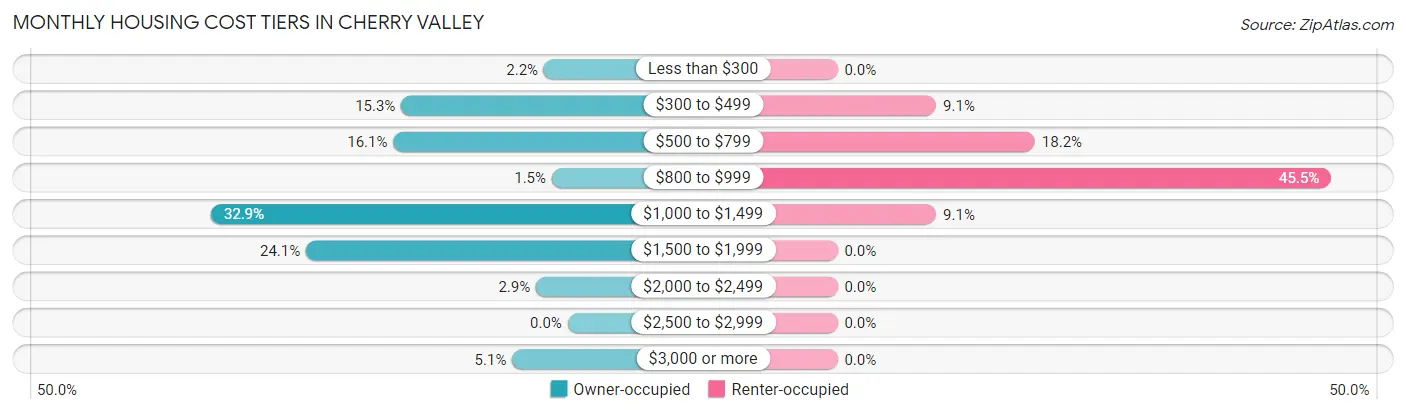
| Monthly Cost | Owner-occupied | Renter-occupied |
| Less than $300 | 3 (2.2%) | 0 (0.0%) |
| $300 to $499 | 21 (15.3%) | 2 (9.1%) |
| $500 to $799 | 22 (16.1%) | 4 (18.2%) |
| $800 to $999 | 2 (1.5%) | 10 (45.5%) |
| $1,000 to $1,499 | 45 (32.9%) | 2 (9.1%) |
| $1,500 to $1,999 | 33 (24.1%) | 0 (0.0%) |
| $2,000 to $2,499 | 4 (2.9%) | 0 (0.0%) |
| $2,500 to $2,999 | 0 (0.0%) | 0 (0.0%) |
| $3,000 or more | 7 (5.1%) | 0 (0.0%) |
| Total | 137 (100.0%) | 22 (100.0%) |
Physical Housing Characteristics in Cherry Valley
Housing Structures in Cherry Valley
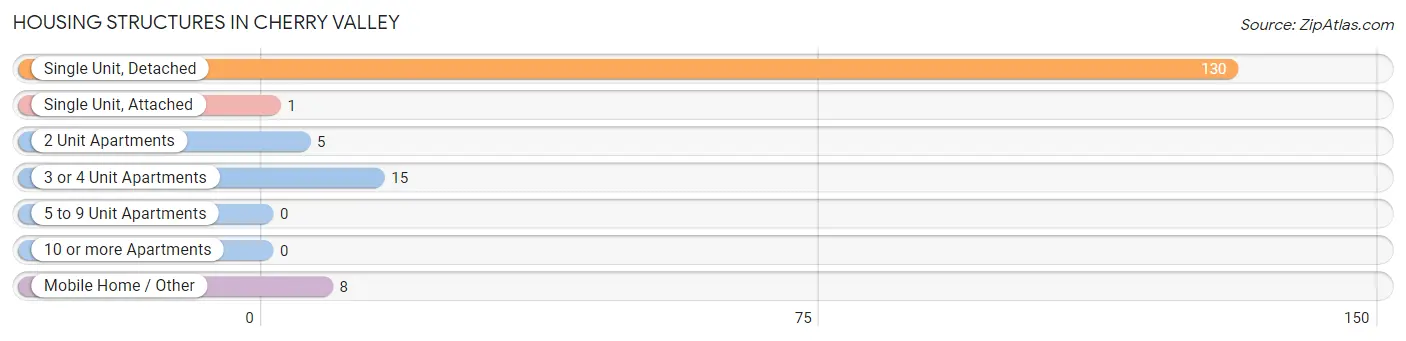
| Structure Type | # Housing Units | % Housing Units |
| Single Unit, Detached | 130 | 81.8% |
| Single Unit, Attached | 1 | 0.6% |
| 2 Unit Apartments | 5 | 3.1% |
| 3 or 4 Unit Apartments | 15 | 9.4% |
| 5 to 9 Unit Apartments | 0 | 0.0% |
| 10 or more Apartments | 0 | 0.0% |
| Mobile Home / Other | 8 | 5.0% |
| Total | 159 | 100.0% |
Housing Structures by Occupancy in Cherry Valley
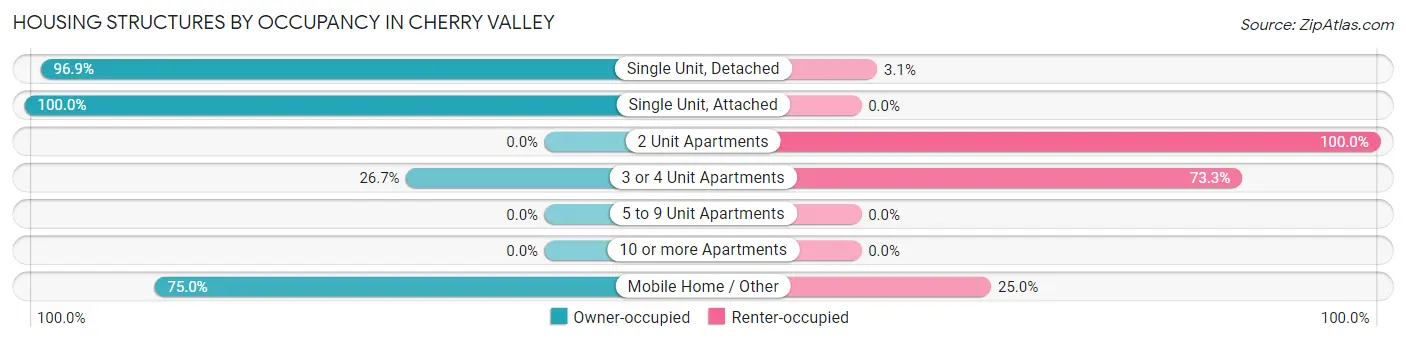
| Structure Type | Owner-occupied | Renter-occupied |
| Single Unit, Detached | 126 (96.9%) | 4 (3.1%) |
| Single Unit, Attached | 1 (100.0%) | 0 (0.0%) |
| 2 Unit Apartments | 0 (0.0%) | 5 (100.0%) |
| 3 or 4 Unit Apartments | 4 (26.7%) | 11 (73.3%) |
| 5 to 9 Unit Apartments | 0 (0.0%) | 0 (0.0%) |
| 10 or more Apartments | 0 (0.0%) | 0 (0.0%) |
| Mobile Home / Other | 6 (75.0%) | 2 (25.0%) |
| Total | 137 (86.2%) | 22 (13.8%) |
Housing Structures by Number of Rooms in Cherry Valley
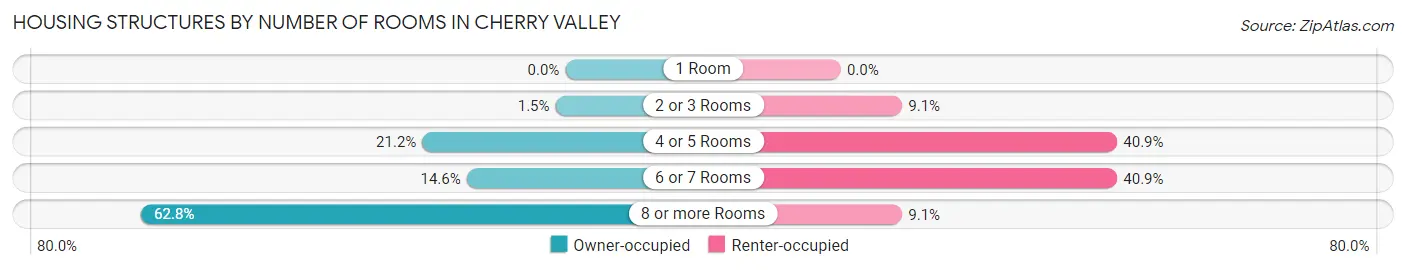
| Number of Rooms | Owner-occupied | Renter-occupied |
| 1 Room | 0 (0.0%) | 0 (0.0%) |
| 2 or 3 Rooms | 2 (1.5%) | 2 (9.1%) |
| 4 or 5 Rooms | 29 (21.2%) | 9 (40.9%) |
| 6 or 7 Rooms | 20 (14.6%) | 9 (40.9%) |
| 8 or more Rooms | 86 (62.8%) | 2 (9.1%) |
| Total | 137 (100.0%) | 22 (100.0%) |
Housing Structure by Heating Type in Cherry Valley
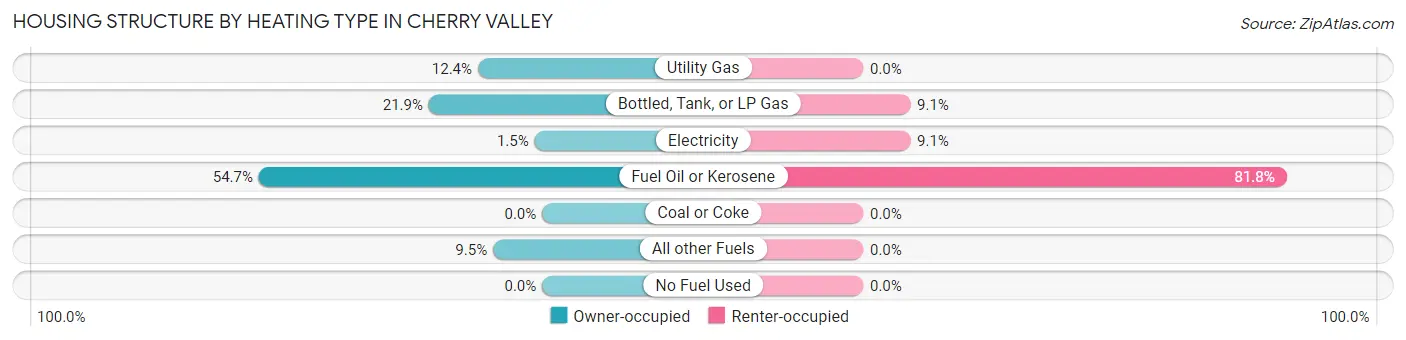
| Heating Type | Owner-occupied | Renter-occupied |
| Utility Gas | 17 (12.4%) | 0 (0.0%) |
| Bottled, Tank, or LP Gas | 30 (21.9%) | 2 (9.1%) |
| Electricity | 2 (1.5%) | 2 (9.1%) |
| Fuel Oil or Kerosene | 75 (54.7%) | 18 (81.8%) |
| Coal or Coke | 0 (0.0%) | 0 (0.0%) |
| All other Fuels | 13 (9.5%) | 0 (0.0%) |
| No Fuel Used | 0 (0.0%) | 0 (0.0%) |
| Total | 137 (100.0%) | 22 (100.0%) |
Household Vehicle Usage in Cherry Valley
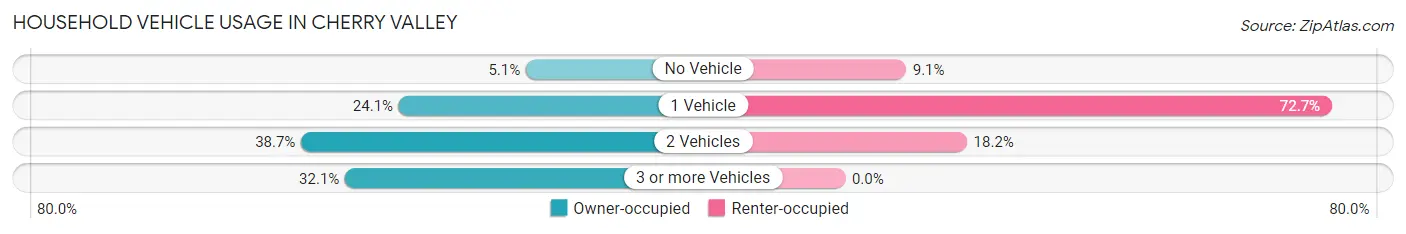
| Vehicles per Household | Owner-occupied | Renter-occupied |
| No Vehicle | 7 (5.1%) | 2 (9.1%) |
| 1 Vehicle | 33 (24.1%) | 16 (72.7%) |
| 2 Vehicles | 53 (38.7%) | 4 (18.2%) |
| 3 or more Vehicles | 44 (32.1%) | 0 (0.0%) |
| Total | 137 (100.0%) | 22 (100.0%) |
Real Estate & Mortgages in Cherry Valley
Real Estate and Mortgage Overview in Cherry Valley
| Characteristic | Without Mortgage | With Mortgage |
| Housing Units | 63 | 74 |
| Median Property Value | $184,900 | $164,300 |
| Median Household Income | $77,292 | $21 |
| Monthly Housing Costs | $554 | $7 |
| Real Estate Taxes | $2,548 | $0 |
Property Value by Mortgage Status in Cherry Valley
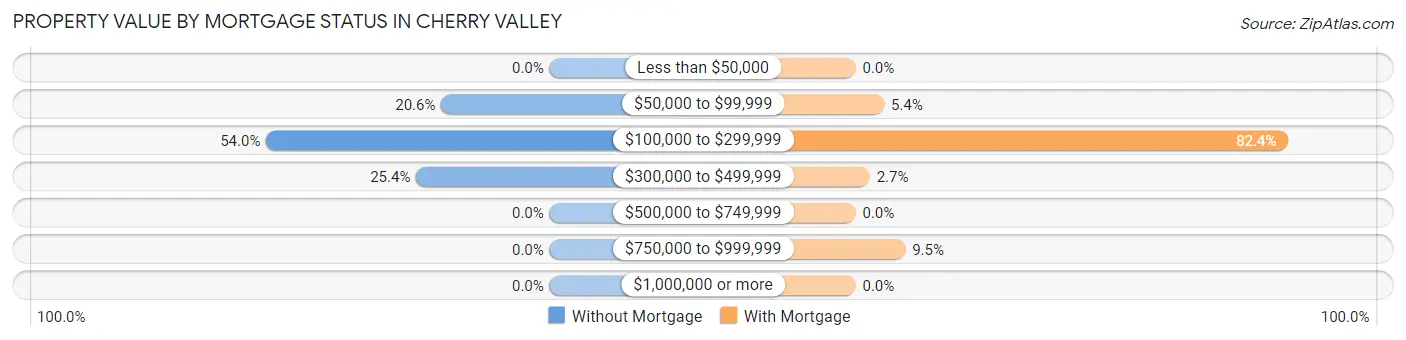
| Property Value | Without Mortgage | With Mortgage |
| Less than $50,000 | 0 (0.0%) | 0 (0.0%) |
| $50,000 to $99,999 | 13 (20.6%) | 4 (5.4%) |
| $100,000 to $299,999 | 34 (54.0%) | 61 (82.4%) |
| $300,000 to $499,999 | 16 (25.4%) | 2 (2.7%) |
| $500,000 to $749,999 | 0 (0.0%) | 0 (0.0%) |
| $750,000 to $999,999 | 0 (0.0%) | 7 (9.5%) |
| $1,000,000 or more | 0 (0.0%) | 0 (0.0%) |
| Total | 63 (100.0%) | 74 (100.0%) |
Household Income by Mortgage Status in Cherry Valley
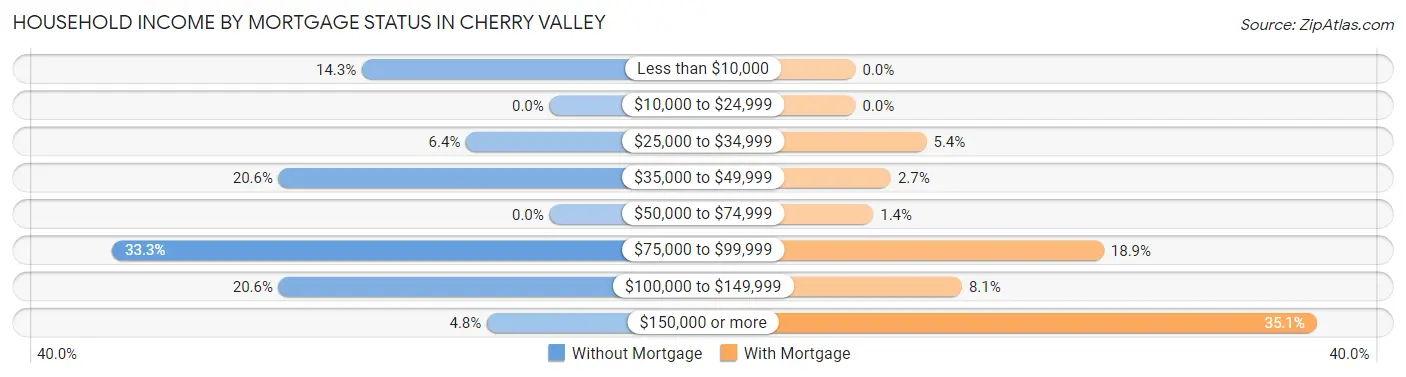
| Household Income | Without Mortgage | With Mortgage |
| Less than $10,000 | 9 (14.3%) | 0 (0.0%) |
| $10,000 to $24,999 | 0 (0.0%) | 0 (0.0%) |
| $25,000 to $34,999 | 4 (6.4%) | 4 (5.4%) |
| $35,000 to $49,999 | 13 (20.6%) | 2 (2.7%) |
| $50,000 to $74,999 | 0 (0.0%) | 1 (1.3%) |
| $75,000 to $99,999 | 21 (33.3%) | 14 (18.9%) |
| $100,000 to $149,999 | 13 (20.6%) | 6 (8.1%) |
| $150,000 or more | 3 (4.8%) | 26 (35.1%) |
| Total | 63 (100.0%) | 74 (100.0%) |
Property Value to Household Income Ratio in Cherry Valley
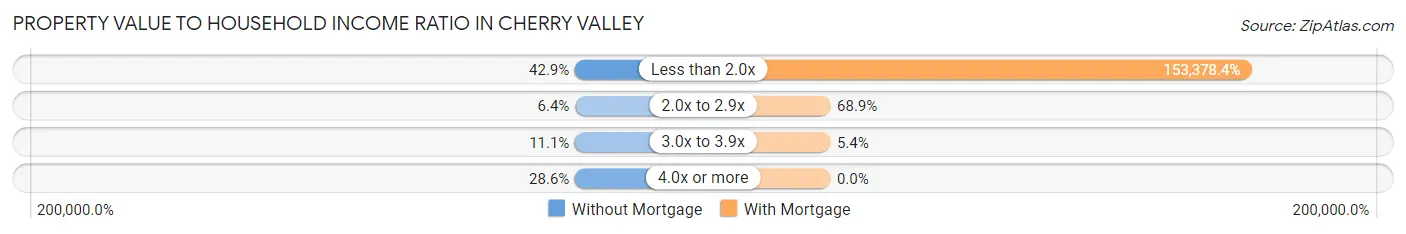
| Value-to-Income Ratio | Without Mortgage | With Mortgage |
| Less than 2.0x | 27 (42.9%) | 113,500 (153,378.4%) |
| 2.0x to 2.9x | 4 (6.4%) | 51 (68.9%) |
| 3.0x to 3.9x | 7 (11.1%) | 4 (5.4%) |
| 4.0x or more | 18 (28.6%) | 0 (0.0%) |
| Total | 63 (100.0%) | 74 (100.0%) |
Real Estate Taxes by Mortgage Status in Cherry Valley
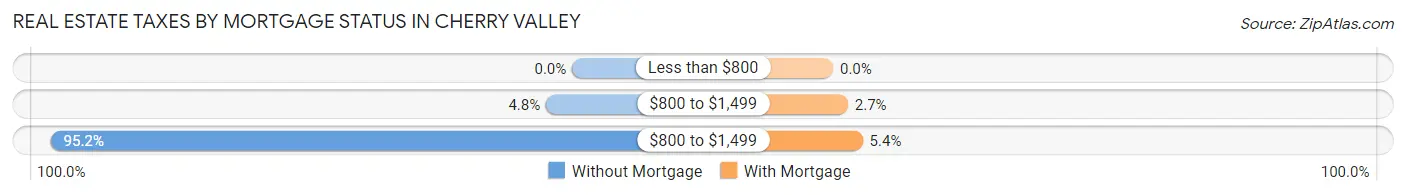
| Property Taxes | Without Mortgage | With Mortgage |
| Less than $800 | 0 (0.0%) | 0 (0.0%) |
| $800 to $1,499 | 3 (4.8%) | 2 (2.7%) |
| $800 to $1,499 | 60 (95.2%) | 4 (5.4%) |
| Total | 63 (100.0%) | 74 (100.0%) |
Health & Disability in Cherry Valley
Health Insurance Coverage by Age in Cherry Valley
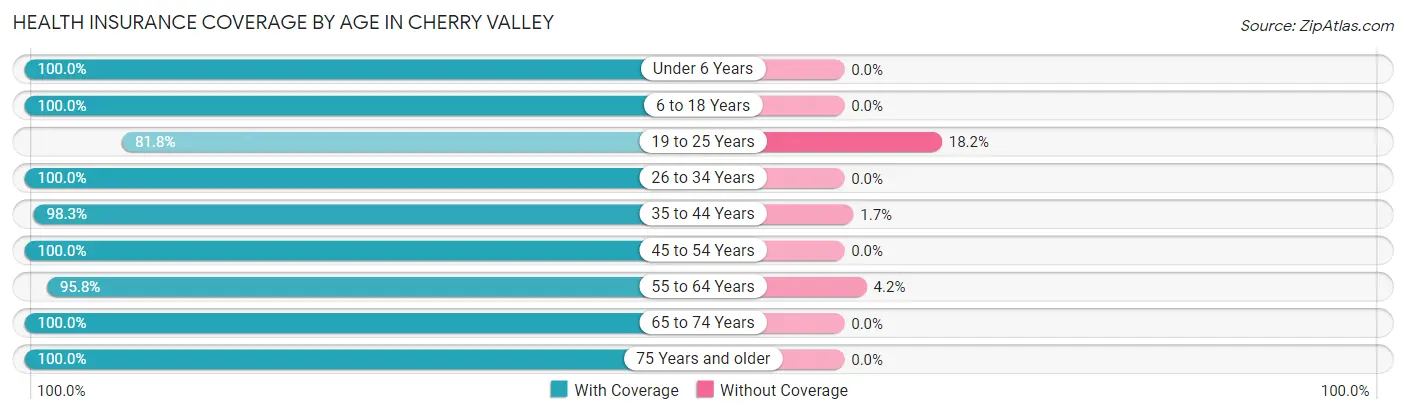
| Age Bracket | With Coverage | Without Coverage |
| Under 6 Years | 28 (100.0%) | 0 (0.0%) |
| 6 to 18 Years | 75 (100.0%) | 0 (0.0%) |
| 19 to 25 Years | 90 (81.8%) | 20 (18.2%) |
| 26 to 34 Years | 42 (100.0%) | 0 (0.0%) |
| 35 to 44 Years | 58 (98.3%) | 1 (1.7%) |
| 45 to 54 Years | 52 (100.0%) | 0 (0.0%) |
| 55 to 64 Years | 69 (95.8%) | 3 (4.2%) |
| 65 to 74 Years | 39 (100.0%) | 0 (0.0%) |
| 75 Years and older | 39 (100.0%) | 0 (0.0%) |
| Total | 492 (95.4%) | 24 (4.6%) |
Health Insurance Coverage by Citizenship Status in Cherry Valley
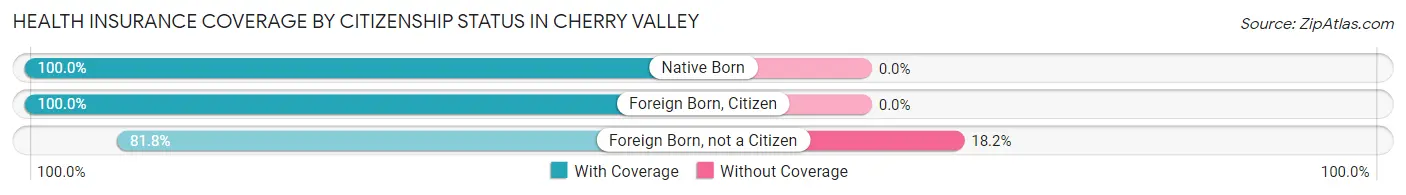
| Citizenship Status | With Coverage | Without Coverage |
| Native Born | 28 (100.0%) | 0 (0.0%) |
| Foreign Born, Citizen | 75 (100.0%) | 0 (0.0%) |
| Foreign Born, not a Citizen | 90 (81.8%) | 20 (18.2%) |
Health Insurance Coverage by Household Income in Cherry Valley
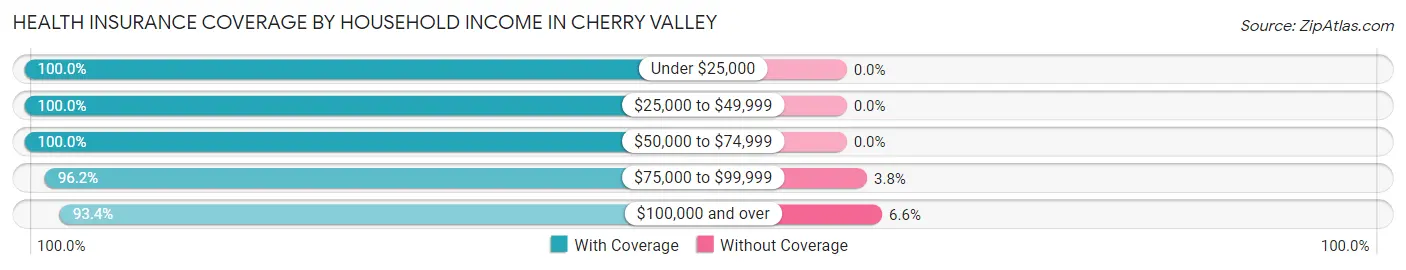
| Household Income | With Coverage | Without Coverage |
| Under $25,000 | 43 (100.0%) | 0 (0.0%) |
| $25,000 to $49,999 | 67 (100.0%) | 0 (0.0%) |
| $50,000 to $74,999 | 21 (100.0%) | 0 (0.0%) |
| $75,000 to $99,999 | 76 (96.2%) | 3 (3.8%) |
| $100,000 and over | 282 (93.4%) | 20 (6.6%) |
Public vs Private Health Insurance Coverage by Age in Cherry Valley
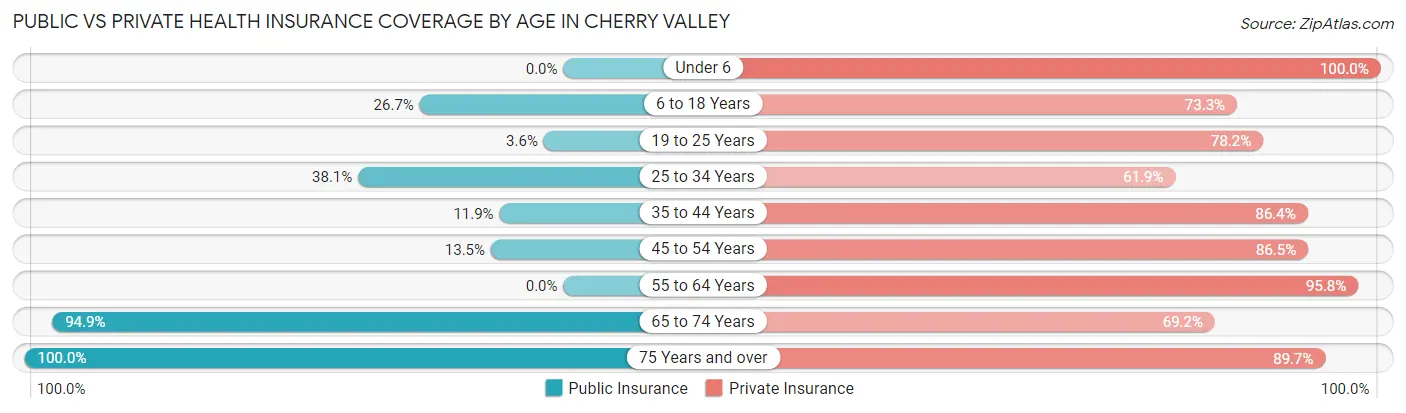
| Age Bracket | Public Insurance | Private Insurance |
| Under 6 | 0 (0.0%) | 28 (100.0%) |
| 6 to 18 Years | 20 (26.7%) | 55 (73.3%) |
| 19 to 25 Years | 4 (3.6%) | 86 (78.2%) |
| 25 to 34 Years | 16 (38.1%) | 26 (61.9%) |
| 35 to 44 Years | 7 (11.9%) | 51 (86.4%) |
| 45 to 54 Years | 7 (13.5%) | 45 (86.5%) |
| 55 to 64 Years | 0 (0.0%) | 69 (95.8%) |
| 65 to 74 Years | 37 (94.9%) | 27 (69.2%) |
| 75 Years and over | 39 (100.0%) | 35 (89.7%) |
| Total | 130 (25.2%) | 422 (81.8%) |
Disability Status by Sex by Age in Cherry Valley
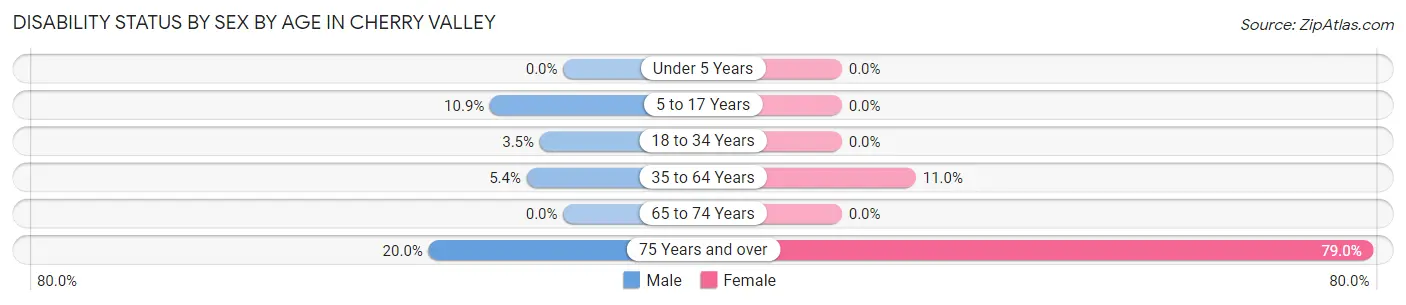
| Age Bracket | Male | Female |
| Under 5 Years | 0 (0.0%) | 0 (0.0%) |
| 5 to 17 Years | 5 (10.9%) | 0 (0.0%) |
| 18 to 34 Years | 3 (3.5%) | 0 (0.0%) |
| 35 to 64 Years | 5 (5.4%) | 10 (11.0%) |
| 65 to 74 Years | 0 (0.0%) | 0 (0.0%) |
| 75 Years and over | 4 (20.0%) | 15 (78.9%) |
Disability Class by Sex by Age in Cherry Valley
Disability Class: Hearing Difficulty
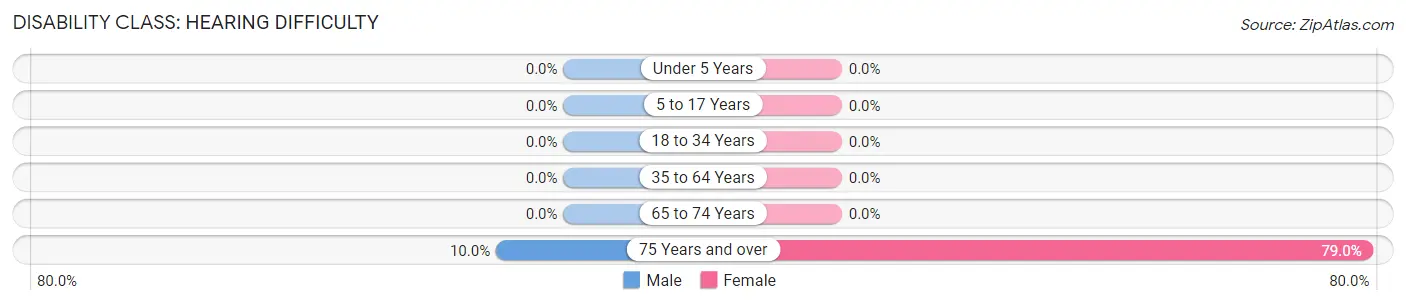
| Age Bracket | Male | Female |
| Under 5 Years | 0 (0.0%) | 0 (0.0%) |
| 5 to 17 Years | 0 (0.0%) | 0 (0.0%) |
| 18 to 34 Years | 0 (0.0%) | 0 (0.0%) |
| 35 to 64 Years | 0 (0.0%) | 0 (0.0%) |
| 65 to 74 Years | 0 (0.0%) | 0 (0.0%) |
| 75 Years and over | 2 (10.0%) | 15 (78.9%) |
Disability Class: Vision Difficulty
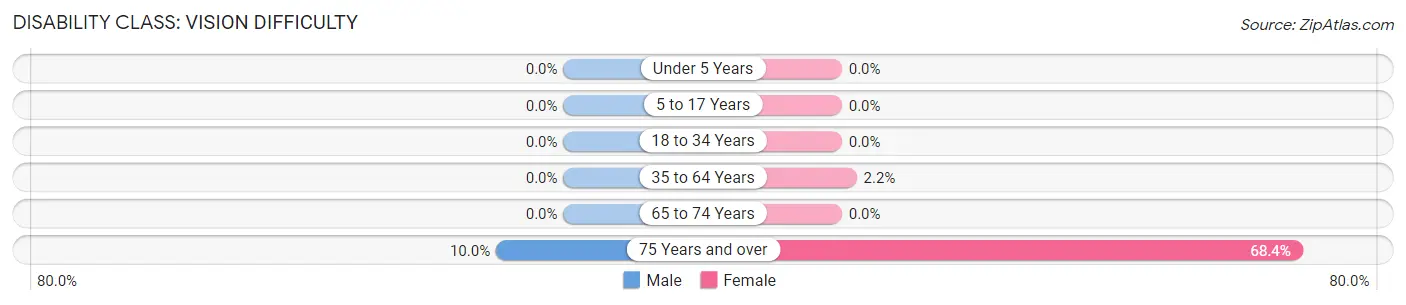
| Age Bracket | Male | Female |
| Under 5 Years | 0 (0.0%) | 0 (0.0%) |
| 5 to 17 Years | 0 (0.0%) | 0 (0.0%) |
| 18 to 34 Years | 0 (0.0%) | 0 (0.0%) |
| 35 to 64 Years | 0 (0.0%) | 2 (2.2%) |
| 65 to 74 Years | 0 (0.0%) | 0 (0.0%) |
| 75 Years and over | 2 (10.0%) | 13 (68.4%) |
Disability Class: Cognitive Difficulty
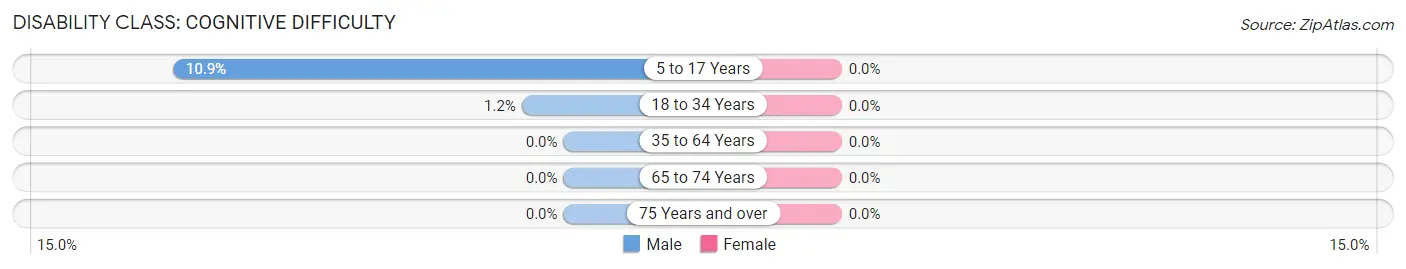
| Age Bracket | Male | Female |
| 5 to 17 Years | 5 (10.9%) | 0 (0.0%) |
| 18 to 34 Years | 1 (1.2%) | 0 (0.0%) |
| 35 to 64 Years | 0 (0.0%) | 0 (0.0%) |
| 65 to 74 Years | 0 (0.0%) | 0 (0.0%) |
| 75 Years and over | 0 (0.0%) | 0 (0.0%) |
Disability Class: Ambulatory Difficulty
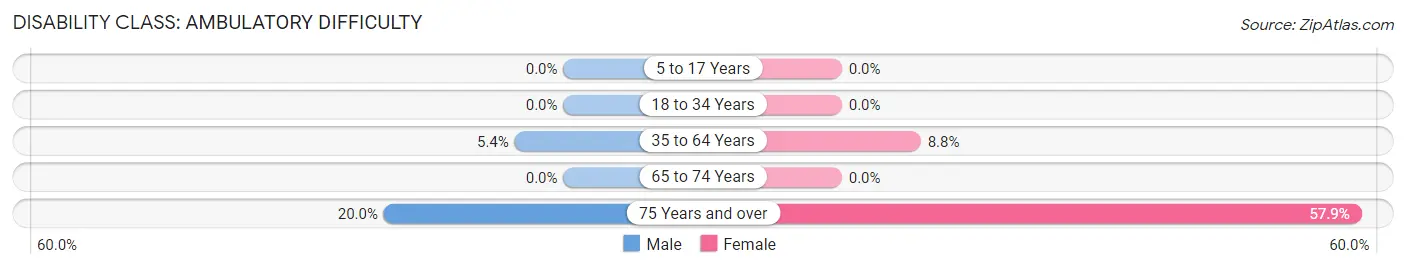
| Age Bracket | Male | Female |
| 5 to 17 Years | 0 (0.0%) | 0 (0.0%) |
| 18 to 34 Years | 0 (0.0%) | 0 (0.0%) |
| 35 to 64 Years | 5 (5.4%) | 8 (8.8%) |
| 65 to 74 Years | 0 (0.0%) | 0 (0.0%) |
| 75 Years and over | 4 (20.0%) | 11 (57.9%) |
Disability Class: Self-Care Difficulty
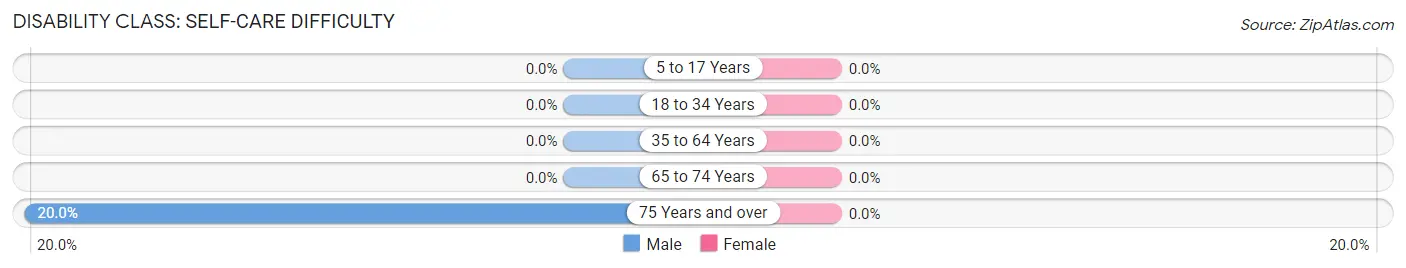
| Age Bracket | Male | Female |
| 5 to 17 Years | 0 (0.0%) | 0 (0.0%) |
| 18 to 34 Years | 0 (0.0%) | 0 (0.0%) |
| 35 to 64 Years | 0 (0.0%) | 0 (0.0%) |
| 65 to 74 Years | 0 (0.0%) | 0 (0.0%) |
| 75 Years and over | 4 (20.0%) | 0 (0.0%) |
Technology Access in Cherry Valley
Computing Device Access in Cherry Valley
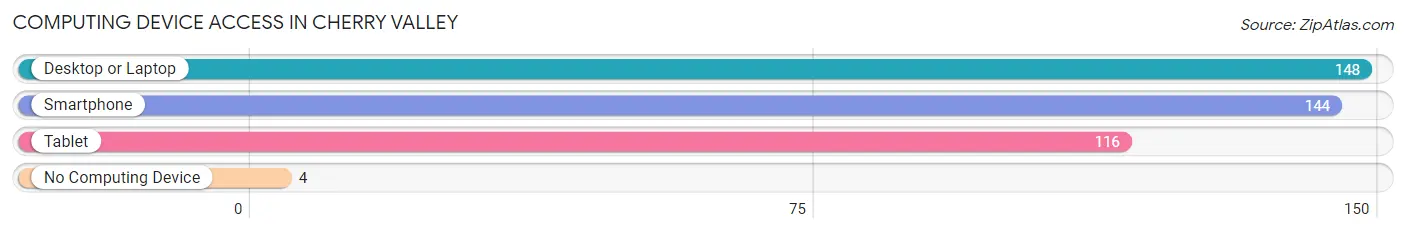
| Device Type | # Households | % Households |
| Desktop or Laptop | 148 | 93.1% |
| Smartphone | 144 | 90.6% |
| Tablet | 116 | 73.0% |
| No Computing Device | 4 | 2.5% |
| Total | 159 | 100.0% |
Internet Access in Cherry Valley
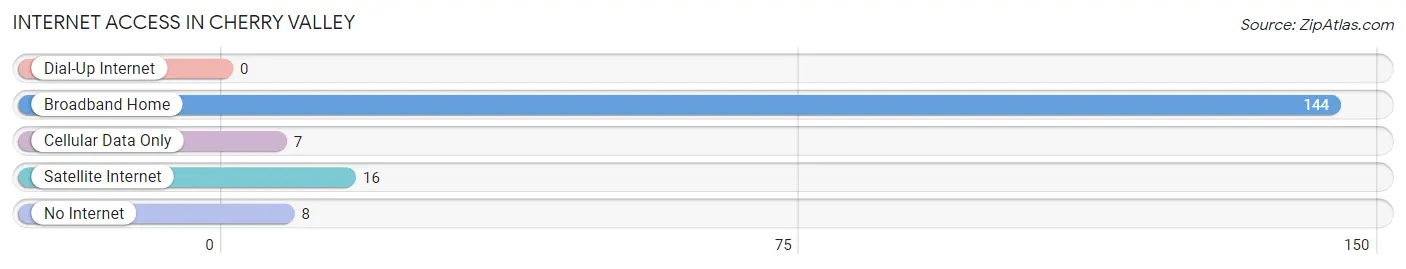
| Internet Type | # Households | % Households |
| Dial-Up Internet | 0 | 0.0% |
| Broadband Home | 144 | 90.6% |
| Cellular Data Only | 7 | 4.4% |
| Satellite Internet | 16 | 10.1% |
| No Internet | 8 | 5.0% |
| Total | 159 | 100.0% |
Cherry Valley Summary
Cherry Valley is a small village located in the state of New York. It is situated in the foothills of the Catskill Mountains, in Otsego County. The village is located on the banks of the Cherry Valley Creek, which is a tributary of the Susquehanna River. The village has a population of approximately 1,000 people and covers an area of 0.6 square miles.
History
The area that is now Cherry Valley was originally inhabited by the Iroquois Native American tribe. The first European settlers arrived in the area in the late 1700s. The village was founded in 1790 by a group of settlers from Connecticut. The village was named after the Cherry Valley Creek, which was named for the abundance of wild cherry trees in the area.
The village grew slowly over the next few decades, and by the mid-1800s it had become a thriving agricultural community. The village was home to several mills, including a grist mill, a saw mill, and a woolen mill. The village also had a tannery, a blacksmith shop, and several stores.
In the late 1800s, the village began to decline as the local economy shifted away from agriculture. The mills and other businesses closed, and many of the residents moved away. The village was revitalized in the early 1900s when the New York Central Railroad built a line through the village. This allowed the village to become a popular tourist destination, and it remains so today.
Geography
Cherry Valley is located in the foothills of the Catskill Mountains, in Otsego County. The village is situated on the banks of the Cherry Valley Creek, which is a tributary of the Susquehanna River. The village is surrounded by rolling hills and forests, and is located approximately 30 miles from the city of Albany.
The climate in Cherry Valley is humid continental, with cold winters and warm summers. The average annual temperature is around 50 degrees Fahrenheit, and the average annual precipitation is around 40 inches.
Economy
The economy of Cherry Valley is largely based on tourism. The village is a popular destination for outdoor activities such as fishing, hunting, and hiking. The village is also home to several bed and breakfasts, restaurants, and shops.
The village is also home to several small businesses, including a lumber yard, a hardware store, and a grocery store. The village is also home to a small manufacturing plant that produces plastic products.
Demographics
As of the 2010 census, the population of Cherry Valley was 1,000 people. The racial makeup of the village was 97.2% White, 0.7% African American, 0.3% Native American, 0.3% Asian, and 1.5% from other races. The median household income was $41,250, and the median family income was $50,000.
The village is home to several churches, including the Cherry Valley United Methodist Church, the Cherry Valley Presbyterian Church, and the Cherry Valley Baptist Church. The village is also home to a public library, a post office, and a fire department.
Common Questions
What is Per Capita Income in Cherry Valley?
Per Capita income in Cherry Valley is $33,496.
What is the Median Family Income in Cherry Valley?
Median Family Income in Cherry Valley is $112,833.
What is the Median Household income in Cherry Valley?
Median Household Income in Cherry Valley is $81,042.
What is Income or Wage Gap in Cherry Valley?
Income or Wage Gap in Cherry Valley is 41.1%.
Women in Cherry Valley earn 58.9 cents for every dollar earned by a man.
What is Family Income Deficit in Cherry Valley?
Family Income Deficit in Cherry Valley is $4,782.
Families that are below poverty line in Cherry Valley earn $4,782 less on average than the poverty threshold level.
What is Inequality or Gini Index in Cherry Valley?
Inequality or Gini Index in Cherry Valley is 0.40.
What is the Total Population of Cherry Valley?
Total Population of Cherry Valley is 516.
What is the Total Male Population of Cherry Valley?
Total Male Population of Cherry Valley is 287.
What is the Total Female Population of Cherry Valley?
Total Female Population of Cherry Valley is 229.
What is the Ratio of Males per 100 Females in Cherry Valley?
There are 125.33 Males per 100 Females in Cherry Valley.
What is the Ratio of Females per 100 Males in Cherry Valley?
There are 79.79 Females per 100 Males in Cherry Valley.
What is the Median Population Age in Cherry Valley?
Median Population Age in Cherry Valley is 37.5 Years.
What is the Average Family Size in Cherry Valley
Average Family Size in Cherry Valley is 3.6 People.
What is the Average Household Size in Cherry Valley
Average Household Size in Cherry Valley is 3.2 People.
How Large is the Labor Force in Cherry Valley?
There are 301 People in the Labor Forcein in Cherry Valley.
What is the Percentage of People in the Labor Force in Cherry Valley?
67.3% of People are in the Labor Force in Cherry Valley.
What is the Unemployment Rate in Cherry Valley?
Unemployment Rate in Cherry Valley is 5.6%.