Zip Codes with the Highest Percentage of Population Employed in Food Preparation & Serving in Valley Stream, NY
RELATED REPORTS & OPTIONS
Food Preparation & Serving
Valley Stream
Compare Zip Codes
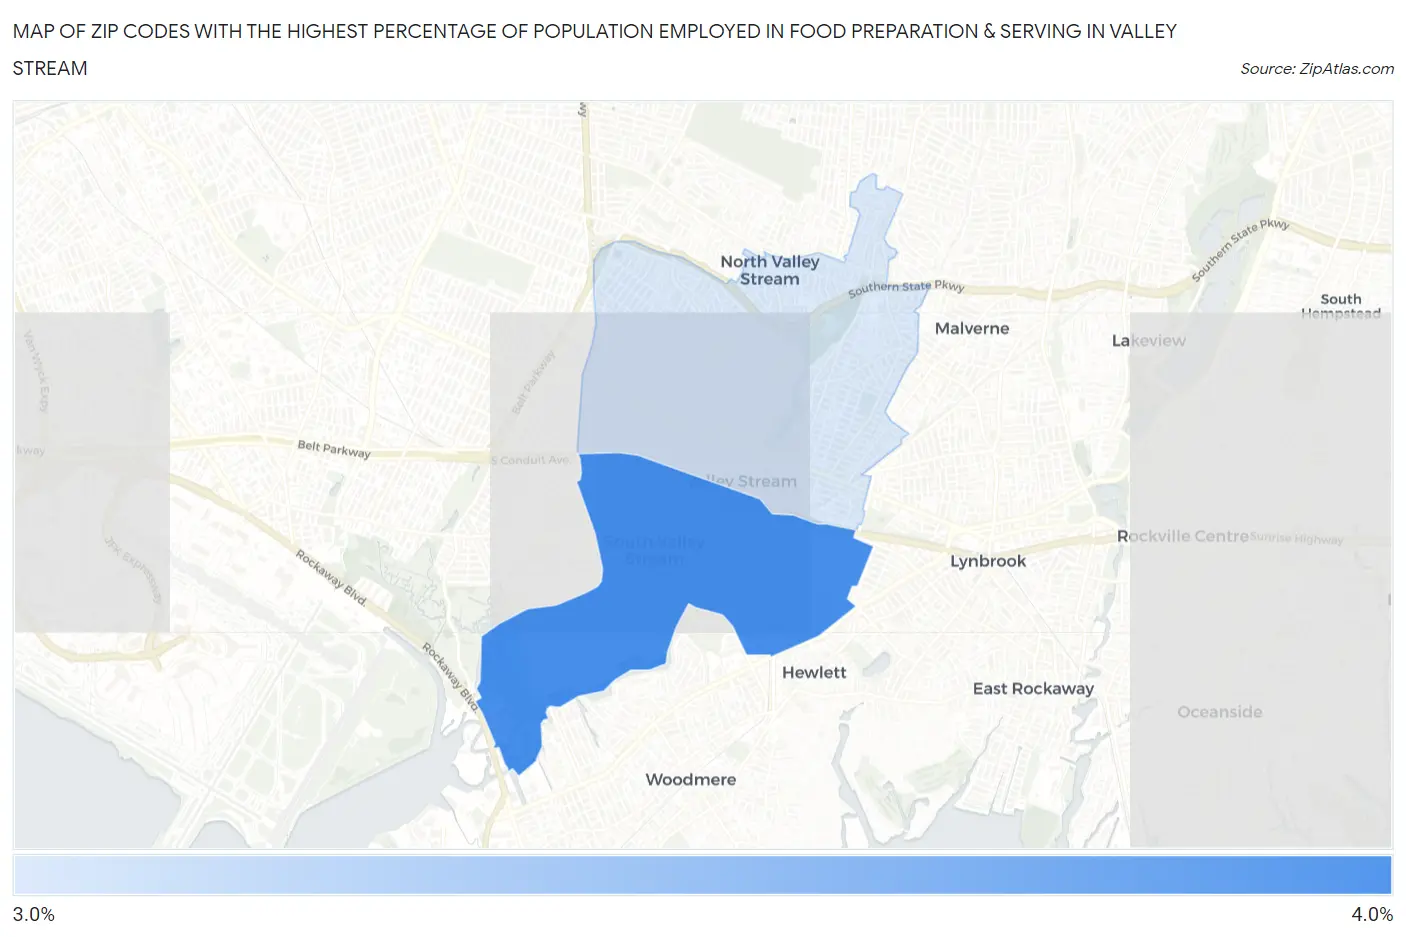
Map of Zip Codes with the Highest Percentage of Population Employed in Food Preparation & Serving in Valley Stream
3.5%
3.6%
Zip Codes with the Highest Percentage of Population Employed in Food Preparation & Serving in Valley Stream, NY
| Zip Code | % Employed | vs State | vs National | |
| 1. | 11581 | 3.6% | 4.8%(-1.21)#944 | 5.3%(-1.68)#18,728 |
| 2. | 11580 | 3.5% | 4.8%(-1.27)#961 | 5.3%(-1.74)#19,010 |
1
Common Questions
What are the Top Zip Codes with the Highest Percentage of Population Employed in Food Preparation & Serving in Valley Stream, NY?
Top Zip Codes with the Highest Percentage of Population Employed in Food Preparation & Serving in Valley Stream, NY are:
What zip code has the Highest Percentage of Population Employed in Food Preparation & Serving in Valley Stream, NY?
11581 has the Highest Percentage of Population Employed in Food Preparation & Serving in Valley Stream, NY with 3.6%.
What is the Percentage of Population Employed in Food Preparation & Serving in Valley Stream, NY?
Percentage of Population Employed in Food Preparation & Serving in Valley Stream is 3.7%.
What is the Percentage of Population Employed in Food Preparation & Serving in New York?
Percentage of Population Employed in Food Preparation & Serving in New York is 4.8%.
What is the Percentage of Population Employed in Food Preparation & Serving in the United States?
Percentage of Population Employed in Food Preparation & Serving in the United States is 5.3%.