Stamford, NY Map & Demographics
Stamford Map
Stamford Overview
$24,399
PER CAPITA INCOME
$58,021
AVG FAMILY INCOME
$46,667
AVG HOUSEHOLD INCOME
29.4%
WAGE / INCOME GAP [ % ]
70.6¢/ $1
WAGE / INCOME GAP [ $ ]
0.43
INEQUALITY / GINI INDEX
1,155
TOTAL POPULATION
586
MALE POPULATION
569
FEMALE POPULATION
102.99
MALES / 100 FEMALES
97.10
FEMALES / 100 MALES
38.7
MEDIAN AGE
3.3
AVG FAMILY SIZE
2.3
AVG HOUSEHOLD SIZE
538
LABOR FORCE [ PEOPLE ]
58.2%
PERCENT IN LABOR FORCE
11.3%
UNEMPLOYMENT RATE
Stamford Zip Codes
Stamford Area Codes
Income in Stamford
Income Overview in Stamford
Per Capita Income in Stamford is $24,399, while median incomes of families and households are $58,021 and $46,667 respectively.
| Characteristic | Number | Measure |
| Per Capita Income | 1,155 | $24,399 |
| Median Family Income | 243 | $58,021 |
| Mean Family Income | 243 | $66,635 |
| Median Household Income | 498 | $46,667 |
| Mean Household Income | 498 | $55,862 |
| Income Deficit | 243 | $0 |
| Wage / Income Gap (%) | 1,155 | 29.38% |
| Wage / Income Gap ($) | 1,155 | 70.62¢ per $1 |
| Gini / Inequality Index | 1,155 | 0.43 |
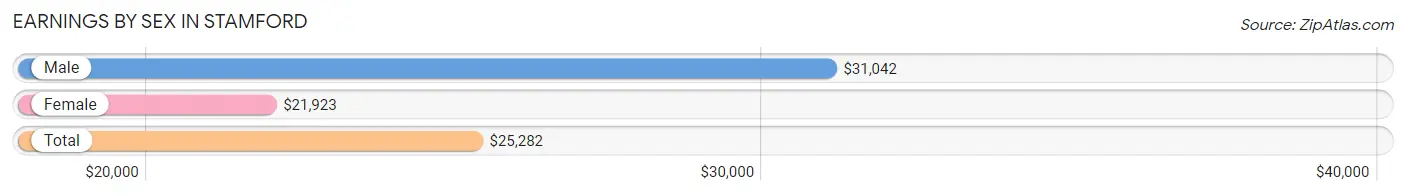
Earnings by Sex in Stamford
Average Earnings in Stamford are $25,282, $31,042 for men and $21,923 for women, a difference of 29.4%.
| Sex | Number | Average Earnings |
| Male | 273 (47.1%) | $31,042 |
| Female | 306 (52.8%) | $21,923 |
| Total | 579 (100.0%) | $25,282 |
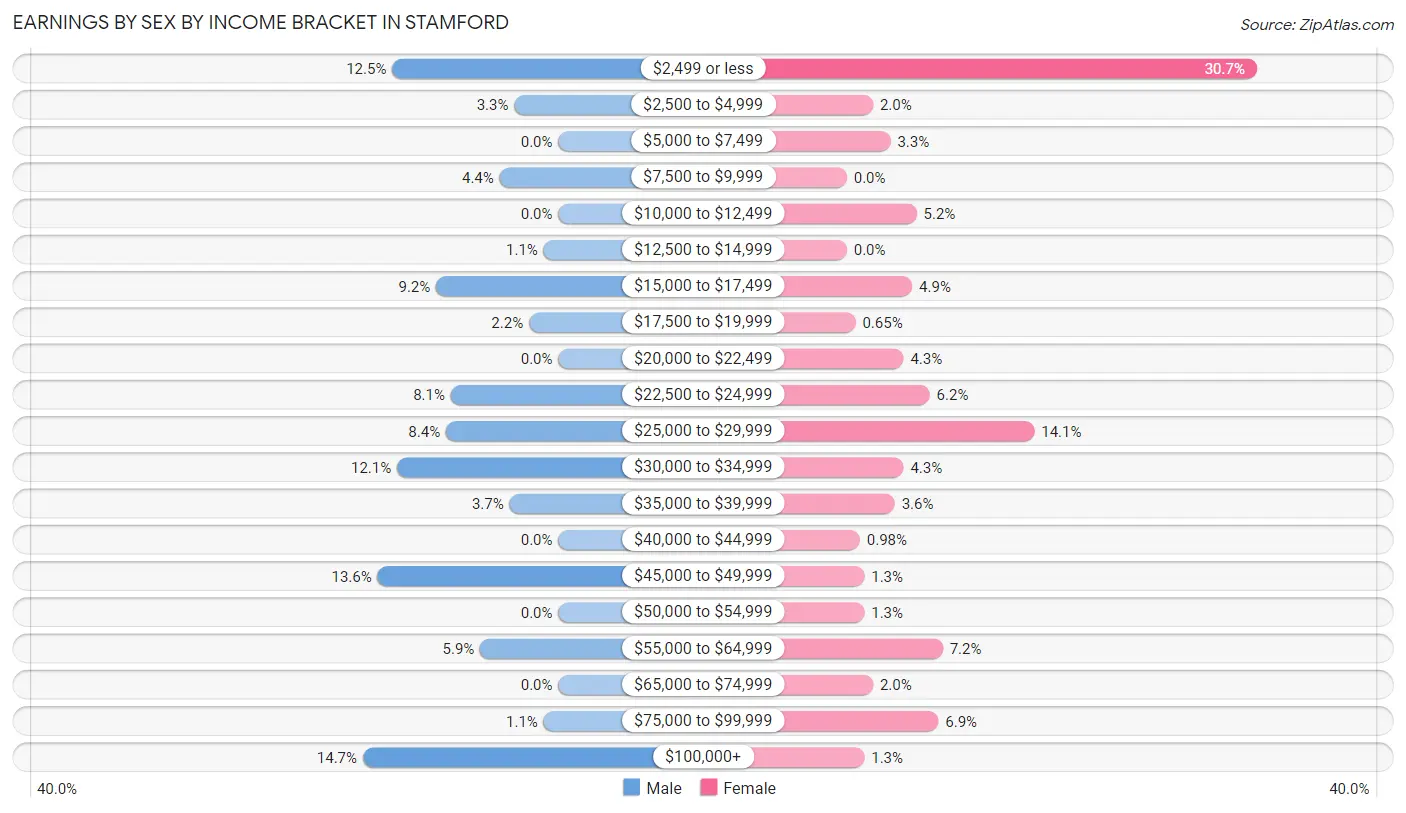
Earnings by Sex by Income Bracket in Stamford
The most common earnings brackets in Stamford are $100,000+ for men (40 | 14.6%) and $2,499 or less for women (94 | 30.7%).
| Income | Male | Female |
| $2,499 or less | 34 (12.4%) | 94 (30.7%) |
| $2,500 to $4,999 | 9 (3.3%) | 6 (2.0%) |
| $5,000 to $7,499 | 0 (0.0%) | 10 (3.3%) |
| $7,500 to $9,999 | 12 (4.4%) | 0 (0.0%) |
| $10,000 to $12,499 | 0 (0.0%) | 16 (5.2%) |
| $12,500 to $14,999 | 3 (1.1%) | 0 (0.0%) |
| $15,000 to $17,499 | 25 (9.2%) | 15 (4.9%) |
| $17,500 to $19,999 | 6 (2.2%) | 2 (0.6%) |
| $20,000 to $22,499 | 0 (0.0%) | 13 (4.3%) |
| $22,500 to $24,999 | 22 (8.1%) | 19 (6.2%) |
| $25,000 to $29,999 | 23 (8.4%) | 43 (14.1%) |
| $30,000 to $34,999 | 33 (12.1%) | 13 (4.3%) |
| $35,000 to $39,999 | 10 (3.7%) | 11 (3.6%) |
| $40,000 to $44,999 | 0 (0.0%) | 3 (1.0%) |
| $45,000 to $49,999 | 37 (13.6%) | 4 (1.3%) |
| $50,000 to $54,999 | 0 (0.0%) | 4 (1.3%) |
| $55,000 to $64,999 | 16 (5.9%) | 22 (7.2%) |
| $65,000 to $74,999 | 0 (0.0%) | 6 (2.0%) |
| $75,000 to $99,999 | 3 (1.1%) | 21 (6.9%) |
| $100,000+ | 40 (14.6%) | 4 (1.3%) |
| Total | 273 (100.0%) | 306 (100.0%) |
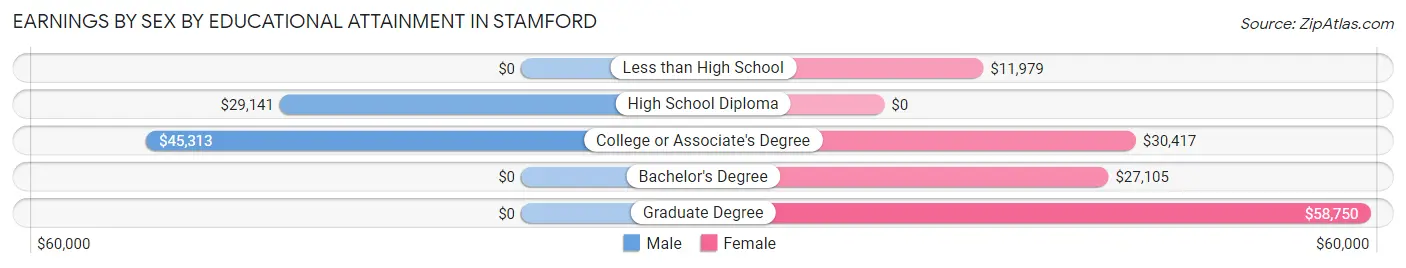
Earnings by Sex by Educational Attainment in Stamford
Average earnings in Stamford are $33,704 for men and $25,766 for women, a difference of 23.5%. Men with an educational attainment of college or associate's degree enjoy the highest average annual earnings of $45,313, while those with high school diploma education earn the least with $29,141. Women with an educational attainment of graduate degree earn the most with the average annual earnings of $58,750, while those with less than high school education have the smallest earnings of $11,979.
| Educational Attainment | Male Income | Female Income |
| Less than High School | - | - |
| High School Diploma | $29,141 | $0 |
| College or Associate's Degree | $45,313 | $30,417 |
| Bachelor's Degree | - | - |
| Graduate Degree | - | - |
| Total | $33,704 | $25,766 |
Family Income in Stamford
Family Income Brackets in Stamford
According to the Stamford family income data, there are 42 families falling into the $75,000 to $99,999 income range, which is the most common income bracket and makes up 17.3% of all families. Conversely, the less than $10,000 income bracket is the least frequent group with only 3 families (1.2%) belonging to this category.
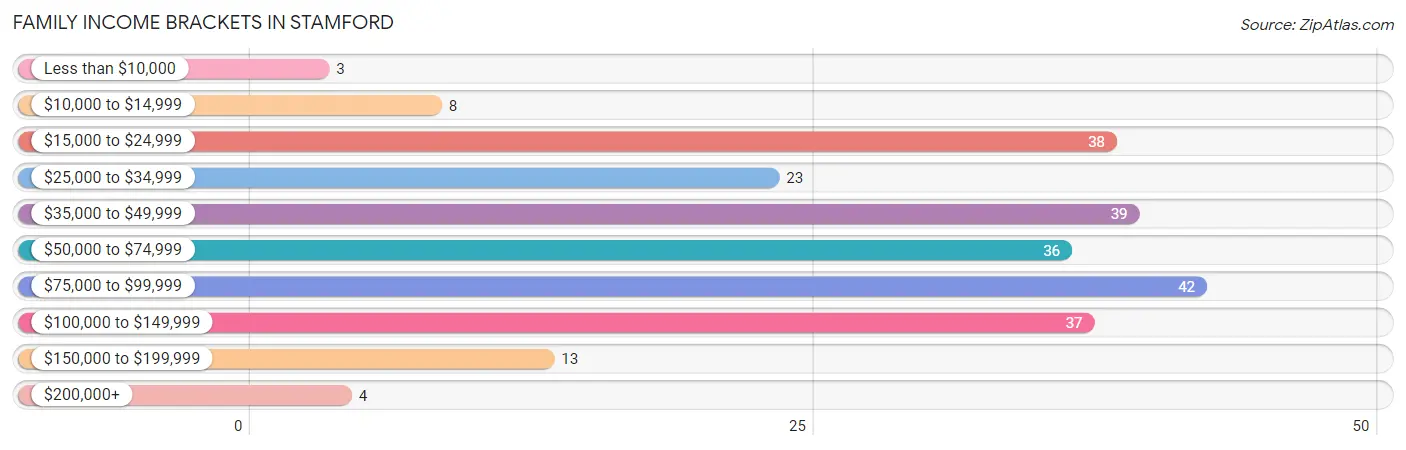
| Income Bracket | # Families | % Families |
| Less than $10,000 | 3 | 1.2% |
| $10,000 to $14,999 | 8 | 3.3% |
| $15,000 to $24,999 | 38 | 15.6% |
| $25,000 to $34,999 | 23 | 9.5% |
| $35,000 to $49,999 | 39 | 16.0% |
| $50,000 to $74,999 | 36 | 14.8% |
| $75,000 to $99,999 | 42 | 17.3% |
| $100,000 to $149,999 | 37 | 15.2% |
| $150,000 to $199,999 | 13 | 5.3% |
| $200,000+ | 4 | 1.6% |
Family Income by Famaliy Size in Stamford
4-person families (54 | 22.2%) account for the highest median family income in Stamford with $78,684 per family, while 2-person families (117 | 48.1%) have the highest median income of $20,491 per family member.
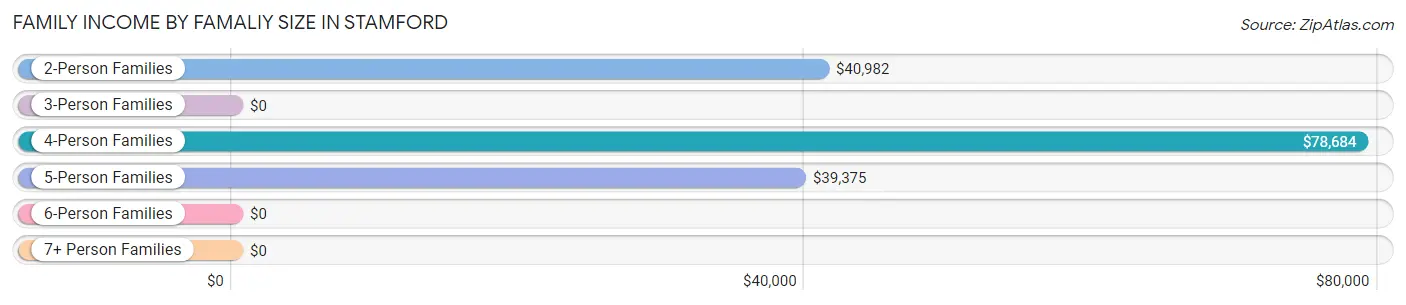
| Income Bracket | # Families | Median Income |
| 2-Person Families | 117 (48.1%) | $40,982 |
| 3-Person Families | 36 (14.8%) | $0 |
| 4-Person Families | 54 (22.2%) | $78,684 |
| 5-Person Families | 24 (9.9%) | $39,375 |
| 6-Person Families | 0 (0.0%) | $0 |
| 7+ Person Families | 12 (4.9%) | $0 |
| Total | 243 (100.0%) | $58,021 |
Family Income by Number of Earners in Stamford
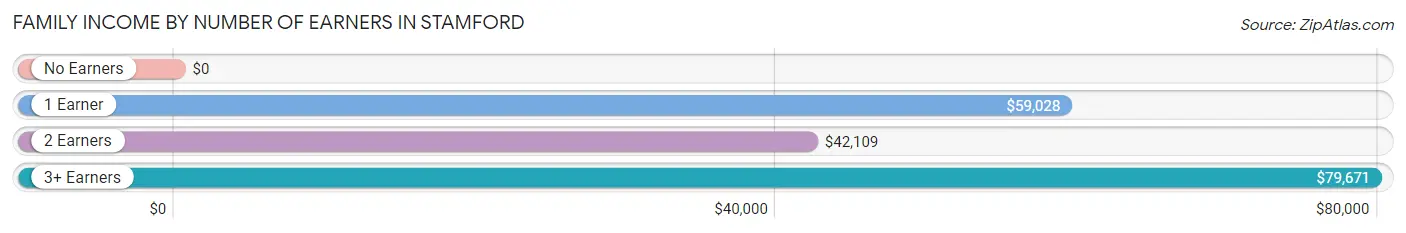
| Number of Earners | # Families | Median Income |
| No Earners | 52 (21.4%) | $0 |
| 1 Earner | 53 (21.8%) | $59,028 |
| 2 Earners | 73 (30.0%) | $42,109 |
| 3+ Earners | 65 (26.8%) | $79,671 |
| Total | 243 (100.0%) | $58,021 |
Household Income in Stamford
Household Income Brackets in Stamford
With 92 households falling in the category, the $50,000 to $74,999 income range is the most frequent in Stamford, accounting for 18.5% of all households. In contrast, only 11 households (2.2%) fall into the $200,000+ income bracket, making it the least populous group.
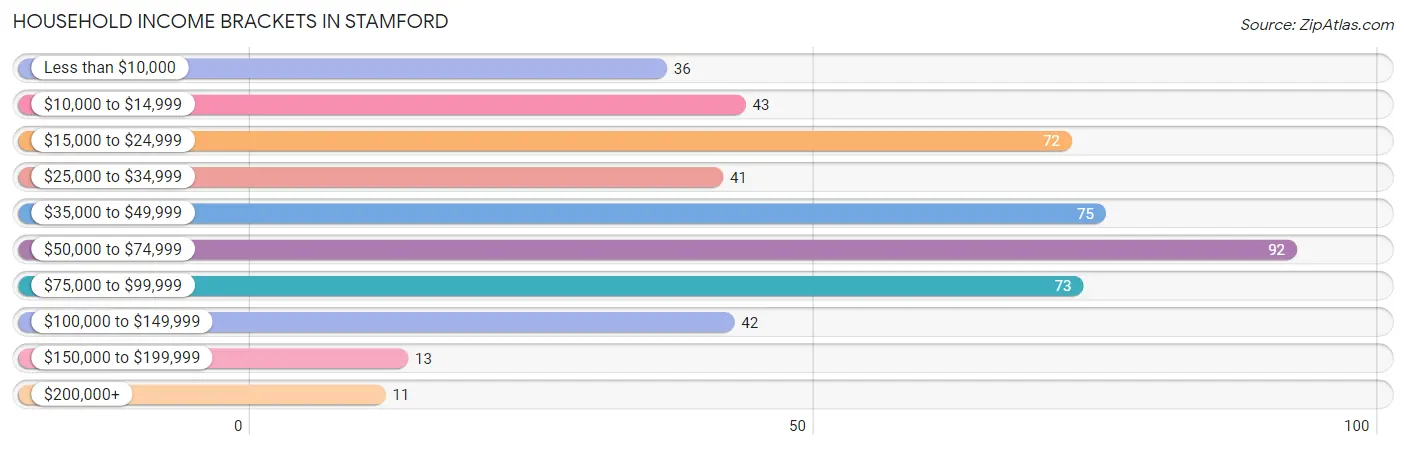
| Income Bracket | # Households | % Households |
| Less than $10,000 | 36 | 7.2% |
| $10,000 to $14,999 | 43 | 8.6% |
| $15,000 to $24,999 | 72 | 14.5% |
| $25,000 to $34,999 | 41 | 8.2% |
| $35,000 to $49,999 | 75 | 15.1% |
| $50,000 to $74,999 | 92 | 18.5% |
| $75,000 to $99,999 | 73 | 14.7% |
| $100,000 to $149,999 | 42 | 8.4% |
| $150,000 to $199,999 | 13 | 2.6% |
| $200,000+ | 11 | 2.2% |
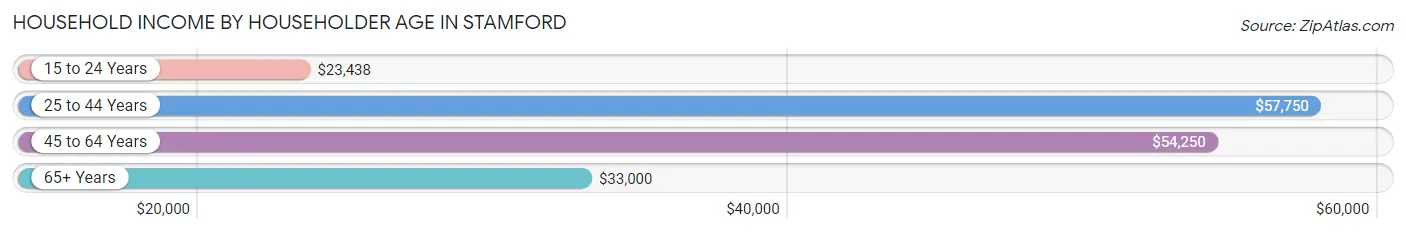
Household Income by Householder Age in Stamford
The median household income in Stamford is $46,667, with the highest median household income of $57,750 found in the 25 to 44 years age bracket for the primary householder. A total of 152 households (30.5%) fall into this category. Meanwhile, the 15 to 24 years age bracket for the primary householder has the lowest median household income of $23,438, with 18 households (3.6%) in this group.
| Income Bracket | # Households | Median Income |
| 15 to 24 Years | 18 (3.6%) | $23,438 |
| 25 to 44 Years | 152 (30.5%) | $57,750 |
| 45 to 64 Years | 184 (36.9%) | $54,250 |
| 65+ Years | 144 (28.9%) | $33,000 |
| Total | 498 (100.0%) | $46,667 |
Poverty in Stamford
Income Below Poverty by Sex and Age in Stamford
With 20.7% poverty level for males and 21.3% for females among the residents of Stamford, 12 to 14 year old males and 65 to 74 year old females are the most vulnerable to poverty, with 3 males (60.0%) and 32 females (48.5%) in their respective age groups living below the poverty level.
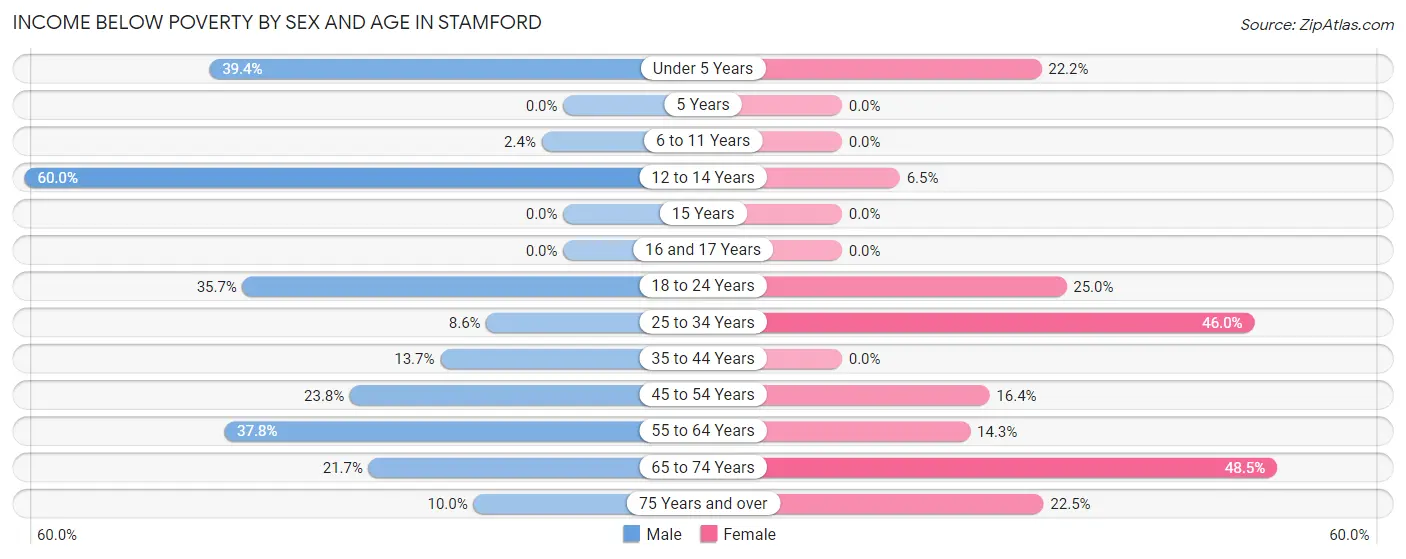
| Age Bracket | Male | Female |
| Under 5 Years | 28 (39.4%) | 2 (22.2%) |
| 5 Years | 0 (0.0%) | 0 (0.0%) |
| 6 to 11 Years | 2 (2.4%) | 0 (0.0%) |
| 12 to 14 Years | 3 (60.0%) | 2 (6.5%) |
| 15 Years | 0 (0.0%) | 0 (0.0%) |
| 16 and 17 Years | 0 (0.0%) | 0 (0.0%) |
| 18 to 24 Years | 20 (35.7%) | 14 (25.0%) |
| 25 to 34 Years | 6 (8.6%) | 34 (46.0%) |
| 35 to 44 Years | 10 (13.7%) | 0 (0.0%) |
| 45 to 54 Years | 19 (23.7%) | 12 (16.4%) |
| 55 to 64 Years | 17 (37.8%) | 14 (14.3%) |
| 65 to 74 Years | 13 (21.7%) | 32 (48.5%) |
| 75 Years and over | 3 (10.0%) | 11 (22.5%) |
| Total | 121 (20.7%) | 121 (21.3%) |
Income Above Poverty by Sex and Age in Stamford
According to the poverty statistics in Stamford, males aged 5 years and females aged 5 years are the age groups that are most secure financially, with 100.0% of males and 100.0% of females in these age groups living above the poverty line.
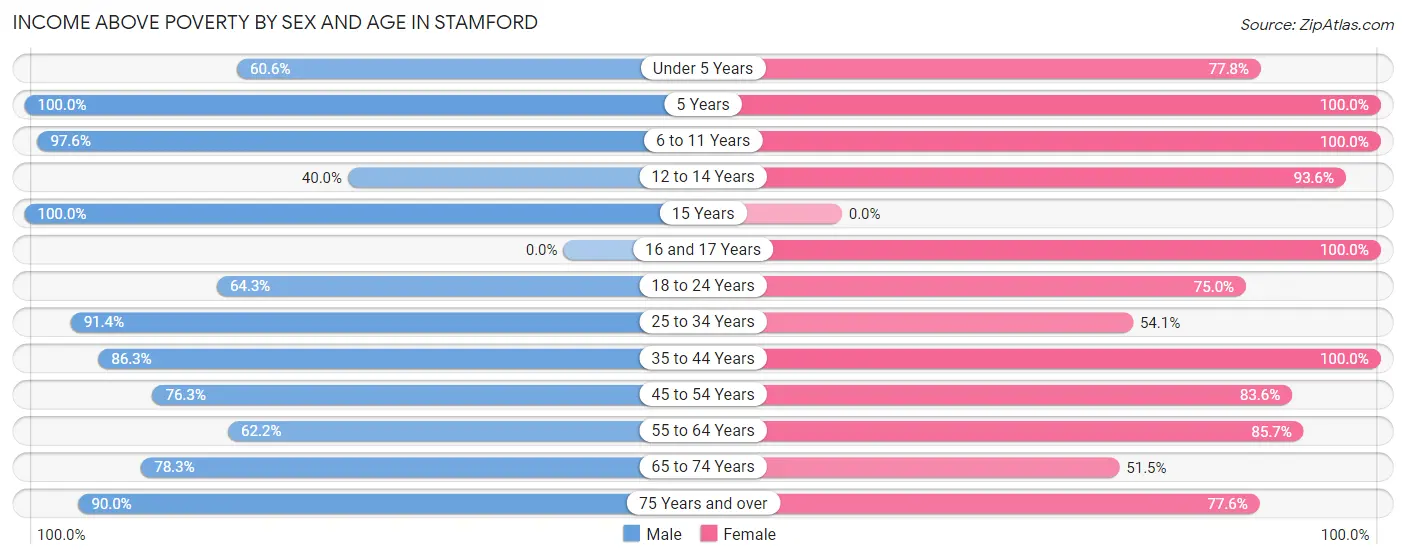
| Age Bracket | Male | Female |
| Under 5 Years | 43 (60.6%) | 7 (77.8%) |
| 5 Years | 2 (100.0%) | 3 (100.0%) |
| 6 to 11 Years | 81 (97.6%) | 15 (100.0%) |
| 12 to 14 Years | 2 (40.0%) | 29 (93.5%) |
| 15 Years | 9 (100.0%) | 0 (0.0%) |
| 16 and 17 Years | 0 (0.0%) | 23 (100.0%) |
| 18 to 24 Years | 36 (64.3%) | 42 (75.0%) |
| 25 to 34 Years | 64 (91.4%) | 40 (54.0%) |
| 35 to 44 Years | 63 (86.3%) | 72 (100.0%) |
| 45 to 54 Years | 61 (76.2%) | 61 (83.6%) |
| 55 to 64 Years | 28 (62.2%) | 84 (85.7%) |
| 65 to 74 Years | 47 (78.3%) | 34 (51.5%) |
| 75 Years and over | 27 (90.0%) | 38 (77.5%) |
| Total | 463 (79.3%) | 448 (78.7%) |
Income Below Poverty Among Married-Couple Families in Stamford
The poverty statistics for married-couple families in Stamford show that 10.5% or 18 of the total 172 families live below the poverty line. Families with 1 or 2 children have the highest poverty rate of 14.1%, comprising of 10 families. On the other hand, families with 3 or 4 children have the lowest poverty rate of 0.0%, which includes 0 families.
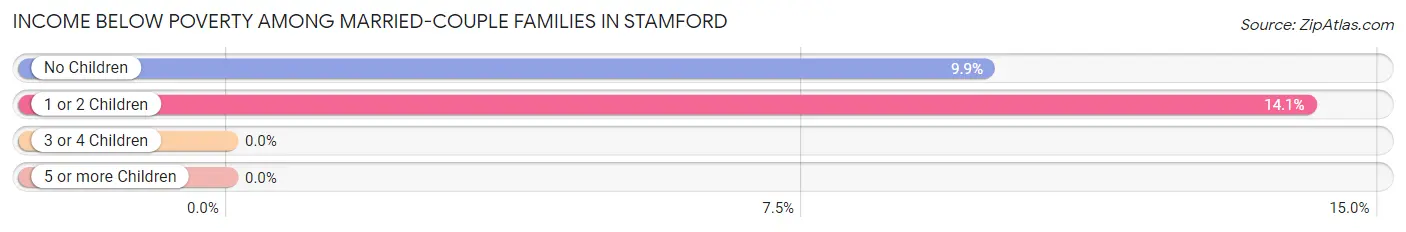
| Children | Above Poverty | Below Poverty |
| No Children | 73 (90.1%) | 8 (9.9%) |
| 1 or 2 Children | 61 (85.9%) | 10 (14.1%) |
| 3 or 4 Children | 8 (100.0%) | 0 (0.0%) |
| 5 or more Children | 12 (100.0%) | 0 (0.0%) |
| Total | 154 (89.5%) | 18 (10.5%) |
Income Below Poverty Among Single-Parent Households in Stamford
According to the poverty data in Stamford, 43.8% or 7 single-father households and 38.2% or 21 single-mother households are living below the poverty line. Among single-father households, those with no children have the highest poverty rate, with 7 households (100.0%) experiencing poverty. Likewise, among single-mother households, those with 1 or 2 children have the highest poverty rate, with 17 households (77.3%) falling below the poverty line.
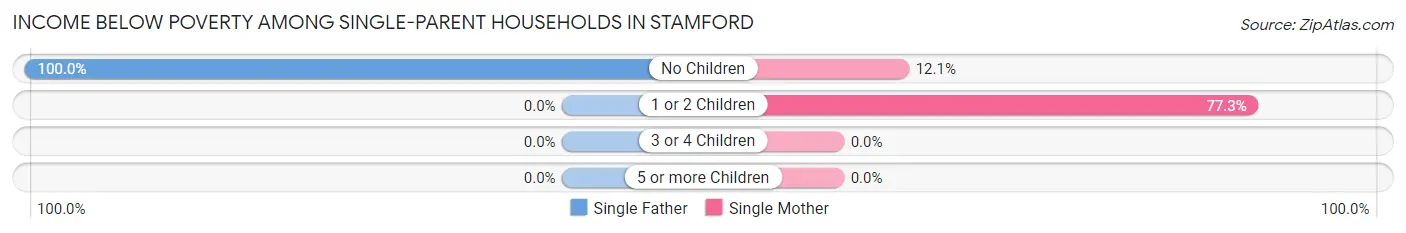
| Children | Single Father | Single Mother |
| No Children | 7 (100.0%) | 4 (12.1%) |
| 1 or 2 Children | 0 (0.0%) | 17 (77.3%) |
| 3 or 4 Children | 0 (0.0%) | 0 (0.0%) |
| 5 or more Children | 0 (0.0%) | 0 (0.0%) |
| Total | 7 (43.8%) | 21 (38.2%) |
Income Below Poverty Among Married-Couple vs Single-Parent Households in Stamford
The poverty data for Stamford shows that 18 of the married-couple family households (10.5%) and 28 of the single-parent households (39.4%) are living below the poverty level. Within the married-couple family households, those with 1 or 2 children have the highest poverty rate, with 10 households (14.1%) falling below the poverty line. Among the single-parent households, those with 1 or 2 children have the highest poverty rate, with 17 household (77.3%) living below poverty.
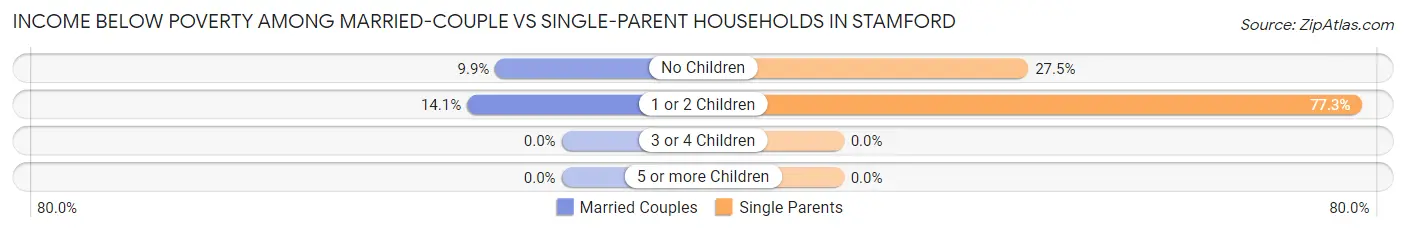
| Children | Married-Couple Families | Single-Parent Households |
| No Children | 8 (9.9%) | 11 (27.5%) |
| 1 or 2 Children | 10 (14.1%) | 17 (77.3%) |
| 3 or 4 Children | 0 (0.0%) | 0 (0.0%) |
| 5 or more Children | 0 (0.0%) | 0 (0.0%) |
| Total | 18 (10.5%) | 28 (39.4%) |
Race in Stamford
The most populous races in Stamford are White / Caucasian (1,049 | 90.8%), Two or more Races (80 | 6.9%), and Hispanic or Latino (62 | 5.4%).
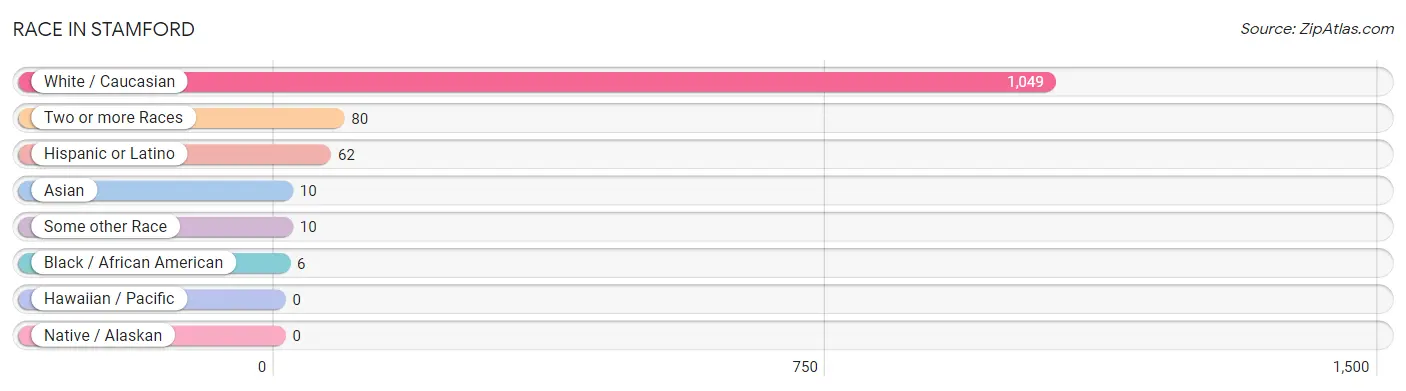
| Race | # Population | % Population |
| Asian | 10 | 0.9% |
| Black / African American | 6 | 0.5% |
| Hawaiian / Pacific | 0 | 0.0% |
| Hispanic or Latino | 62 | 5.4% |
| Native / Alaskan | 0 | 0.0% |
| White / Caucasian | 1,049 | 90.8% |
| Two or more Races | 80 | 6.9% |
| Some other Race | 10 | 0.9% |
| Total | 1,155 | 100.0% |
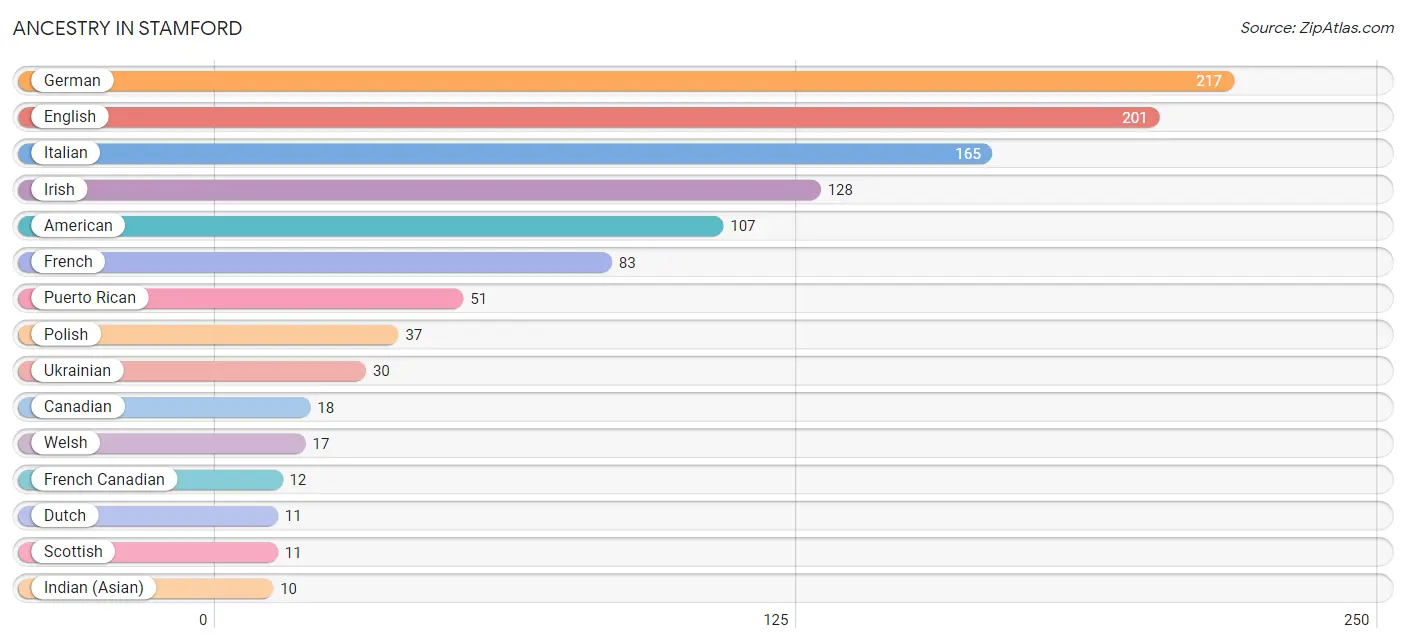
Ancestry in Stamford
The most populous ancestries reported in Stamford are German (217 | 18.8%), English (201 | 17.4%), Italian (165 | 14.3%), Irish (128 | 11.1%), and American (107 | 9.3%), together accounting for 70.8% of all Stamford residents.
| Ancestry | # Population | % Population |
| American | 107 | 9.3% |
| Austrian | 3 | 0.3% |
| British | 2 | 0.2% |
| Canadian | 18 | 1.6% |
| Croatian | 8 | 0.7% |
| Czech | 8 | 0.7% |
| Danish | 3 | 0.3% |
| Dutch | 11 | 0.9% |
| English | 201 | 17.4% |
| Ethiopian | 4 | 0.4% |
| European | 6 | 0.5% |
| Finnish | 5 | 0.4% |
| French | 83 | 7.2% |
| French Canadian | 12 | 1.0% |
| German | 217 | 18.8% |
| Hungarian | 3 | 0.3% |
| Indian (Asian) | 10 | 0.9% |
| Irish | 128 | 11.1% |
| Italian | 165 | 14.3% |
| Lithuanian | 3 | 0.3% |
| Macedonian | 6 | 0.5% |
| Mexican | 5 | 0.4% |
| Norwegian | 6 | 0.5% |
| Polish | 37 | 3.2% |
| Puerto Rican | 51 | 4.4% |
| Scotch-Irish | 4 | 0.4% |
| Scottish | 11 | 0.9% |
| Slovak | 2 | 0.2% |
| Spaniard | 6 | 0.5% |
| Subsaharan African | 4 | 0.4% |
| Swedish | 3 | 0.3% |
| Swiss | 2 | 0.2% |
| Ukrainian | 30 | 2.6% |
| Welsh | 17 | 1.5% |
| West Indian | 6 | 0.5% | View All 35 Rows |
Immigrants in Stamford
The most numerous immigrant groups reported in Stamford came from Canada (35 | 3.0%), Europe (11 | 0.9%), Latin America (11 | 0.9%), Germany (7 | 0.6%), and Western Europe (7 | 0.6%), together accounting for 6.2% of all Stamford residents.
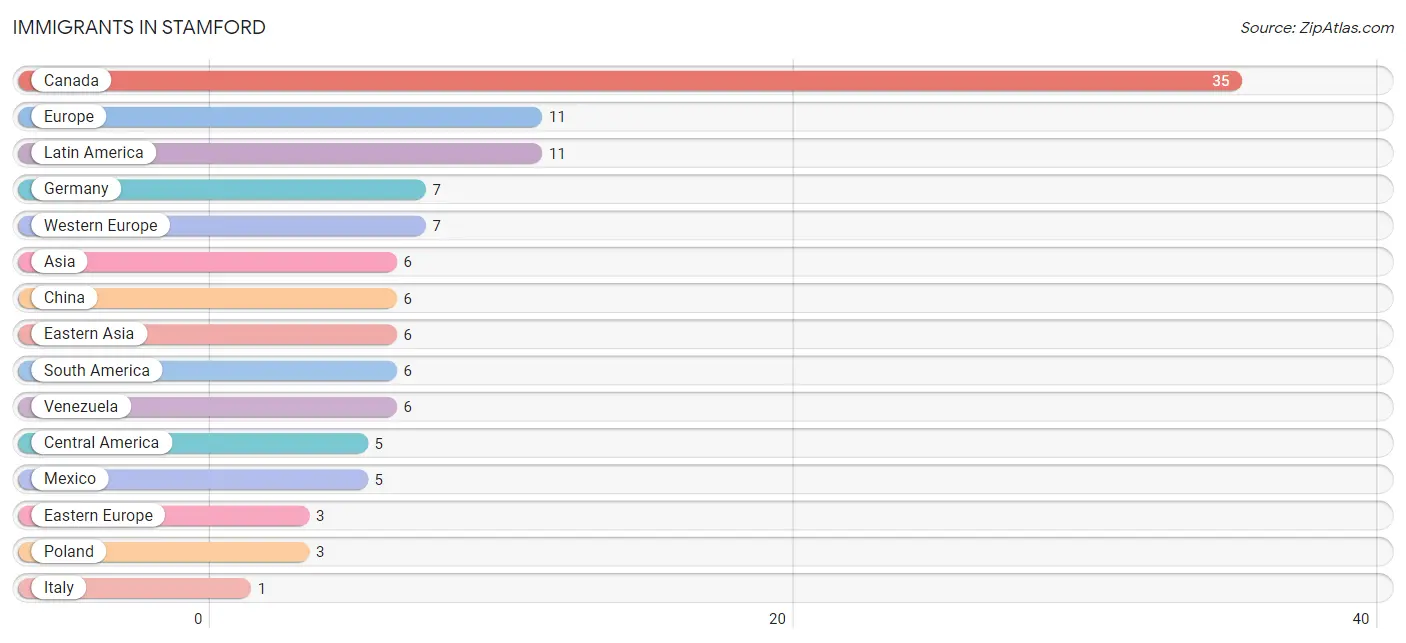
| Immigration Origin | # Population | % Population |
| Asia | 6 | 0.5% |
| Canada | 35 | 3.0% |
| Central America | 5 | 0.4% |
| China | 6 | 0.5% |
| Eastern Asia | 6 | 0.5% |
| Eastern Europe | 3 | 0.3% |
| Europe | 11 | 0.9% |
| Germany | 7 | 0.6% |
| Italy | 1 | 0.1% |
| Latin America | 11 | 0.9% |
| Mexico | 5 | 0.4% |
| Poland | 3 | 0.3% |
| South America | 6 | 0.5% |
| Southern Europe | 1 | 0.1% |
| Venezuela | 6 | 0.5% |
| Western Europe | 7 | 0.6% | View All 16 Rows |
Sex and Age in Stamford
Sex and Age in Stamford
The most populous age groups in Stamford are Under 5 Years (73 | 12.5%) for men and 35 to 39 Years (66 | 11.6%) for women.
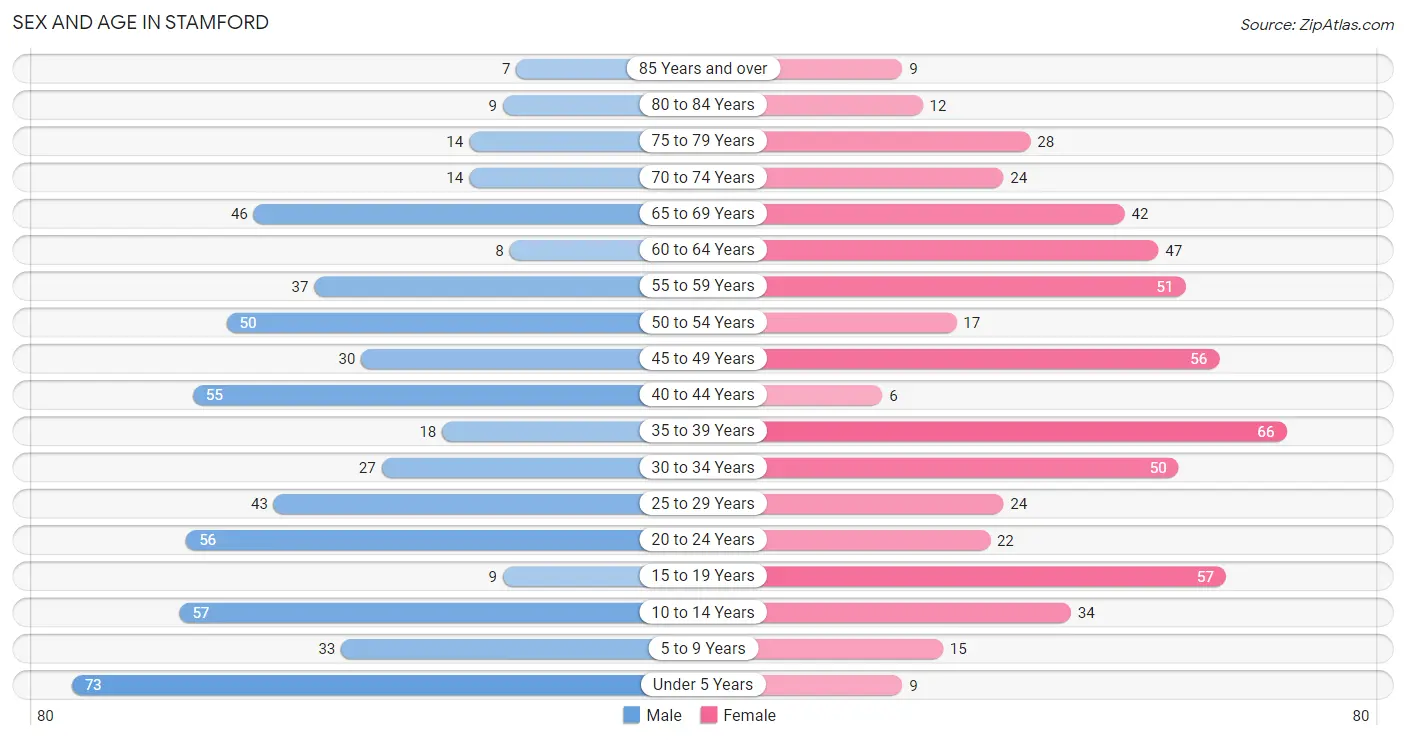
| Age Bracket | Male | Female |
| Under 5 Years | 73 (12.5%) | 9 (1.6%) |
| 5 to 9 Years | 33 (5.6%) | 15 (2.6%) |
| 10 to 14 Years | 57 (9.7%) | 34 (6.0%) |
| 15 to 19 Years | 9 (1.5%) | 57 (10.0%) |
| 20 to 24 Years | 56 (9.6%) | 22 (3.9%) |
| 25 to 29 Years | 43 (7.3%) | 24 (4.2%) |
| 30 to 34 Years | 27 (4.6%) | 50 (8.8%) |
| 35 to 39 Years | 18 (3.1%) | 66 (11.6%) |
| 40 to 44 Years | 55 (9.4%) | 6 (1.1%) |
| 45 to 49 Years | 30 (5.1%) | 56 (9.8%) |
| 50 to 54 Years | 50 (8.5%) | 17 (3.0%) |
| 55 to 59 Years | 37 (6.3%) | 51 (9.0%) |
| 60 to 64 Years | 8 (1.4%) | 47 (8.3%) |
| 65 to 69 Years | 46 (7.9%) | 42 (7.4%) |
| 70 to 74 Years | 14 (2.4%) | 24 (4.2%) |
| 75 to 79 Years | 14 (2.4%) | 28 (4.9%) |
| 80 to 84 Years | 9 (1.5%) | 12 (2.1%) |
| 85 Years and over | 7 (1.2%) | 9 (1.6%) |
| Total | 586 (100.0%) | 569 (100.0%) |
Families and Households in Stamford
Median Family Size in Stamford
The median family size in Stamford is 3.28 persons per family, with single male/father families (16 | 6.6%) accounting for the largest median family size of 3.63 persons per family. On the other hand, single female/mother families (55 | 22.6%) represent the smallest median family size with 2.73 persons per family.
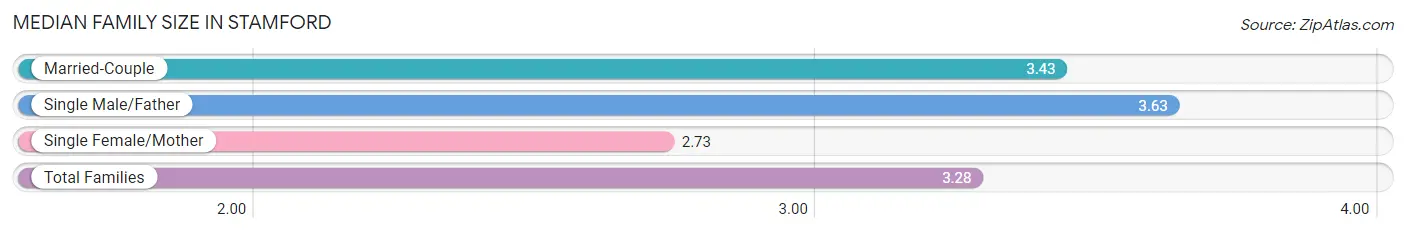
| Family Type | # Families | Family Size |
| Married-Couple | 172 (70.8%) | 3.43 |
| Single Male/Father | 16 (6.6%) | 3.63 |
| Single Female/Mother | 55 (22.6%) | 2.73 |
| Total Families | 243 (100.0%) | 3.28 |
Median Household Size in Stamford
The median household size in Stamford is 2.32 persons per household, with single male/father households (16 | 3.2%) accounting for the largest median household size of 4.25 persons per household. non-family households (255 | 51.2%) represent the smallest median household size with 1.30 persons per household.
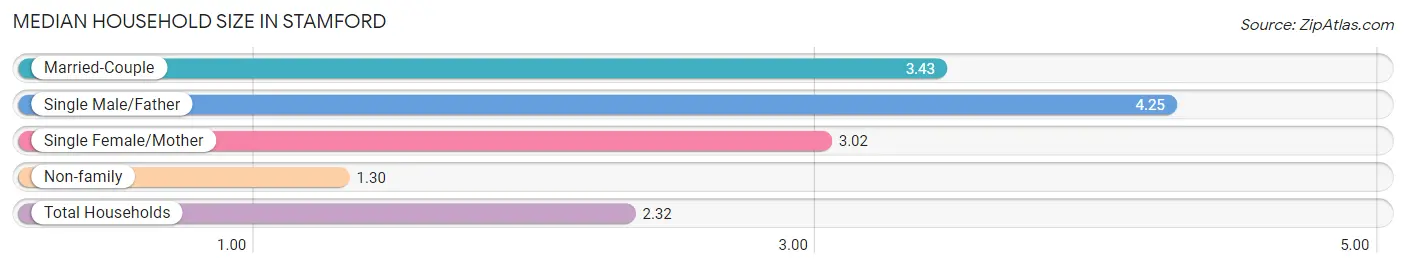
| Household Type | # Households | Household Size |
| Married-Couple | 172 (34.5%) | 3.43 |
| Single Male/Father | 16 (3.2%) | 4.25 |
| Single Female/Mother | 55 (11.0%) | 3.02 |
| Non-family | 255 (51.2%) | 1.30 |
| Total Households | 498 (100.0%) | 2.32 |
Household Size by Marriage Status in Stamford
Out of a total of 498 households in Stamford, 243 (48.8%) are family households, while 255 (51.2%) are nonfamily households. The most numerous type of family households are 2-person households, comprising 100, and the most common type of nonfamily households are 1-person households, comprising 187.
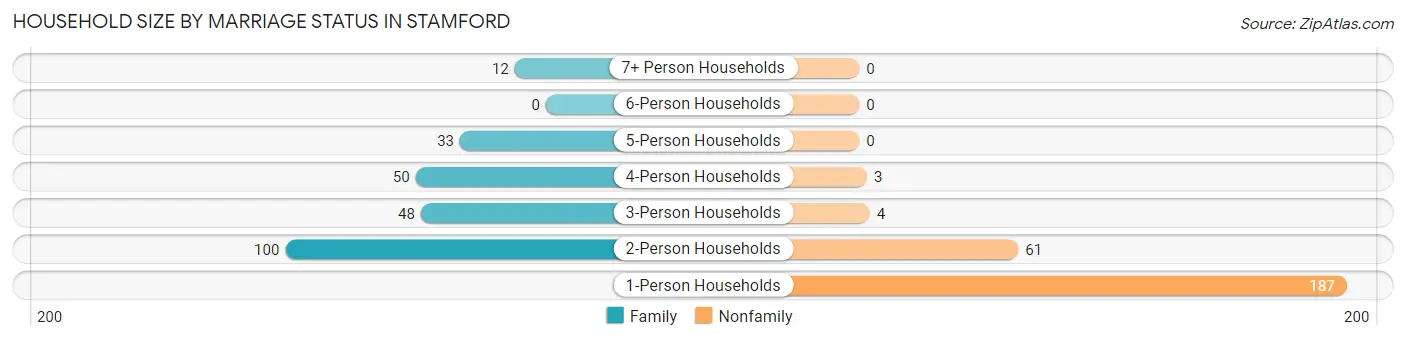
| Household Size | Family Households | Nonfamily Households |
| 1-Person Households | - | 187 (37.6%) |
| 2-Person Households | 100 (20.1%) | 61 (12.2%) |
| 3-Person Households | 48 (9.6%) | 4 (0.8%) |
| 4-Person Households | 50 (10.0%) | 3 (0.6%) |
| 5-Person Households | 33 (6.6%) | 0 (0.0%) |
| 6-Person Households | 0 (0.0%) | 0 (0.0%) |
| 7+ Person Households | 12 (2.4%) | 0 (0.0%) |
| Total | 243 (48.8%) | 255 (51.2%) |
Female Fertility in Stamford
Fertility by Age in Stamford
Average fertility rate in Stamford is 56.0 births per 1,000 women. Women in the age bracket of 20 to 34 years have the highest fertility rate with 167.0 births per 1,000 women. Women in the age bracket of 20 to 34 years acount for 100.0% of all women with births.
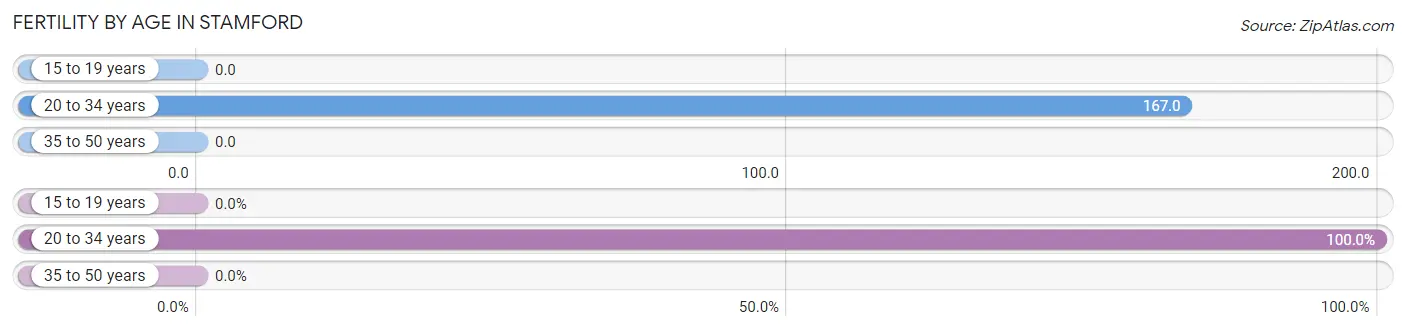
| Age Bracket | Women with Births | Births / 1,000 Women |
| 15 to 19 years | 0 (0.0%) | 0.0 |
| 20 to 34 years | 16 (100.0%) | 167.0 |
| 35 to 50 years | 0 (0.0%) | 0.0 |
| Total | 16 (100.0%) | 56.0 |
Fertility by Age by Marriage Status in Stamford
37.5% of women with births (16) in Stamford are married. The highest percentage of unmarried women with births falls into 20 to 34 years age bracket with 62.5% of them unmarried at the time of birth, while the lowest percentage of unmarried women with births belong to 20 to 34 years age bracket with 62.5% of them unmarried.
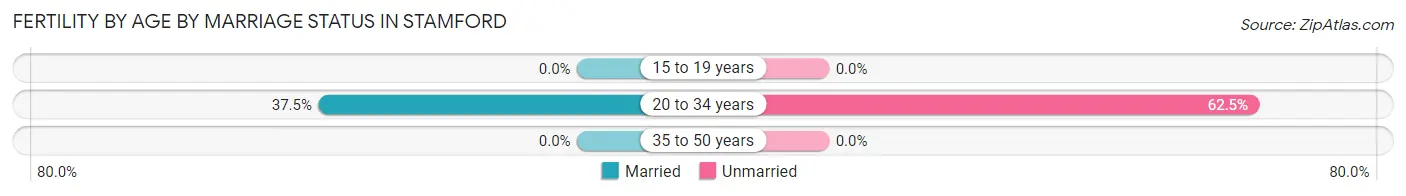
| Age Bracket | Married | Unmarried |
| 15 to 19 years | 0 (0.0%) | 0 (0.0%) |
| 20 to 34 years | 6 (37.5%) | 10 (62.5%) |
| 35 to 50 years | 0 (0.0%) | 0 (0.0%) |
| Total | 6 (37.5%) | 10 (62.5%) |
Fertility by Education in Stamford
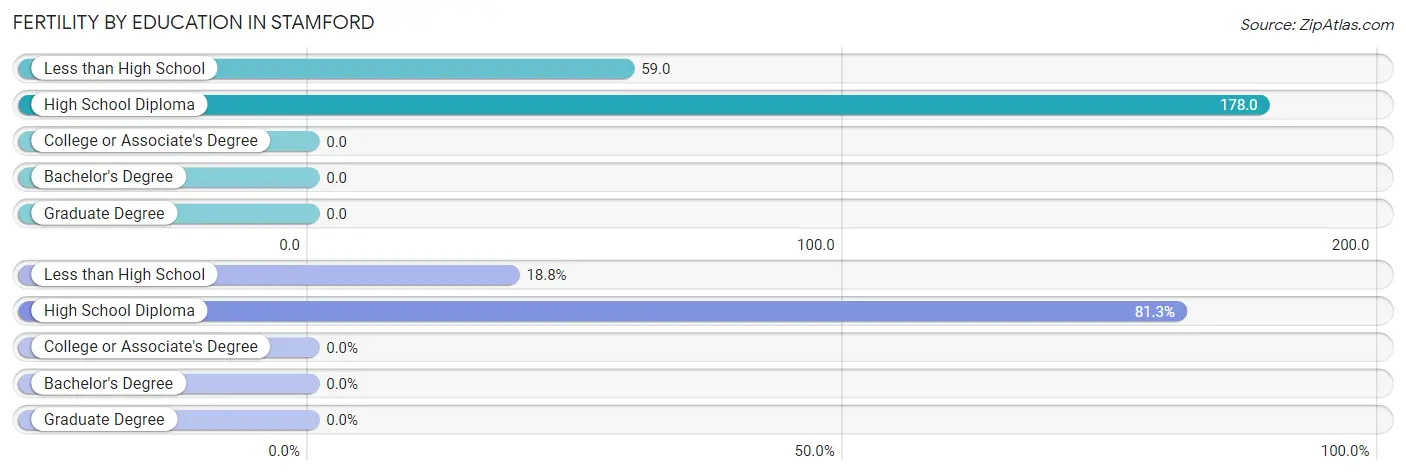
| Educational Attainment | Women with Births | Births / 1,000 Women |
| Less than High School | 3 (18.8%) | 59.0 |
| High School Diploma | 13 (81.2%) | 178.0 |
| College or Associate's Degree | 0 (0.0%) | 0.0 |
| Bachelor's Degree | 0 (0.0%) | 0.0 |
| Graduate Degree | 0 (0.0%) | 0.0 |
| Total | 16 (100.0%) | 56.0 |
Fertility by Education by Marriage Status in Stamford
62.5% of women with births in Stamford are unmarried. Women with the educational attainment of less than high school are most likely to be married with 100.0% of them married at childbirth, while women with the educational attainment of high school diploma are least likely to be married with 76.9% of them unmarried at childbirth.
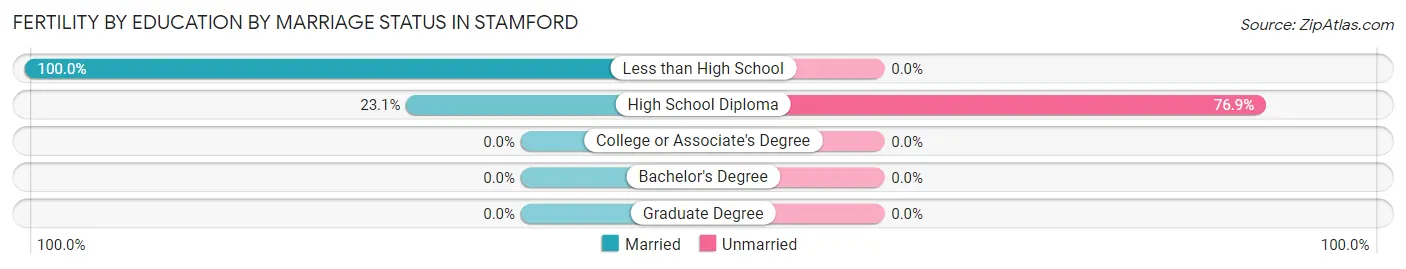
| Educational Attainment | Married | Unmarried |
| Less than High School | 3 (100.0%) | 0 (0.0%) |
| High School Diploma | 3 (23.1%) | 10 (76.9%) |
| College or Associate's Degree | 0 (0.0%) | 0 (0.0%) |
| Bachelor's Degree | 0 (0.0%) | 0 (0.0%) |
| Graduate Degree | 0 (0.0%) | 0 (0.0%) |
| Total | 6 (37.5%) | 10 (62.5%) |
Employment Characteristics in Stamford
Employment by Class of Employer in Stamford
Among the 451 employed individuals in Stamford, private company employees (265 | 58.8%), not-for-profit organizations (55 | 12.2%), and local government employees (52 | 11.5%) make up the most common classes of employment.
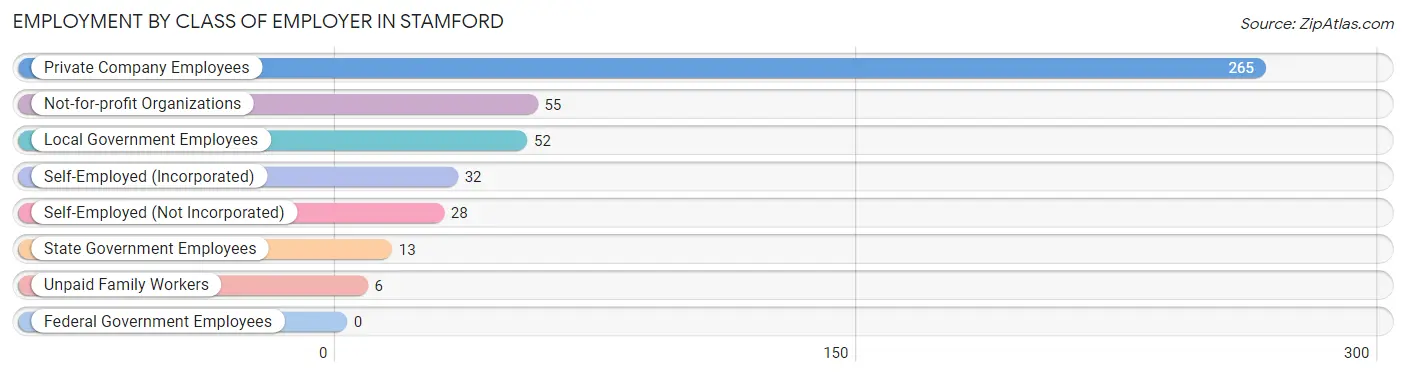
| Employer Class | # Employees | % Employees |
| Private Company Employees | 265 | 58.8% |
| Self-Employed (Incorporated) | 32 | 7.1% |
| Self-Employed (Not Incorporated) | 28 | 6.2% |
| Not-for-profit Organizations | 55 | 12.2% |
| Local Government Employees | 52 | 11.5% |
| State Government Employees | 13 | 2.9% |
| Federal Government Employees | 0 | 0.0% |
| Unpaid Family Workers | 6 | 1.3% |
| Total | 451 | 100.0% |
Employment Status by Age in Stamford
According to the labor force statistics for Stamford, out of the total population over 16 years of age (925), 58.2% or 538 individuals are in the labor force, with 11.3% or 61 of them unemployed. The age group with the highest labor force participation rate is 25 to 29 years, with 95.5% or 64 individuals in the labor force. Within the labor force, the 20 to 24 years age range has the highest percentage of unemployed individuals, with 37.0% or 20 of them being unemployed.
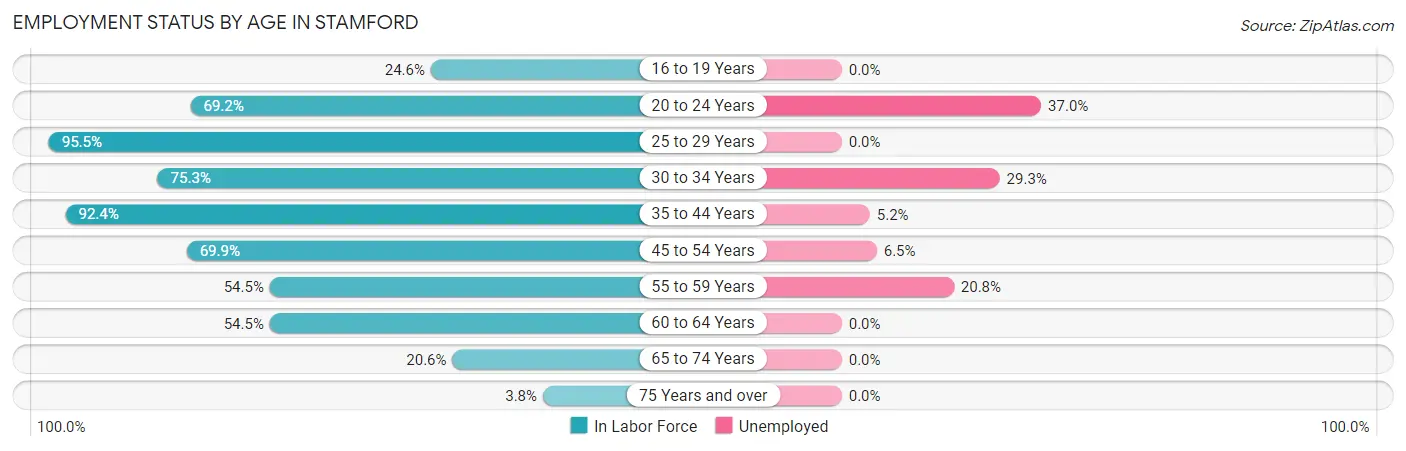
| Age Bracket | In Labor Force | Unemployed |
| 16 to 19 Years | 14 (24.6%) | 0 (0.0%) |
| 20 to 24 Years | 54 (69.2%) | 20 (37.0%) |
| 25 to 29 Years | 64 (95.5%) | 0 (0.0%) |
| 30 to 34 Years | 58 (75.3%) | 17 (29.3%) |
| 35 to 44 Years | 134 (92.4%) | 7 (5.2%) |
| 45 to 54 Years | 107 (69.9%) | 7 (6.5%) |
| 55 to 59 Years | 48 (54.5%) | 10 (20.8%) |
| 60 to 64 Years | 30 (54.5%) | 0 (0.0%) |
| 65 to 74 Years | 26 (20.6%) | 0 (0.0%) |
| 75 Years and over | 3 (3.8%) | 0 (0.0%) |
| Total | 538 (58.2%) | 61 (11.3%) |
Employment Status by Educational Attainment in Stamford
According to labor force statistics for Stamford, 75.4% of individuals (441) out of the total population between 25 and 64 years of age (585) are in the labor force, with 9.3% or 41 of them being unemployed. The group with the highest labor force participation rate are those with the educational attainment of less than high school, with 80.5% or 33 individuals in the labor force. Within the labor force, individuals with less than high school education have the highest percentage of unemployment, with 21.2% or 7 of them being unemployed.
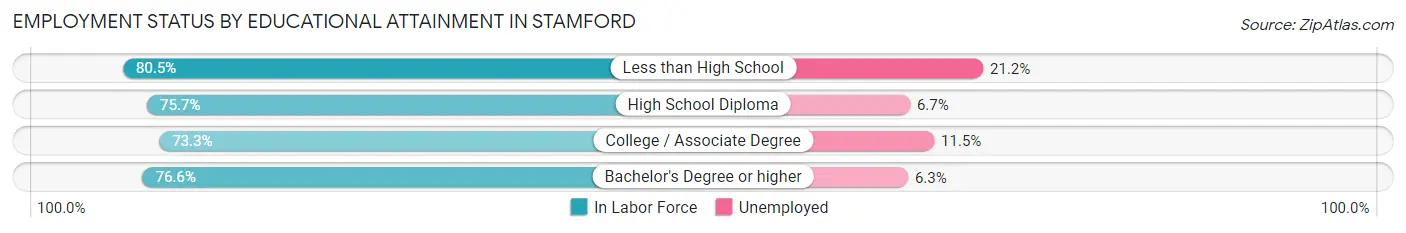
| Educational Attainment | In Labor Force | Unemployed |
| Less than High School | 33 (80.5%) | 9 (21.2%) |
| High School Diploma | 165 (75.7%) | 15 (6.7%) |
| College / Associate Degree | 148 (73.3%) | 23 (11.5%) |
| Bachelor's Degree or higher | 95 (76.6%) | 8 (6.3%) |
| Total | 441 (75.4%) | 54 (9.3%) |
Employment Occupations by Sex in Stamford
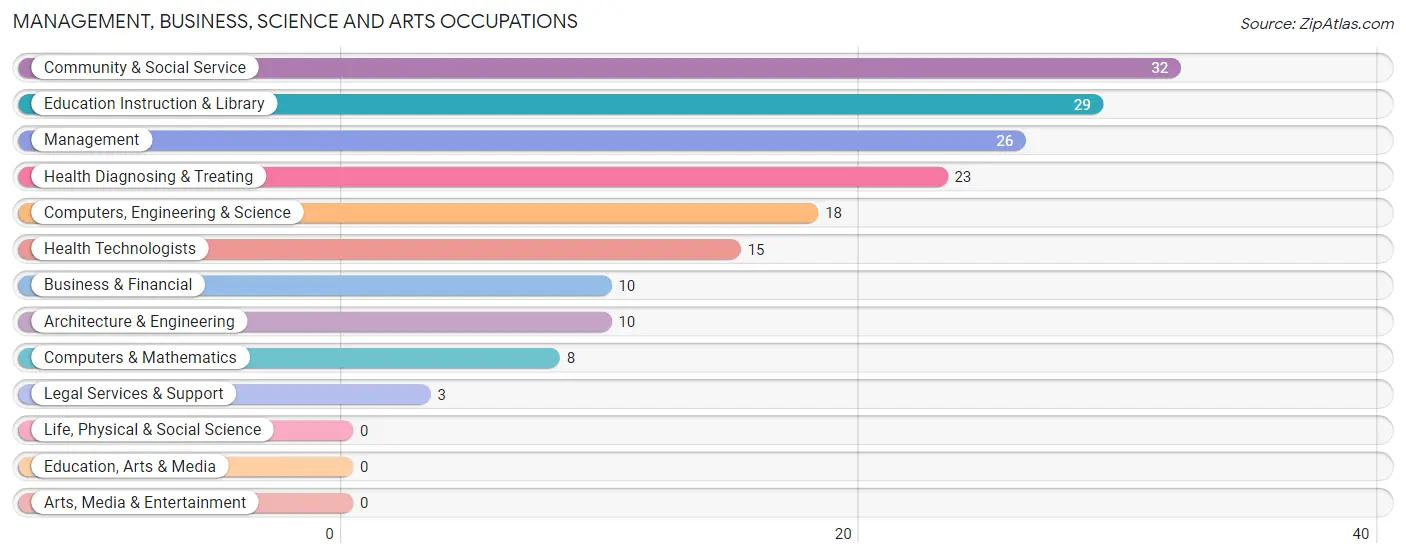
Management, Business, Science and Arts Occupations
The most common Management, Business, Science and Arts occupations in Stamford are Community & Social Service (32 | 6.7%), Education Instruction & Library (29 | 6.1%), Management (26 | 5.4%), Health Diagnosing & Treating (23 | 4.8%), and Computers, Engineering & Science (18 | 3.8%).
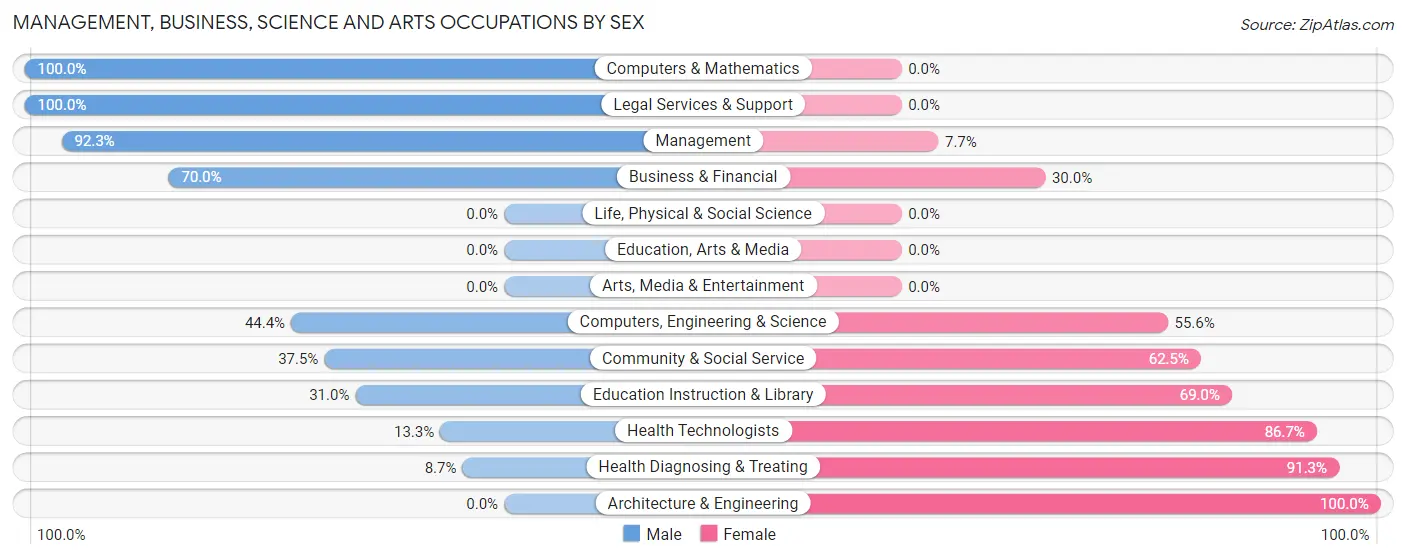
Management, Business, Science and Arts Occupations by Sex
Within the Management, Business, Science and Arts occupations in Stamford, the most male-oriented occupations are Computers & Mathematics (100.0%), Legal Services & Support (100.0%), and Management (92.3%), while the most female-oriented occupations are Architecture & Engineering (100.0%), Health Diagnosing & Treating (91.3%), and Health Technologists (86.7%).
| Occupation | Male | Female |
| Management | 24 (92.3%) | 2 (7.7%) |
| Business & Financial | 7 (70.0%) | 3 (30.0%) |
| Computers, Engineering & Science | 8 (44.4%) | 10 (55.6%) |
| Computers & Mathematics | 8 (100.0%) | 0 (0.0%) |
| Architecture & Engineering | 0 (0.0%) | 10 (100.0%) |
| Life, Physical & Social Science | 0 (0.0%) | 0 (0.0%) |
| Community & Social Service | 12 (37.5%) | 20 (62.5%) |
| Education, Arts & Media | 0 (0.0%) | 0 (0.0%) |
| Legal Services & Support | 3 (100.0%) | 0 (0.0%) |
| Education Instruction & Library | 9 (31.0%) | 20 (69.0%) |
| Arts, Media & Entertainment | 0 (0.0%) | 0 (0.0%) |
| Health Diagnosing & Treating | 2 (8.7%) | 21 (91.3%) |
| Health Technologists | 2 (13.3%) | 13 (86.7%) |
| Total (Category) | 53 (48.6%) | 56 (51.4%) |
| Total (Overall) | 245 (51.4%) | 232 (48.6%) |
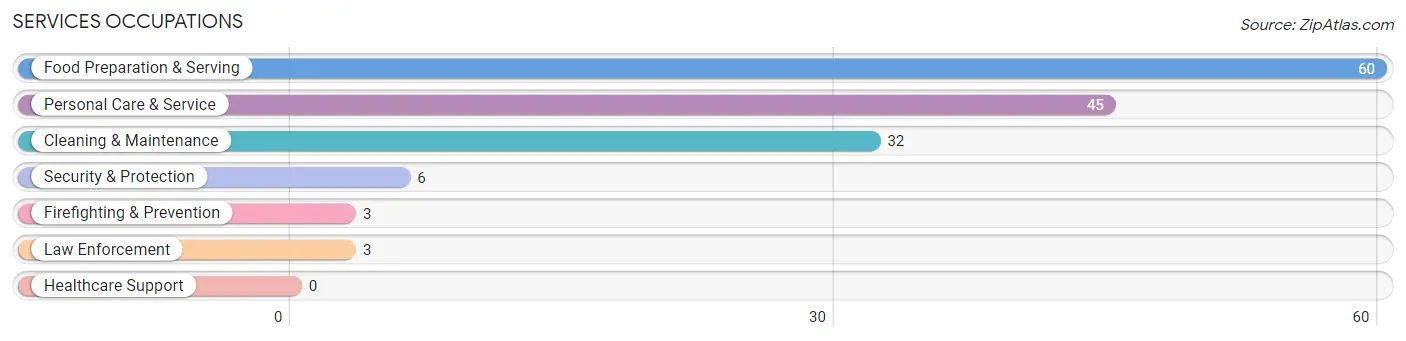
Services Occupations
The most common Services occupations in Stamford are Food Preparation & Serving (60 | 12.6%), Personal Care & Service (45 | 9.4%), Cleaning & Maintenance (32 | 6.7%), Security & Protection (6 | 1.3%), and Firefighting & Prevention (3 | 0.6%).
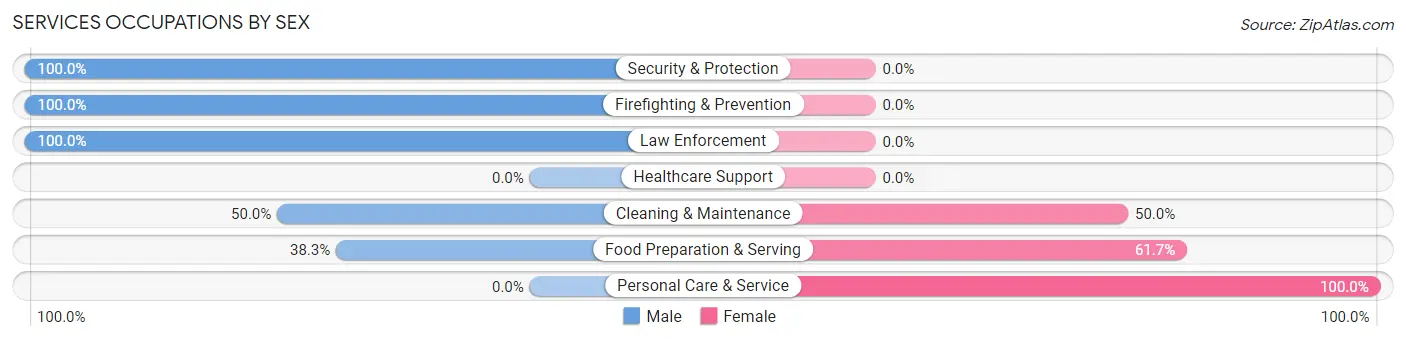
Services Occupations by Sex
Within the Services occupations in Stamford, the most male-oriented occupations are Security & Protection (100.0%), Firefighting & Prevention (100.0%), and Law Enforcement (100.0%), while the most female-oriented occupations are Personal Care & Service (100.0%), Food Preparation & Serving (61.7%), and Cleaning & Maintenance (50.0%).
| Occupation | Male | Female |
| Healthcare Support | 0 (0.0%) | 0 (0.0%) |
| Security & Protection | 6 (100.0%) | 0 (0.0%) |
| Firefighting & Prevention | 3 (100.0%) | 0 (0.0%) |
| Law Enforcement | 3 (100.0%) | 0 (0.0%) |
| Food Preparation & Serving | 23 (38.3%) | 37 (61.7%) |
| Cleaning & Maintenance | 16 (50.0%) | 16 (50.0%) |
| Personal Care & Service | 0 (0.0%) | 45 (100.0%) |
| Total (Category) | 45 (31.5%) | 98 (68.5%) |
| Total (Overall) | 245 (51.4%) | 232 (48.6%) |
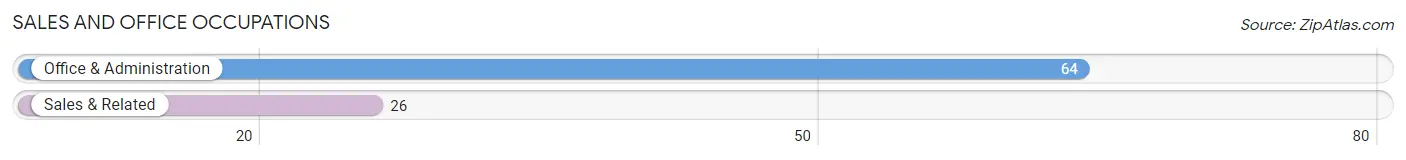
Sales and Office Occupations
The most common Sales and Office occupations in Stamford are Office & Administration (64 | 13.4%), and Sales & Related (26 | 5.4%).
Sales and Office Occupations by Sex
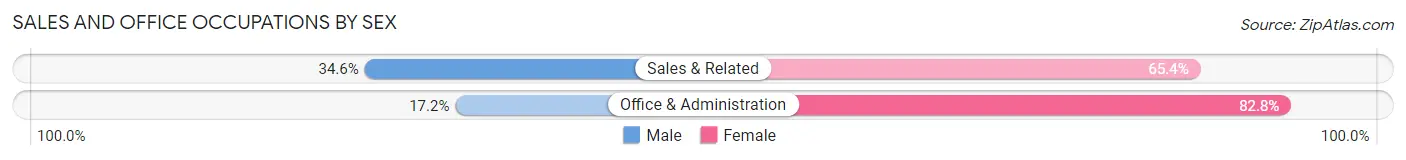
| Occupation | Male | Female |
| Sales & Related | 9 (34.6%) | 17 (65.4%) |
| Office & Administration | 11 (17.2%) | 53 (82.8%) |
| Total (Category) | 20 (22.2%) | 70 (77.8%) |
| Total (Overall) | 245 (51.4%) | 232 (48.6%) |
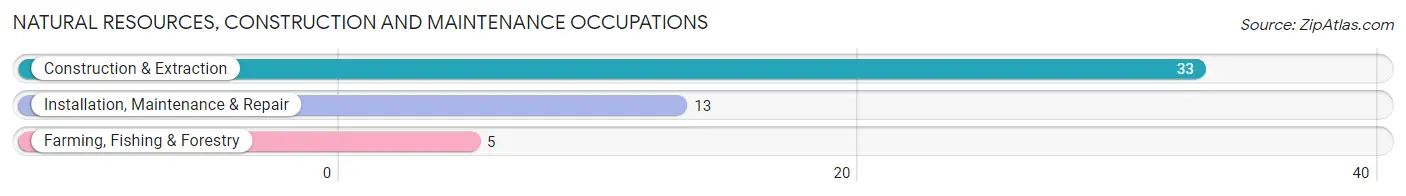
Natural Resources, Construction and Maintenance Occupations
The most common Natural Resources, Construction and Maintenance occupations in Stamford are Construction & Extraction (33 | 6.9%), Installation, Maintenance & Repair (13 | 2.7%), and Farming, Fishing & Forestry (5 | 1.1%).
Natural Resources, Construction and Maintenance Occupations by Sex
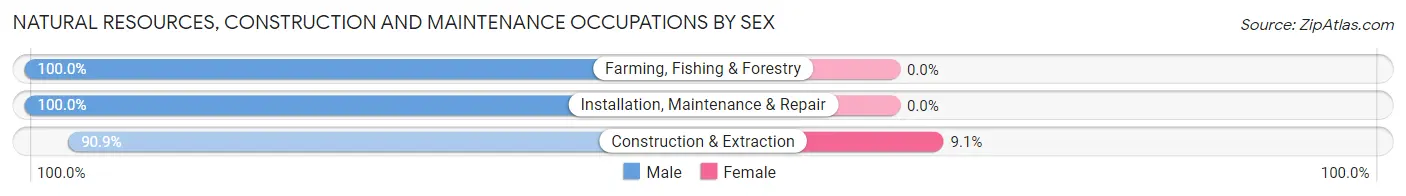
| Occupation | Male | Female |
| Farming, Fishing & Forestry | 5 (100.0%) | 0 (0.0%) |
| Construction & Extraction | 30 (90.9%) | 3 (9.1%) |
| Installation, Maintenance & Repair | 13 (100.0%) | 0 (0.0%) |
| Total (Category) | 48 (94.1%) | 3 (5.9%) |
| Total (Overall) | 245 (51.4%) | 232 (48.6%) |
Production, Transportation and Moving Occupations
The most common Production, Transportation and Moving occupations in Stamford are Production (52 | 10.9%), Transportation (23 | 4.8%), and Material Moving (9 | 1.9%).
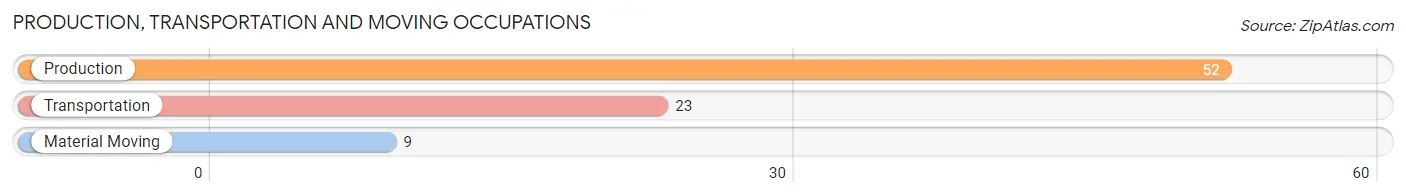
Production, Transportation and Moving Occupations by Sex
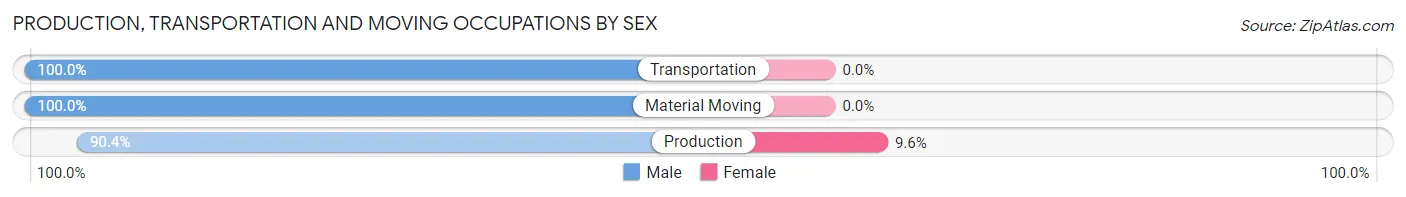
| Occupation | Male | Female |
| Production | 47 (90.4%) | 5 (9.6%) |
| Transportation | 23 (100.0%) | 0 (0.0%) |
| Material Moving | 9 (100.0%) | 0 (0.0%) |
| Total (Category) | 79 (94.1%) | 5 (5.9%) |
| Total (Overall) | 245 (51.4%) | 232 (48.6%) |
Employment Industries by Sex in Stamford
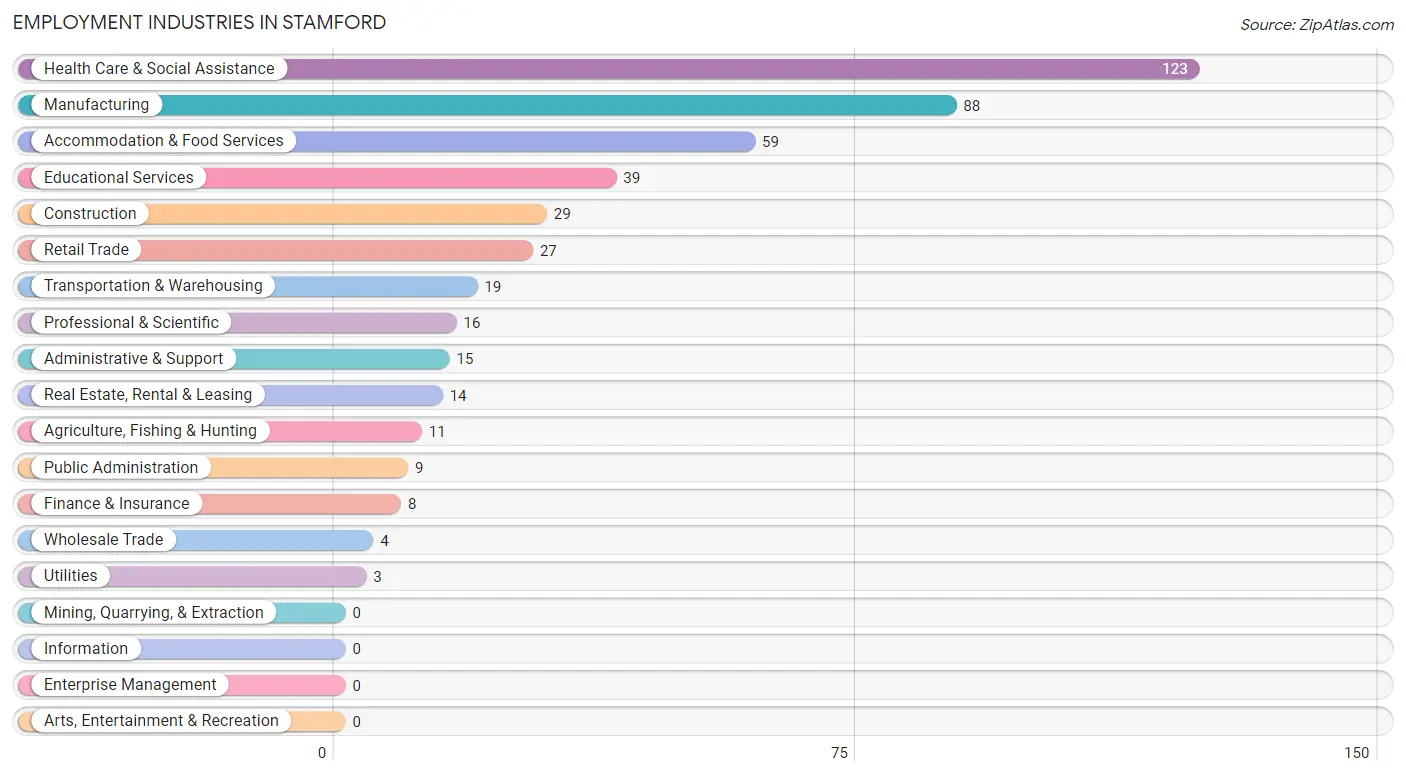
Employment Industries in Stamford
The major employment industries in Stamford include Health Care & Social Assistance (123 | 25.8%), Manufacturing (88 | 18.4%), Accommodation & Food Services (59 | 12.4%), Educational Services (39 | 8.2%), and Construction (29 | 6.1%).
Employment Industries by Sex in Stamford
The Stamford industries that see more men than women are Agriculture, Fishing & Hunting (100.0%), Construction (100.0%), and Transportation & Warehousing (100.0%), whereas the industries that tend to have a higher number of women are Wholesale Trade (100.0%), Professional & Scientific (81.2%), and Administrative & Support (80.0%).
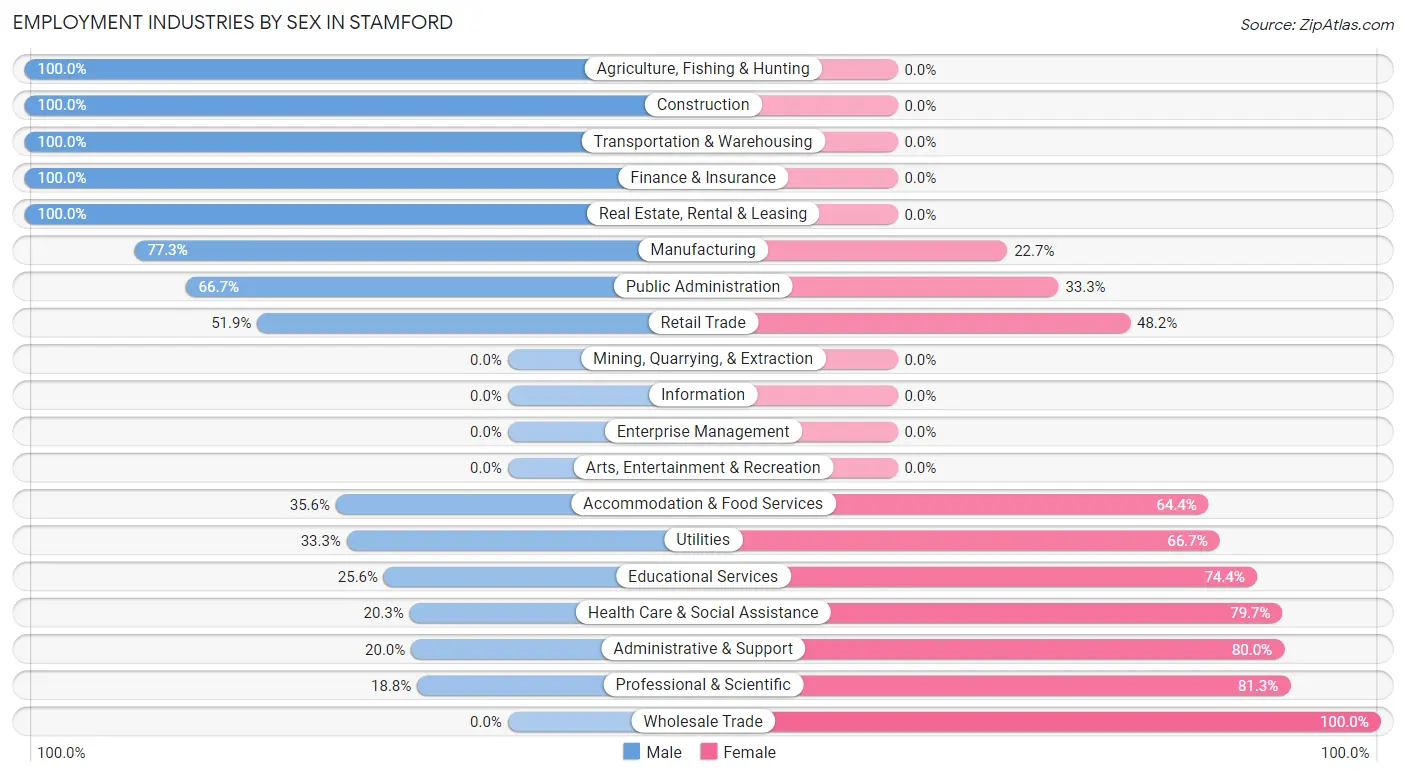
| Industry | Male | Female |
| Agriculture, Fishing & Hunting | 11 (100.0%) | 0 (0.0%) |
| Mining, Quarrying, & Extraction | 0 (0.0%) | 0 (0.0%) |
| Construction | 29 (100.0%) | 0 (0.0%) |
| Manufacturing | 68 (77.3%) | 20 (22.7%) |
| Wholesale Trade | 0 (0.0%) | 4 (100.0%) |
| Retail Trade | 14 (51.8%) | 13 (48.1%) |
| Transportation & Warehousing | 19 (100.0%) | 0 (0.0%) |
| Utilities | 1 (33.3%) | 2 (66.7%) |
| Information | 0 (0.0%) | 0 (0.0%) |
| Finance & Insurance | 8 (100.0%) | 0 (0.0%) |
| Real Estate, Rental & Leasing | 14 (100.0%) | 0 (0.0%) |
| Professional & Scientific | 3 (18.8%) | 13 (81.2%) |
| Enterprise Management | 0 (0.0%) | 0 (0.0%) |
| Administrative & Support | 3 (20.0%) | 12 (80.0%) |
| Educational Services | 10 (25.6%) | 29 (74.4%) |
| Health Care & Social Assistance | 25 (20.3%) | 98 (79.7%) |
| Arts, Entertainment & Recreation | 0 (0.0%) | 0 (0.0%) |
| Accommodation & Food Services | 21 (35.6%) | 38 (64.4%) |
| Public Administration | 6 (66.7%) | 3 (33.3%) |
| Total | 245 (51.4%) | 232 (48.6%) |
Education in Stamford
School Enrollment in Stamford
The most common levels of schooling among the 243 students in Stamford are high school (81 | 33.3%), elementary school (62 | 25.5%), and college / undergraduate (48 | 19.8%).
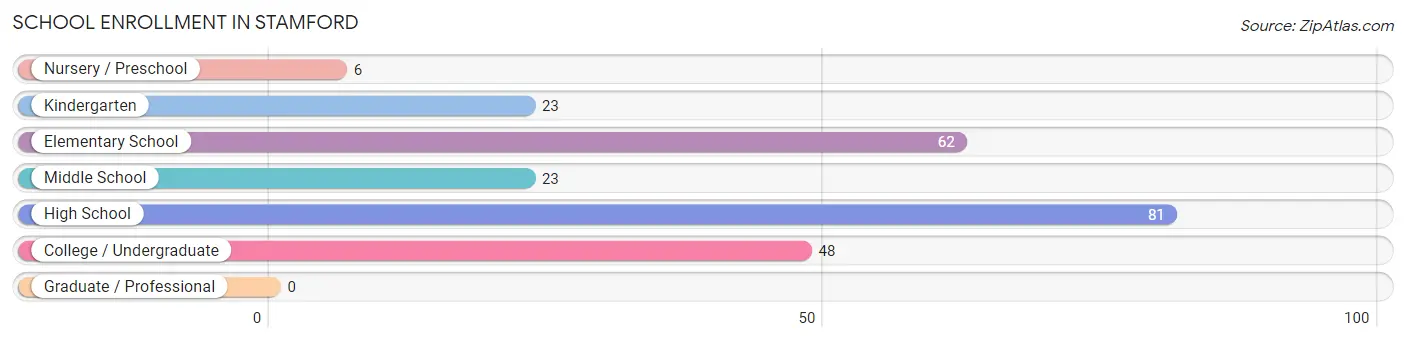
| School Level | # Students | % Students |
| Nursery / Preschool | 6 | 2.5% |
| Kindergarten | 23 | 9.5% |
| Elementary School | 62 | 25.5% |
| Middle School | 23 | 9.5% |
| High School | 81 | 33.3% |
| College / Undergraduate | 48 | 19.8% |
| Graduate / Professional | 0 | 0.0% |
| Total | 243 | 100.0% |
School Enrollment by Age by Funding Source in Stamford
Out of a total of 243 students who are enrolled in schools in Stamford, 40 (16.5%) attend a private institution, while the remaining 203 (83.5%) are enrolled in public schools. The age group of 15 to 17 year olds has the highest likelihood of being enrolled in private schools, with 17 (53.1% in the age bracket) enrolled. Conversely, the age group of 3 to 4 year olds has the lowest likelihood of being enrolled in a private school, with 3 (100.0% in the age bracket) attending a public institution.
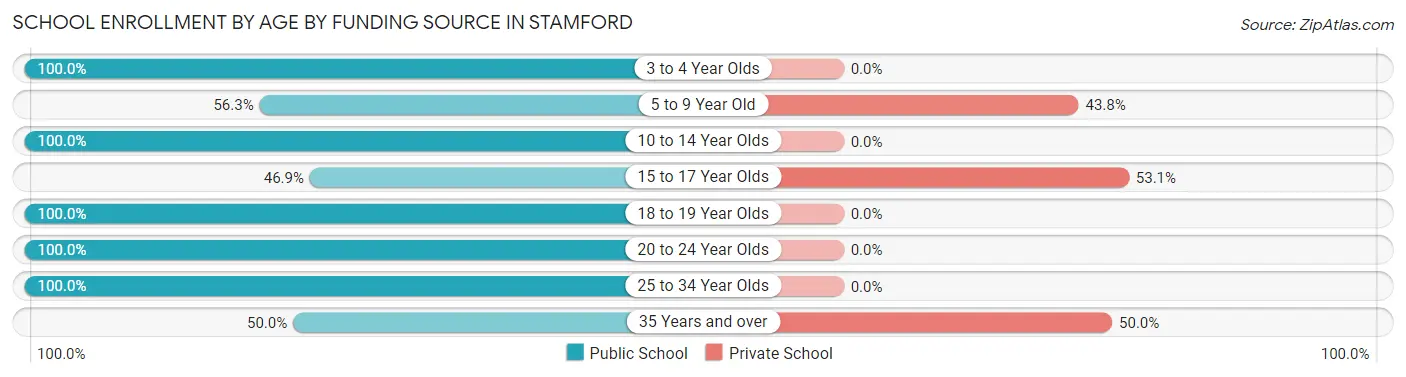
| Age Bracket | Public School | Private School |
| 3 to 4 Year Olds | 3 (100.0%) | 0 (0.0%) |
| 5 to 9 Year Old | 27 (56.2%) | 21 (43.8%) |
| 10 to 14 Year Olds | 91 (100.0%) | 0 (0.0%) |
| 15 to 17 Year Olds | 15 (46.9%) | 17 (53.1%) |
| 18 to 19 Year Olds | 28 (100.0%) | 0 (0.0%) |
| 20 to 24 Year Olds | 35 (100.0%) | 0 (0.0%) |
| 25 to 34 Year Olds | 2 (100.0%) | 0 (0.0%) |
| 35 Years and over | 2 (50.0%) | 2 (50.0%) |
| Total | 203 (83.5%) | 40 (16.5%) |
Educational Attainment by Field of Study in Stamford
Business (42 | 18.3%), education (39 | 17.0%), liberal arts & history (28 | 12.2%), visual & performing arts (26 | 11.4%), and bio, nature & agricultural (17 | 7.4%) are the most common fields of study among 229 individuals in Stamford who have obtained a bachelor's degree or higher.
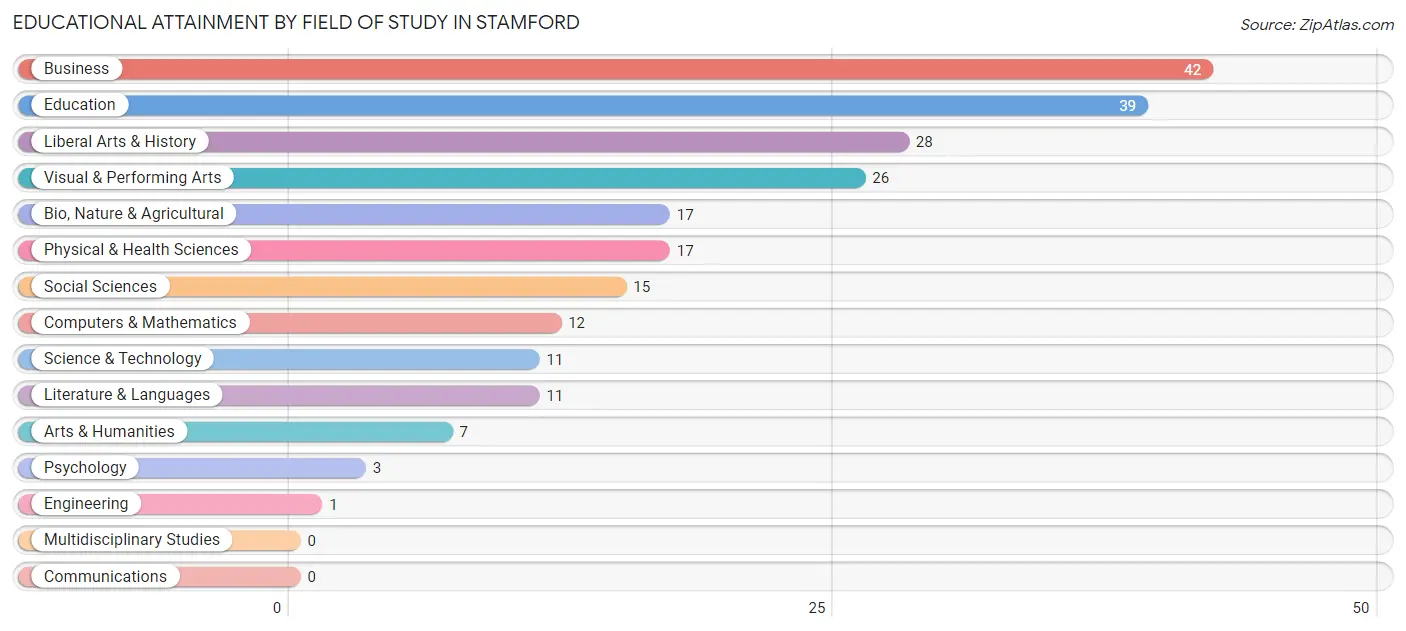
| Field of Study | # Graduates | % Graduates |
| Computers & Mathematics | 12 | 5.2% |
| Bio, Nature & Agricultural | 17 | 7.4% |
| Physical & Health Sciences | 17 | 7.4% |
| Psychology | 3 | 1.3% |
| Social Sciences | 15 | 6.6% |
| Engineering | 1 | 0.4% |
| Multidisciplinary Studies | 0 | 0.0% |
| Science & Technology | 11 | 4.8% |
| Business | 42 | 18.3% |
| Education | 39 | 17.0% |
| Literature & Languages | 11 | 4.8% |
| Liberal Arts & History | 28 | 12.2% |
| Visual & Performing Arts | 26 | 11.4% |
| Communications | 0 | 0.0% |
| Arts & Humanities | 7 | 3.1% |
| Total | 229 | 100.0% |
Transportation & Commute in Stamford
Vehicle Availability by Sex in Stamford
The most prevalent vehicle ownership categories in Stamford are males with 2 vehicles (121, accounting for 52.6%) and females with 2 vehicles (93, making up 54.7%).
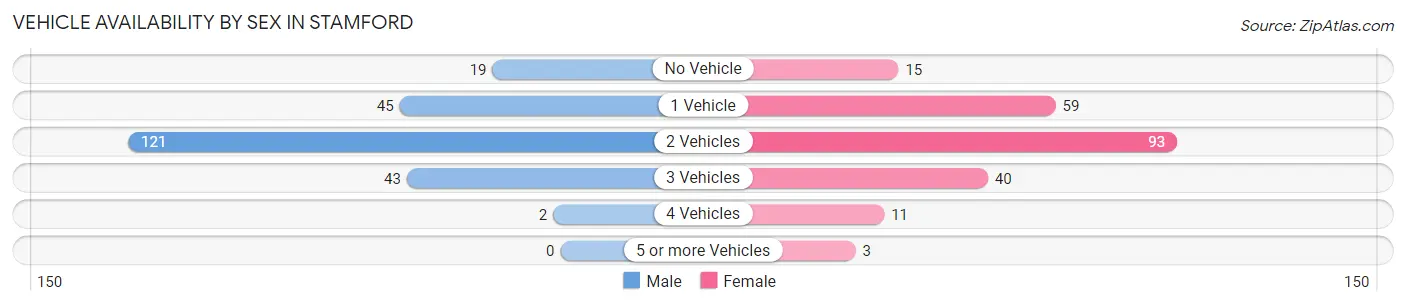
| Vehicles Available | Male | Female |
| No Vehicle | 19 (8.3%) | 15 (6.8%) |
| 1 Vehicle | 45 (19.6%) | 59 (26.7%) |
| 2 Vehicles | 121 (52.6%) | 93 (42.1%) |
| 3 Vehicles | 43 (18.7%) | 40 (18.1%) |
| 4 Vehicles | 2 (0.9%) | 11 (5.0%) |
| 5 or more Vehicles | 0 (0.0%) | 3 (1.4%) |
| Total | 230 (100.0%) | 221 (100.0%) |
Commute Time in Stamford
The most frequently occuring commute durations in Stamford are 10 to 14 minutes (61 commuters, 14.6%), 30 to 34 minutes (55 commuters, 13.2%), and 45 to 59 minutes (54 commuters, 12.9%).
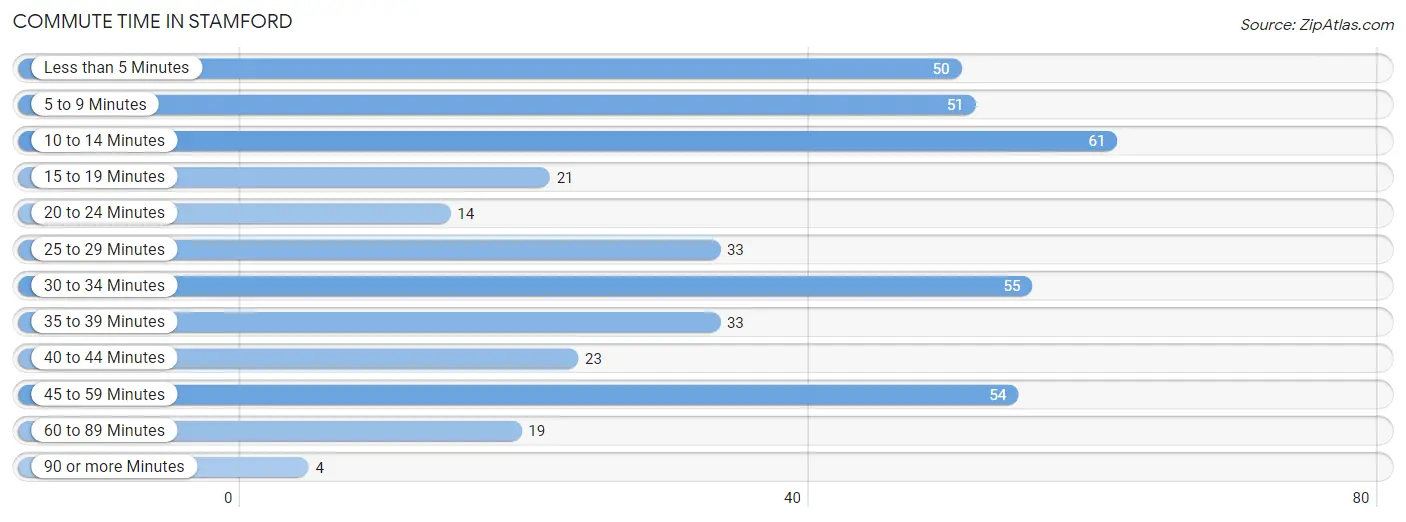
| Commute Time | # Commuters | % Commuters |
| Less than 5 Minutes | 50 | 12.0% |
| 5 to 9 Minutes | 51 | 12.2% |
| 10 to 14 Minutes | 61 | 14.6% |
| 15 to 19 Minutes | 21 | 5.0% |
| 20 to 24 Minutes | 14 | 3.4% |
| 25 to 29 Minutes | 33 | 7.9% |
| 30 to 34 Minutes | 55 | 13.2% |
| 35 to 39 Minutes | 33 | 7.9% |
| 40 to 44 Minutes | 23 | 5.5% |
| 45 to 59 Minutes | 54 | 12.9% |
| 60 to 89 Minutes | 19 | 4.5% |
| 90 or more Minutes | 4 | 1.0% |
Commute Time by Sex in Stamford
The most common commute times in Stamford are 5 to 9 minutes (36 commuters, 16.7%) for males and 45 to 59 minutes (45 commuters, 22.3%) for females.
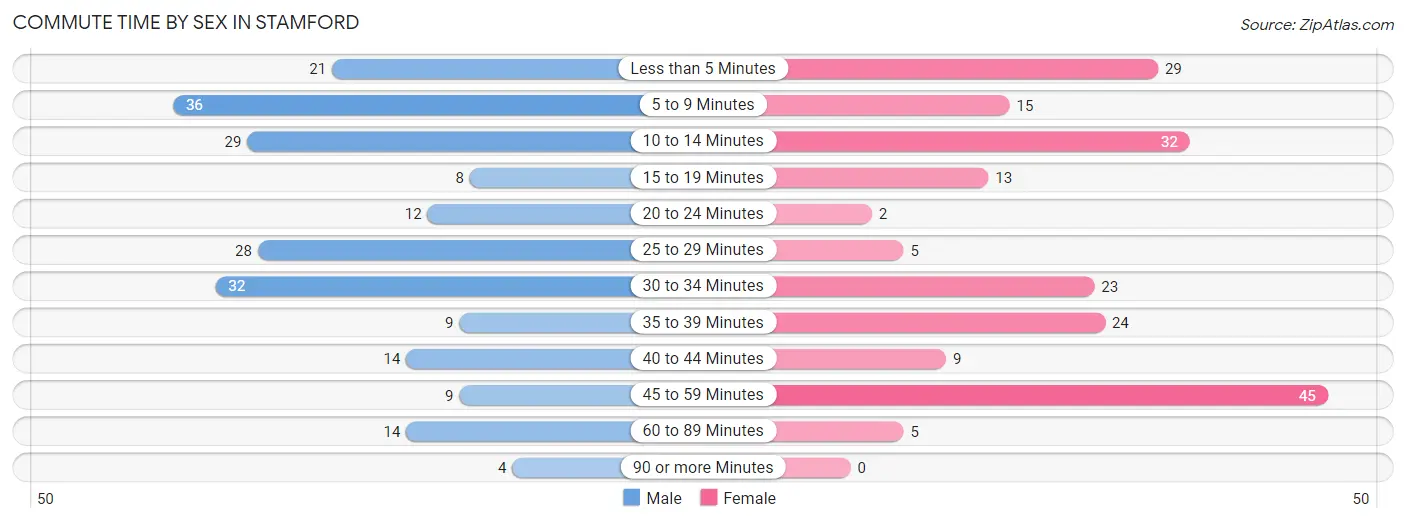
| Commute Time | Male | Female |
| Less than 5 Minutes | 21 (9.7%) | 29 (14.4%) |
| 5 to 9 Minutes | 36 (16.7%) | 15 (7.4%) |
| 10 to 14 Minutes | 29 (13.4%) | 32 (15.8%) |
| 15 to 19 Minutes | 8 (3.7%) | 13 (6.4%) |
| 20 to 24 Minutes | 12 (5.6%) | 2 (1.0%) |
| 25 to 29 Minutes | 28 (13.0%) | 5 (2.5%) |
| 30 to 34 Minutes | 32 (14.8%) | 23 (11.4%) |
| 35 to 39 Minutes | 9 (4.2%) | 24 (11.9%) |
| 40 to 44 Minutes | 14 (6.5%) | 9 (4.5%) |
| 45 to 59 Minutes | 9 (4.2%) | 45 (22.3%) |
| 60 to 89 Minutes | 14 (6.5%) | 5 (2.5%) |
| 90 or more Minutes | 4 (1.8%) | 0 (0.0%) |
Time of Departure to Work by Sex in Stamford
The most frequent times of departure to work in Stamford are 5:30 AM to 5:59 AM (33, 15.3%) for males and 7:30 AM to 7:59 AM (45, 22.3%) for females.
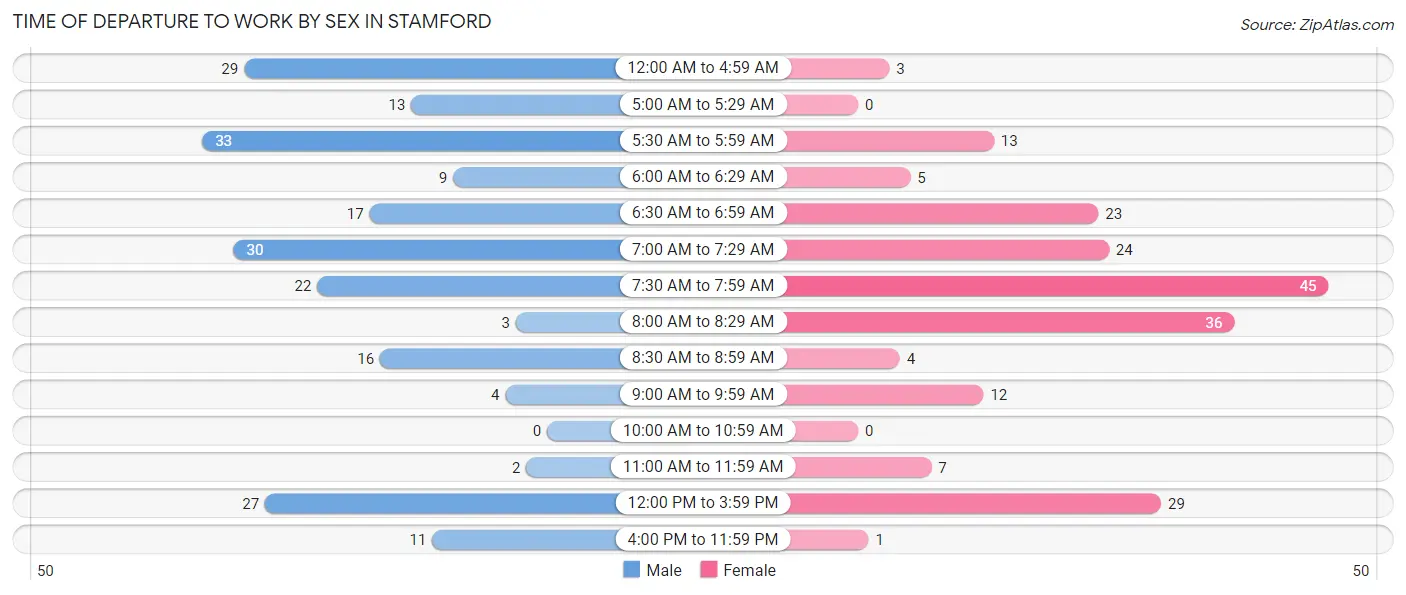
| Time of Departure | Male | Female |
| 12:00 AM to 4:59 AM | 29 (13.4%) | 3 (1.5%) |
| 5:00 AM to 5:29 AM | 13 (6.0%) | 0 (0.0%) |
| 5:30 AM to 5:59 AM | 33 (15.3%) | 13 (6.4%) |
| 6:00 AM to 6:29 AM | 9 (4.2%) | 5 (2.5%) |
| 6:30 AM to 6:59 AM | 17 (7.9%) | 23 (11.4%) |
| 7:00 AM to 7:29 AM | 30 (13.9%) | 24 (11.9%) |
| 7:30 AM to 7:59 AM | 22 (10.2%) | 45 (22.3%) |
| 8:00 AM to 8:29 AM | 3 (1.4%) | 36 (17.8%) |
| 8:30 AM to 8:59 AM | 16 (7.4%) | 4 (2.0%) |
| 9:00 AM to 9:59 AM | 4 (1.8%) | 12 (5.9%) |
| 10:00 AM to 10:59 AM | 0 (0.0%) | 0 (0.0%) |
| 11:00 AM to 11:59 AM | 2 (0.9%) | 7 (3.5%) |
| 12:00 PM to 3:59 PM | 27 (12.5%) | 29 (14.4%) |
| 4:00 PM to 11:59 PM | 11 (5.1%) | 1 (0.5%) |
| Total | 216 (100.0%) | 202 (100.0%) |
Housing Occupancy in Stamford
Occupancy by Ownership in Stamford
Of the total 498 dwellings in Stamford, owner-occupied units account for 269 (54.0%), while renter-occupied units make up 229 (46.0%).
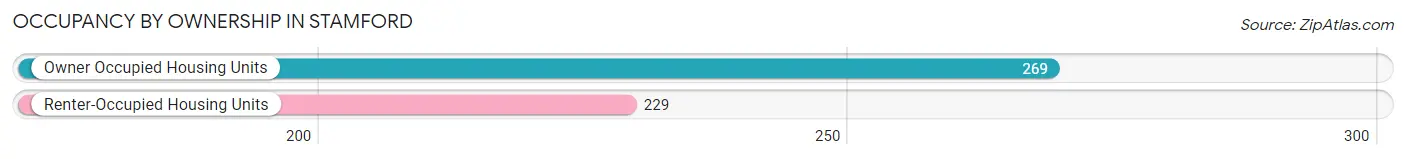
| Occupancy | # Housing Units | % Housing Units |
| Owner Occupied Housing Units | 269 | 54.0% |
| Renter-Occupied Housing Units | 229 | 46.0% |
| Total Occupied Housing Units | 498 | 100.0% |
Occupancy by Household Size in Stamford
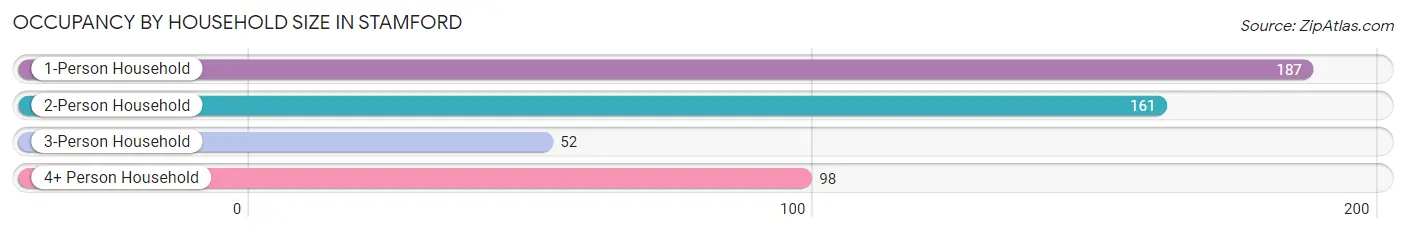
| Household Size | # Housing Units | % Housing Units |
| 1-Person Household | 187 | 37.6% |
| 2-Person Household | 161 | 32.3% |
| 3-Person Household | 52 | 10.4% |
| 4+ Person Household | 98 | 19.7% |
| Total Housing Units | 498 | 100.0% |
Occupancy by Ownership by Household Size in Stamford
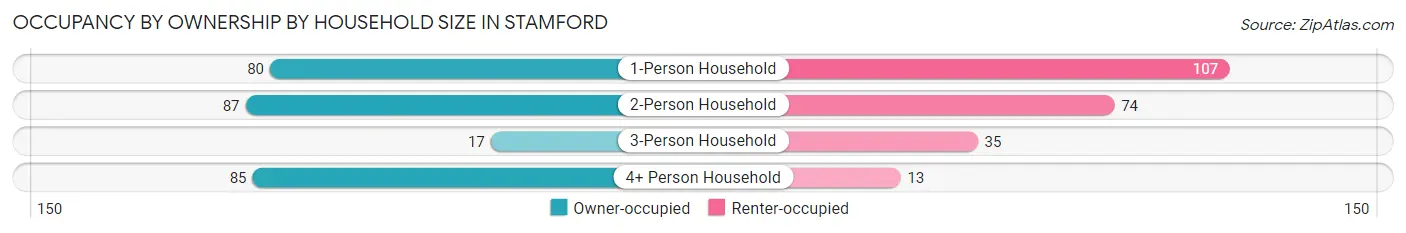
| Household Size | Owner-occupied | Renter-occupied |
| 1-Person Household | 80 (42.8%) | 107 (57.2%) |
| 2-Person Household | 87 (54.0%) | 74 (46.0%) |
| 3-Person Household | 17 (32.7%) | 35 (67.3%) |
| 4+ Person Household | 85 (86.7%) | 13 (13.3%) |
| Total Housing Units | 269 (54.0%) | 229 (46.0%) |
Occupancy by Educational Attainment in Stamford
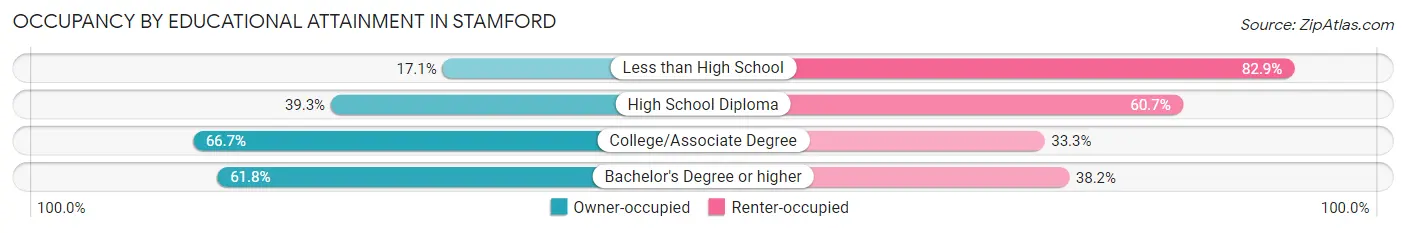
| Household Size | Owner-occupied | Renter-occupied |
| Less than High School | 6 (17.1%) | 29 (82.9%) |
| High School Diploma | 53 (39.3%) | 82 (60.7%) |
| College/Associate Degree | 100 (66.7%) | 50 (33.3%) |
| Bachelor's Degree or higher | 110 (61.8%) | 68 (38.2%) |
Occupancy by Age of Householder in Stamford
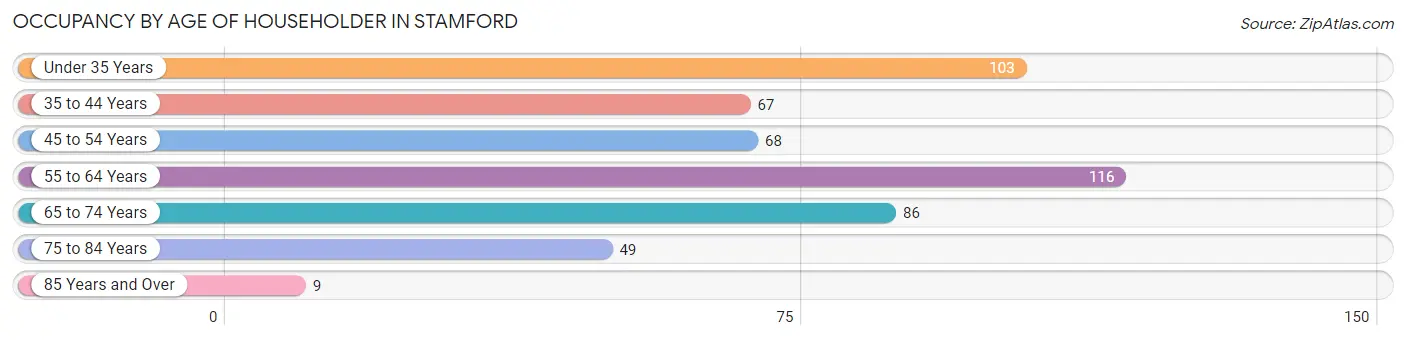
| Age Bracket | # Households | % Households |
| Under 35 Years | 103 | 20.7% |
| 35 to 44 Years | 67 | 13.5% |
| 45 to 54 Years | 68 | 13.7% |
| 55 to 64 Years | 116 | 23.3% |
| 65 to 74 Years | 86 | 17.3% |
| 75 to 84 Years | 49 | 9.8% |
| 85 Years and Over | 9 | 1.8% |
| Total | 498 | 100.0% |
Housing Finances in Stamford
Median Income by Occupancy in Stamford
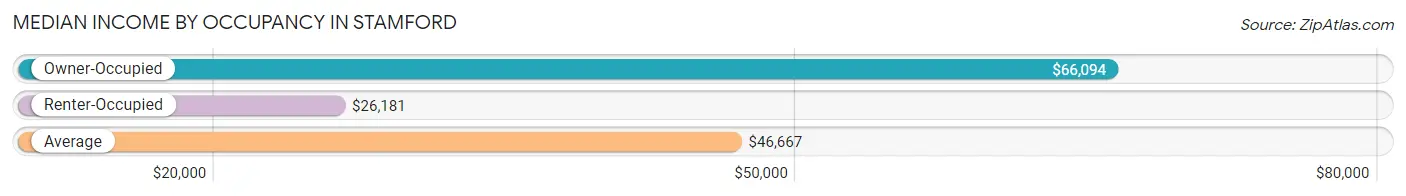
| Occupancy Type | # Households | Median Income |
| Owner-Occupied | 269 (54.0%) | $66,094 |
| Renter-Occupied | 229 (46.0%) | $26,181 |
| Average | 498 (100.0%) | $46,667 |
Occupancy by Householder Income Bracket in Stamford
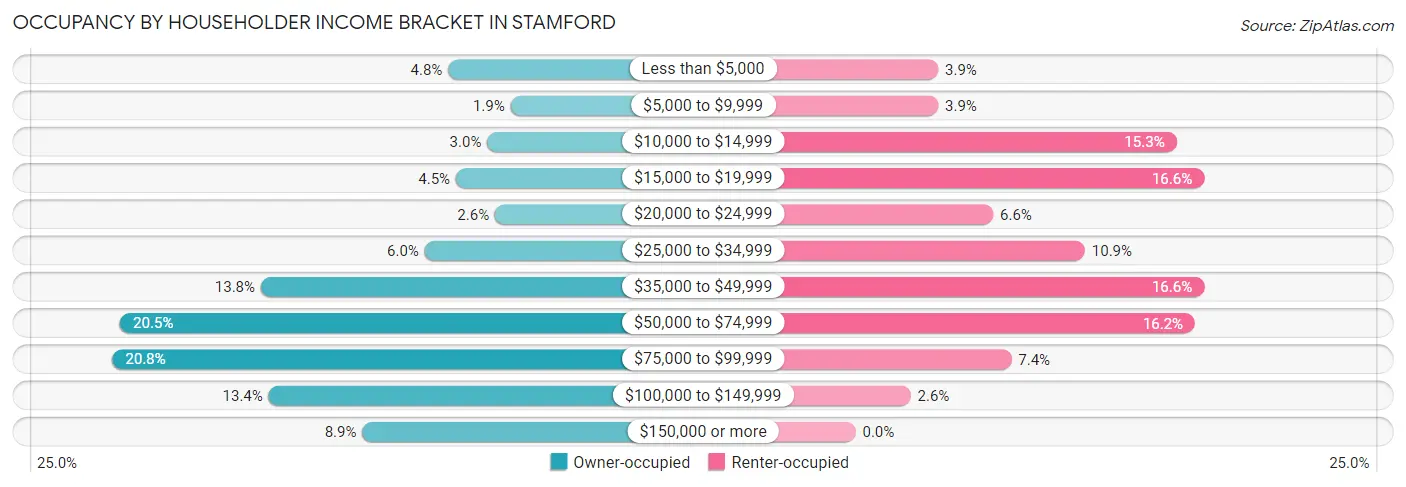
| Income Bracket | Owner-occupied | Renter-occupied |
| Less than $5,000 | 13 (4.8%) | 9 (3.9%) |
| $5,000 to $9,999 | 5 (1.9%) | 9 (3.9%) |
| $10,000 to $14,999 | 8 (3.0%) | 35 (15.3%) |
| $15,000 to $19,999 | 12 (4.5%) | 38 (16.6%) |
| $20,000 to $24,999 | 7 (2.6%) | 15 (6.6%) |
| $25,000 to $34,999 | 16 (5.9%) | 25 (10.9%) |
| $35,000 to $49,999 | 37 (13.8%) | 38 (16.6%) |
| $50,000 to $74,999 | 55 (20.4%) | 37 (16.2%) |
| $75,000 to $99,999 | 56 (20.8%) | 17 (7.4%) |
| $100,000 to $149,999 | 36 (13.4%) | 6 (2.6%) |
| $150,000 or more | 24 (8.9%) | 0 (0.0%) |
| Total | 269 (100.0%) | 229 (100.0%) |
Monthly Housing Cost Tiers in Stamford
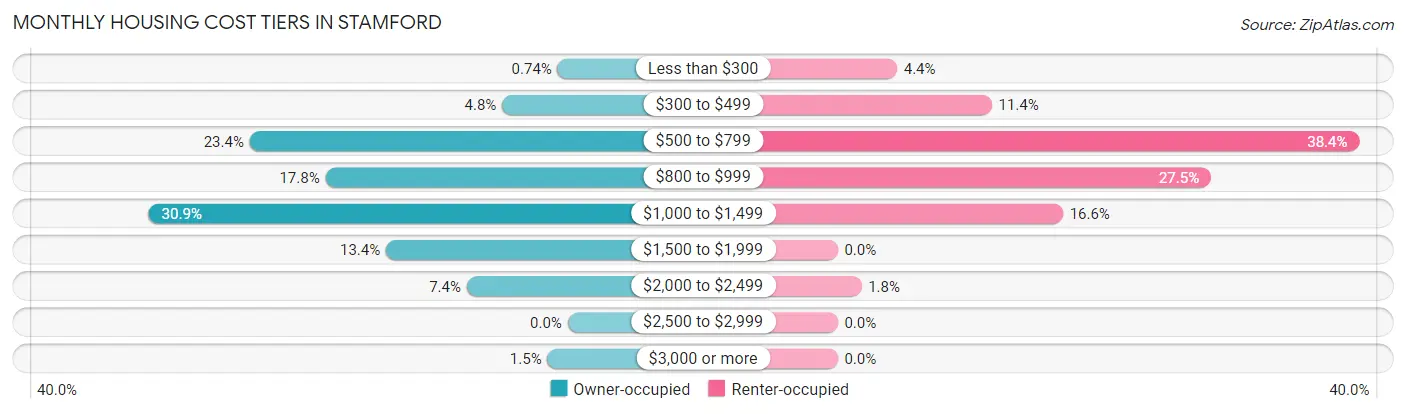
| Monthly Cost | Owner-occupied | Renter-occupied |
| Less than $300 | 2 (0.7%) | 10 (4.4%) |
| $300 to $499 | 13 (4.8%) | 26 (11.4%) |
| $500 to $799 | 63 (23.4%) | 88 (38.4%) |
| $800 to $999 | 48 (17.8%) | 63 (27.5%) |
| $1,000 to $1,499 | 83 (30.9%) | 38 (16.6%) |
| $1,500 to $1,999 | 36 (13.4%) | 0 (0.0%) |
| $2,000 to $2,499 | 20 (7.4%) | 4 (1.8%) |
| $2,500 to $2,999 | 0 (0.0%) | 0 (0.0%) |
| $3,000 or more | 4 (1.5%) | 0 (0.0%) |
| Total | 269 (100.0%) | 229 (100.0%) |
Physical Housing Characteristics in Stamford
Housing Structures in Stamford
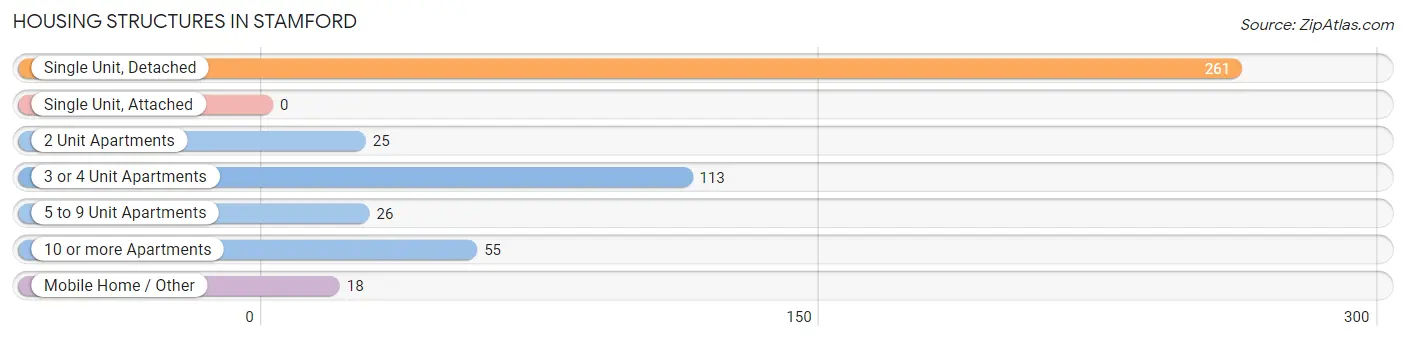
| Structure Type | # Housing Units | % Housing Units |
| Single Unit, Detached | 261 | 52.4% |
| Single Unit, Attached | 0 | 0.0% |
| 2 Unit Apartments | 25 | 5.0% |
| 3 or 4 Unit Apartments | 113 | 22.7% |
| 5 to 9 Unit Apartments | 26 | 5.2% |
| 10 or more Apartments | 55 | 11.0% |
| Mobile Home / Other | 18 | 3.6% |
| Total | 498 | 100.0% |
Housing Structures by Occupancy in Stamford
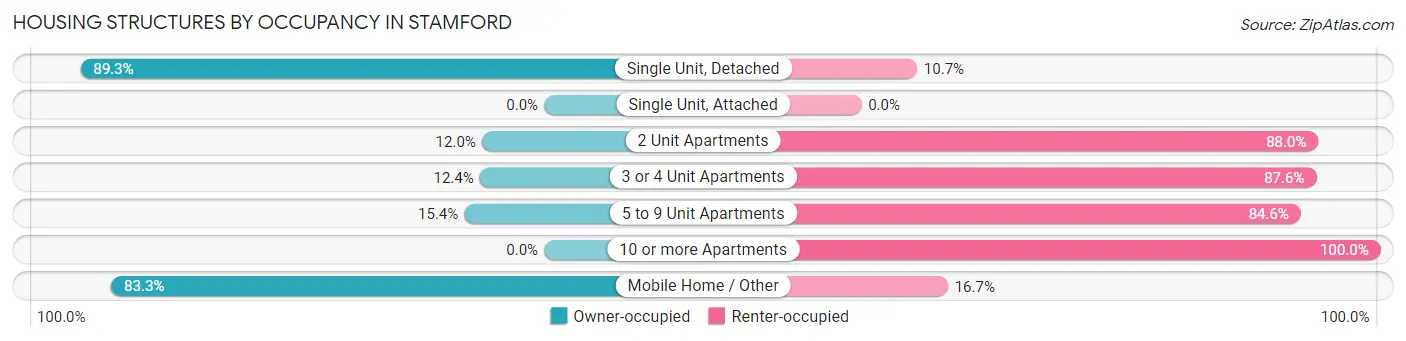
| Structure Type | Owner-occupied | Renter-occupied |
| Single Unit, Detached | 233 (89.3%) | 28 (10.7%) |
| Single Unit, Attached | 0 (0.0%) | 0 (0.0%) |
| 2 Unit Apartments | 3 (12.0%) | 22 (88.0%) |
| 3 or 4 Unit Apartments | 14 (12.4%) | 99 (87.6%) |
| 5 to 9 Unit Apartments | 4 (15.4%) | 22 (84.6%) |
| 10 or more Apartments | 0 (0.0%) | 55 (100.0%) |
| Mobile Home / Other | 15 (83.3%) | 3 (16.7%) |
| Total | 269 (54.0%) | 229 (46.0%) |
Housing Structures by Number of Rooms in Stamford
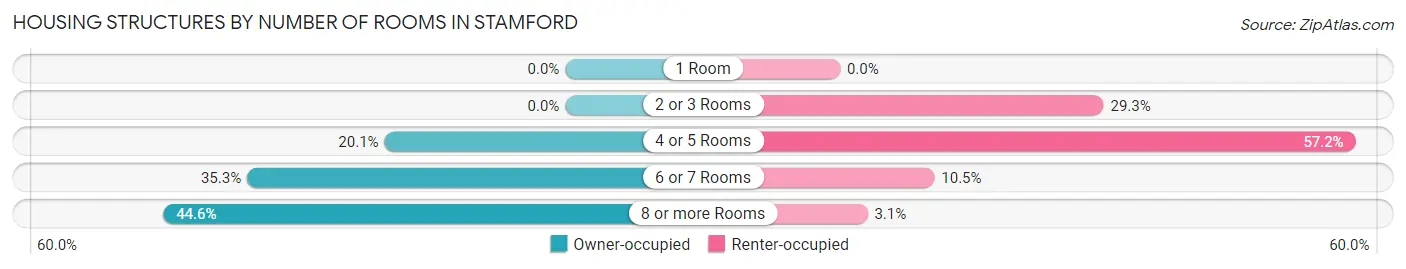
| Number of Rooms | Owner-occupied | Renter-occupied |
| 1 Room | 0 (0.0%) | 0 (0.0%) |
| 2 or 3 Rooms | 0 (0.0%) | 67 (29.3%) |
| 4 or 5 Rooms | 54 (20.1%) | 131 (57.2%) |
| 6 or 7 Rooms | 95 (35.3%) | 24 (10.5%) |
| 8 or more Rooms | 120 (44.6%) | 7 (3.1%) |
| Total | 269 (100.0%) | 229 (100.0%) |
Housing Structure by Heating Type in Stamford
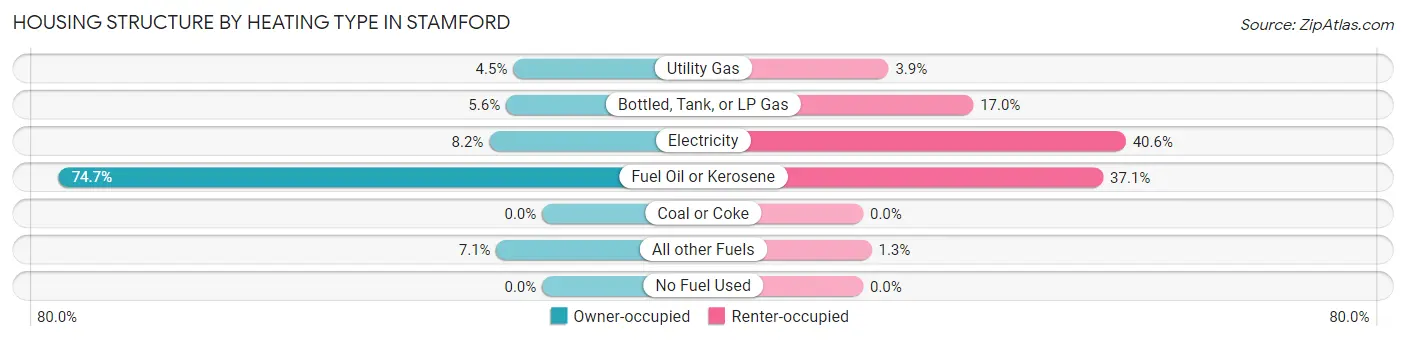
| Heating Type | Owner-occupied | Renter-occupied |
| Utility Gas | 12 (4.5%) | 9 (3.9%) |
| Bottled, Tank, or LP Gas | 15 (5.6%) | 39 (17.0%) |
| Electricity | 22 (8.2%) | 93 (40.6%) |
| Fuel Oil or Kerosene | 201 (74.7%) | 85 (37.1%) |
| Coal or Coke | 0 (0.0%) | 0 (0.0%) |
| All other Fuels | 19 (7.1%) | 3 (1.3%) |
| No Fuel Used | 0 (0.0%) | 0 (0.0%) |
| Total | 269 (100.0%) | 229 (100.0%) |
Household Vehicle Usage in Stamford
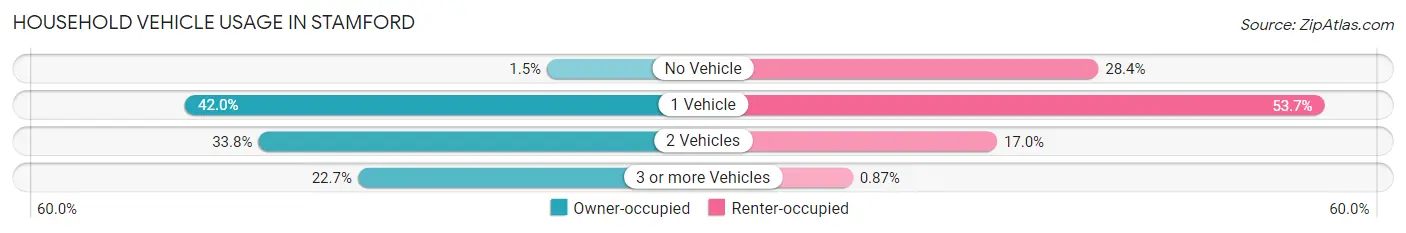
| Vehicles per Household | Owner-occupied | Renter-occupied |
| No Vehicle | 4 (1.5%) | 65 (28.4%) |
| 1 Vehicle | 113 (42.0%) | 123 (53.7%) |
| 2 Vehicles | 91 (33.8%) | 39 (17.0%) |
| 3 or more Vehicles | 61 (22.7%) | 2 (0.9%) |
| Total | 269 (100.0%) | 229 (100.0%) |
Real Estate & Mortgages in Stamford
Real Estate and Mortgage Overview in Stamford
| Characteristic | Without Mortgage | With Mortgage |
| Housing Units | 159 | 110 |
| Median Property Value | $163,900 | $153,100 |
| Median Household Income | $46,563 | $15 |
| Monthly Housing Costs | $810 | $4 |
| Real Estate Taxes | $4,783 | $0 |
Property Value by Mortgage Status in Stamford
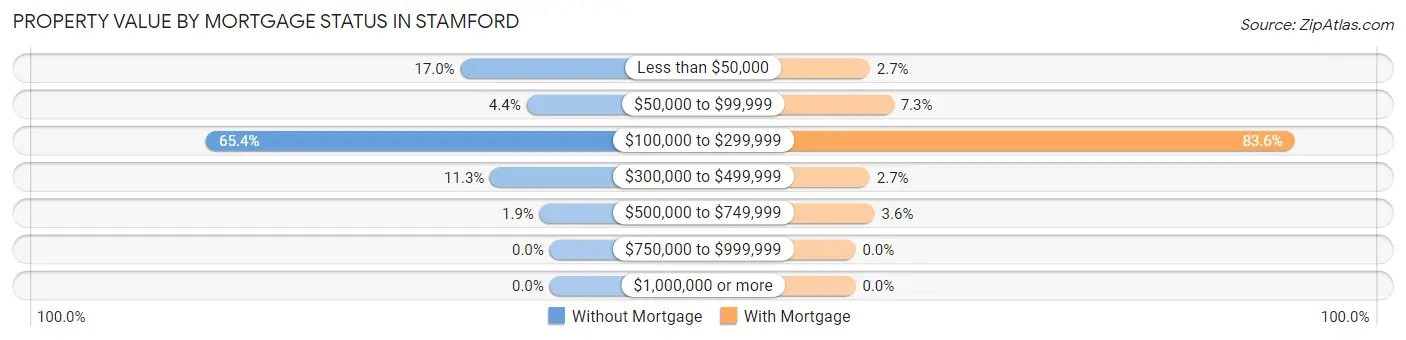
| Property Value | Without Mortgage | With Mortgage |
| Less than $50,000 | 27 (17.0%) | 3 (2.7%) |
| $50,000 to $99,999 | 7 (4.4%) | 8 (7.3%) |
| $100,000 to $299,999 | 104 (65.4%) | 92 (83.6%) |
| $300,000 to $499,999 | 18 (11.3%) | 3 (2.7%) |
| $500,000 to $749,999 | 3 (1.9%) | 4 (3.6%) |
| $750,000 to $999,999 | 0 (0.0%) | 0 (0.0%) |
| $1,000,000 or more | 0 (0.0%) | 0 (0.0%) |
| Total | 159 (100.0%) | 110 (100.0%) |
Household Income by Mortgage Status in Stamford
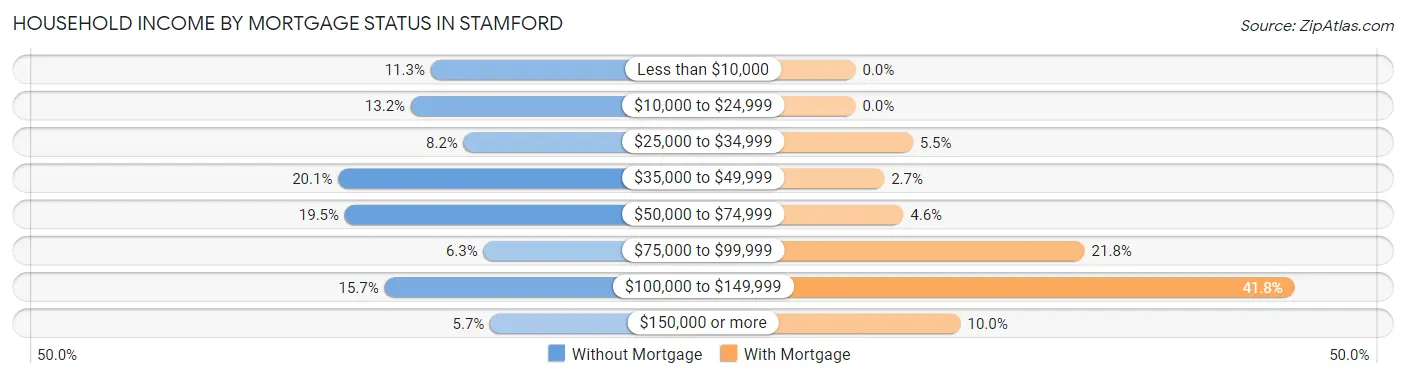
| Household Income | Without Mortgage | With Mortgage |
| Less than $10,000 | 18 (11.3%) | 0 (0.0%) |
| $10,000 to $24,999 | 21 (13.2%) | 0 (0.0%) |
| $25,000 to $34,999 | 13 (8.2%) | 6 (5.4%) |
| $35,000 to $49,999 | 32 (20.1%) | 3 (2.7%) |
| $50,000 to $74,999 | 31 (19.5%) | 5 (4.5%) |
| $75,000 to $99,999 | 10 (6.3%) | 24 (21.8%) |
| $100,000 to $149,999 | 25 (15.7%) | 46 (41.8%) |
| $150,000 or more | 9 (5.7%) | 11 (10.0%) |
| Total | 159 (100.0%) | 110 (100.0%) |
Property Value to Household Income Ratio in Stamford
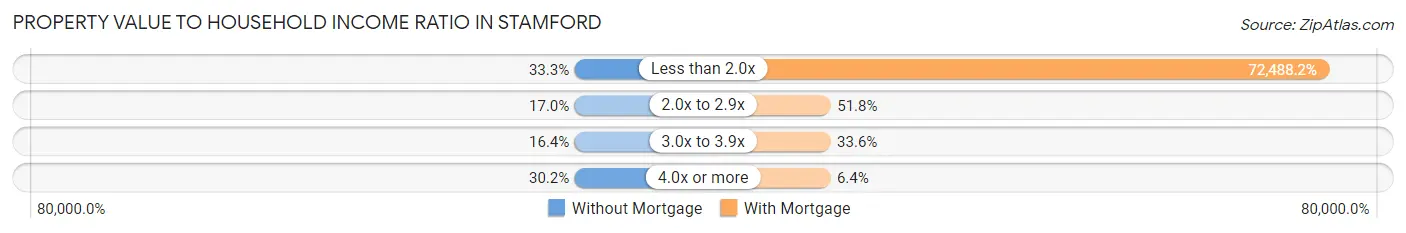
| Value-to-Income Ratio | Without Mortgage | With Mortgage |
| Less than 2.0x | 53 (33.3%) | 79,737 (72,488.2%) |
| 2.0x to 2.9x | 27 (17.0%) | 57 (51.8%) |
| 3.0x to 3.9x | 26 (16.4%) | 37 (33.6%) |
| 4.0x or more | 48 (30.2%) | 7 (6.4%) |
| Total | 159 (100.0%) | 110 (100.0%) |
Real Estate Taxes by Mortgage Status in Stamford
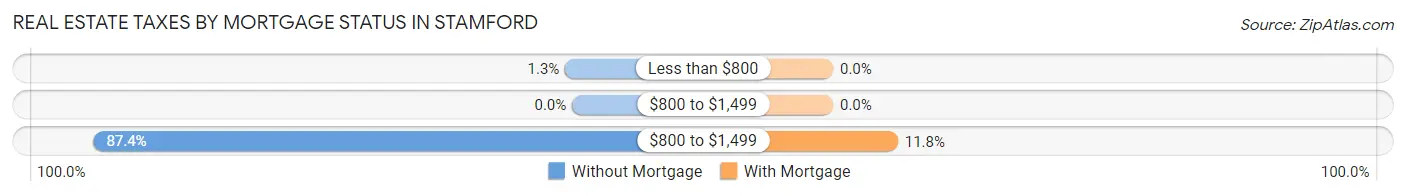
| Property Taxes | Without Mortgage | With Mortgage |
| Less than $800 | 2 (1.3%) | 0 (0.0%) |
| $800 to $1,499 | 0 (0.0%) | 0 (0.0%) |
| $800 to $1,499 | 139 (87.4%) | 13 (11.8%) |
| Total | 159 (100.0%) | 110 (100.0%) |
Health & Disability in Stamford
Health Insurance Coverage by Age in Stamford
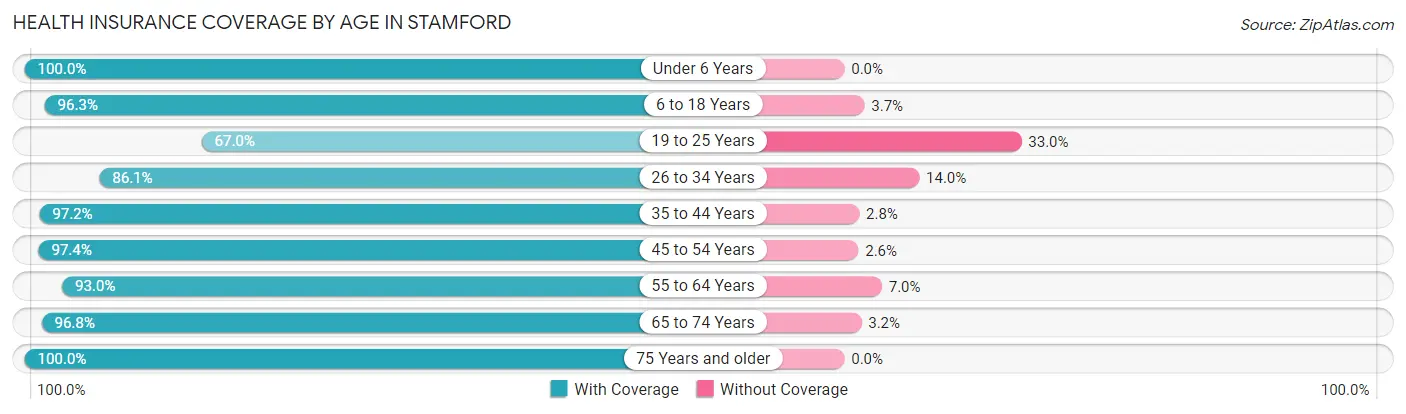
| Age Bracket | With Coverage | Without Coverage |
| Under 6 Years | 87 (100.0%) | 0 (0.0%) |
| 6 to 18 Years | 180 (96.3%) | 7 (3.7%) |
| 19 to 25 Years | 71 (67.0%) | 35 (33.0%) |
| 26 to 34 Years | 111 (86.1%) | 18 (14.0%) |
| 35 to 44 Years | 141 (97.2%) | 4 (2.8%) |
| 45 to 54 Years | 149 (97.4%) | 4 (2.6%) |
| 55 to 64 Years | 133 (93.0%) | 10 (7.0%) |
| 65 to 74 Years | 122 (96.8%) | 4 (3.2%) |
| 75 Years and older | 79 (100.0%) | 0 (0.0%) |
| Total | 1,073 (92.9%) | 82 (7.1%) |
Health Insurance Coverage by Citizenship Status in Stamford
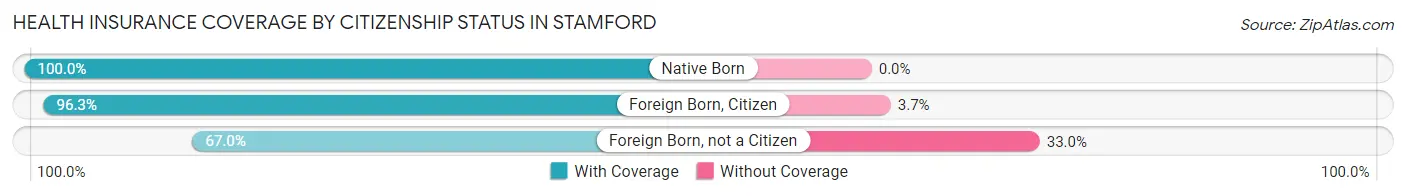
| Citizenship Status | With Coverage | Without Coverage |
| Native Born | 87 (100.0%) | 0 (0.0%) |
| Foreign Born, Citizen | 180 (96.3%) | 7 (3.7%) |
| Foreign Born, not a Citizen | 71 (67.0%) | 35 (33.0%) |
Health Insurance Coverage by Household Income in Stamford
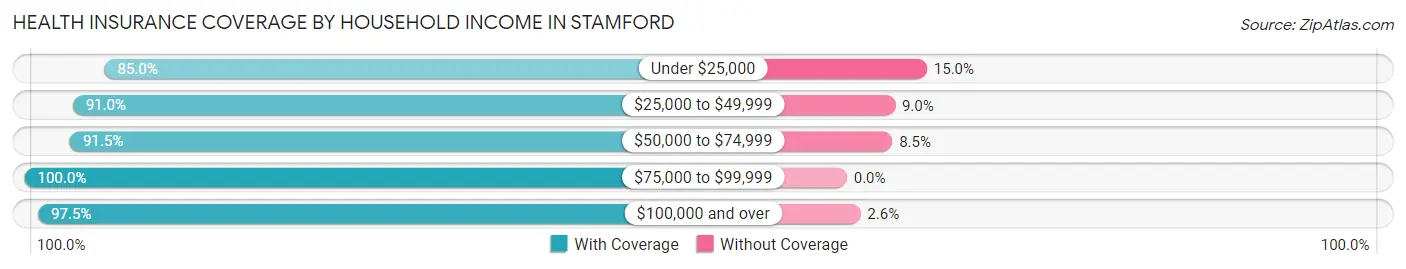
| Household Income | With Coverage | Without Coverage |
| Under $25,000 | 204 (85.0%) | 36 (15.0%) |
| $25,000 to $49,999 | 232 (91.0%) | 23 (9.0%) |
| $50,000 to $74,999 | 172 (91.5%) | 16 (8.5%) |
| $75,000 to $99,999 | 197 (100.0%) | 0 (0.0%) |
| $100,000 and over | 268 (97.5%) | 7 (2.5%) |
Public vs Private Health Insurance Coverage by Age in Stamford
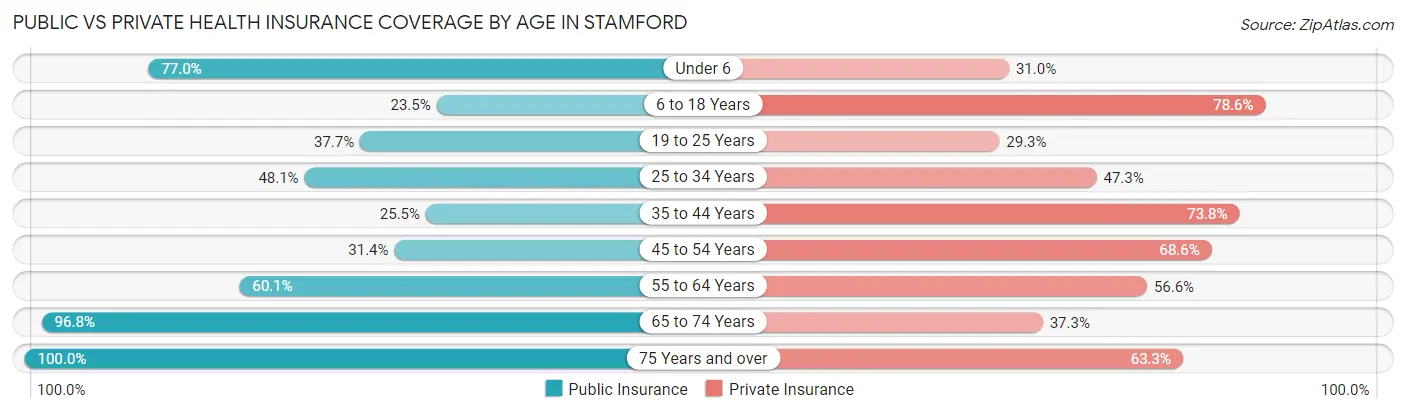
| Age Bracket | Public Insurance | Private Insurance |
| Under 6 | 67 (77.0%) | 27 (31.0%) |
| 6 to 18 Years | 44 (23.5%) | 147 (78.6%) |
| 19 to 25 Years | 40 (37.7%) | 31 (29.2%) |
| 25 to 34 Years | 62 (48.1%) | 61 (47.3%) |
| 35 to 44 Years | 37 (25.5%) | 107 (73.8%) |
| 45 to 54 Years | 48 (31.4%) | 105 (68.6%) |
| 55 to 64 Years | 86 (60.1%) | 81 (56.6%) |
| 65 to 74 Years | 122 (96.8%) | 47 (37.3%) |
| 75 Years and over | 79 (100.0%) | 50 (63.3%) |
| Total | 585 (50.6%) | 656 (56.8%) |
Disability Status by Sex by Age in Stamford
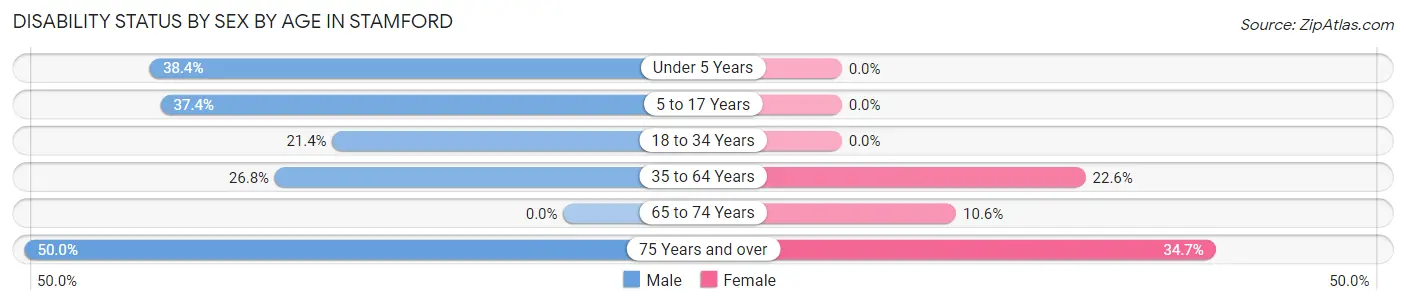
| Age Bracket | Male | Female |
| Under 5 Years | 28 (38.4%) | 0 (0.0%) |
| 5 to 17 Years | 37 (37.4%) | 0 (0.0%) |
| 18 to 34 Years | 27 (21.4%) | 0 (0.0%) |
| 35 to 64 Years | 53 (26.8%) | 55 (22.6%) |
| 65 to 74 Years | 0 (0.0%) | 7 (10.6%) |
| 75 Years and over | 15 (50.0%) | 17 (34.7%) |
Disability Class by Sex by Age in Stamford
Disability Class: Hearing Difficulty
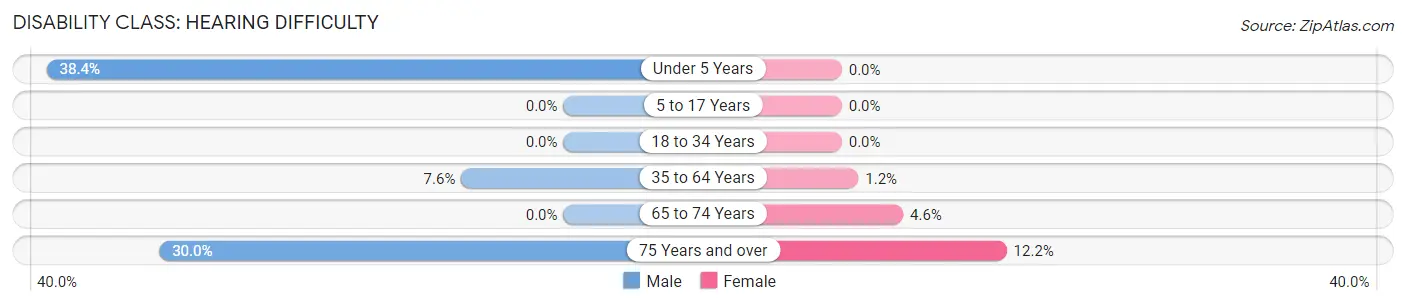
| Age Bracket | Male | Female |
| Under 5 Years | 28 (38.4%) | 0 (0.0%) |
| 5 to 17 Years | 0 (0.0%) | 0 (0.0%) |
| 18 to 34 Years | 0 (0.0%) | 0 (0.0%) |
| 35 to 64 Years | 15 (7.6%) | 3 (1.2%) |
| 65 to 74 Years | 0 (0.0%) | 3 (4.5%) |
| 75 Years and over | 9 (30.0%) | 6 (12.2%) |
Disability Class: Vision Difficulty
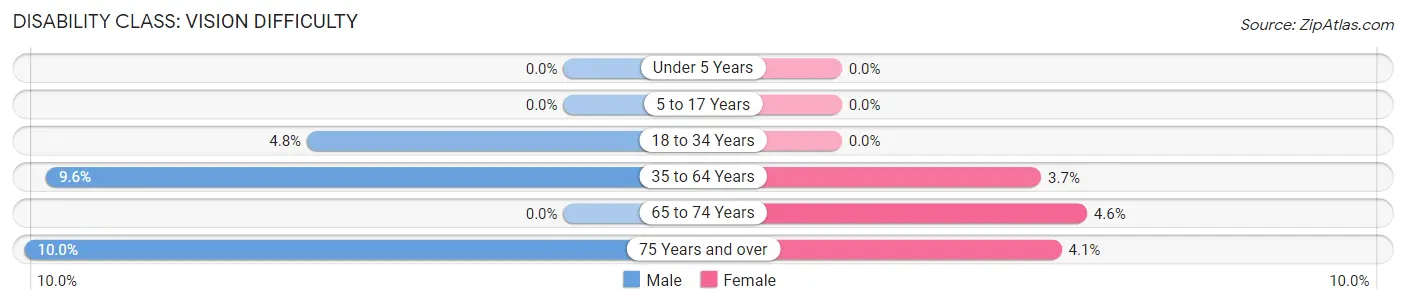
| Age Bracket | Male | Female |
| Under 5 Years | 0 (0.0%) | 0 (0.0%) |
| 5 to 17 Years | 0 (0.0%) | 0 (0.0%) |
| 18 to 34 Years | 6 (4.8%) | 0 (0.0%) |
| 35 to 64 Years | 19 (9.6%) | 9 (3.7%) |
| 65 to 74 Years | 0 (0.0%) | 3 (4.5%) |
| 75 Years and over | 3 (10.0%) | 2 (4.1%) |
Disability Class: Cognitive Difficulty
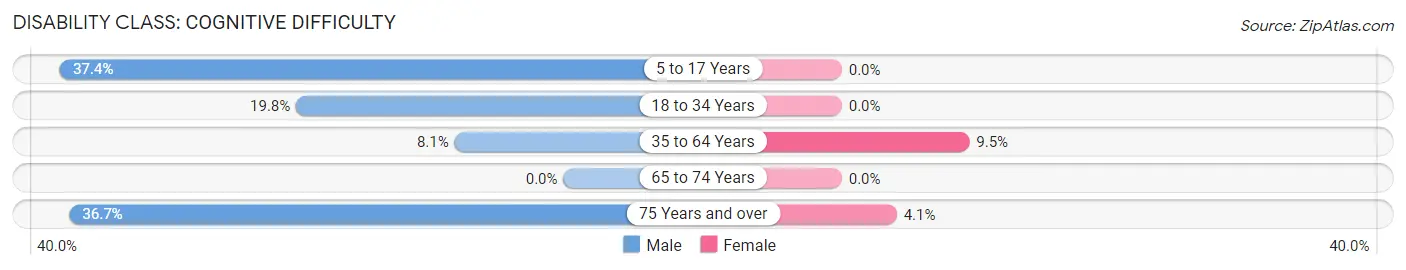
| Age Bracket | Male | Female |
| 5 to 17 Years | 37 (37.4%) | 0 (0.0%) |
| 18 to 34 Years | 25 (19.8%) | 0 (0.0%) |
| 35 to 64 Years | 16 (8.1%) | 23 (9.5%) |
| 65 to 74 Years | 0 (0.0%) | 0 (0.0%) |
| 75 Years and over | 11 (36.7%) | 2 (4.1%) |
Disability Class: Ambulatory Difficulty
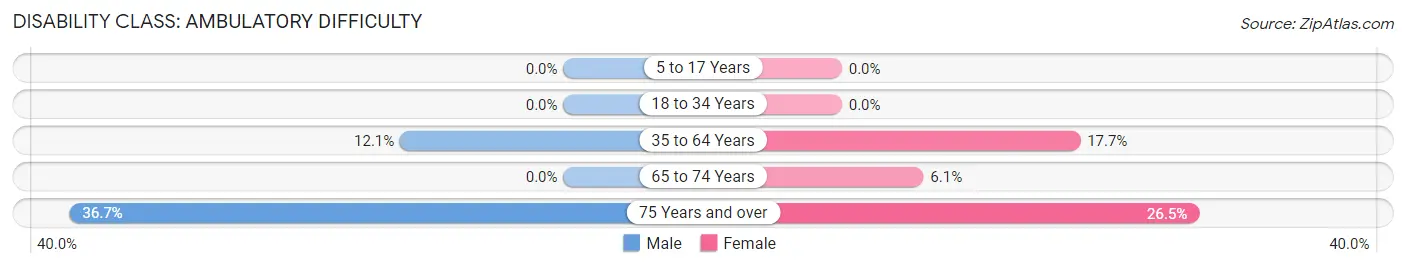
| Age Bracket | Male | Female |
| 5 to 17 Years | 0 (0.0%) | 0 (0.0%) |
| 18 to 34 Years | 0 (0.0%) | 0 (0.0%) |
| 35 to 64 Years | 24 (12.1%) | 43 (17.7%) |
| 65 to 74 Years | 0 (0.0%) | 4 (6.1%) |
| 75 Years and over | 11 (36.7%) | 13 (26.5%) |
Disability Class: Self-Care Difficulty
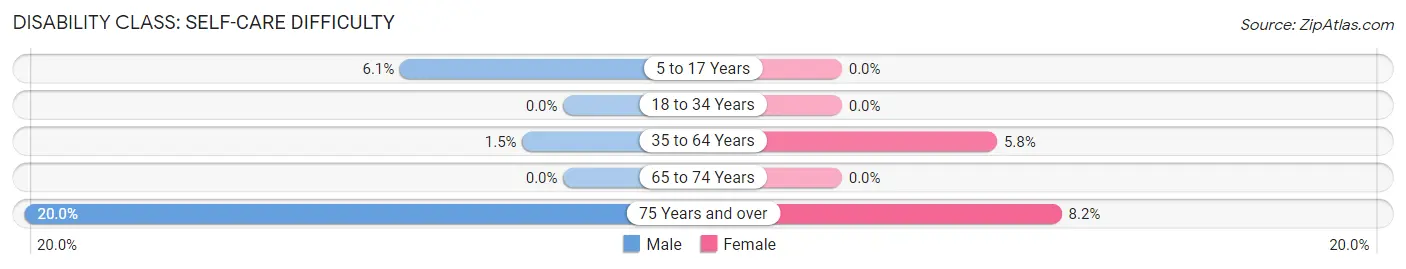
| Age Bracket | Male | Female |
| 5 to 17 Years | 6 (6.1%) | 0 (0.0%) |
| 18 to 34 Years | 0 (0.0%) | 0 (0.0%) |
| 35 to 64 Years | 3 (1.5%) | 14 (5.8%) |
| 65 to 74 Years | 0 (0.0%) | 0 (0.0%) |
| 75 Years and over | 6 (20.0%) | 4 (8.2%) |
Technology Access in Stamford
Computing Device Access in Stamford
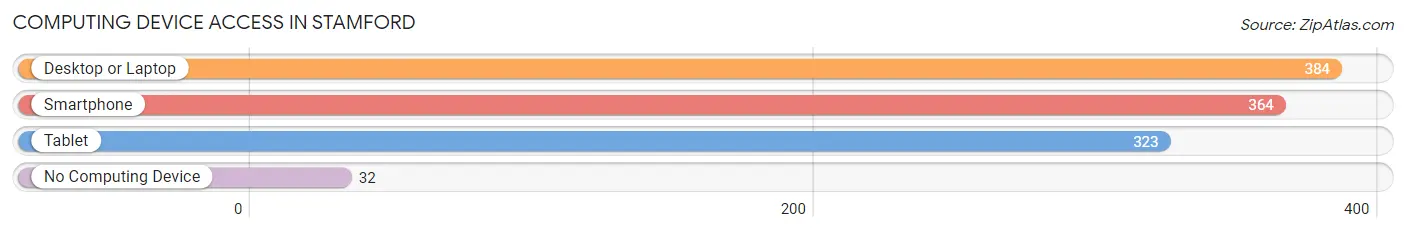
| Device Type | # Households | % Households |
| Desktop or Laptop | 384 | 77.1% |
| Smartphone | 364 | 73.1% |
| Tablet | 323 | 64.9% |
| No Computing Device | 32 | 6.4% |
| Total | 498 | 100.0% |
Internet Access in Stamford
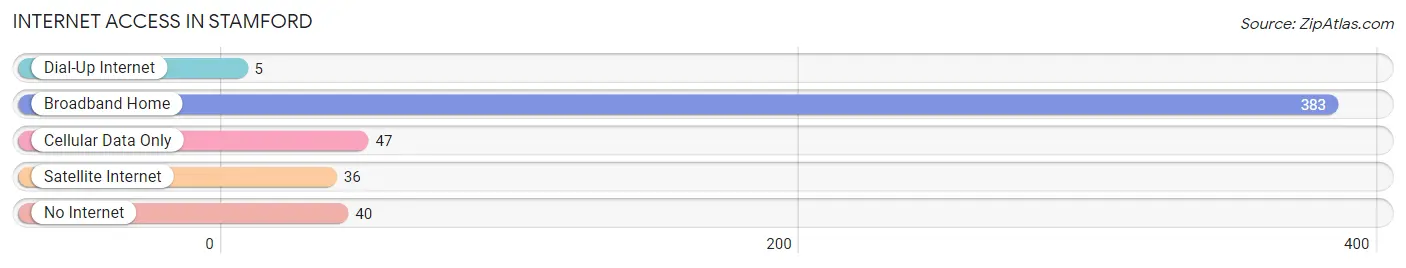
| Internet Type | # Households | % Households |
| Dial-Up Internet | 5 | 1.0% |
| Broadband Home | 383 | 76.9% |
| Cellular Data Only | 47 | 9.4% |
| Satellite Internet | 36 | 7.2% |
| No Internet | 40 | 8.0% |
| Total | 498 | 100.0% |
Stamford Summary
Stamford is a small town located in Delaware County, New York, United States. It is situated in the Catskill Mountains, and is part of the Catskill Park. The town is located on the western edge of the county, and is bordered by the towns of Harpersfield, Meredith, and Davenport. The population of Stamford was 1,845 at the 2010 census.
History
Stamford was first settled in 1786 by a group of settlers from Connecticut. The town was named after the city of Stamford, Connecticut. The town was officially established in 1817, and the first town meeting was held in 1818.
The town was an important center for the lumber industry in the 19th century. The town was also home to several gristmills, sawmills, and tanneries. The town was also home to several small manufacturing businesses, including a furniture factory, a shoe factory, and a woolen mill.
Geography
Stamford is located in the western part of Delaware County, and is bordered by the towns of Harpersfield, Meredith, and Davenport. The town is situated in the Catskill Mountains, and is part of the Catskill Park. The town is located on the western edge of the county, and is bordered by the towns of Harpersfield, Meredith, and Davenport.
The town is located in the Catskill Mountains, and is part of the Catskill Park. The town is located on the western edge of the county, and is bordered by the towns of Harpersfield, Meredith, and Davenport. The town is located in the Catskill Mountains, and is part of the Catskill Park. The town is located on the western edge of the county, and is bordered by the towns of Harpersfield, Meredith, and Davenport.
The town is located in the Catskill Mountains, and is part of the Catskill Park. The town is located on the western edge of the county, and is bordered by the towns of Harpersfield, Meredith, and Davenport. The town is located in the Catskill Mountains, and is part of the Catskill Park. The town is located on the western edge of the county, and is bordered by the towns of Harpersfield, Meredith, and Davenport.
The town is located in the Catskill Mountains, and is part of the Catskill Park. The town is located on the western edge of the county, and is bordered by the towns of Harpersfield, Meredith, and Davenport. The town is located in the Catskill Mountains, and is part of the Catskill Park. The town is located on the western edge of the county, and is bordered by the towns of Harpersfield, Meredith, and Davenport.
Economy
Stamford is a rural town, and the economy is largely based on agriculture and tourism. The town is home to several small businesses, including a furniture factory, a shoe factory, and a woolen mill. The town is also home to several small farms, and is a popular destination for outdoor recreation.
The town is home to several small businesses, including a furniture factory, a shoe factory, and a woolen mill. The town is also home to several small farms, and is a popular destination for outdoor recreation. The town is also home to several small businesses, including a furniture factory, a shoe factory, and a woolen mill. The town is also home to several small farms, and is a popular destination for outdoor recreation.
Demographics
As of the 2010 census, the population of Stamford was 1,845. The racial makeup of the town was 97.3% White, 0.3% African American, 0.2% Native American, 0.2% Asian, 0.1% Pacific Islander, 0.7% from other races, and 1.2% from two or more races. Hispanic or Latino of any race were 2.2% of the population.
The median income for a household in the town was $41,250, and the median income for a family was $48,750. The per capita income for the town was $20,945. About 11.2% of families and 14.2% of the population were below the poverty line, including 19.2% of those under age 18 and 8.3% of those age 65 or over.
Conclusion
Stamford is a small town located in Delaware County, New York, United States. It is situated in the Catskill Mountains, and is part of the Catskill Park. The town is located on the western edge of the county, and is bordered by the towns of Harpersfield, Meredith, and Davenport. The population of Stamford was 1,845 at the 2010 census. The town has a long history of being an important center for the lumber industry in the 19th century, and is now home to several small businesses, including a furniture factory, a shoe factory, and a woolen mill. The town is also home to several small farms, and is a popular destination for outdoor recreation. The median income for a household in the town was $41,250, and the median income for a family was $48,750. The per capita income for the town was $20,945. About 11.2% of families and 14.2% of the population were below the poverty line, including 19.2% of those under age 18 and 8.3% of those age 65 or over. Stamford is a small town with a rich history and a vibrant economy.
Common Questions
What is Per Capita Income in Stamford?
Per Capita income in Stamford is $24,399.
What is the Median Family Income in Stamford?
Median Family Income in Stamford is $58,021.
What is the Median Household income in Stamford?
Median Household Income in Stamford is $46,667.
What is Income or Wage Gap in Stamford?
Income or Wage Gap in Stamford is 29.4%.
Women in Stamford earn 70.6 cents for every dollar earned by a man.
What is Inequality or Gini Index in Stamford?
Inequality or Gini Index in Stamford is 0.43.
What is the Total Population of Stamford?
Total Population of Stamford is 1,155.
What is the Total Male Population of Stamford?
Total Male Population of Stamford is 586.
What is the Total Female Population of Stamford?
Total Female Population of Stamford is 569.
What is the Ratio of Males per 100 Females in Stamford?
There are 102.99 Males per 100 Females in Stamford.
What is the Ratio of Females per 100 Males in Stamford?
There are 97.10 Females per 100 Males in Stamford.
What is the Median Population Age in Stamford?
Median Population Age in Stamford is 38.7 Years.
What is the Average Family Size in Stamford
Average Family Size in Stamford is 3.3 People.
What is the Average Household Size in Stamford
Average Household Size in Stamford is 2.3 People.
How Large is the Labor Force in Stamford?
There are 538 People in the Labor Forcein in Stamford.
What is the Percentage of People in the Labor Force in Stamford?
58.2% of People are in the Labor Force in Stamford.
What is the Unemployment Rate in Stamford?
Unemployment Rate in Stamford is 11.3%.