Brewster Hill, NY Map & Demographics
Brewster Hill Map
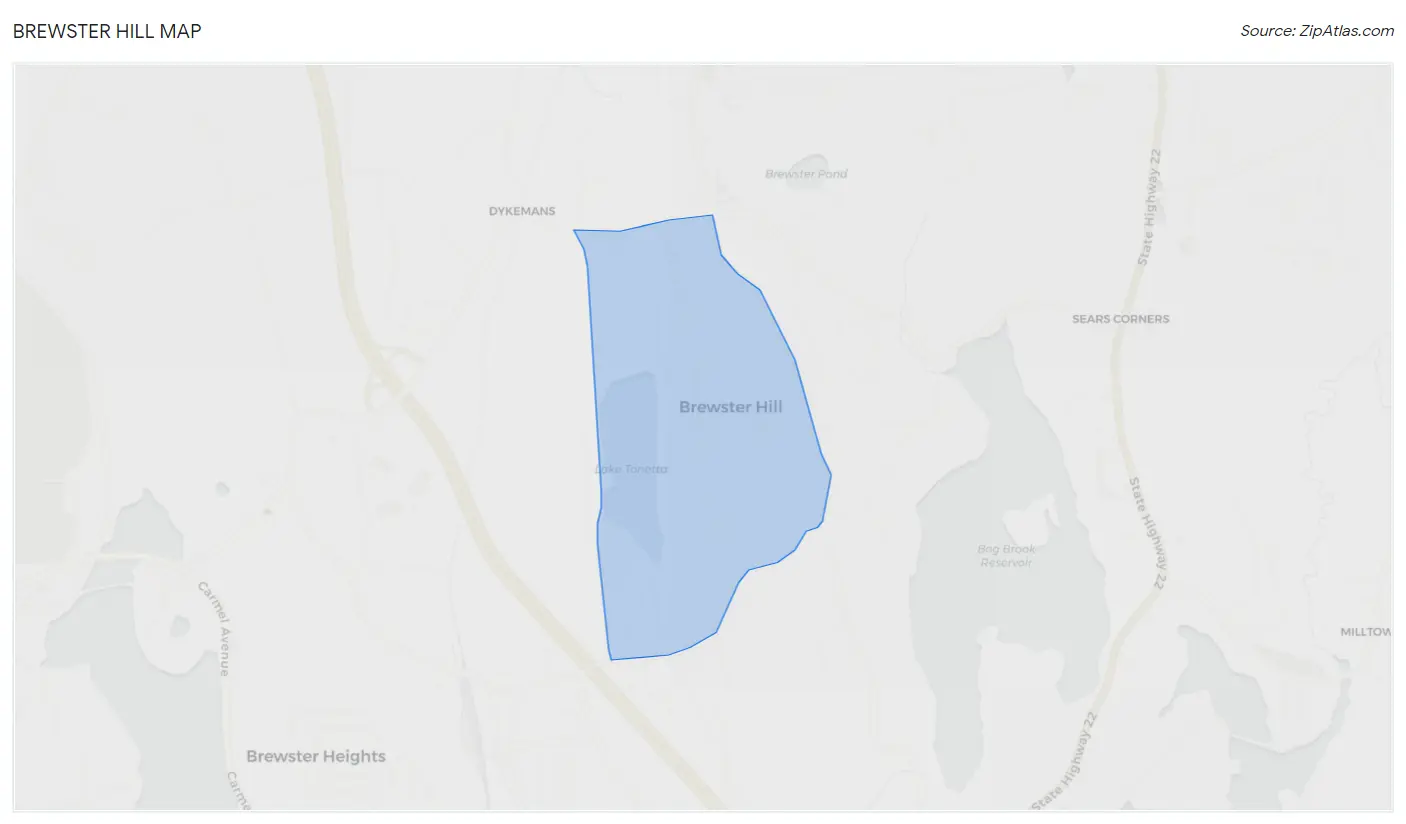
Brewster Hill Overview
$39,288
PER CAPITA INCOME
$97,997
AVG FAMILY INCOME
$89,967
AVG HOUSEHOLD INCOME
5.4%
WAGE / INCOME GAP [ % ]
94.6¢/ $1
WAGE / INCOME GAP [ $ ]
0.38
INEQUALITY / GINI INDEX
2,568
TOTAL POPULATION
1,336
MALE POPULATION
1,232
FEMALE POPULATION
108.44
MALES / 100 FEMALES
92.22
FEMALES / 100 MALES
43.1
MEDIAN AGE
2.8
AVG FAMILY SIZE
2.5
AVG HOUSEHOLD SIZE
1,264
LABOR FORCE [ PEOPLE ]
61.4%
PERCENT IN LABOR FORCE
5.9%
UNEMPLOYMENT RATE
Income in Brewster Hill
Income Overview in Brewster Hill
Per Capita Income in Brewster Hill is $39,288, while median incomes of families and households are $97,997 and $89,967 respectively.
| Characteristic | Number | Measure |
| Per Capita Income | 2,568 | $39,288 |
| Median Family Income | 851 | $97,997 |
| Mean Family Income | 851 | $101,727 |
| Median Household Income | 1,029 | $89,967 |
| Mean Household Income | 1,029 | $99,328 |
| Income Deficit | 851 | $0 |
| Wage / Income Gap (%) | 2,568 | 5.39% |
| Wage / Income Gap ($) | 2,568 | 94.61¢ per $1 |
| Gini / Inequality Index | 2,568 | 0.38 |
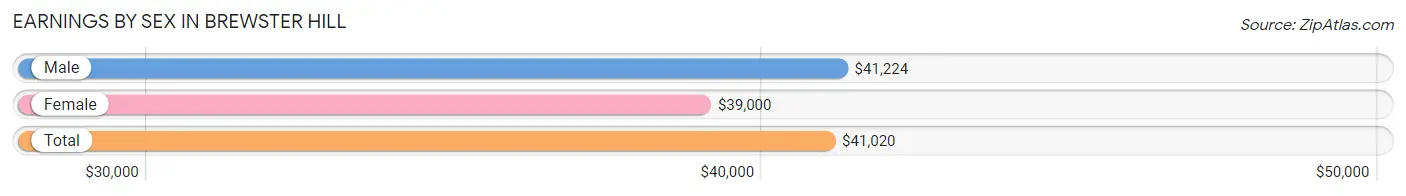
Earnings by Sex in Brewster Hill
Average Earnings in Brewster Hill are $41,020, $41,224 for men and $39,000 for women, a difference of 5.4%.
| Sex | Number | Average Earnings |
| Male | 822 (62.0%) | $41,224 |
| Female | 504 (38.0%) | $39,000 |
| Total | 1,326 (100.0%) | $41,020 |
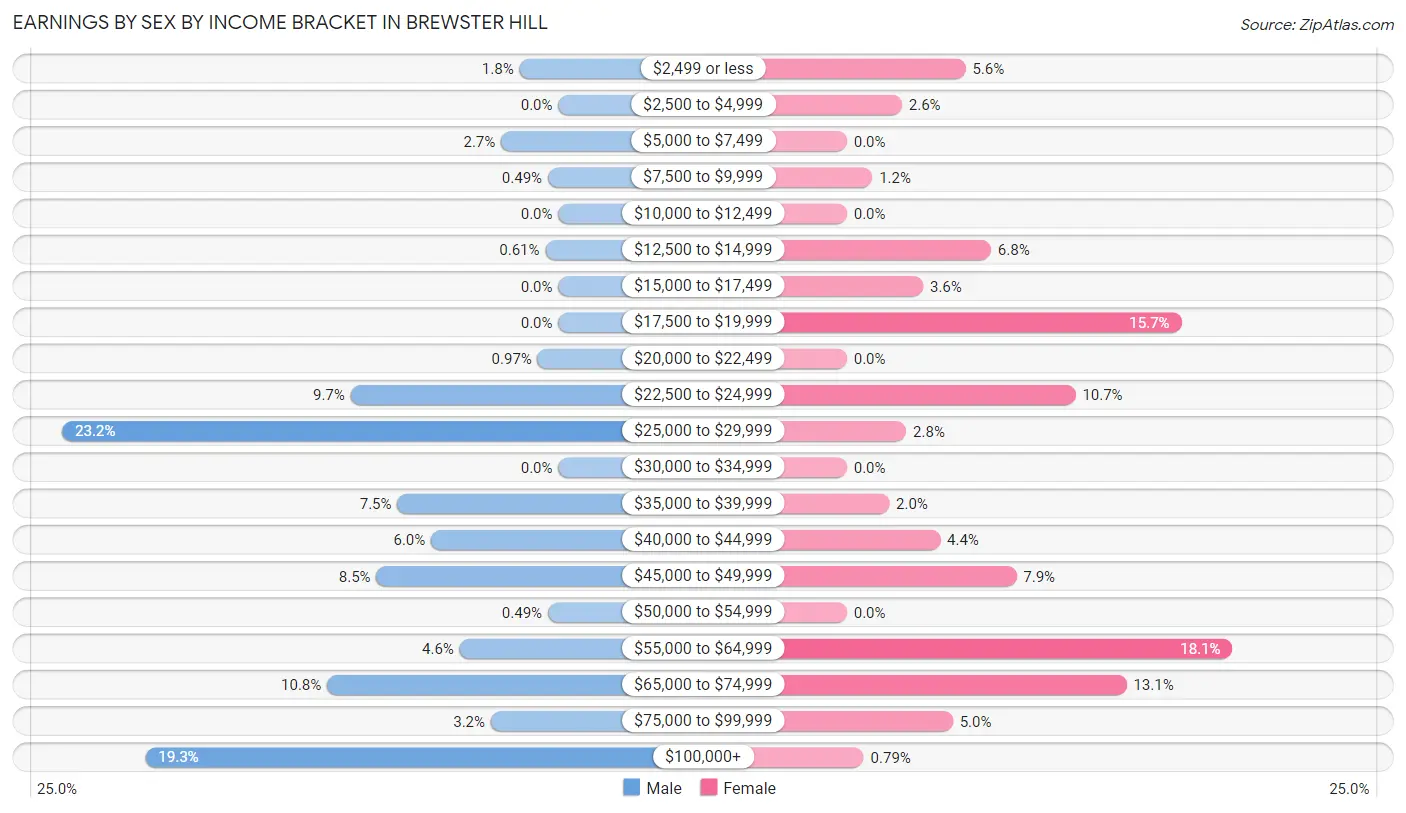
Earnings by Sex by Income Bracket in Brewster Hill
The most common earnings brackets in Brewster Hill are $25,000 to $29,999 for men (191 | 23.2%) and $55,000 to $64,999 for women (91 | 18.1%).
| Income | Male | Female |
| $2,499 or less | 15 (1.8%) | 28 (5.6%) |
| $2,500 to $4,999 | 0 (0.0%) | 13 (2.6%) |
| $5,000 to $7,499 | 22 (2.7%) | 0 (0.0%) |
| $7,500 to $9,999 | 4 (0.5%) | 6 (1.2%) |
| $10,000 to $12,499 | 0 (0.0%) | 0 (0.0%) |
| $12,500 to $14,999 | 5 (0.6%) | 34 (6.8%) |
| $15,000 to $17,499 | 0 (0.0%) | 18 (3.6%) |
| $17,500 to $19,999 | 0 (0.0%) | 79 (15.7%) |
| $20,000 to $22,499 | 8 (1.0%) | 0 (0.0%) |
| $22,500 to $24,999 | 80 (9.7%) | 54 (10.7%) |
| $25,000 to $29,999 | 191 (23.2%) | 14 (2.8%) |
| $30,000 to $34,999 | 0 (0.0%) | 0 (0.0%) |
| $35,000 to $39,999 | 62 (7.5%) | 10 (2.0%) |
| $40,000 to $44,999 | 49 (6.0%) | 22 (4.4%) |
| $45,000 to $49,999 | 70 (8.5%) | 40 (7.9%) |
| $50,000 to $54,999 | 4 (0.5%) | 0 (0.0%) |
| $55,000 to $64,999 | 38 (4.6%) | 91 (18.1%) |
| $65,000 to $74,999 | 89 (10.8%) | 66 (13.1%) |
| $75,000 to $99,999 | 26 (3.2%) | 25 (5.0%) |
| $100,000+ | 159 (19.3%) | 4 (0.8%) |
| Total | 822 (100.0%) | 504 (100.0%) |
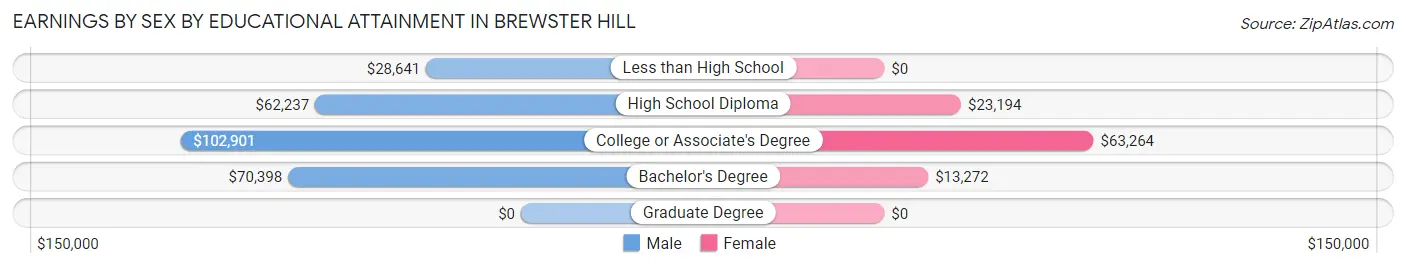
Earnings by Sex by Educational Attainment in Brewster Hill
Average earnings in Brewster Hill are $45,518 for men and $39,000 for women, a difference of 14.3%. Men with an educational attainment of college or associate's degree enjoy the highest average annual earnings of $102,901, while those with less than high school education earn the least with $28,641. Women with an educational attainment of college or associate's degree earn the most with the average annual earnings of $63,264, while those with bachelor's degree education have the smallest earnings of $13,272.
| Educational Attainment | Male Income | Female Income |
| Less than High School | $28,641 | $0 |
| High School Diploma | $62,237 | $23,194 |
| College or Associate's Degree | $102,901 | $63,264 |
| Bachelor's Degree | $70,398 | $13,272 |
| Graduate Degree | - | - |
| Total | $45,518 | $39,000 |
Family Income in Brewster Hill
Family Income Brackets in Brewster Hill
According to the Brewster Hill family income data, there are 215 families falling into the $50,000 to $74,999 income range, which is the most common income bracket and makes up 25.3% of all families.
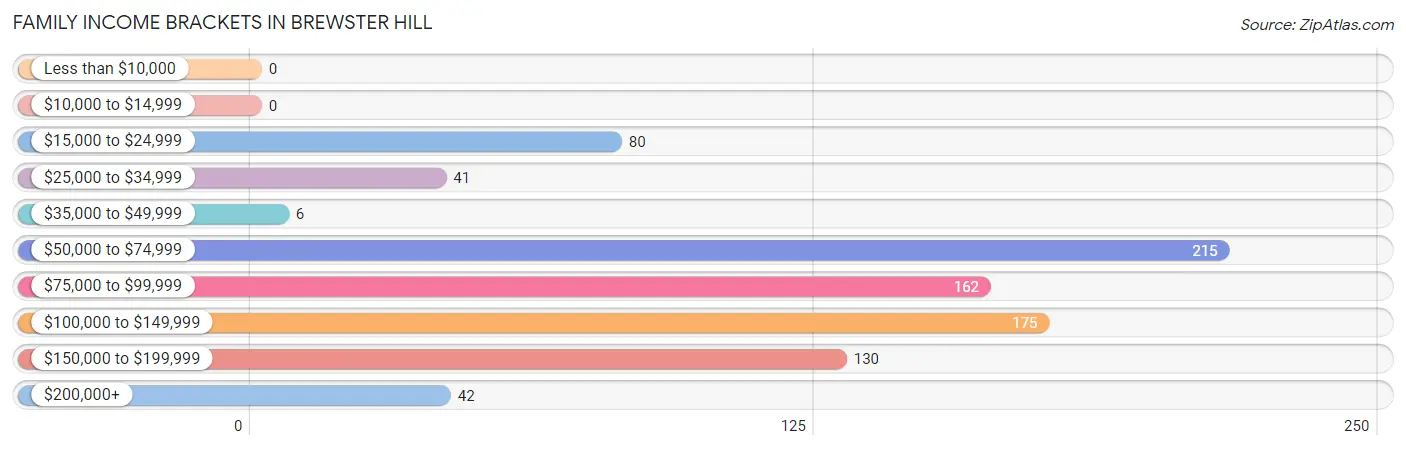
| Income Bracket | # Families | % Families |
| Less than $10,000 | 0 | 0.0% |
| $10,000 to $14,999 | 0 | 0.0% |
| $15,000 to $24,999 | 80 | 9.4% |
| $25,000 to $34,999 | 41 | 4.8% |
| $35,000 to $49,999 | 6 | 0.7% |
| $50,000 to $74,999 | 215 | 25.3% |
| $75,000 to $99,999 | 162 | 19.0% |
| $100,000 to $149,999 | 175 | 20.6% |
| $150,000 to $199,999 | 130 | 15.3% |
| $200,000+ | 42 | 4.9% |
Family Income by Famaliy Size in Brewster Hill
5-person families (146 | 17.2%) account for the highest median family income in Brewster Hill with $168,420 per family, while 2-person families (284 | 33.4%) have the highest median income of $49,592 per family member.
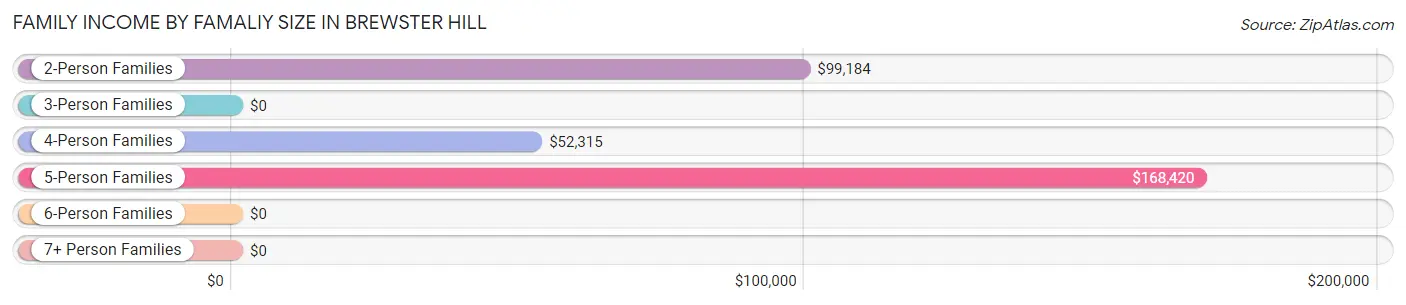
| Income Bracket | # Families | Median Income |
| 2-Person Families | 284 (33.4%) | $99,184 |
| 3-Person Families | 178 (20.9%) | $0 |
| 4-Person Families | 243 (28.5%) | $52,315 |
| 5-Person Families | 146 (17.2%) | $168,420 |
| 6-Person Families | 0 (0.0%) | $0 |
| 7+ Person Families | 0 (0.0%) | $0 |
| Total | 851 (100.0%) | $97,997 |
Family Income by Number of Earners in Brewster Hill
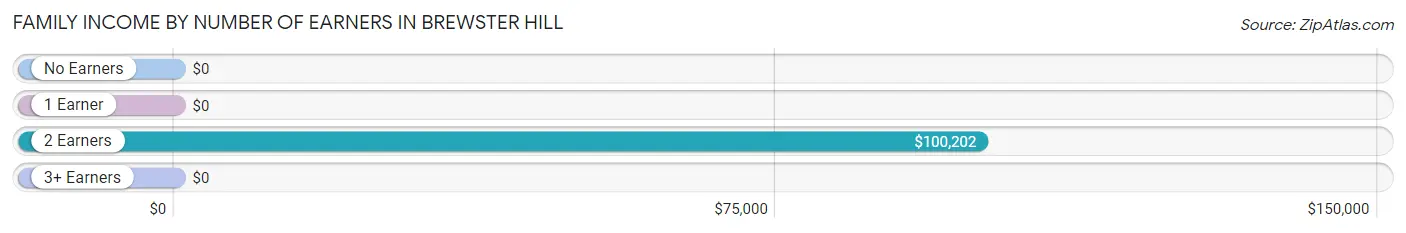
| Number of Earners | # Families | Median Income |
| No Earners | 113 (13.3%) | $0 |
| 1 Earner | 210 (24.7%) | $0 |
| 2 Earners | 505 (59.3%) | $100,202 |
| 3+ Earners | 23 (2.7%) | $0 |
| Total | 851 (100.0%) | $97,997 |
Household Income in Brewster Hill
Household Income Brackets in Brewster Hill
With 264 households falling in the category, the $50,000 to $74,999 income range is the most frequent in Brewster Hill, accounting for 25.7% of all households.
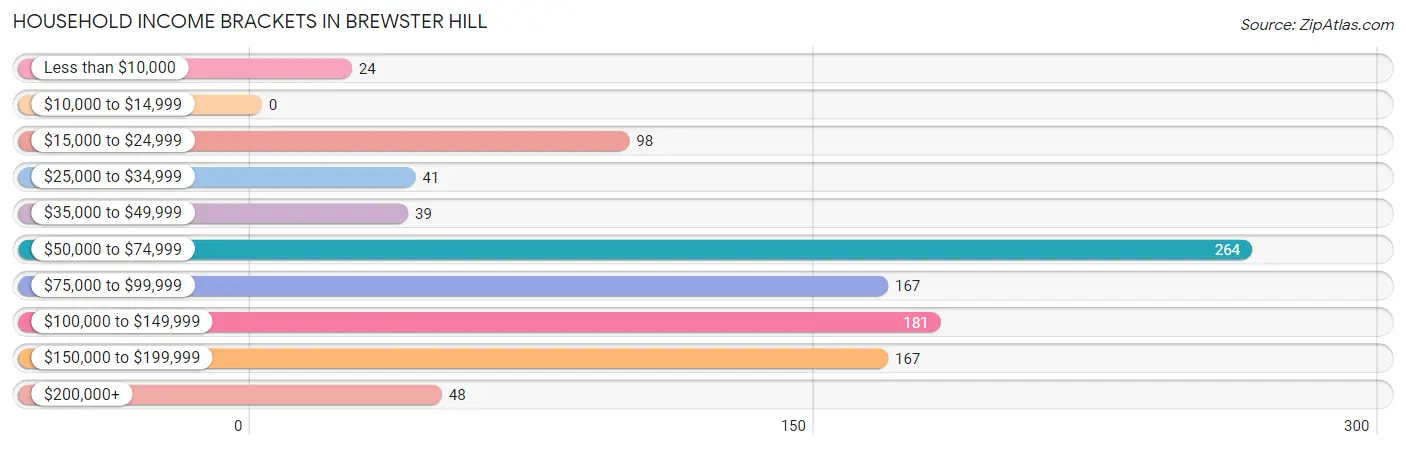
| Income Bracket | # Households | % Households |
| Less than $10,000 | 24 | 2.3% |
| $10,000 to $14,999 | 0 | 0.0% |
| $15,000 to $24,999 | 98 | 9.5% |
| $25,000 to $34,999 | 41 | 4.0% |
| $35,000 to $49,999 | 39 | 3.8% |
| $50,000 to $74,999 | 264 | 25.7% |
| $75,000 to $99,999 | 167 | 16.2% |
| $100,000 to $149,999 | 181 | 17.6% |
| $150,000 to $199,999 | 167 | 16.2% |
| $200,000+ | 48 | 4.7% |
Household Income by Householder Age in Brewster Hill
The median household income in Brewster Hill is $89,967, with the highest median household income of $98,291 found in the 65+ years age bracket for the primary householder. A total of 344 households (33.4%) fall into this category.
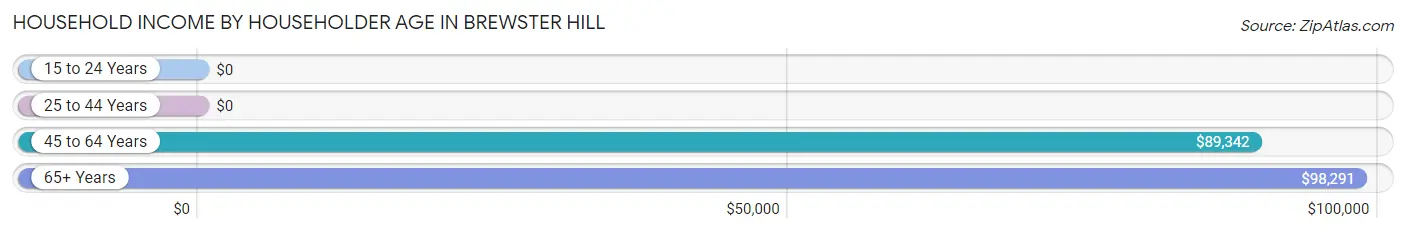
| Income Bracket | # Households | Median Income |
| 15 to 24 Years | 0 (0.0%) | $0 |
| 25 to 44 Years | 217 (21.1%) | $0 |
| 45 to 64 Years | 468 (45.5%) | $89,342 |
| 65+ Years | 344 (33.4%) | $98,291 |
| Total | 1,029 (100.0%) | $89,967 |
Poverty in Brewster Hill
Income Below Poverty by Sex and Age in Brewster Hill
With 10.5% poverty level for males and 9.6% for females among the residents of Brewster Hill, 12 to 14 year old males and 25 to 34 year old females are the most vulnerable to poverty, with 9 males (60.0%) and 69 females (40.8%) in their respective age groups living below the poverty level.
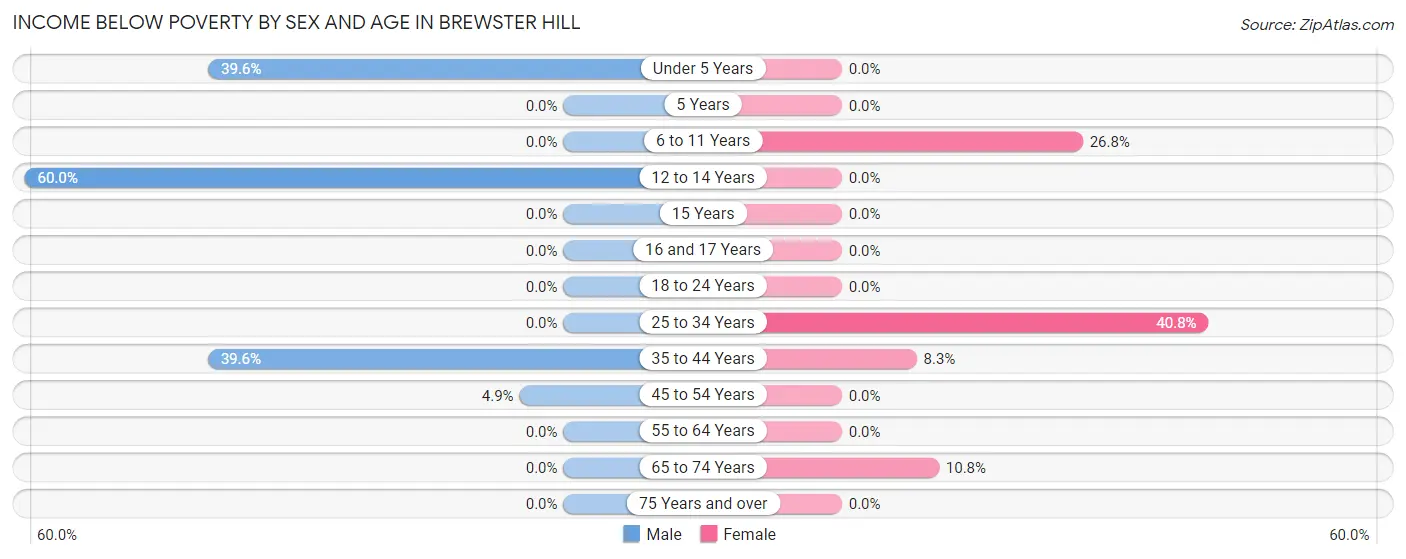
| Age Bracket | Male | Female |
| Under 5 Years | 36 (39.6%) | 0 (0.0%) |
| 5 Years | 0 (0.0%) | 0 (0.0%) |
| 6 to 11 Years | 0 (0.0%) | 11 (26.8%) |
| 12 to 14 Years | 9 (60.0%) | 0 (0.0%) |
| 15 Years | 0 (0.0%) | 0 (0.0%) |
| 16 and 17 Years | 0 (0.0%) | 0 (0.0%) |
| 18 to 24 Years | 0 (0.0%) | 0 (0.0%) |
| 25 to 34 Years | 0 (0.0%) | 69 (40.8%) |
| 35 to 44 Years | 80 (39.6%) | 14 (8.3%) |
| 45 to 54 Years | 15 (4.9%) | 0 (0.0%) |
| 55 to 64 Years | 0 (0.0%) | 0 (0.0%) |
| 65 to 74 Years | 0 (0.0%) | 24 (10.8%) |
| 75 Years and over | 0 (0.0%) | 0 (0.0%) |
| Total | 140 (10.5%) | 118 (9.6%) |
Income Above Poverty by Sex and Age in Brewster Hill
According to the poverty statistics in Brewster Hill, males aged 6 to 11 years and females aged under 5 years are the age groups that are most secure financially, with 100.0% of males and 100.0% of females in these age groups living above the poverty line.
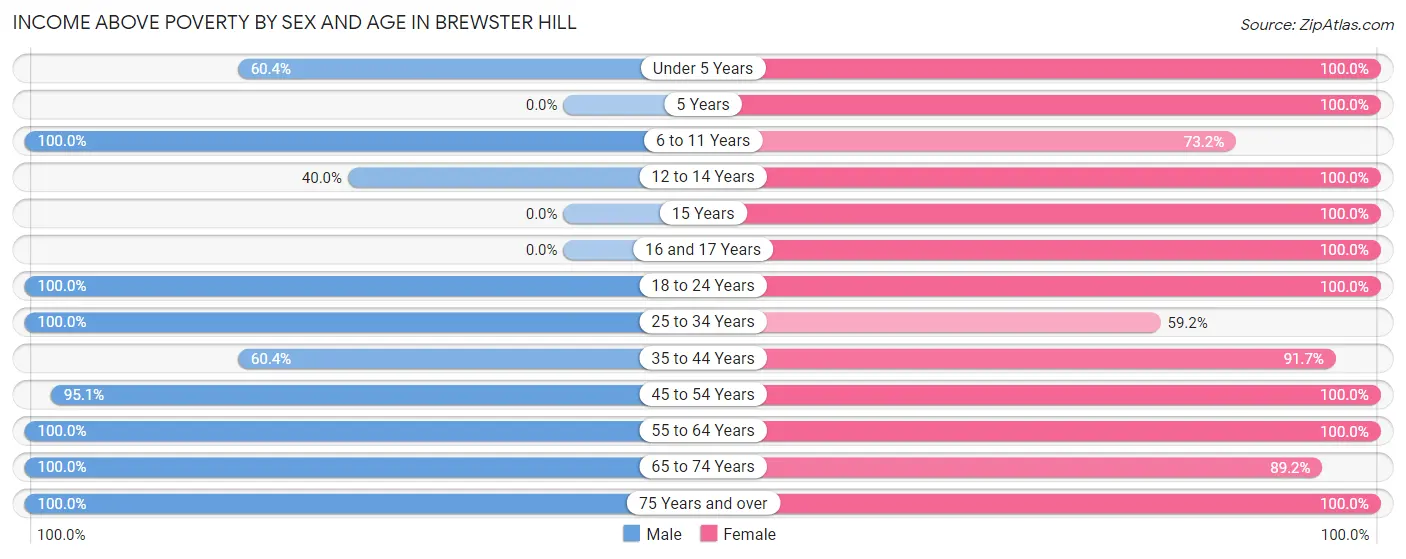
| Age Bracket | Male | Female |
| Under 5 Years | 55 (60.4%) | 69 (100.0%) |
| 5 Years | 0 (0.0%) | 40 (100.0%) |
| 6 to 11 Years | 133 (100.0%) | 30 (73.2%) |
| 12 to 14 Years | 6 (40.0%) | 96 (100.0%) |
| 15 Years | 0 (0.0%) | 24 (100.0%) |
| 16 and 17 Years | 0 (0.0%) | 29 (100.0%) |
| 18 to 24 Years | 79 (100.0%) | 13 (100.0%) |
| 25 to 34 Years | 176 (100.0%) | 100 (59.2%) |
| 35 to 44 Years | 122 (60.4%) | 154 (91.7%) |
| 45 to 54 Years | 292 (95.1%) | 54 (100.0%) |
| 55 to 64 Years | 106 (100.0%) | 221 (100.0%) |
| 65 to 74 Years | 186 (100.0%) | 198 (89.2%) |
| 75 Years and over | 41 (100.0%) | 86 (100.0%) |
| Total | 1,196 (89.5%) | 1,114 (90.4%) |
Income Below Poverty Among Married-Couple Families in Brewster Hill
The poverty statistics for married-couple families in Brewster Hill show that 12.9% or 95 of the total 738 families live below the poverty line. Families with 1 or 2 children have the highest poverty rate of 21.9%, comprising of 95 families. On the other hand, families with no children have the lowest poverty rate of 0.0%, which includes 0 families.
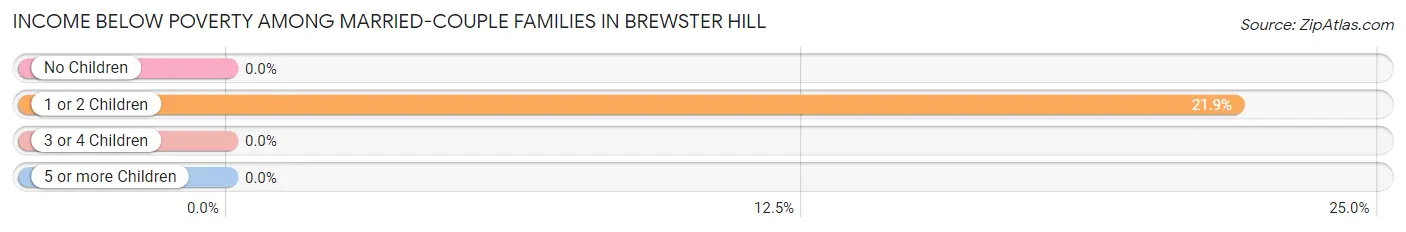
| Children | Above Poverty | Below Poverty |
| No Children | 304 (100.0%) | 0 (0.0%) |
| 1 or 2 Children | 339 (78.1%) | 95 (21.9%) |
| 3 or 4 Children | 0 (0.0%) | 0 (0.0%) |
| 5 or more Children | 0 (0.0%) | 0 (0.0%) |
| Total | 643 (87.1%) | 95 (12.9%) |
Income Below Poverty Among Single-Parent Households in Brewster Hill
| Children | Single Father | Single Mother |
| No Children | 0 (0.0%) | 0 (0.0%) |
| 1 or 2 Children | 0 (0.0%) | 0 (0.0%) |
| 3 or 4 Children | 0 (0.0%) | 0 (0.0%) |
| 5 or more Children | 0 (0.0%) | 0 (0.0%) |
| Total | 0 (0.0%) | 0 (0.0%) |
Income Below Poverty Among Married-Couple vs Single-Parent Households in Brewster Hill
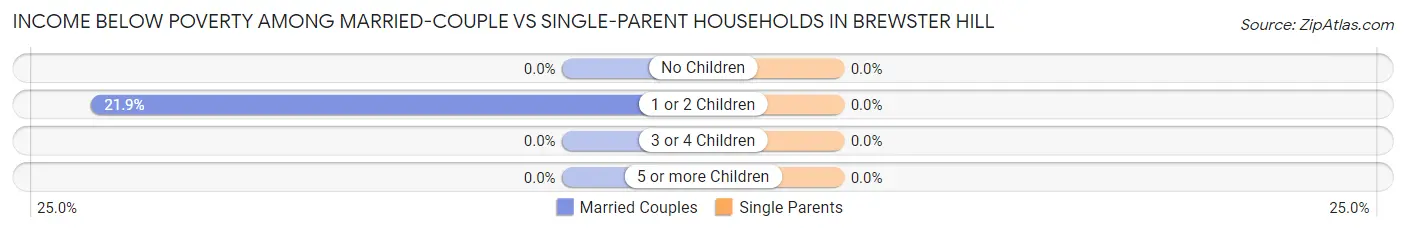
| Children | Married-Couple Families | Single-Parent Households |
| No Children | 0 (0.0%) | 0 (0.0%) |
| 1 or 2 Children | 95 (21.9%) | 0 (0.0%) |
| 3 or 4 Children | 0 (0.0%) | 0 (0.0%) |
| 5 or more Children | 0 (0.0%) | 0 (0.0%) |
| Total | 95 (12.9%) | 0 (0.0%) |
Race in Brewster Hill
The most populous races in Brewster Hill are White / Caucasian (1,640 | 63.9%), Hispanic or Latino (699 | 27.2%), and Asian (397 | 15.5%).
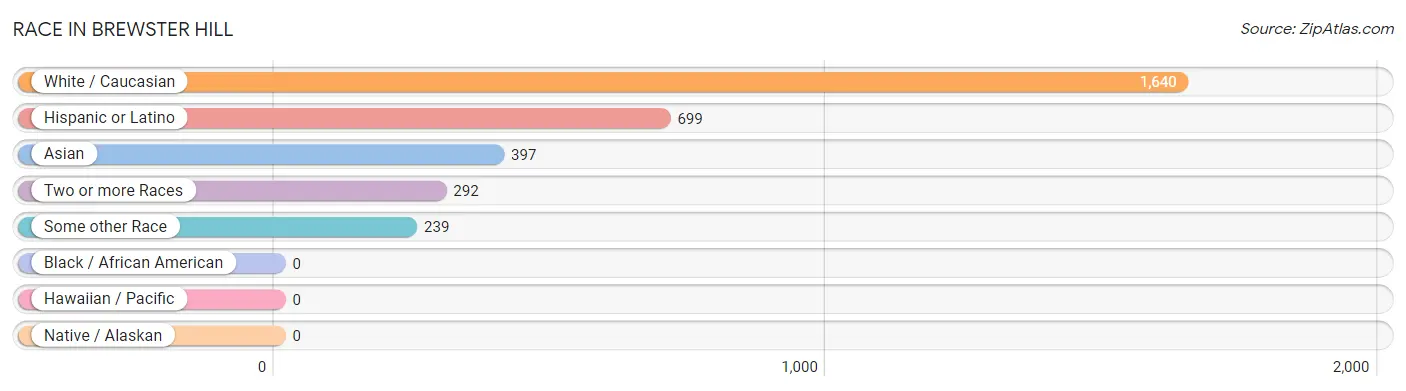
| Race | # Population | % Population |
| Asian | 397 | 15.5% |
| Black / African American | 0 | 0.0% |
| Hawaiian / Pacific | 0 | 0.0% |
| Hispanic or Latino | 699 | 27.2% |
| Native / Alaskan | 0 | 0.0% |
| White / Caucasian | 1,640 | 63.9% |
| Two or more Races | 292 | 11.4% |
| Some other Race | 239 | 9.3% |
| Total | 2,568 | 100.0% |
Ancestry in Brewster Hill
The most populous ancestries reported in Brewster Hill are Italian (458 | 17.8%), Indian (Asian) (390 | 15.2%), Irish (383 | 14.9%), South American (305 | 11.9%), and Eastern European (276 | 10.7%), together accounting for 70.6% of all Brewster Hill residents.
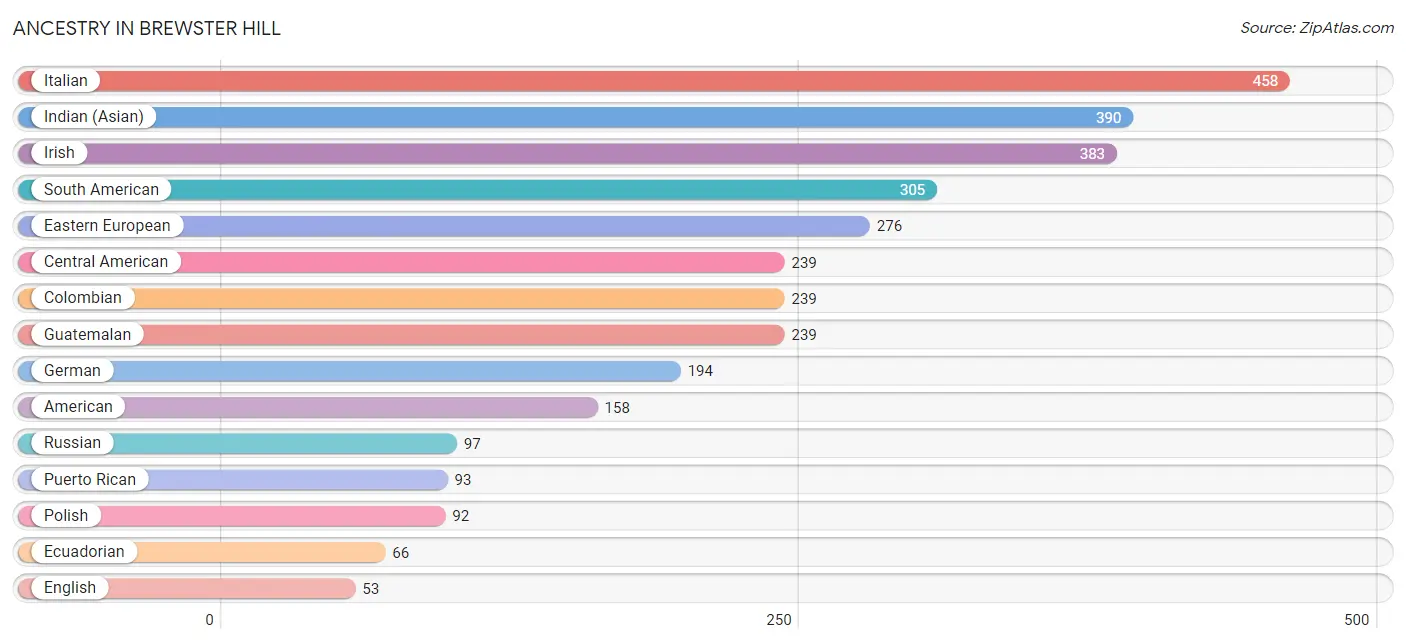
| Ancestry | # Population | % Population |
| American | 158 | 6.1% |
| Arab | 42 | 1.6% |
| Central American | 239 | 9.3% |
| Central American Indian | 22 | 0.9% |
| Colombian | 239 | 9.3% |
| Cuban | 6 | 0.2% |
| Eastern European | 276 | 10.7% |
| Ecuadorian | 66 | 2.6% |
| English | 53 | 2.1% |
| French | 6 | 0.2% |
| German | 194 | 7.5% |
| Greek | 27 | 1.1% |
| Guatemalan | 239 | 9.3% |
| Hungarian | 25 | 1.0% |
| Indian (Asian) | 390 | 15.2% |
| Irish | 383 | 14.9% |
| Italian | 458 | 17.8% |
| Korean | 7 | 0.3% |
| Norwegian | 13 | 0.5% |
| Polish | 92 | 3.6% |
| Portuguese | 18 | 0.7% |
| Puerto Rican | 93 | 3.6% |
| Russian | 97 | 3.8% |
| Scotch-Irish | 6 | 0.2% |
| South American | 305 | 11.9% | View All 25 Rows |
Immigrants in Brewster Hill
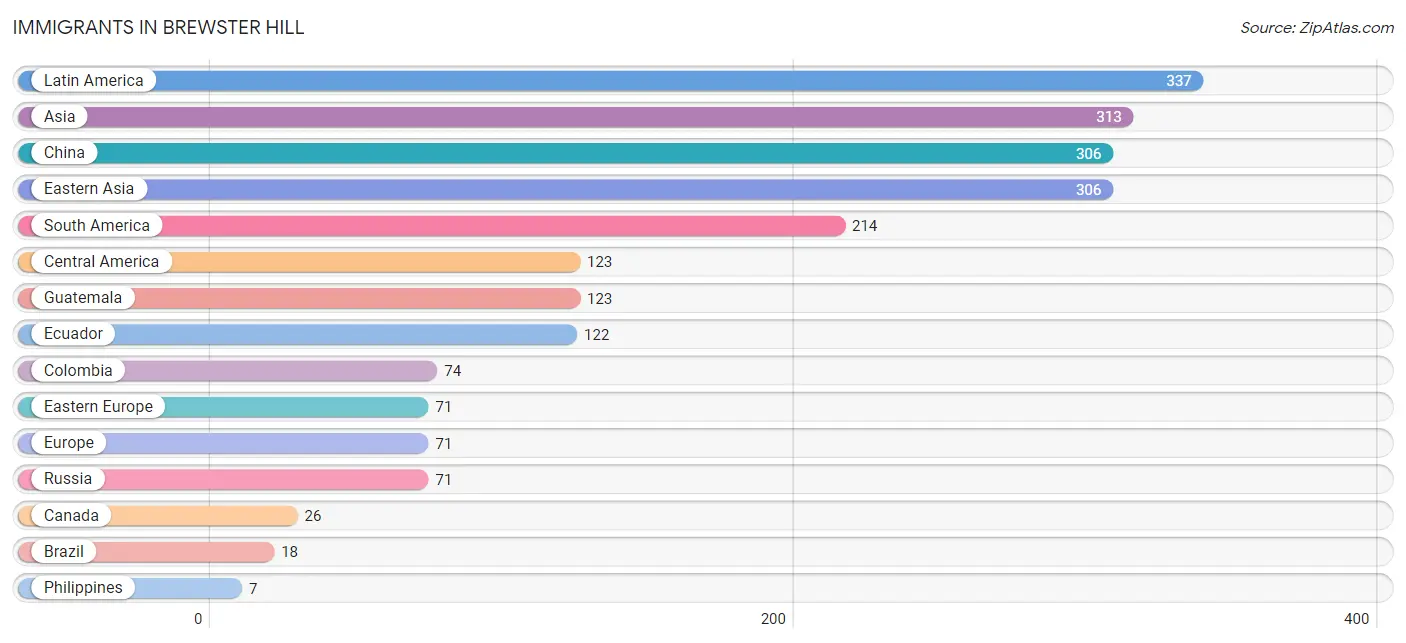
The most numerous immigrant groups reported in Brewster Hill came from Latin America (337 | 13.1%), Asia (313 | 12.2%), China (306 | 11.9%), Eastern Asia (306 | 11.9%), and South America (214 | 8.3%), together accounting for 57.5% of all Brewster Hill residents.
| Immigration Origin | # Population | % Population |
| Asia | 313 | 12.2% |
| Brazil | 18 | 0.7% |
| Canada | 26 | 1.0% |
| Central America | 123 | 4.8% |
| China | 306 | 11.9% |
| Colombia | 74 | 2.9% |
| Eastern Asia | 306 | 11.9% |
| Eastern Europe | 71 | 2.8% |
| Ecuador | 122 | 4.8% |
| Europe | 71 | 2.8% |
| Guatemala | 123 | 4.8% |
| Latin America | 337 | 13.1% |
| Philippines | 7 | 0.3% |
| Russia | 71 | 2.8% |
| South America | 214 | 8.3% |
| South Eastern Asia | 7 | 0.3% | View All 16 Rows |
Sex and Age in Brewster Hill
Sex and Age in Brewster Hill
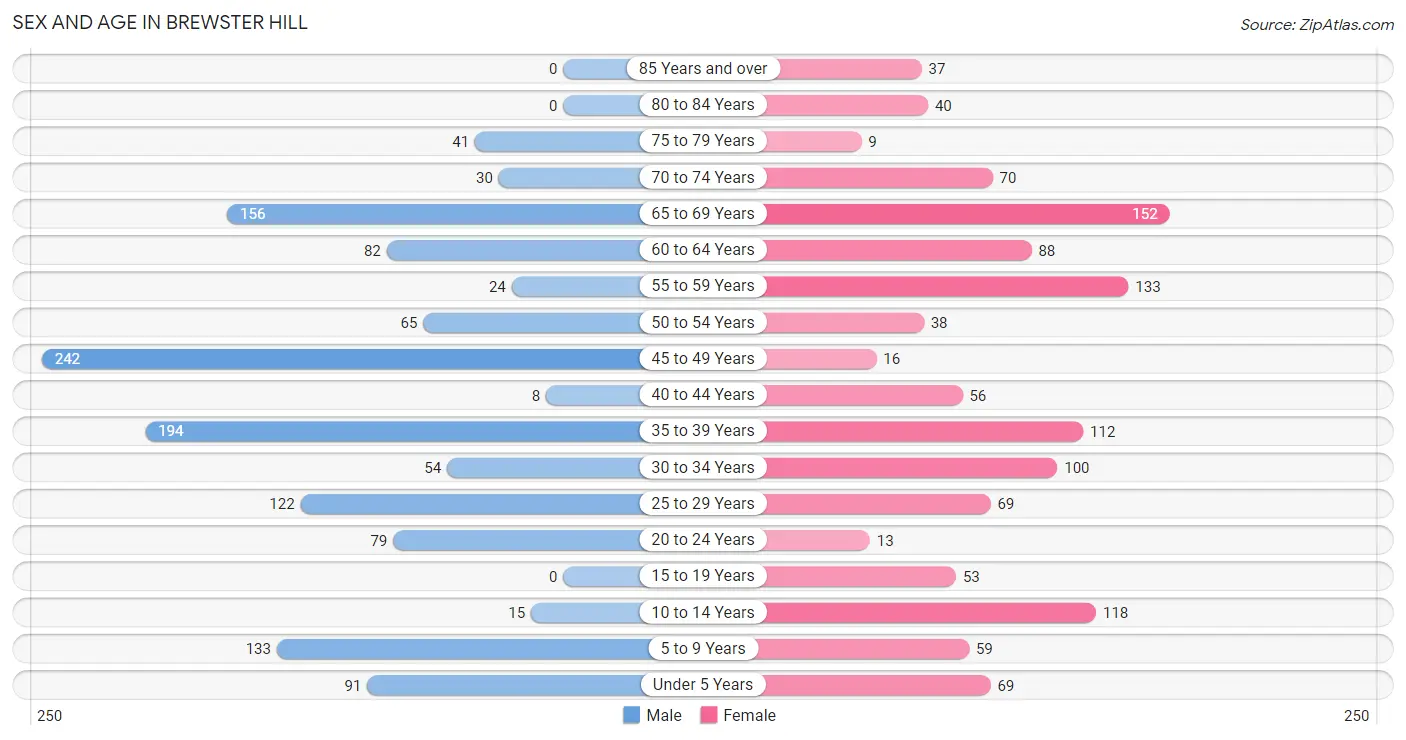
The most populous age groups in Brewster Hill are 45 to 49 Years (242 | 18.1%) for men and 65 to 69 Years (152 | 12.3%) for women.
| Age Bracket | Male | Female |
| Under 5 Years | 91 (6.8%) | 69 (5.6%) |
| 5 to 9 Years | 133 (10.0%) | 59 (4.8%) |
| 10 to 14 Years | 15 (1.1%) | 118 (9.6%) |
| 15 to 19 Years | 0 (0.0%) | 53 (4.3%) |
| 20 to 24 Years | 79 (5.9%) | 13 (1.1%) |
| 25 to 29 Years | 122 (9.1%) | 69 (5.6%) |
| 30 to 34 Years | 54 (4.0%) | 100 (8.1%) |
| 35 to 39 Years | 194 (14.5%) | 112 (9.1%) |
| 40 to 44 Years | 8 (0.6%) | 56 (4.5%) |
| 45 to 49 Years | 242 (18.1%) | 16 (1.3%) |
| 50 to 54 Years | 65 (4.9%) | 38 (3.1%) |
| 55 to 59 Years | 24 (1.8%) | 133 (10.8%) |
| 60 to 64 Years | 82 (6.1%) | 88 (7.1%) |
| 65 to 69 Years | 156 (11.7%) | 152 (12.3%) |
| 70 to 74 Years | 30 (2.2%) | 70 (5.7%) |
| 75 to 79 Years | 41 (3.1%) | 9 (0.7%) |
| 80 to 84 Years | 0 (0.0%) | 40 (3.3%) |
| 85 Years and over | 0 (0.0%) | 37 (3.0%) |
| Total | 1,336 (100.0%) | 1,232 (100.0%) |
Families and Households in Brewster Hill
Median Family Size in Brewster Hill
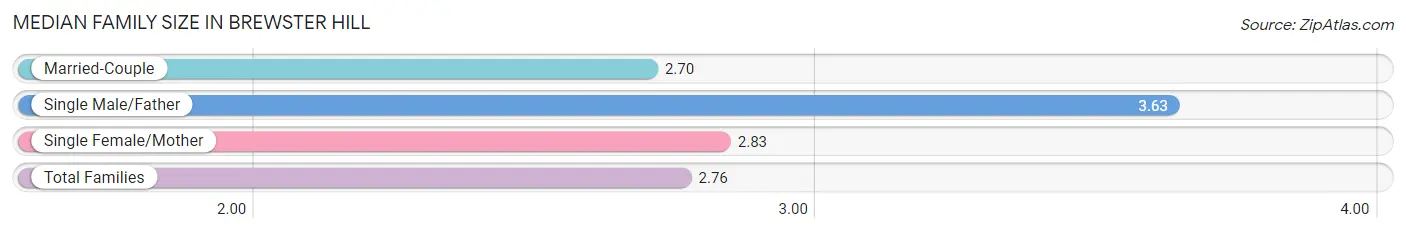
The median family size in Brewster Hill is 2.76 persons per family, with single male/father families (38 | 4.5%) accounting for the largest median family size of 3.63 persons per family. On the other hand, married-couple families (738 | 86.7%) represent the smallest median family size with 2.70 persons per family.
| Family Type | # Families | Family Size |
| Married-Couple | 738 (86.7%) | 2.70 |
| Single Male/Father | 38 (4.5%) | 3.63 |
| Single Female/Mother | 75 (8.8%) | 2.83 |
| Total Families | 851 (100.0%) | 2.76 |
Median Household Size in Brewster Hill
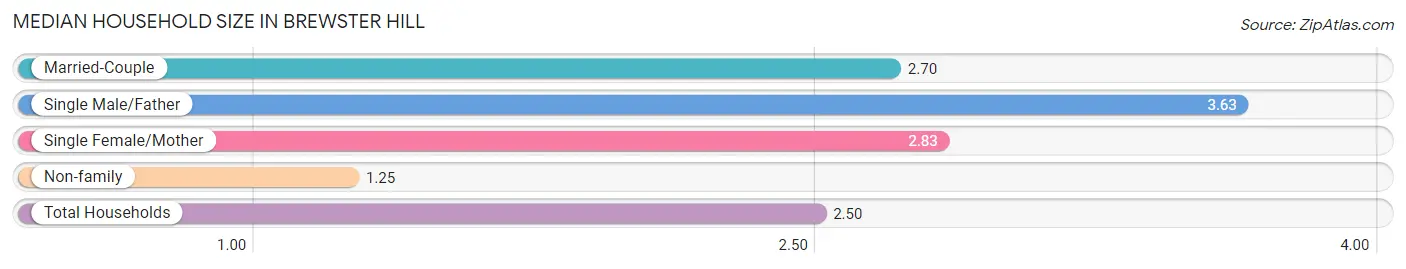
The median household size in Brewster Hill is 2.50 persons per household, with single male/father households (38 | 3.7%) accounting for the largest median household size of 3.63 persons per household. non-family households (178 | 17.3%) represent the smallest median household size with 1.25 persons per household.
| Household Type | # Households | Household Size |
| Married-Couple | 738 (71.7%) | 2.70 |
| Single Male/Father | 38 (3.7%) | 3.63 |
| Single Female/Mother | 75 (7.3%) | 2.83 |
| Non-family | 178 (17.3%) | 1.25 |
| Total Households | 1,029 (100.0%) | 2.50 |
Household Size by Marriage Status in Brewster Hill
Out of a total of 1,029 households in Brewster Hill, 851 (82.7%) are family households, while 178 (17.3%) are nonfamily households. The most numerous type of family households are 2-person households, comprising 284, and the most common type of nonfamily households are 1-person households, comprising 126.
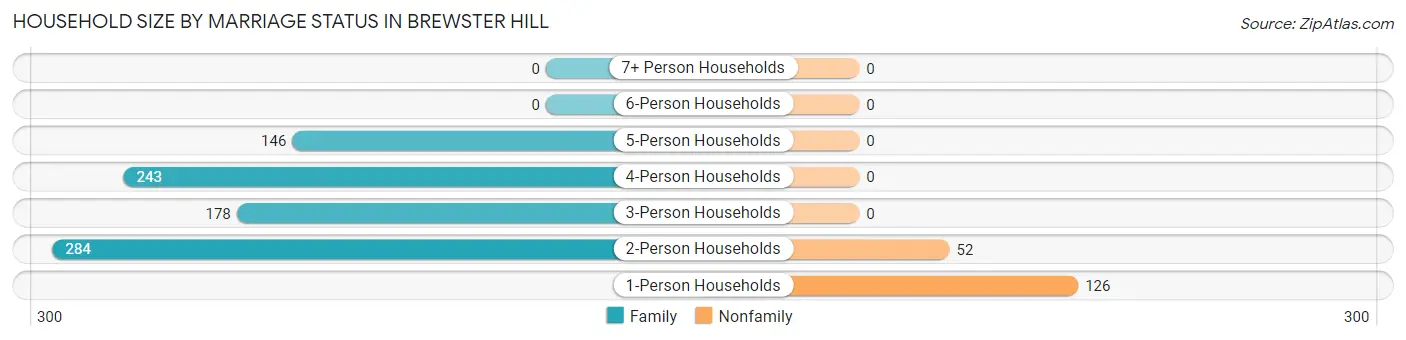
| Household Size | Family Households | Nonfamily Households |
| 1-Person Households | - | 126 (12.2%) |
| 2-Person Households | 284 (27.6%) | 52 (5.1%) |
| 3-Person Households | 178 (17.3%) | 0 (0.0%) |
| 4-Person Households | 243 (23.6%) | 0 (0.0%) |
| 5-Person Households | 146 (14.2%) | 0 (0.0%) |
| 6-Person Households | 0 (0.0%) | 0 (0.0%) |
| 7+ Person Households | 0 (0.0%) | 0 (0.0%) |
| Total | 851 (82.7%) | 178 (17.3%) |
Female Fertility in Brewster Hill
Fertility by Age in Brewster Hill
| Age Bracket | Women with Births | Births / 1,000 Women |
| 15 to 19 years | 0 (0.0%) | 0.0 |
| 20 to 34 years | 0 (0.0%) | 0.0 |
| 35 to 50 years | 0 (0.0%) | 0.0 |
| Total | 0 (0.0%) | 0.0 |
Fertility by Age by Marriage Status in Brewster Hill
| Age Bracket | Married | Unmarried |
| 15 to 19 years | 0 (0.0%) | 0 (0.0%) |
| 20 to 34 years | 0 (0.0%) | 0 (0.0%) |
| 35 to 50 years | 0 (0.0%) | 0 (0.0%) |
| Total | 0 (0.0%) | 0 (0.0%) |
Fertility by Education in Brewster Hill
| Educational Attainment | Women with Births | Births / 1,000 Women |
| Less than High School | 0 (0.0%) | 0.0 |
| High School Diploma | 0 (0.0%) | 0.0 |
| College or Associate's Degree | 0 (0.0%) | 0.0 |
| Bachelor's Degree | 0 (0.0%) | 0.0 |
| Graduate Degree | 0 (0.0%) | 0.0 |
| Total | 0 (0.0%) | 0.0 |
Fertility by Education by Marriage Status in Brewster Hill
| Educational Attainment | Married | Unmarried |
| Less than High School | 0 (0.0%) | 0 (0.0%) |
| High School Diploma | 0 (0.0%) | 0 (0.0%) |
| College or Associate's Degree | 0 (0.0%) | 0 (0.0%) |
| Bachelor's Degree | 0 (0.0%) | 0 (0.0%) |
| Graduate Degree | 0 (0.0%) | 0 (0.0%) |
| Total | 0 (0.0%) | 0 (0.0%) |
Employment Characteristics in Brewster Hill
Employment by Class of Employer in Brewster Hill
Among the 1,178 employed individuals in Brewster Hill, private company employees (637 | 54.1%), self-employed (not incorporated) (271 | 23.0%), and not-for-profit organizations (146 | 12.4%) make up the most common classes of employment.
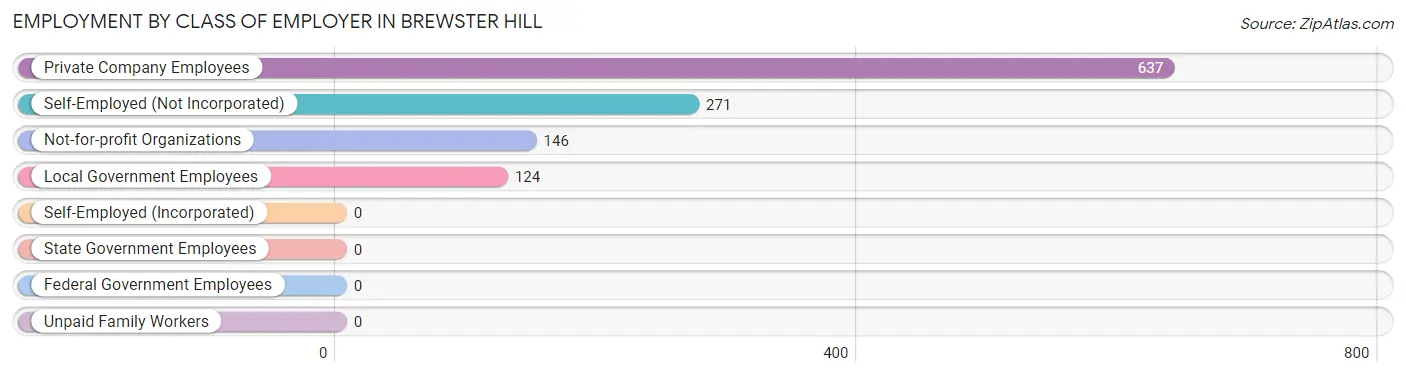
| Employer Class | # Employees | % Employees |
| Private Company Employees | 637 | 54.1% |
| Self-Employed (Incorporated) | 0 | 0.0% |
| Self-Employed (Not Incorporated) | 271 | 23.0% |
| Not-for-profit Organizations | 146 | 12.4% |
| Local Government Employees | 124 | 10.5% |
| State Government Employees | 0 | 0.0% |
| Federal Government Employees | 0 | 0.0% |
| Unpaid Family Workers | 0 | 0.0% |
| Total | 1,178 | 100.0% |
Employment Status by Age in Brewster Hill
According to the labor force statistics for Brewster Hill, out of the total population over 16 years of age (2,059), 61.4% or 1,264 individuals are in the labor force, with 5.9% or 75 of them unemployed. The age group with the highest labor force participation rate is 35 to 44 years, with 100.0% or 370 individuals in the labor force. Within the labor force, the 65 to 74 years age range has the highest percentage of unemployed individuals, with 37.3% or 19 of them being unemployed.
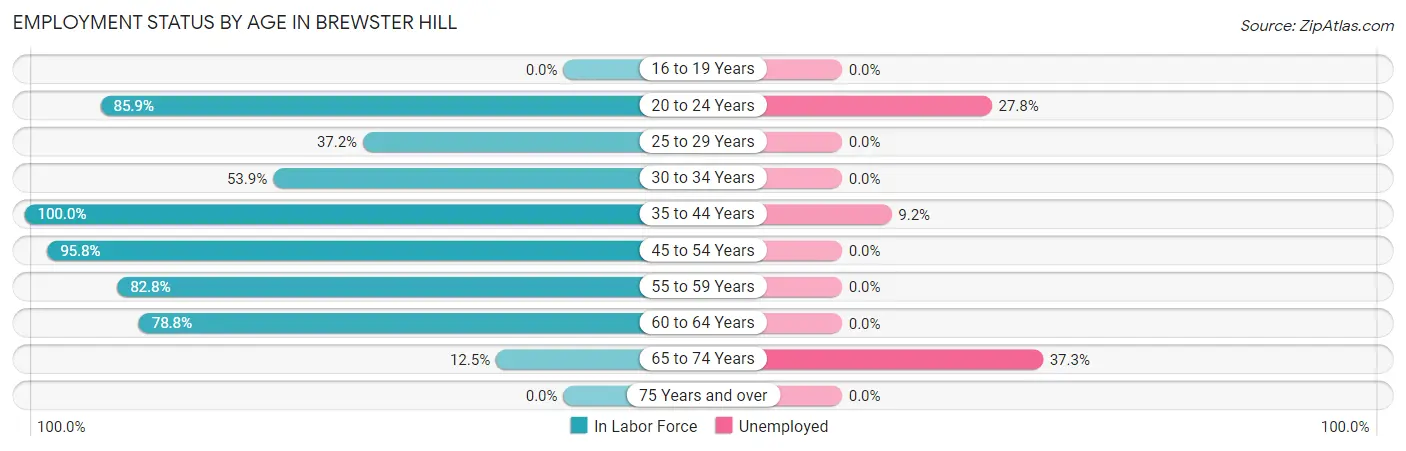
| Age Bracket | In Labor Force | Unemployed |
| 16 to 19 Years | 0 (0.0%) | 0 (0.0%) |
| 20 to 24 Years | 79 (85.9%) | 22 (27.8%) |
| 25 to 29 Years | 71 (37.2%) | 0 (0.0%) |
| 30 to 34 Years | 83 (53.9%) | 0 (0.0%) |
| 35 to 44 Years | 370 (100.0%) | 34 (9.2%) |
| 45 to 54 Years | 346 (95.8%) | 0 (0.0%) |
| 55 to 59 Years | 130 (82.8%) | 0 (0.0%) |
| 60 to 64 Years | 134 (78.8%) | 0 (0.0%) |
| 65 to 74 Years | 51 (12.5%) | 19 (37.3%) |
| 75 Years and over | 0 (0.0%) | 0 (0.0%) |
| Total | 1,264 (61.4%) | 75 (5.9%) |
Employment Status by Educational Attainment in Brewster Hill
According to labor force statistics for Brewster Hill, 80.8% of individuals (1,134) out of the total population between 25 and 64 years of age (1,403) are in the labor force, with 3.0% or 34 of them being unemployed. The group with the highest labor force participation rate are those with the educational attainment of college / associate degree, with 92.0% or 416 individuals in the labor force. Within the labor force, individuals with bachelor's degree or higher education have the highest percentage of unemployment, with 12.1% or 34 of them being unemployed.
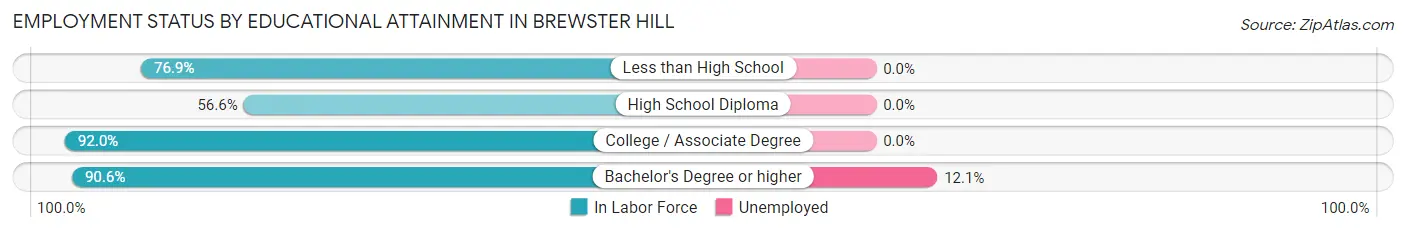
| Educational Attainment | In Labor Force | Unemployed |
| Less than High School | 283 (76.9%) | 0 (0.0%) |
| High School Diploma | 155 (56.6%) | 0 (0.0%) |
| College / Associate Degree | 416 (92.0%) | 0 (0.0%) |
| Bachelor's Degree or higher | 280 (90.6%) | 37 (12.1%) |
| Total | 1,134 (80.8%) | 42 (3.0%) |
Employment Occupations by Sex in Brewster Hill
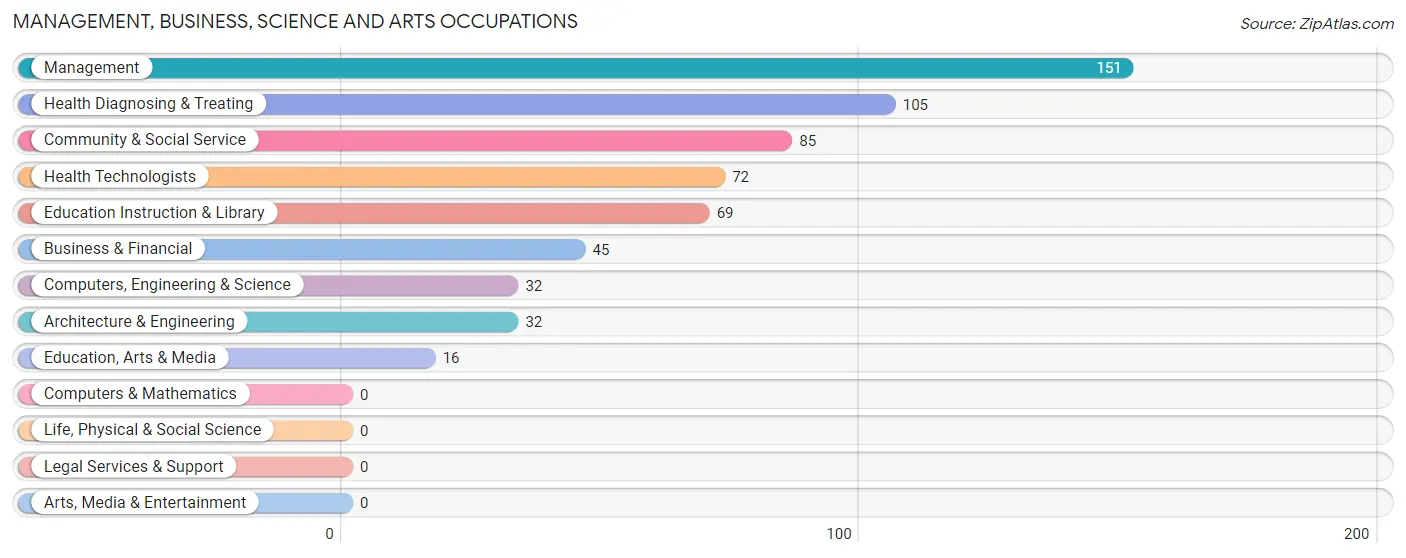
Management, Business, Science and Arts Occupations
The most common Management, Business, Science and Arts occupations in Brewster Hill are Management (151 | 12.7%), Health Diagnosing & Treating (105 | 8.8%), Community & Social Service (85 | 7.1%), Health Technologists (72 | 6.1%), and Education Instruction & Library (69 | 5.8%).
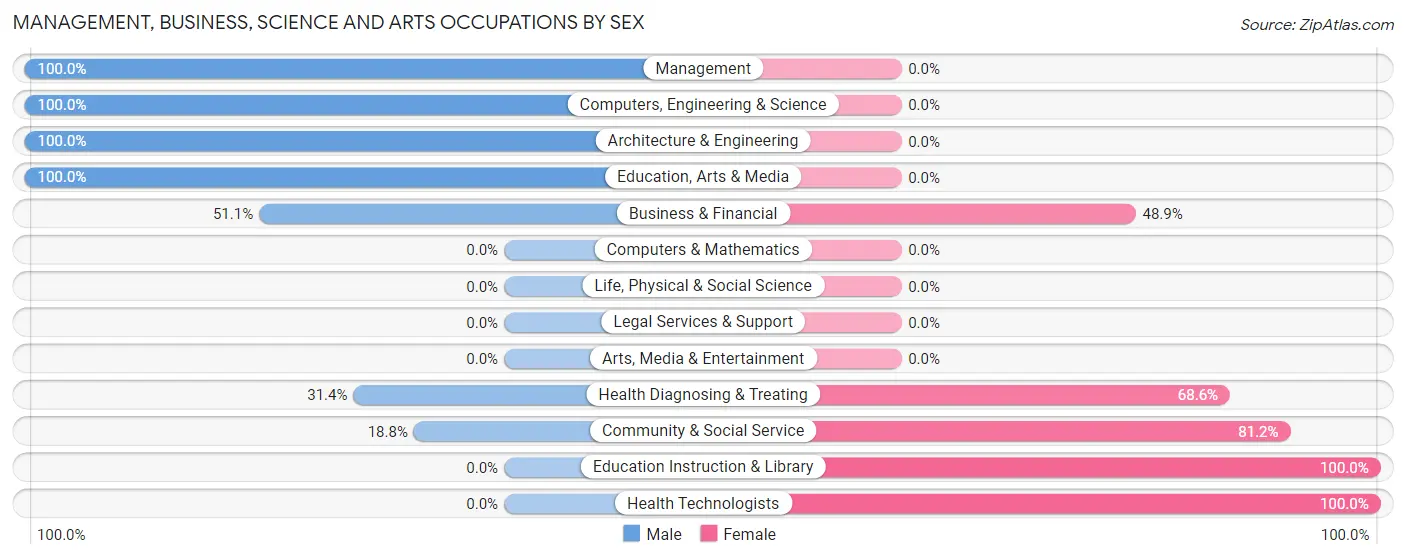
Management, Business, Science and Arts Occupations by Sex
Within the Management, Business, Science and Arts occupations in Brewster Hill, the most male-oriented occupations are Management (100.0%), Computers, Engineering & Science (100.0%), and Architecture & Engineering (100.0%), while the most female-oriented occupations are Education Instruction & Library (100.0%), Health Technologists (100.0%), and Community & Social Service (81.2%).
| Occupation | Male | Female |
| Management | 151 (100.0%) | 0 (0.0%) |
| Business & Financial | 23 (51.1%) | 22 (48.9%) |
| Computers, Engineering & Science | 32 (100.0%) | 0 (0.0%) |
| Computers & Mathematics | 0 (0.0%) | 0 (0.0%) |
| Architecture & Engineering | 32 (100.0%) | 0 (0.0%) |
| Life, Physical & Social Science | 0 (0.0%) | 0 (0.0%) |
| Community & Social Service | 16 (18.8%) | 69 (81.2%) |
| Education, Arts & Media | 16 (100.0%) | 0 (0.0%) |
| Legal Services & Support | 0 (0.0%) | 0 (0.0%) |
| Education Instruction & Library | 0 (0.0%) | 69 (100.0%) |
| Arts, Media & Entertainment | 0 (0.0%) | 0 (0.0%) |
| Health Diagnosing & Treating | 33 (31.4%) | 72 (68.6%) |
| Health Technologists | 0 (0.0%) | 72 (100.0%) |
| Total (Category) | 255 (61.0%) | 163 (39.0%) |
| Total (Overall) | 785 (66.0%) | 404 (34.0%) |
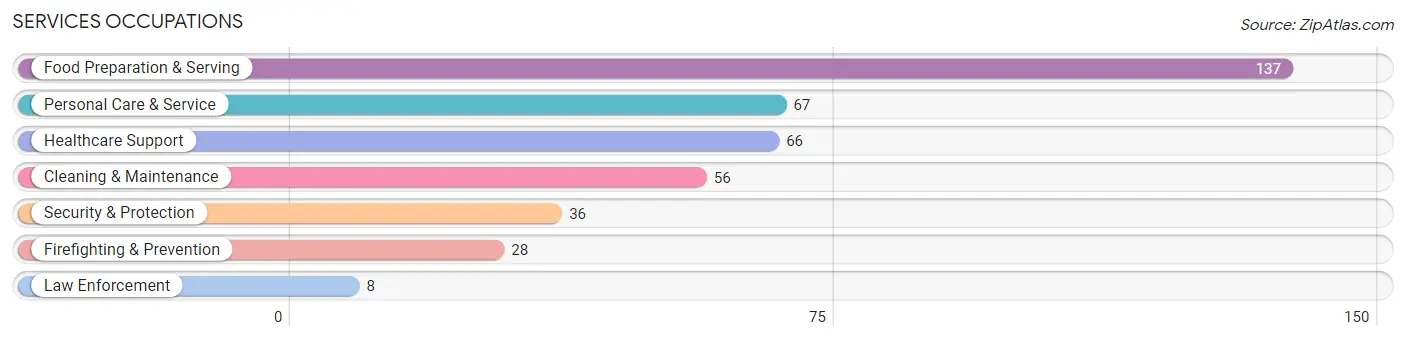
Services Occupations
The most common Services occupations in Brewster Hill are Food Preparation & Serving (137 | 11.5%), Personal Care & Service (67 | 5.6%), Healthcare Support (66 | 5.6%), Cleaning & Maintenance (56 | 4.7%), and Security & Protection (36 | 3.0%).
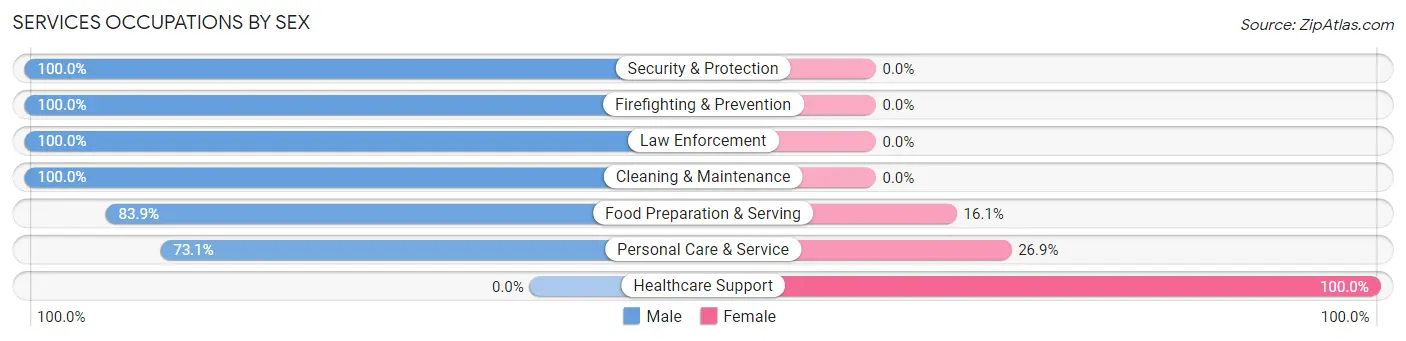
Services Occupations by Sex
Within the Services occupations in Brewster Hill, the most male-oriented occupations are Security & Protection (100.0%), Firefighting & Prevention (100.0%), and Law Enforcement (100.0%), while the most female-oriented occupations are Healthcare Support (100.0%), Personal Care & Service (26.9%), and Food Preparation & Serving (16.1%).
| Occupation | Male | Female |
| Healthcare Support | 0 (0.0%) | 66 (100.0%) |
| Security & Protection | 36 (100.0%) | 0 (0.0%) |
| Firefighting & Prevention | 28 (100.0%) | 0 (0.0%) |
| Law Enforcement | 8 (100.0%) | 0 (0.0%) |
| Food Preparation & Serving | 115 (83.9%) | 22 (16.1%) |
| Cleaning & Maintenance | 56 (100.0%) | 0 (0.0%) |
| Personal Care & Service | 49 (73.1%) | 18 (26.9%) |
| Total (Category) | 256 (70.7%) | 106 (29.3%) |
| Total (Overall) | 785 (66.0%) | 404 (34.0%) |
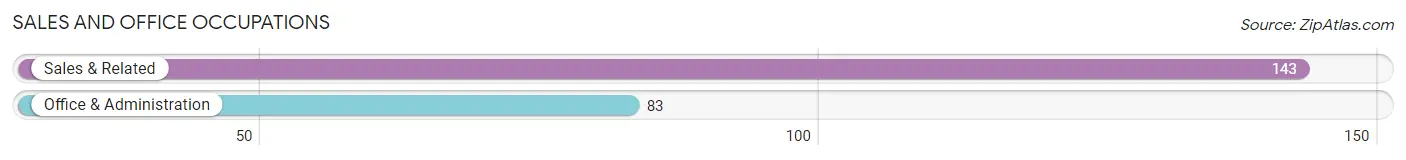
Sales and Office Occupations
The most common Sales and Office occupations in Brewster Hill are Sales & Related (143 | 12.0%), and Office & Administration (83 | 7.0%).
Sales and Office Occupations by Sex
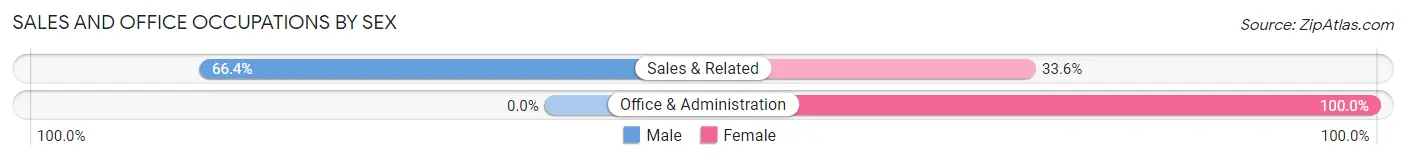
| Occupation | Male | Female |
| Sales & Related | 95 (66.4%) | 48 (33.6%) |
| Office & Administration | 0 (0.0%) | 83 (100.0%) |
| Total (Category) | 95 (42.0%) | 131 (58.0%) |
| Total (Overall) | 785 (66.0%) | 404 (34.0%) |
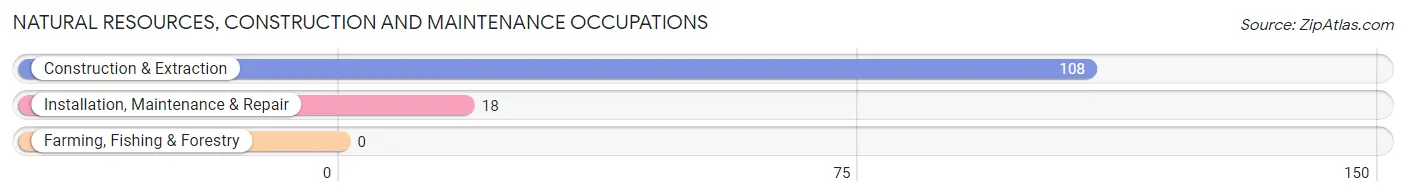
Natural Resources, Construction and Maintenance Occupations
The most common Natural Resources, Construction and Maintenance occupations in Brewster Hill are Construction & Extraction (108 | 9.1%), and Installation, Maintenance & Repair (18 | 1.5%).
Natural Resources, Construction and Maintenance Occupations by Sex
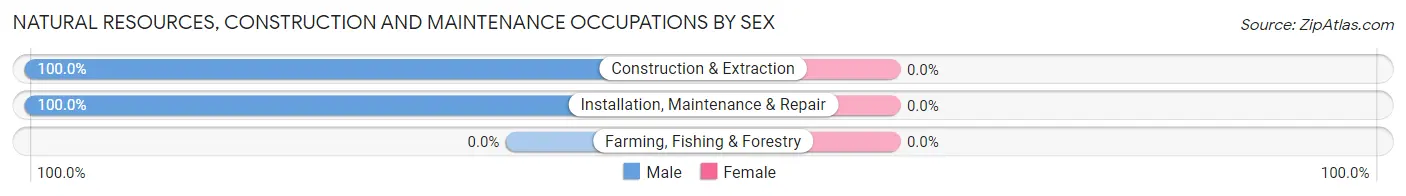
| Occupation | Male | Female |
| Farming, Fishing & Forestry | 0 (0.0%) | 0 (0.0%) |
| Construction & Extraction | 108 (100.0%) | 0 (0.0%) |
| Installation, Maintenance & Repair | 18 (100.0%) | 0 (0.0%) |
| Total (Category) | 126 (100.0%) | 0 (0.0%) |
| Total (Overall) | 785 (66.0%) | 404 (34.0%) |
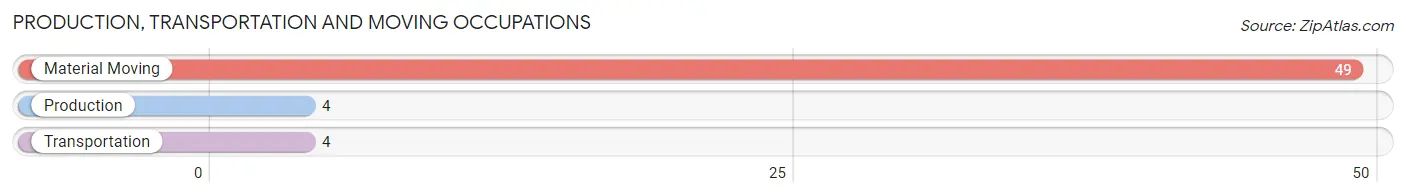
Production, Transportation and Moving Occupations
The most common Production, Transportation and Moving occupations in Brewster Hill are Material Moving (49 | 4.1%), Production (4 | 0.3%), and Transportation (4 | 0.3%).
Production, Transportation and Moving Occupations by Sex
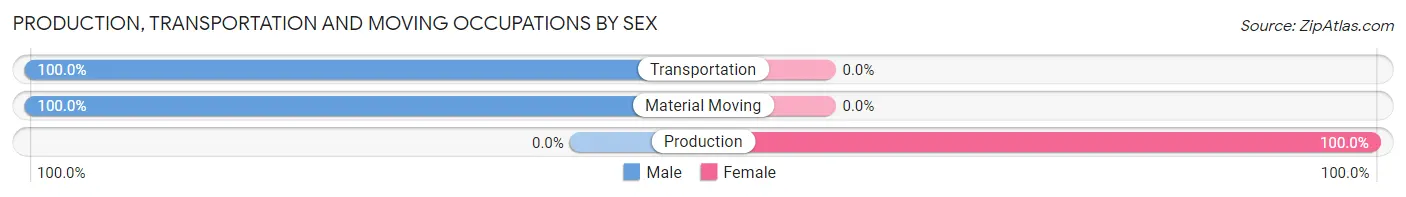
| Occupation | Male | Female |
| Production | 0 (0.0%) | 4 (100.0%) |
| Transportation | 4 (100.0%) | 0 (0.0%) |
| Material Moving | 49 (100.0%) | 0 (0.0%) |
| Total (Category) | 53 (93.0%) | 4 (7.0%) |
| Total (Overall) | 785 (66.0%) | 404 (34.0%) |
Employment Industries by Sex in Brewster Hill
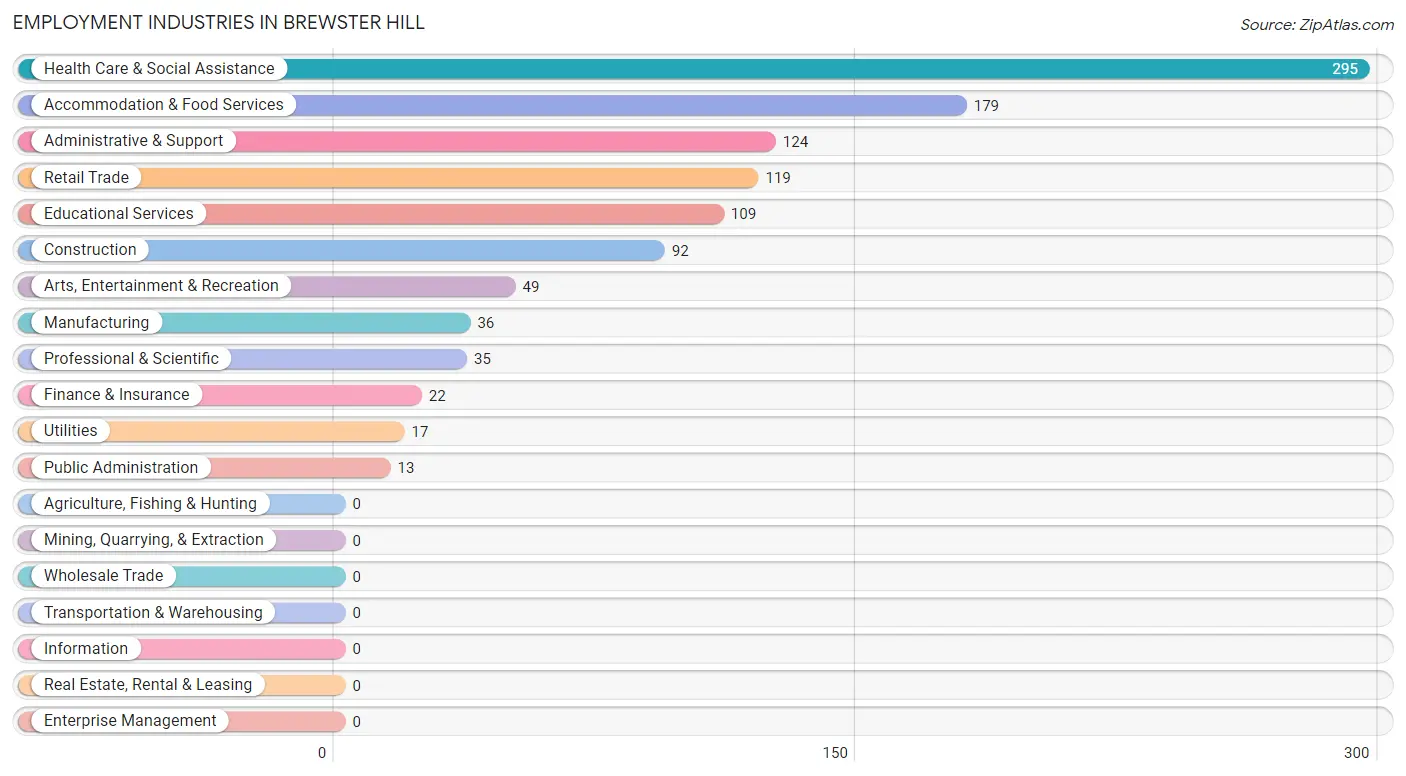
Employment Industries in Brewster Hill
The major employment industries in Brewster Hill include Health Care & Social Assistance (295 | 24.8%), Accommodation & Food Services (179 | 15.0%), Administrative & Support (124 | 10.4%), Retail Trade (119 | 10.0%), and Educational Services (109 | 9.2%).
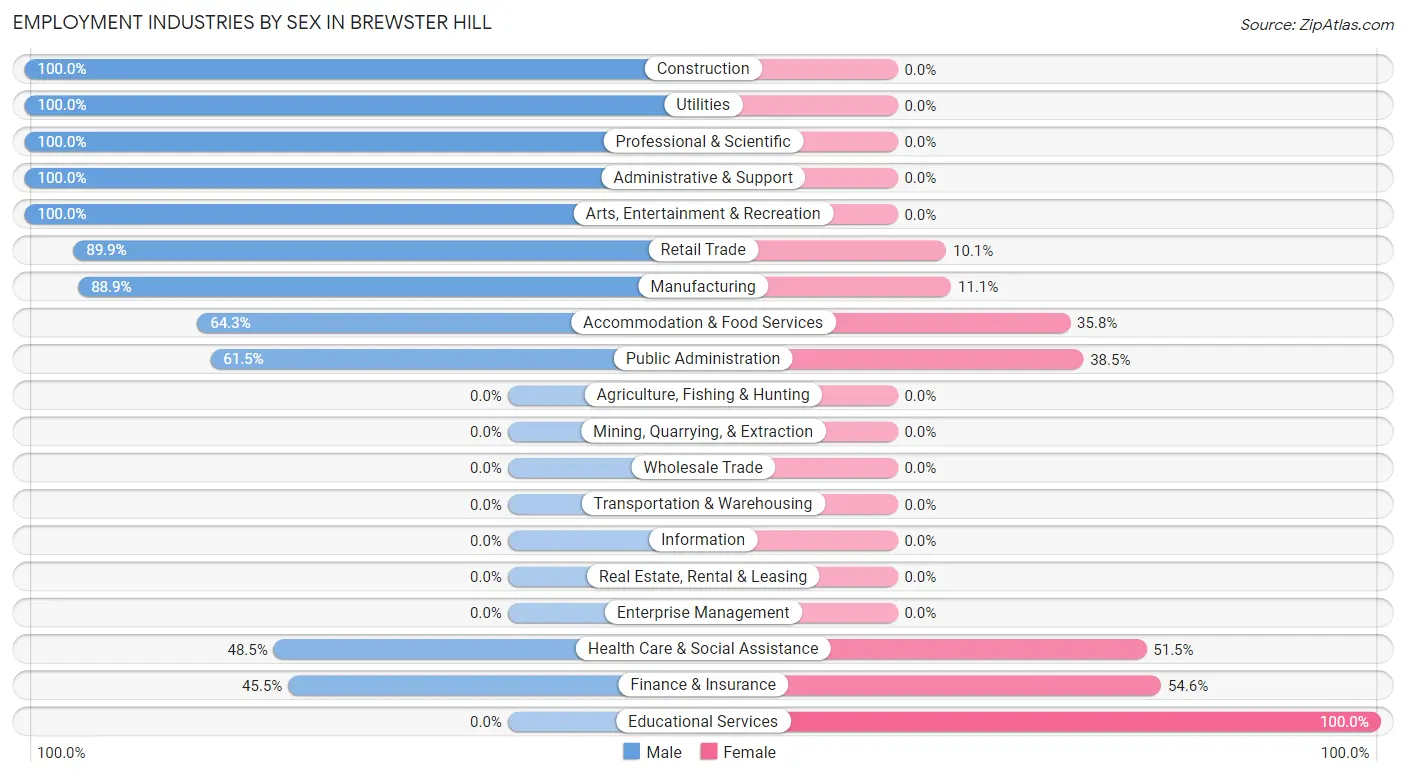
Employment Industries by Sex in Brewster Hill
The Brewster Hill industries that see more men than women are Construction (100.0%), Utilities (100.0%), and Professional & Scientific (100.0%), whereas the industries that tend to have a higher number of women are Educational Services (100.0%), Finance & Insurance (54.5%), and Health Care & Social Assistance (51.5%).
| Industry | Male | Female |
| Agriculture, Fishing & Hunting | 0 (0.0%) | 0 (0.0%) |
| Mining, Quarrying, & Extraction | 0 (0.0%) | 0 (0.0%) |
| Construction | 92 (100.0%) | 0 (0.0%) |
| Manufacturing | 32 (88.9%) | 4 (11.1%) |
| Wholesale Trade | 0 (0.0%) | 0 (0.0%) |
| Retail Trade | 107 (89.9%) | 12 (10.1%) |
| Transportation & Warehousing | 0 (0.0%) | 0 (0.0%) |
| Utilities | 17 (100.0%) | 0 (0.0%) |
| Information | 0 (0.0%) | 0 (0.0%) |
| Finance & Insurance | 10 (45.5%) | 12 (54.5%) |
| Real Estate, Rental & Leasing | 0 (0.0%) | 0 (0.0%) |
| Professional & Scientific | 35 (100.0%) | 0 (0.0%) |
| Enterprise Management | 0 (0.0%) | 0 (0.0%) |
| Administrative & Support | 124 (100.0%) | 0 (0.0%) |
| Educational Services | 0 (0.0%) | 109 (100.0%) |
| Health Care & Social Assistance | 143 (48.5%) | 152 (51.5%) |
| Arts, Entertainment & Recreation | 49 (100.0%) | 0 (0.0%) |
| Accommodation & Food Services | 115 (64.2%) | 64 (35.7%) |
| Public Administration | 8 (61.5%) | 5 (38.5%) |
| Total | 785 (66.0%) | 404 (34.0%) |
Education in Brewster Hill
School Enrollment in Brewster Hill
The most common levels of schooling among the 531 students in Brewster Hill are elementary school (152 | 28.6%), high school (149 | 28.1%), and college / undergraduate (137 | 25.8%).
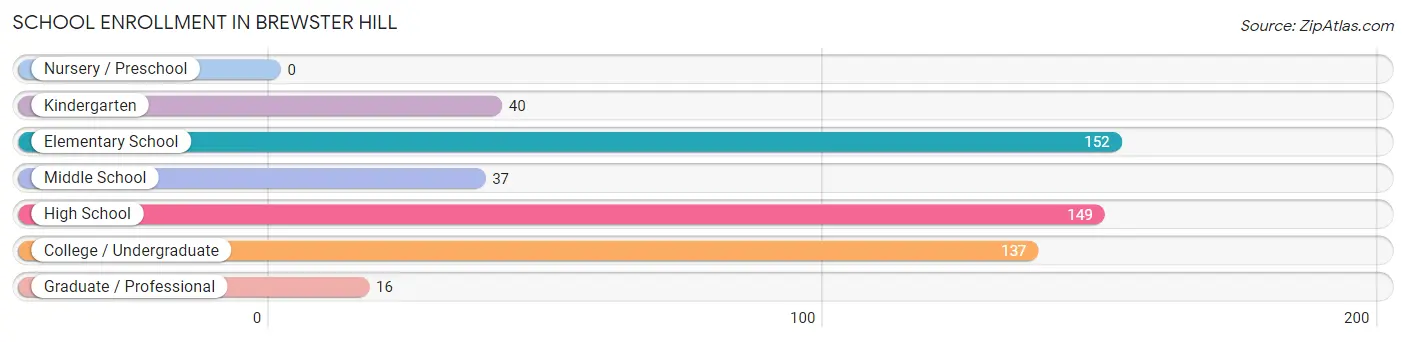
| School Level | # Students | % Students |
| Nursery / Preschool | 0 | 0.0% |
| Kindergarten | 40 | 7.5% |
| Elementary School | 152 | 28.6% |
| Middle School | 37 | 7.0% |
| High School | 149 | 28.1% |
| College / Undergraduate | 137 | 25.8% |
| Graduate / Professional | 16 | 3.0% |
| Total | 531 | 100.0% |
School Enrollment by Age by Funding Source in Brewster Hill
Out of a total of 531 students who are enrolled in schools in Brewster Hill, 85 (16.0%) attend a private institution, while the remaining 446 (84.0%) are enrolled in public schools. The age group of 35 years and over has the highest likelihood of being enrolled in private schools, with 72 (70.6% in the age bracket) enrolled. Conversely, the age group of 5 to 9 year old has the lowest likelihood of being enrolled in a private school, with 192 (100.0% in the age bracket) attending a public institution.
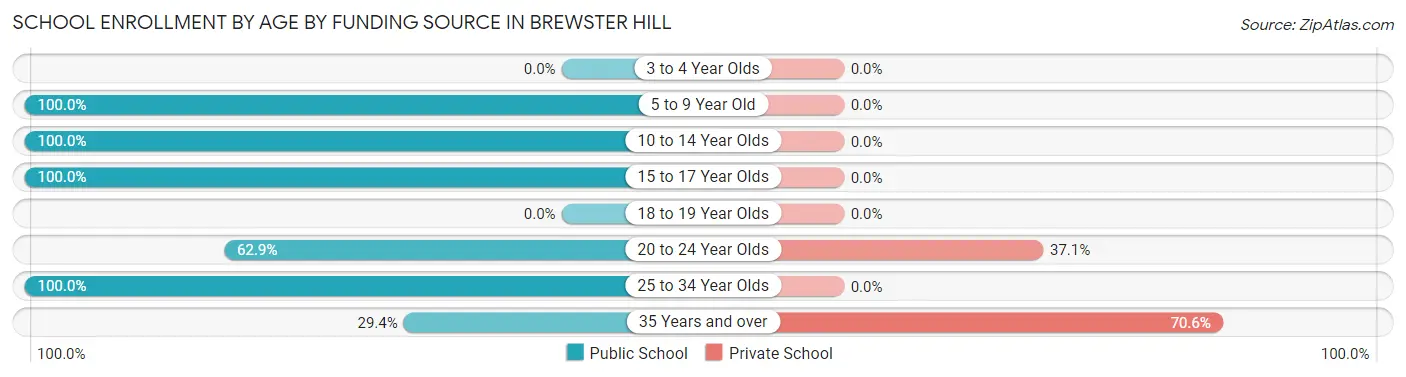
| Age Bracket | Public School | Private School |
| 3 to 4 Year Olds | 0 (0.0%) | 0 (0.0%) |
| 5 to 9 Year Old | 192 (100.0%) | 0 (0.0%) |
| 10 to 14 Year Olds | 133 (100.0%) | 0 (0.0%) |
| 15 to 17 Year Olds | 53 (100.0%) | 0 (0.0%) |
| 18 to 19 Year Olds | 0 (0.0%) | 0 (0.0%) |
| 20 to 24 Year Olds | 22 (62.9%) | 13 (37.1%) |
| 25 to 34 Year Olds | 16 (100.0%) | 0 (0.0%) |
| 35 Years and over | 30 (29.4%) | 72 (70.6%) |
| Total | 446 (84.0%) | 85 (16.0%) |
Educational Attainment by Field of Study in Brewster Hill
Bio, nature & agricultural (141 | 24.9%), education (136 | 24.0%), business (85 | 15.0%), communications (42 | 7.4%), and literature & languages (36 | 6.4%) are the most common fields of study among 566 individuals in Brewster Hill who have obtained a bachelor's degree or higher.
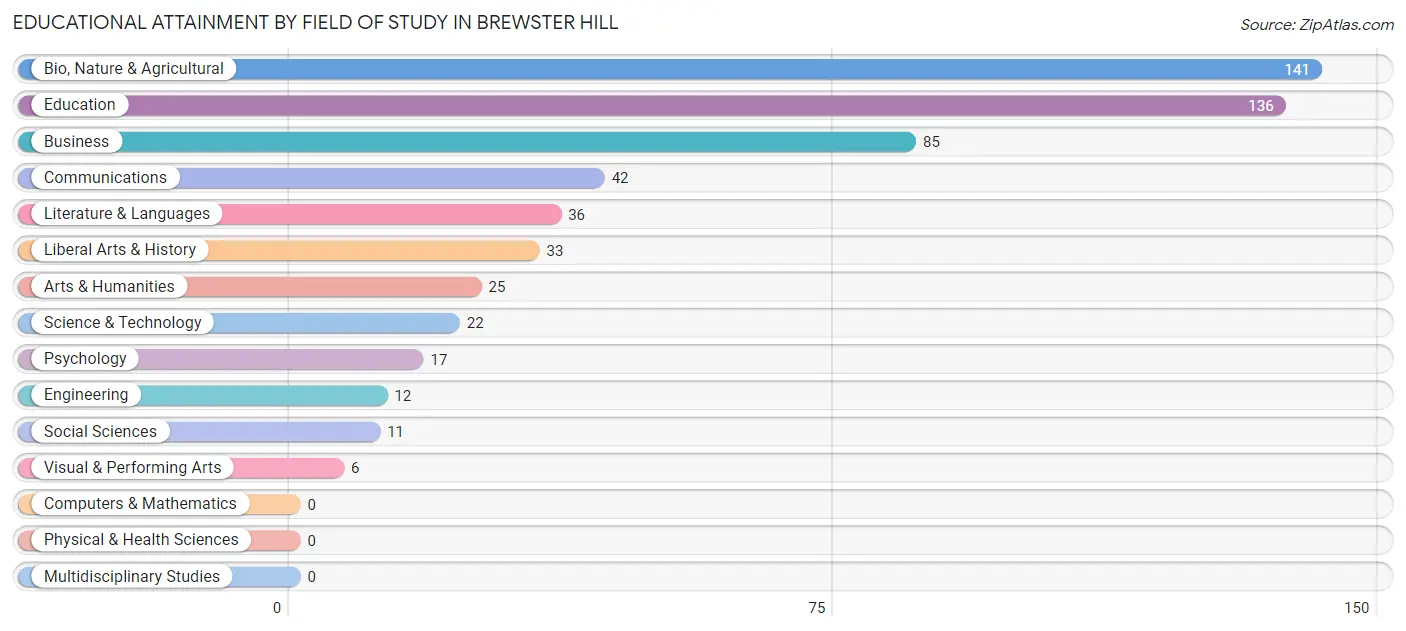
| Field of Study | # Graduates | % Graduates |
| Computers & Mathematics | 0 | 0.0% |
| Bio, Nature & Agricultural | 141 | 24.9% |
| Physical & Health Sciences | 0 | 0.0% |
| Psychology | 17 | 3.0% |
| Social Sciences | 11 | 1.9% |
| Engineering | 12 | 2.1% |
| Multidisciplinary Studies | 0 | 0.0% |
| Science & Technology | 22 | 3.9% |
| Business | 85 | 15.0% |
| Education | 136 | 24.0% |
| Literature & Languages | 36 | 6.4% |
| Liberal Arts & History | 33 | 5.8% |
| Visual & Performing Arts | 6 | 1.1% |
| Communications | 42 | 7.4% |
| Arts & Humanities | 25 | 4.4% |
| Total | 566 | 100.0% |
Transportation & Commute in Brewster Hill
Vehicle Availability by Sex in Brewster Hill
The most prevalent vehicle ownership categories in Brewster Hill are males with 2 vehicles (539, accounting for 69.6%) and females with 2 vehicles (210, making up 133.4%).
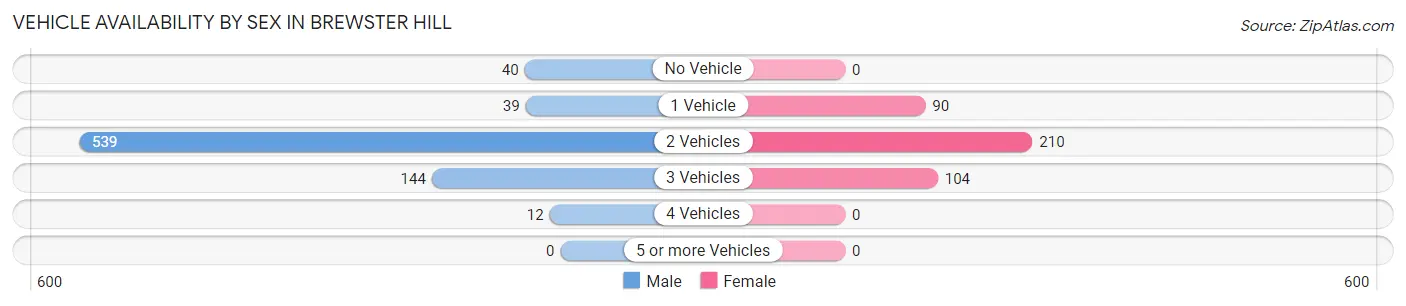
| Vehicles Available | Male | Female |
| No Vehicle | 40 (5.2%) | 0 (0.0%) |
| 1 Vehicle | 39 (5.0%) | 90 (22.3%) |
| 2 Vehicles | 539 (69.6%) | 210 (52.0%) |
| 3 Vehicles | 144 (18.6%) | 104 (25.7%) |
| 4 Vehicles | 12 (1.5%) | 0 (0.0%) |
| 5 or more Vehicles | 0 (0.0%) | 0 (0.0%) |
| Total | 774 (100.0%) | 404 (100.0%) |
Commute Time in Brewster Hill
The most frequently occuring commute durations in Brewster Hill are 10 to 14 minutes (281 commuters, 25.6%), 45 to 59 minutes (167 commuters, 15.2%), and 30 to 34 minutes (155 commuters, 14.1%).
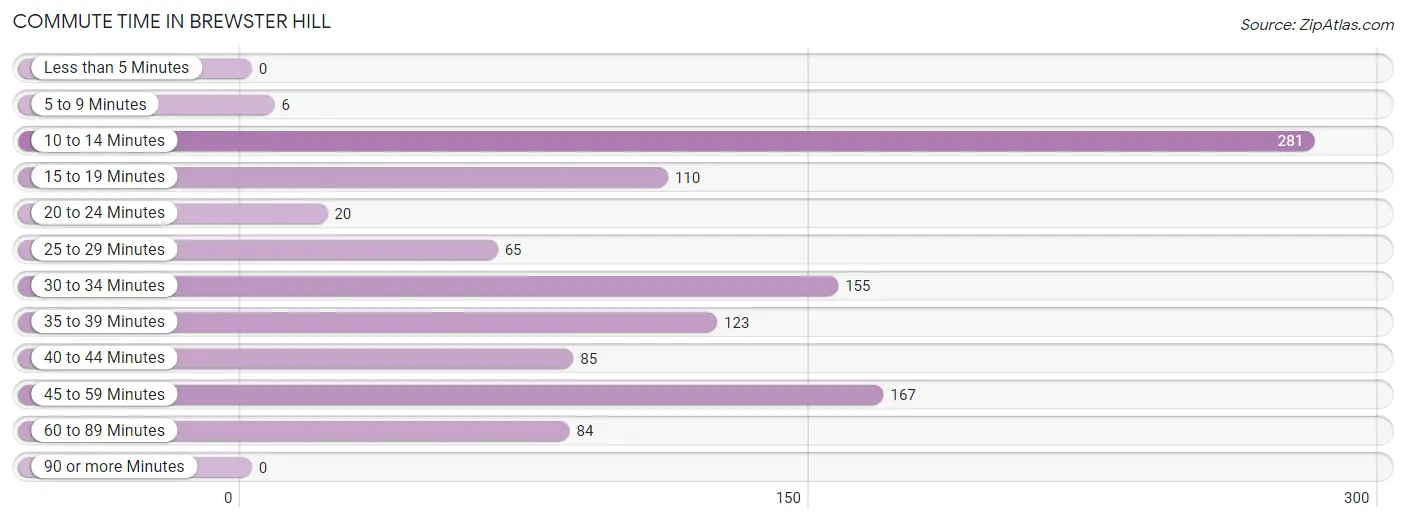
| Commute Time | # Commuters | % Commuters |
| Less than 5 Minutes | 0 | 0.0% |
| 5 to 9 Minutes | 6 | 0.5% |
| 10 to 14 Minutes | 281 | 25.6% |
| 15 to 19 Minutes | 110 | 10.0% |
| 20 to 24 Minutes | 20 | 1.8% |
| 25 to 29 Minutes | 65 | 5.9% |
| 30 to 34 Minutes | 155 | 14.1% |
| 35 to 39 Minutes | 123 | 11.2% |
| 40 to 44 Minutes | 85 | 7.8% |
| 45 to 59 Minutes | 167 | 15.2% |
| 60 to 89 Minutes | 84 | 7.7% |
| 90 or more Minutes | 0 | 0.0% |
Commute Time by Sex in Brewster Hill
The most common commute times in Brewster Hill are 10 to 14 minutes (212 commuters, 30.1%) for males and 30 to 34 minutes (102 commuters, 26.0%) for females.
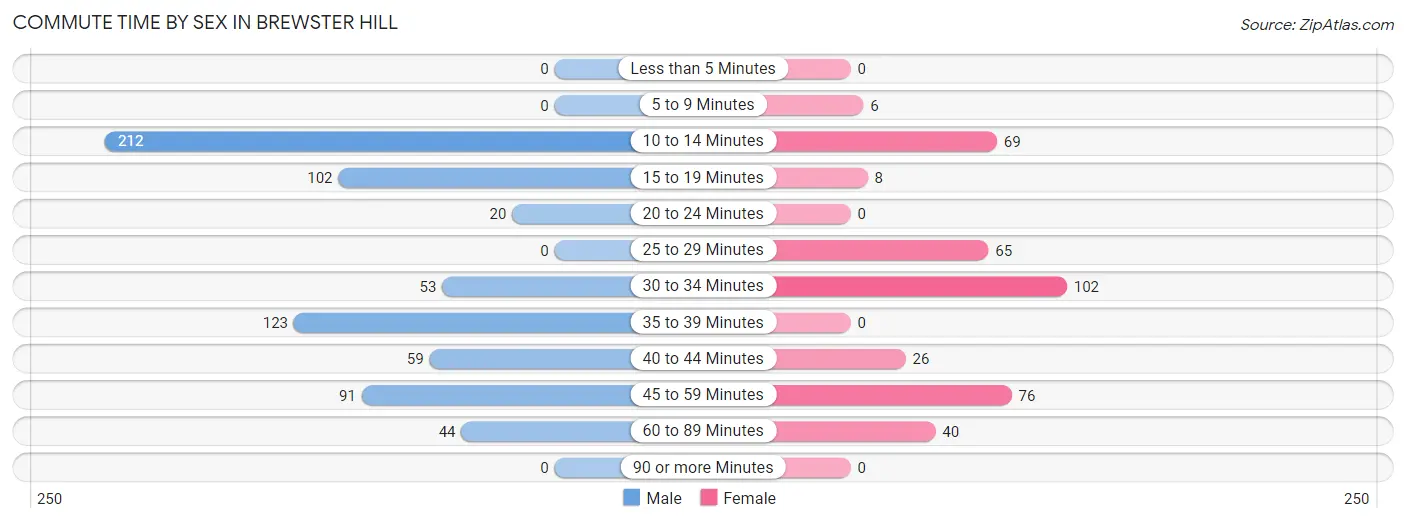
| Commute Time | Male | Female |
| Less than 5 Minutes | 0 (0.0%) | 0 (0.0%) |
| 5 to 9 Minutes | 0 (0.0%) | 6 (1.5%) |
| 10 to 14 Minutes | 212 (30.1%) | 69 (17.6%) |
| 15 to 19 Minutes | 102 (14.5%) | 8 (2.0%) |
| 20 to 24 Minutes | 20 (2.8%) | 0 (0.0%) |
| 25 to 29 Minutes | 0 (0.0%) | 65 (16.6%) |
| 30 to 34 Minutes | 53 (7.5%) | 102 (26.0%) |
| 35 to 39 Minutes | 123 (17.5%) | 0 (0.0%) |
| 40 to 44 Minutes | 59 (8.4%) | 26 (6.6%) |
| 45 to 59 Minutes | 91 (12.9%) | 76 (19.4%) |
| 60 to 89 Minutes | 44 (6.2%) | 40 (10.2%) |
| 90 or more Minutes | 0 (0.0%) | 0 (0.0%) |
Time of Departure to Work by Sex in Brewster Hill
The most frequent times of departure to work in Brewster Hill are 6:30 AM to 6:59 AM (150, 21.3%) for males and 6:30 AM to 6:59 AM (123, 31.4%) for females.
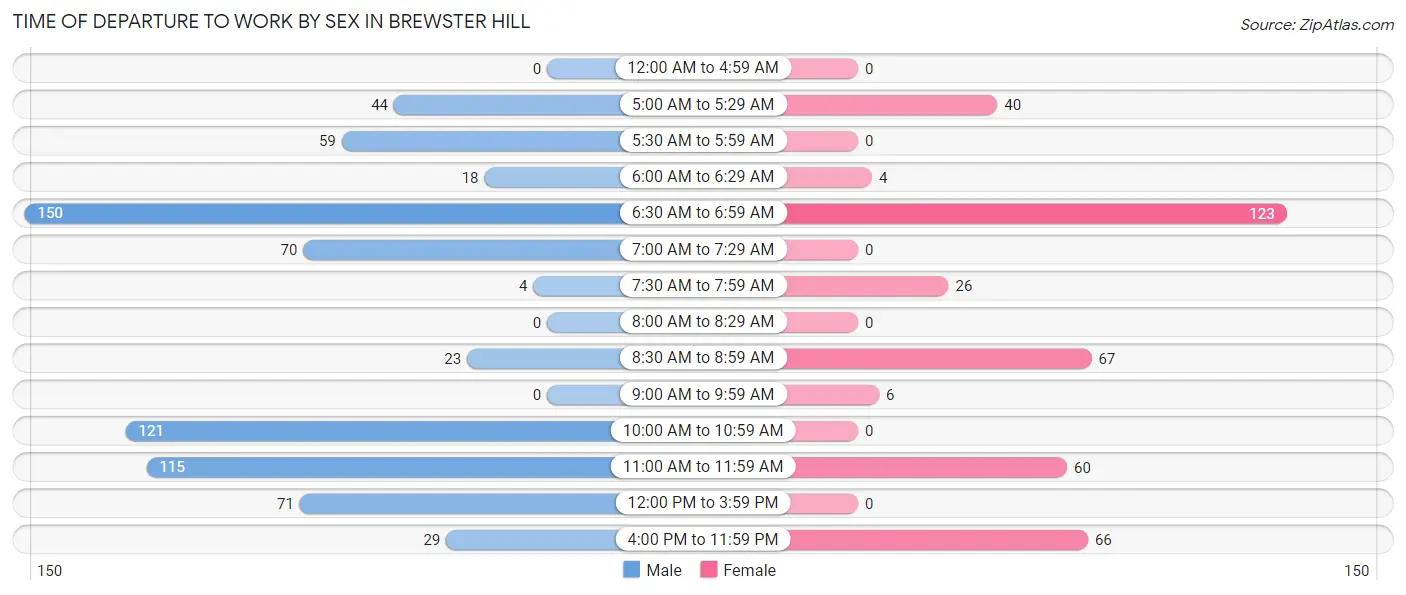
| Time of Departure | Male | Female |
| 12:00 AM to 4:59 AM | 0 (0.0%) | 0 (0.0%) |
| 5:00 AM to 5:29 AM | 44 (6.2%) | 40 (10.2%) |
| 5:30 AM to 5:59 AM | 59 (8.4%) | 0 (0.0%) |
| 6:00 AM to 6:29 AM | 18 (2.6%) | 4 (1.0%) |
| 6:30 AM to 6:59 AM | 150 (21.3%) | 123 (31.4%) |
| 7:00 AM to 7:29 AM | 70 (9.9%) | 0 (0.0%) |
| 7:30 AM to 7:59 AM | 4 (0.6%) | 26 (6.6%) |
| 8:00 AM to 8:29 AM | 0 (0.0%) | 0 (0.0%) |
| 8:30 AM to 8:59 AM | 23 (3.3%) | 67 (17.1%) |
| 9:00 AM to 9:59 AM | 0 (0.0%) | 6 (1.5%) |
| 10:00 AM to 10:59 AM | 121 (17.2%) | 0 (0.0%) |
| 11:00 AM to 11:59 AM | 115 (16.3%) | 60 (15.3%) |
| 12:00 PM to 3:59 PM | 71 (10.1%) | 0 (0.0%) |
| 4:00 PM to 11:59 PM | 29 (4.1%) | 66 (16.8%) |
| Total | 704 (100.0%) | 392 (100.0%) |
Housing Occupancy in Brewster Hill
Occupancy by Ownership in Brewster Hill
Of the total 1,029 dwellings in Brewster Hill, owner-occupied units account for 979 (95.1%), while renter-occupied units make up 50 (4.9%).
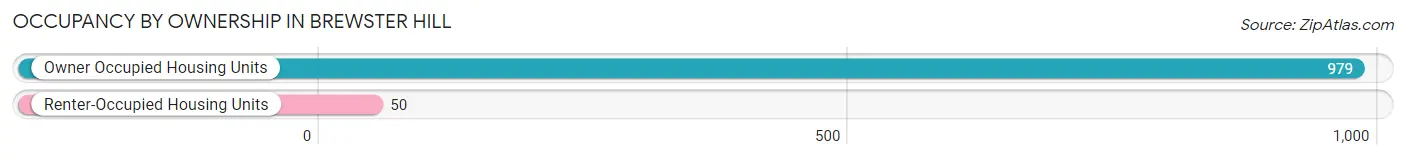
| Occupancy | # Housing Units | % Housing Units |
| Owner Occupied Housing Units | 979 | 95.1% |
| Renter-Occupied Housing Units | 50 | 4.9% |
| Total Occupied Housing Units | 1,029 | 100.0% |
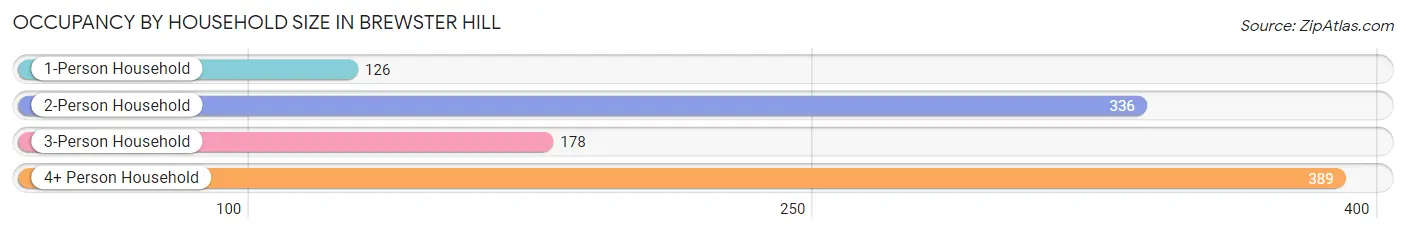
Occupancy by Household Size in Brewster Hill
| Household Size | # Housing Units | % Housing Units |
| 1-Person Household | 126 | 12.2% |
| 2-Person Household | 336 | 32.7% |
| 3-Person Household | 178 | 17.3% |
| 4+ Person Household | 389 | 37.8% |
| Total Housing Units | 1,029 | 100.0% |
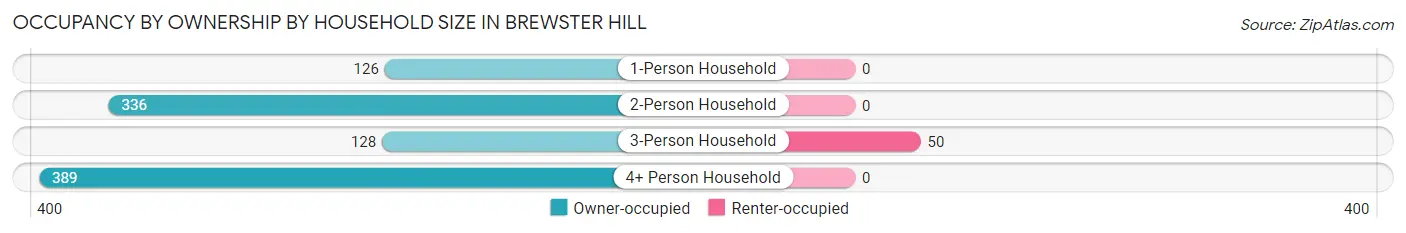
Occupancy by Ownership by Household Size in Brewster Hill
| Household Size | Owner-occupied | Renter-occupied |
| 1-Person Household | 126 (100.0%) | 0 (0.0%) |
| 2-Person Household | 336 (100.0%) | 0 (0.0%) |
| 3-Person Household | 128 (71.9%) | 50 (28.1%) |
| 4+ Person Household | 389 (100.0%) | 0 (0.0%) |
| Total Housing Units | 979 (95.1%) | 50 (4.9%) |
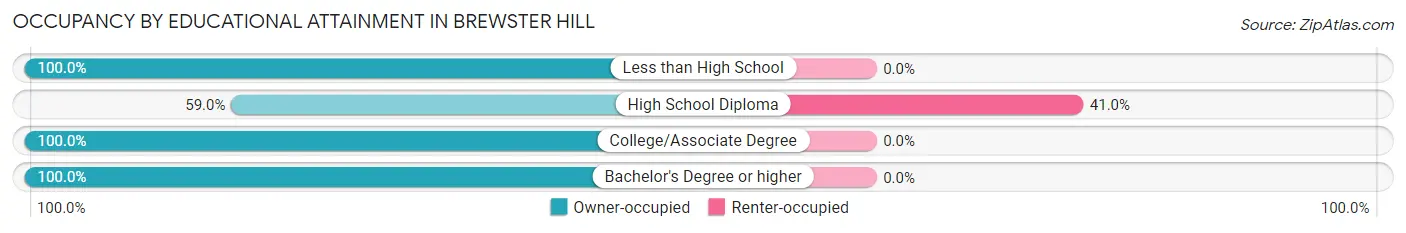
Occupancy by Educational Attainment in Brewster Hill
| Household Size | Owner-occupied | Renter-occupied |
| Less than High School | 283 (100.0%) | 0 (0.0%) |
| High School Diploma | 72 (59.0%) | 50 (41.0%) |
| College/Associate Degree | 448 (100.0%) | 0 (0.0%) |
| Bachelor's Degree or higher | 176 (100.0%) | 0 (0.0%) |
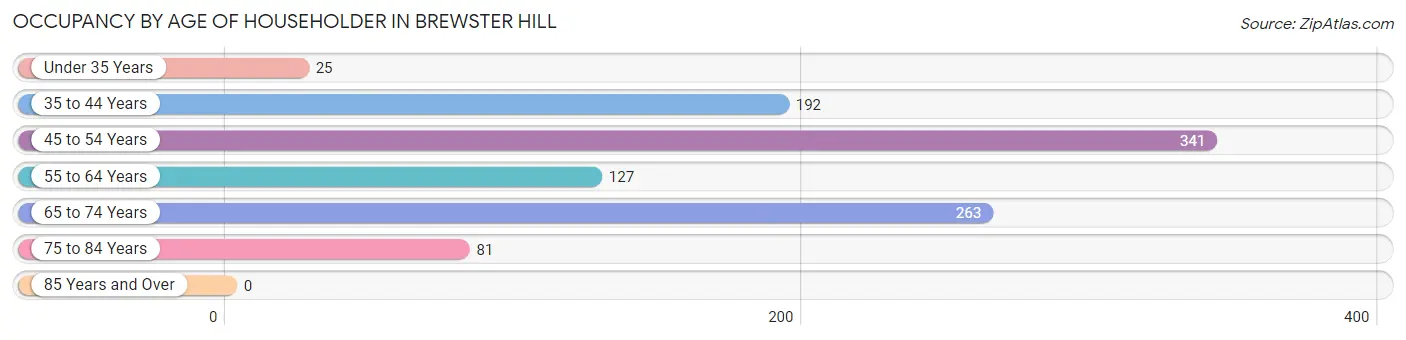
Occupancy by Age of Householder in Brewster Hill
| Age Bracket | # Households | % Households |
| Under 35 Years | 25 | 2.4% |
| 35 to 44 Years | 192 | 18.7% |
| 45 to 54 Years | 341 | 33.1% |
| 55 to 64 Years | 127 | 12.3% |
| 65 to 74 Years | 263 | 25.6% |
| 75 to 84 Years | 81 | 7.9% |
| 85 Years and Over | 0 | 0.0% |
| Total | 1,029 | 100.0% |
Housing Finances in Brewster Hill
Median Income by Occupancy in Brewster Hill
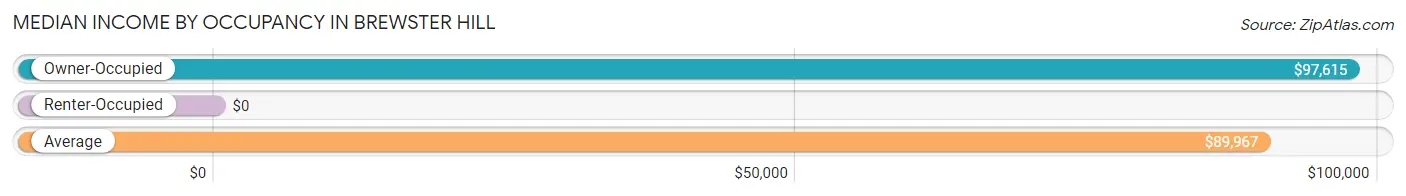
| Occupancy Type | # Households | Median Income |
| Owner-Occupied | 979 (95.1%) | $97,615 |
| Renter-Occupied | 50 (4.9%) | $0 |
| Average | 1,029 (100.0%) | $89,967 |
Occupancy by Householder Income Bracket in Brewster Hill
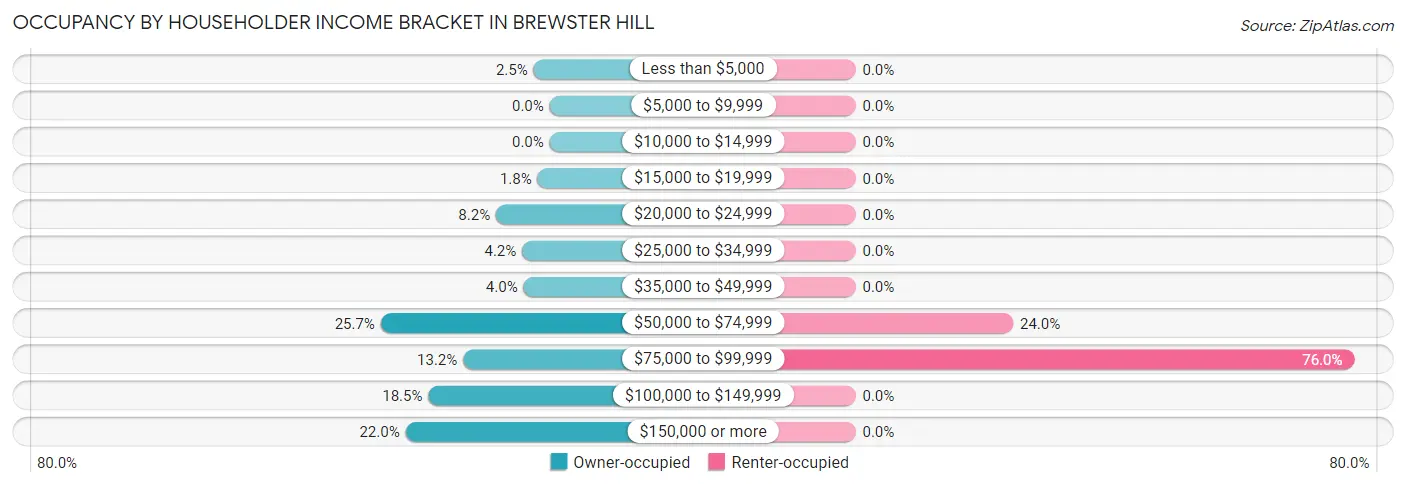
| Income Bracket | Owner-occupied | Renter-occupied |
| Less than $5,000 | 24 (2.5%) | 0 (0.0%) |
| $5,000 to $9,999 | 0 (0.0%) | 0 (0.0%) |
| $10,000 to $14,999 | 0 (0.0%) | 0 (0.0%) |
| $15,000 to $19,999 | 18 (1.8%) | 0 (0.0%) |
| $20,000 to $24,999 | 80 (8.2%) | 0 (0.0%) |
| $25,000 to $34,999 | 41 (4.2%) | 0 (0.0%) |
| $35,000 to $49,999 | 39 (4.0%) | 0 (0.0%) |
| $50,000 to $74,999 | 252 (25.7%) | 12 (24.0%) |
| $75,000 to $99,999 | 129 (13.2%) | 38 (76.0%) |
| $100,000 to $149,999 | 181 (18.5%) | 0 (0.0%) |
| $150,000 or more | 215 (22.0%) | 0 (0.0%) |
| Total | 979 (100.0%) | 50 (100.0%) |
Monthly Housing Cost Tiers in Brewster Hill
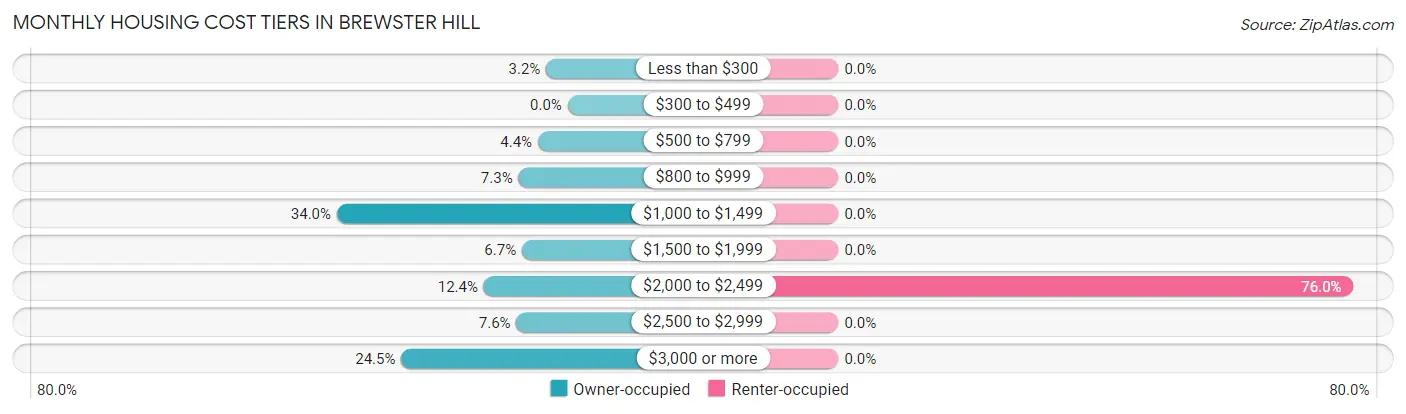
| Monthly Cost | Owner-occupied | Renter-occupied |
| Less than $300 | 31 (3.2%) | 0 (0.0%) |
| $300 to $499 | 0 (0.0%) | 0 (0.0%) |
| $500 to $799 | 43 (4.4%) | 0 (0.0%) |
| $800 to $999 | 71 (7.2%) | 0 (0.0%) |
| $1,000 to $1,499 | 333 (34.0%) | 0 (0.0%) |
| $1,500 to $1,999 | 66 (6.7%) | 0 (0.0%) |
| $2,000 to $2,499 | 121 (12.4%) | 38 (76.0%) |
| $2,500 to $2,999 | 74 (7.6%) | 0 (0.0%) |
| $3,000 or more | 240 (24.5%) | 0 (0.0%) |
| Total | 979 (100.0%) | 50 (100.0%) |
Physical Housing Characteristics in Brewster Hill
Housing Structures in Brewster Hill
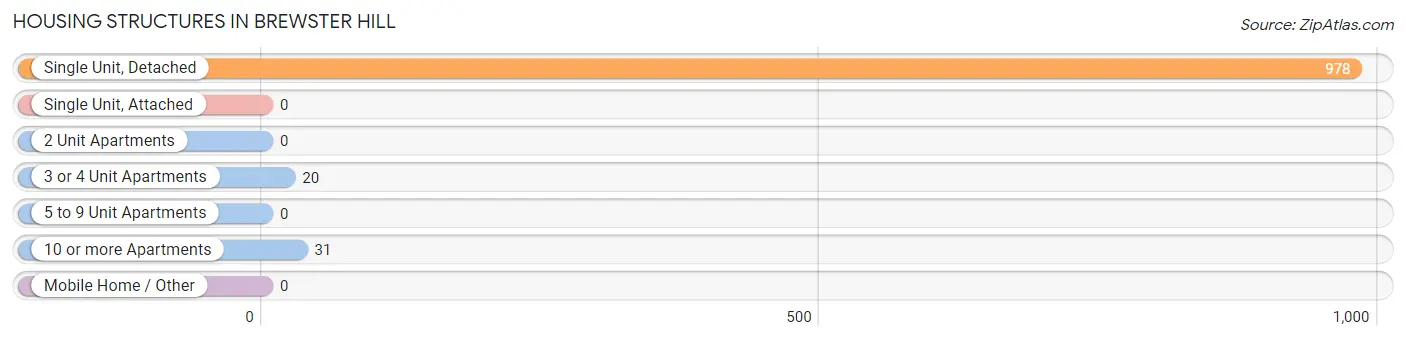
| Structure Type | # Housing Units | % Housing Units |
| Single Unit, Detached | 978 | 95.0% |
| Single Unit, Attached | 0 | 0.0% |
| 2 Unit Apartments | 0 | 0.0% |
| 3 or 4 Unit Apartments | 20 | 1.9% |
| 5 to 9 Unit Apartments | 0 | 0.0% |
| 10 or more Apartments | 31 | 3.0% |
| Mobile Home / Other | 0 | 0.0% |
| Total | 1,029 | 100.0% |
Housing Structures by Occupancy in Brewster Hill
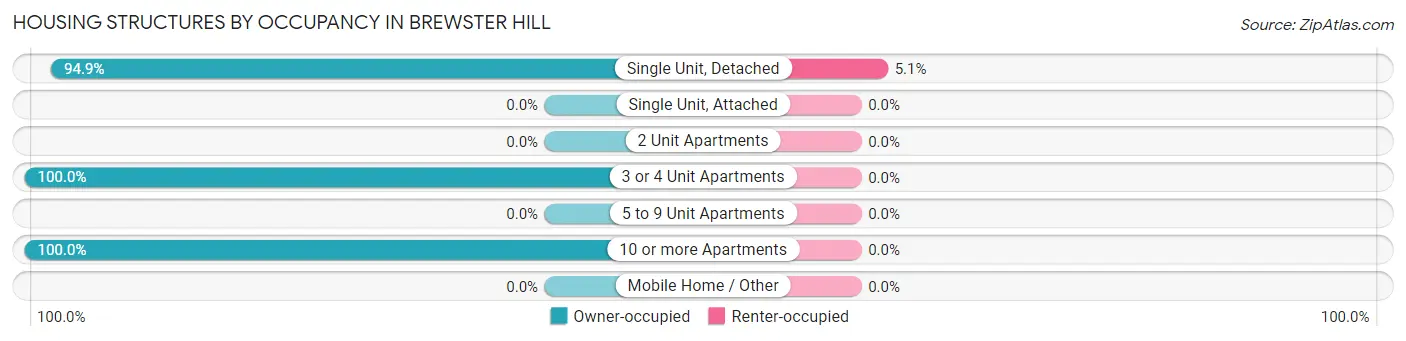
| Structure Type | Owner-occupied | Renter-occupied |
| Single Unit, Detached | 928 (94.9%) | 50 (5.1%) |
| Single Unit, Attached | 0 (0.0%) | 0 (0.0%) |
| 2 Unit Apartments | 0 (0.0%) | 0 (0.0%) |
| 3 or 4 Unit Apartments | 20 (100.0%) | 0 (0.0%) |
| 5 to 9 Unit Apartments | 0 (0.0%) | 0 (0.0%) |
| 10 or more Apartments | 31 (100.0%) | 0 (0.0%) |
| Mobile Home / Other | 0 (0.0%) | 0 (0.0%) |
| Total | 979 (95.1%) | 50 (4.9%) |
Housing Structures by Number of Rooms in Brewster Hill
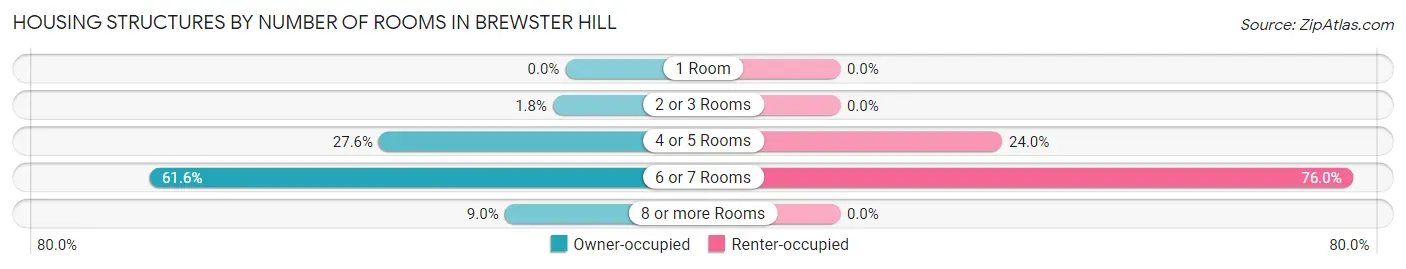
| Number of Rooms | Owner-occupied | Renter-occupied |
| 1 Room | 0 (0.0%) | 0 (0.0%) |
| 2 or 3 Rooms | 18 (1.8%) | 0 (0.0%) |
| 4 or 5 Rooms | 270 (27.6%) | 12 (24.0%) |
| 6 or 7 Rooms | 603 (61.6%) | 38 (76.0%) |
| 8 or more Rooms | 88 (9.0%) | 0 (0.0%) |
| Total | 979 (100.0%) | 50 (100.0%) |
Housing Structure by Heating Type in Brewster Hill
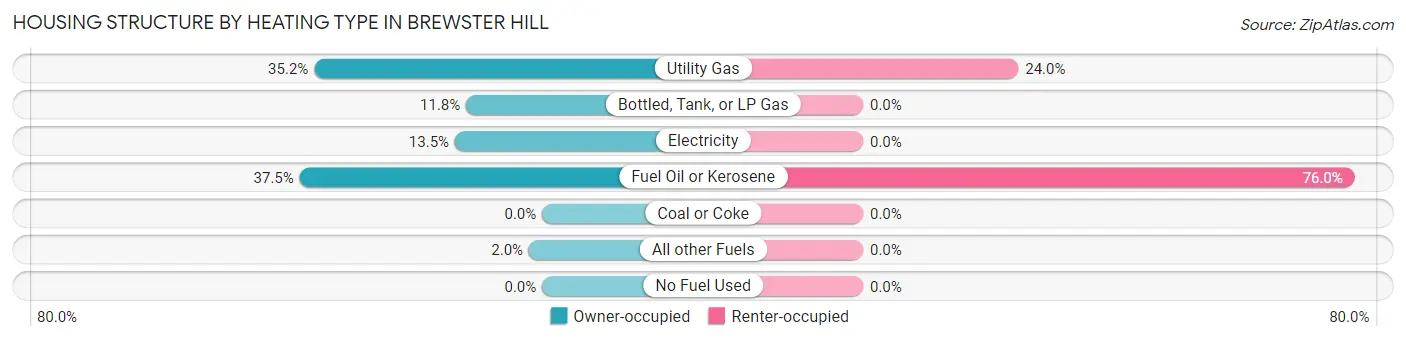
| Heating Type | Owner-occupied | Renter-occupied |
| Utility Gas | 345 (35.2%) | 12 (24.0%) |
| Bottled, Tank, or LP Gas | 115 (11.7%) | 0 (0.0%) |
| Electricity | 132 (13.5%) | 0 (0.0%) |
| Fuel Oil or Kerosene | 367 (37.5%) | 38 (76.0%) |
| Coal or Coke | 0 (0.0%) | 0 (0.0%) |
| All other Fuels | 20 (2.0%) | 0 (0.0%) |
| No Fuel Used | 0 (0.0%) | 0 (0.0%) |
| Total | 979 (100.0%) | 50 (100.0%) |
Household Vehicle Usage in Brewster Hill
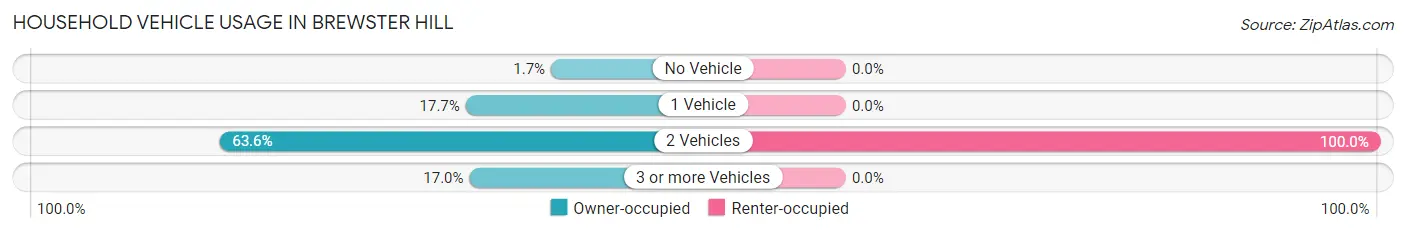
| Vehicles per Household | Owner-occupied | Renter-occupied |
| No Vehicle | 17 (1.7%) | 0 (0.0%) |
| 1 Vehicle | 173 (17.7%) | 0 (0.0%) |
| 2 Vehicles | 623 (63.6%) | 50 (100.0%) |
| 3 or more Vehicles | 166 (17.0%) | 0 (0.0%) |
| Total | 979 (100.0%) | 50 (100.0%) |
Real Estate & Mortgages in Brewster Hill
Real Estate and Mortgage Overview in Brewster Hill
| Characteristic | Without Mortgage | With Mortgage |
| Housing Units | 447 | 532 |
| Median Property Value | $363,500 | $379,000 |
| Median Household Income | $51,491 | $191 |
| Monthly Housing Costs | $1,081 | $240 |
| Real Estate Taxes | $9,826 | $0 |
Property Value by Mortgage Status in Brewster Hill
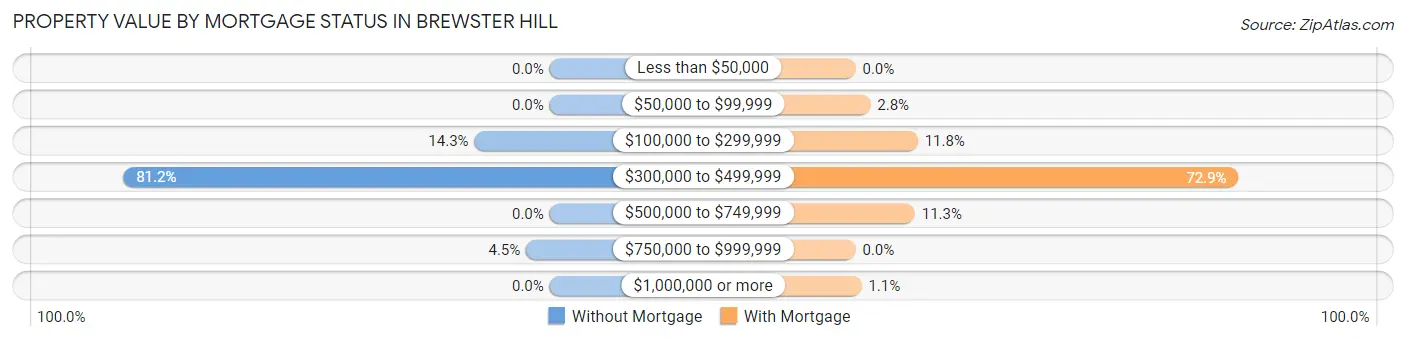
| Property Value | Without Mortgage | With Mortgage |
| Less than $50,000 | 0 (0.0%) | 0 (0.0%) |
| $50,000 to $99,999 | 0 (0.0%) | 15 (2.8%) |
| $100,000 to $299,999 | 64 (14.3%) | 63 (11.8%) |
| $300,000 to $499,999 | 363 (81.2%) | 388 (72.9%) |
| $500,000 to $749,999 | 0 (0.0%) | 60 (11.3%) |
| $750,000 to $999,999 | 20 (4.5%) | 0 (0.0%) |
| $1,000,000 or more | 0 (0.0%) | 6 (1.1%) |
| Total | 447 (100.0%) | 532 (100.0%) |
Household Income by Mortgage Status in Brewster Hill
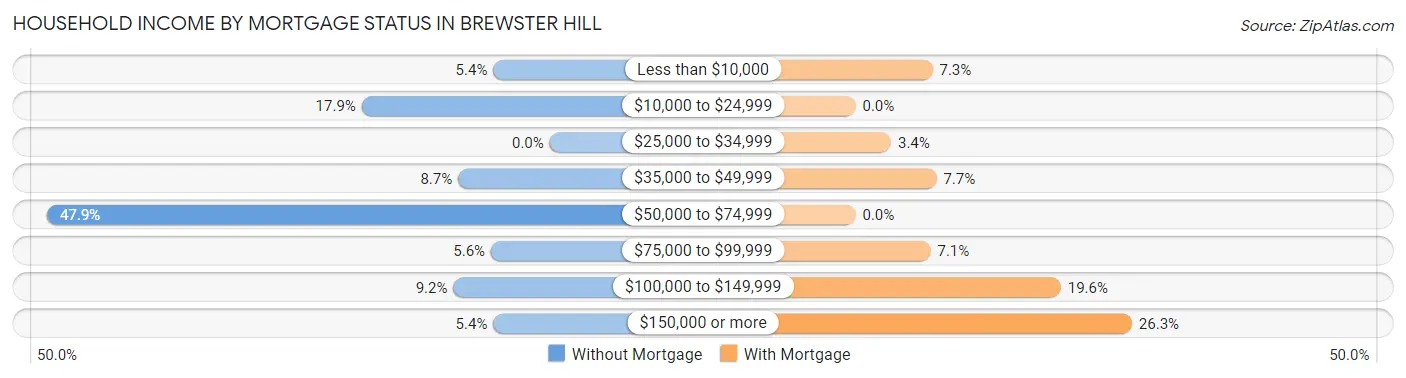
| Household Income | Without Mortgage | With Mortgage |
| Less than $10,000 | 24 (5.4%) | 39 (7.3%) |
| $10,000 to $24,999 | 80 (17.9%) | 0 (0.0%) |
| $25,000 to $34,999 | 0 (0.0%) | 18 (3.4%) |
| $35,000 to $49,999 | 39 (8.7%) | 41 (7.7%) |
| $50,000 to $74,999 | 214 (47.9%) | 0 (0.0%) |
| $75,000 to $99,999 | 25 (5.6%) | 38 (7.1%) |
| $100,000 to $149,999 | 41 (9.2%) | 104 (19.6%) |
| $150,000 or more | 24 (5.4%) | 140 (26.3%) |
| Total | 447 (100.0%) | 532 (100.0%) |
Property Value to Household Income Ratio in Brewster Hill
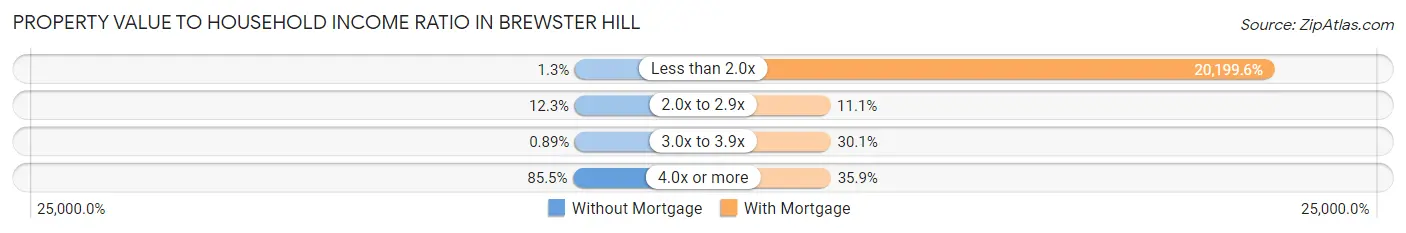
| Value-to-Income Ratio | Without Mortgage | With Mortgage |
| Less than 2.0x | 6 (1.3%) | 107,462 (20,199.6%) |
| 2.0x to 2.9x | 55 (12.3%) | 59 (11.1%) |
| 3.0x to 3.9x | 4 (0.9%) | 160 (30.1%) |
| 4.0x or more | 382 (85.5%) | 191 (35.9%) |
| Total | 447 (100.0%) | 532 (100.0%) |
Real Estate Taxes by Mortgage Status in Brewster Hill
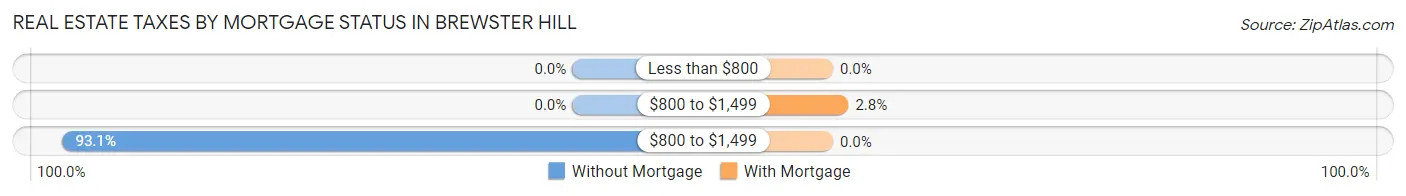
| Property Taxes | Without Mortgage | With Mortgage |
| Less than $800 | 0 (0.0%) | 0 (0.0%) |
| $800 to $1,499 | 0 (0.0%) | 15 (2.8%) |
| $800 to $1,499 | 416 (93.1%) | 0 (0.0%) |
| Total | 447 (100.0%) | 532 (100.0%) |
Health & Disability in Brewster Hill
Health Insurance Coverage by Age in Brewster Hill
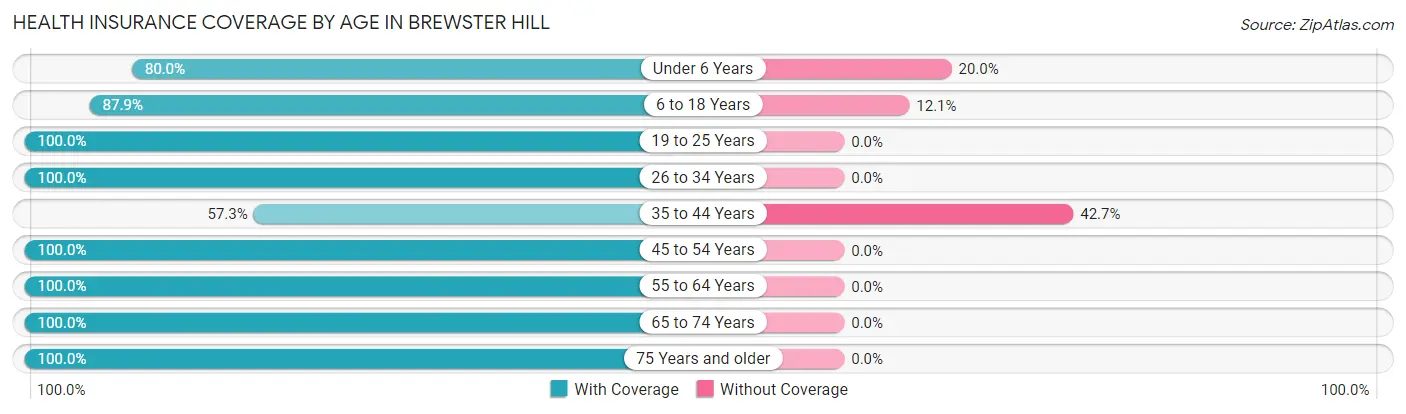
| Age Bracket | With Coverage | Without Coverage |
| Under 6 Years | 160 (80.0%) | 40 (20.0%) |
| 6 to 18 Years | 297 (87.9%) | 41 (12.1%) |
| 19 to 25 Years | 92 (100.0%) | 0 (0.0%) |
| 26 to 34 Years | 345 (100.0%) | 0 (0.0%) |
| 35 to 44 Years | 212 (57.3%) | 158 (42.7%) |
| 45 to 54 Years | 361 (100.0%) | 0 (0.0%) |
| 55 to 64 Years | 327 (100.0%) | 0 (0.0%) |
| 65 to 74 Years | 408 (100.0%) | 0 (0.0%) |
| 75 Years and older | 127 (100.0%) | 0 (0.0%) |
| Total | 2,329 (90.7%) | 239 (9.3%) |
Health Insurance Coverage by Citizenship Status in Brewster Hill
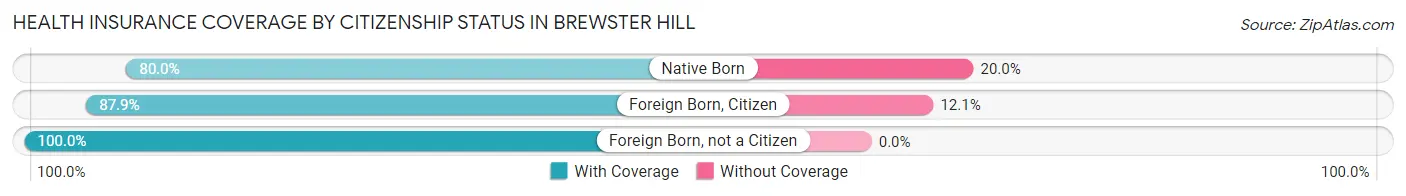
| Citizenship Status | With Coverage | Without Coverage |
| Native Born | 160 (80.0%) | 40 (20.0%) |
| Foreign Born, Citizen | 297 (87.9%) | 41 (12.1%) |
| Foreign Born, not a Citizen | 92 (100.0%) | 0 (0.0%) |
Health Insurance Coverage by Household Income in Brewster Hill
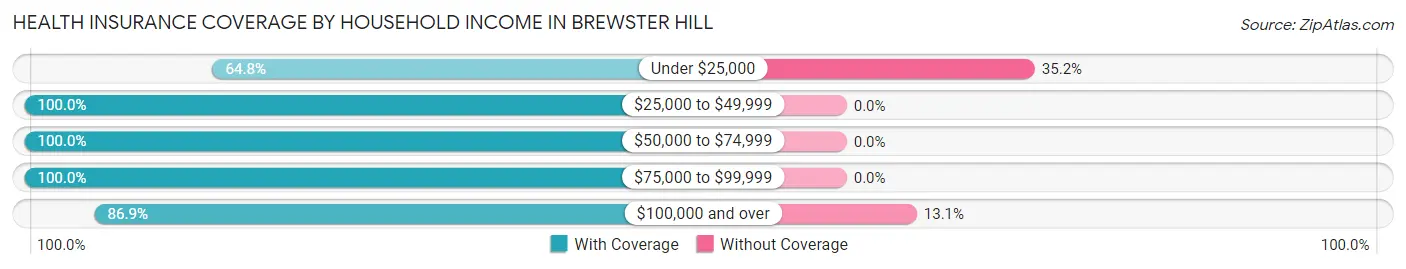
| Household Income | With Coverage | Without Coverage |
| Under $25,000 | 147 (64.8%) | 80 (35.2%) |
| $25,000 to $49,999 | 151 (100.0%) | 0 (0.0%) |
| $50,000 to $74,999 | 586 (100.0%) | 0 (0.0%) |
| $75,000 to $99,999 | 393 (100.0%) | 0 (0.0%) |
| $100,000 and over | 1,052 (86.9%) | 159 (13.1%) |
Public vs Private Health Insurance Coverage by Age in Brewster Hill
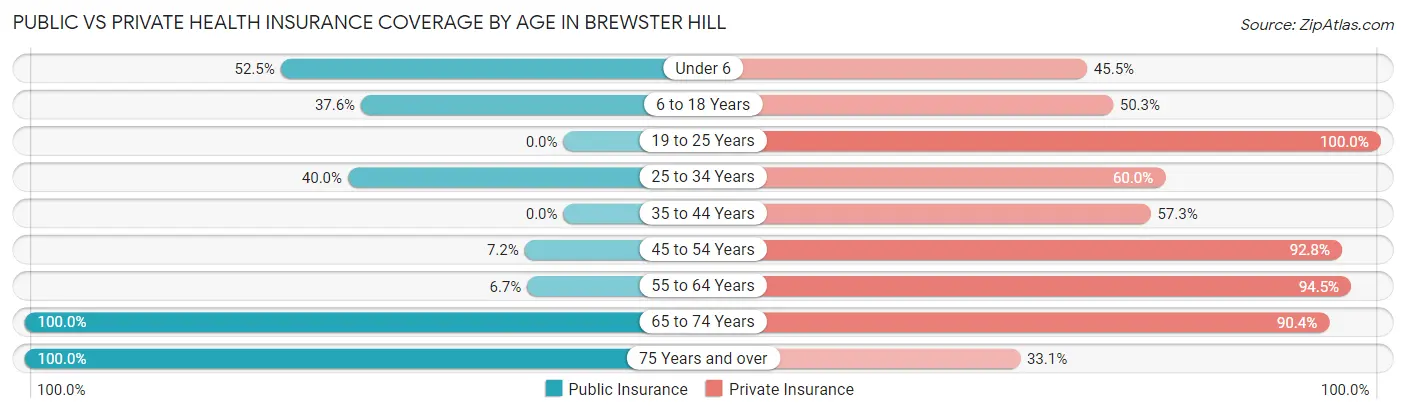
| Age Bracket | Public Insurance | Private Insurance |
| Under 6 | 105 (52.5%) | 91 (45.5%) |
| 6 to 18 Years | 127 (37.6%) | 170 (50.3%) |
| 19 to 25 Years | 0 (0.0%) | 92 (100.0%) |
| 25 to 34 Years | 138 (40.0%) | 207 (60.0%) |
| 35 to 44 Years | 0 (0.0%) | 212 (57.3%) |
| 45 to 54 Years | 26 (7.2%) | 335 (92.8%) |
| 55 to 64 Years | 22 (6.7%) | 309 (94.5%) |
| 65 to 74 Years | 408 (100.0%) | 369 (90.4%) |
| 75 Years and over | 127 (100.0%) | 42 (33.1%) |
| Total | 953 (37.1%) | 1,827 (71.1%) |
Disability Status by Sex by Age in Brewster Hill
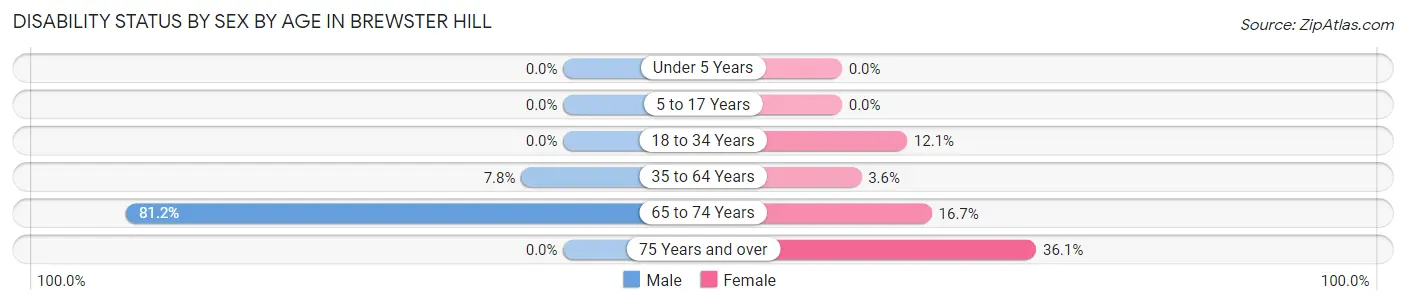
| Age Bracket | Male | Female |
| Under 5 Years | 0 (0.0%) | 0 (0.0%) |
| 5 to 17 Years | 0 (0.0%) | 0 (0.0%) |
| 18 to 34 Years | 0 (0.0%) | 22 (12.1%) |
| 35 to 64 Years | 48 (7.8%) | 16 (3.6%) |
| 65 to 74 Years | 151 (81.2%) | 37 (16.7%) |
| 75 Years and over | 0 (0.0%) | 31 (36.0%) |
Disability Class by Sex by Age in Brewster Hill
Disability Class: Hearing Difficulty
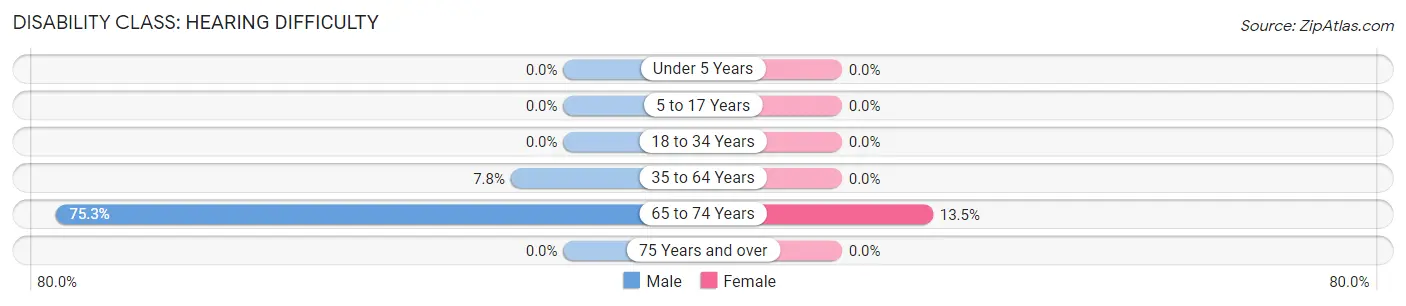
| Age Bracket | Male | Female |
| Under 5 Years | 0 (0.0%) | 0 (0.0%) |
| 5 to 17 Years | 0 (0.0%) | 0 (0.0%) |
| 18 to 34 Years | 0 (0.0%) | 0 (0.0%) |
| 35 to 64 Years | 48 (7.8%) | 0 (0.0%) |
| 65 to 74 Years | 140 (75.3%) | 30 (13.5%) |
| 75 Years and over | 0 (0.0%) | 0 (0.0%) |
Disability Class: Vision Difficulty
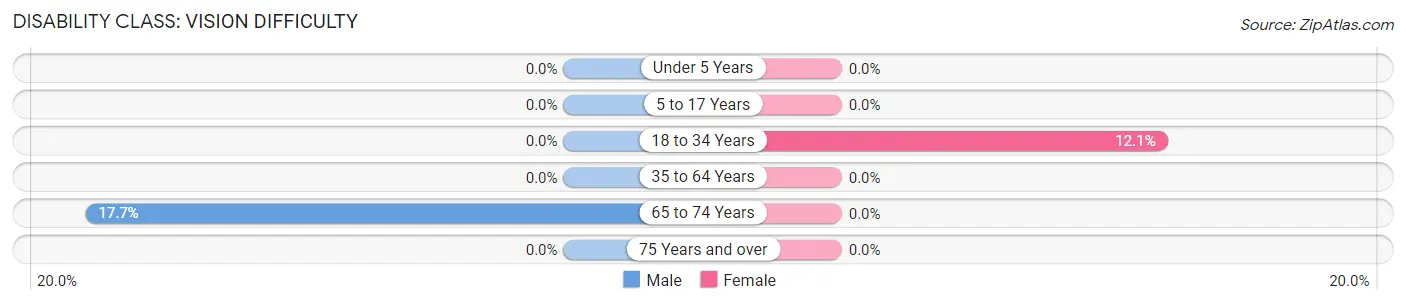
| Age Bracket | Male | Female |
| Under 5 Years | 0 (0.0%) | 0 (0.0%) |
| 5 to 17 Years | 0 (0.0%) | 0 (0.0%) |
| 18 to 34 Years | 0 (0.0%) | 22 (12.1%) |
| 35 to 64 Years | 0 (0.0%) | 0 (0.0%) |
| 65 to 74 Years | 33 (17.7%) | 0 (0.0%) |
| 75 Years and over | 0 (0.0%) | 0 (0.0%) |
Disability Class: Cognitive Difficulty
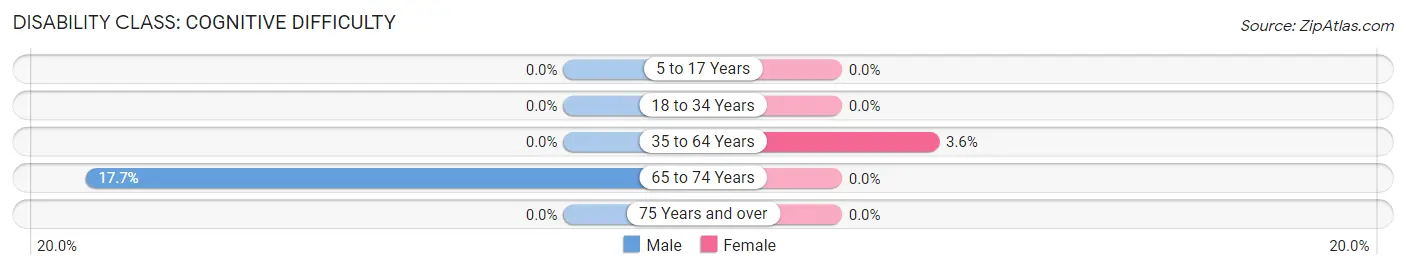
| Age Bracket | Male | Female |
| 5 to 17 Years | 0 (0.0%) | 0 (0.0%) |
| 18 to 34 Years | 0 (0.0%) | 0 (0.0%) |
| 35 to 64 Years | 0 (0.0%) | 16 (3.6%) |
| 65 to 74 Years | 33 (17.7%) | 0 (0.0%) |
| 75 Years and over | 0 (0.0%) | 0 (0.0%) |
Disability Class: Ambulatory Difficulty
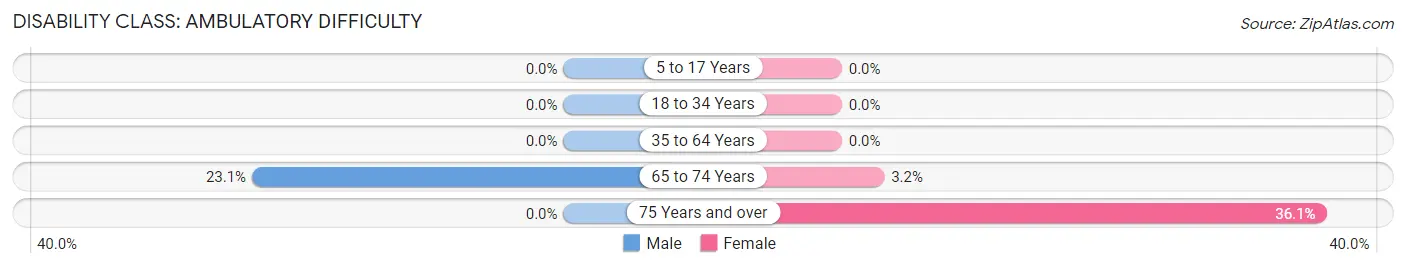
| Age Bracket | Male | Female |
| 5 to 17 Years | 0 (0.0%) | 0 (0.0%) |
| 18 to 34 Years | 0 (0.0%) | 0 (0.0%) |
| 35 to 64 Years | 0 (0.0%) | 0 (0.0%) |
| 65 to 74 Years | 43 (23.1%) | 7 (3.2%) |
| 75 Years and over | 0 (0.0%) | 31 (36.0%) |
Disability Class: Self-Care Difficulty
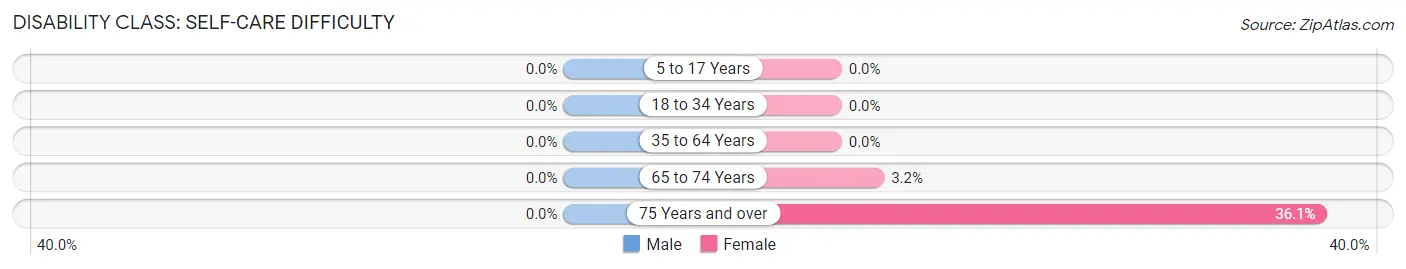
| Age Bracket | Male | Female |
| 5 to 17 Years | 0 (0.0%) | 0 (0.0%) |
| 18 to 34 Years | 0 (0.0%) | 0 (0.0%) |
| 35 to 64 Years | 0 (0.0%) | 0 (0.0%) |
| 65 to 74 Years | 0 (0.0%) | 7 (3.2%) |
| 75 Years and over | 0 (0.0%) | 31 (36.0%) |
Technology Access in Brewster Hill
Computing Device Access in Brewster Hill
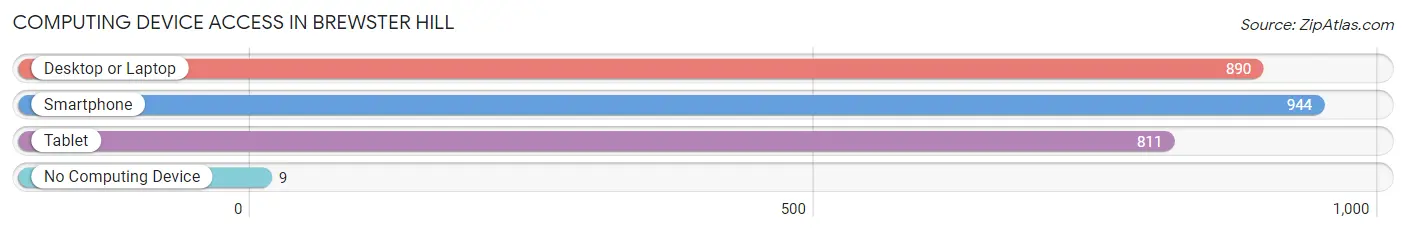
| Device Type | # Households | % Households |
| Desktop or Laptop | 890 | 86.5% |
| Smartphone | 944 | 91.7% |
| Tablet | 811 | 78.8% |
| No Computing Device | 9 | 0.9% |
| Total | 1,029 | 100.0% |
Internet Access in Brewster Hill
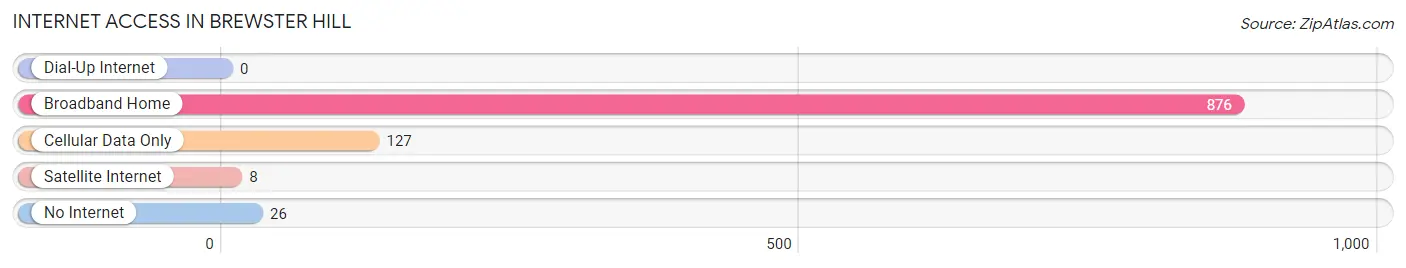
| Internet Type | # Households | % Households |
| Dial-Up Internet | 0 | 0.0% |
| Broadband Home | 876 | 85.1% |
| Cellular Data Only | 127 | 12.3% |
| Satellite Internet | 8 | 0.8% |
| No Internet | 26 | 2.5% |
| Total | 1,029 | 100.0% |
Brewster Hill Summary
Brewster Hill is a hamlet located in the town of Southeast in Putnam County, New York. It is situated on the east side of the Hudson River, about 40 miles north of New York City. The hamlet is bordered by the towns of Patterson and Carmel to the north, and the towns of Kent and Putnam Valley to the south.
History
Brewster Hill was first settled in the late 1700s by the Brewster family, who were among the first settlers in the area. The hamlet was named after the family, and the area was known as Brewster Hill by the early 1800s. The hamlet was a small farming community until the mid-1800s, when the railroad was built through the area. This allowed for the development of the hamlet, and it soon became a popular summer resort destination.
In the late 1800s, Brewster Hill was home to several large estates, including the Brewster Estate, which was owned by the family until the early 1900s. The estate was later sold to the state of New York, and it is now part of the Fahnestock State Park.
Geography
Brewster Hill is located in the southeastern corner of Putnam County, New York. It is situated on the east side of the Hudson River, about 40 miles north of New York City. The hamlet is bordered by the towns of Patterson and Carmel to the north, and the towns of Kent and Putnam Valley to the south.
The terrain of Brewster Hill is mostly hilly, with some flat areas. The hamlet is located in the Hudson Valley region, and is surrounded by forests and rolling hills. The area is known for its scenic views of the Hudson River and the surrounding countryside.
Economy
Brewster Hill is a small, rural community with a limited economy. The hamlet is home to several small businesses, including a few restaurants, a grocery store, and a few other retail stores. The hamlet is also home to a few small farms, which produce a variety of fruits and vegetables.
The hamlet is also home to a few small manufacturing companies, which produce a variety of products, including furniture, clothing, and electronics. The hamlet is also home to a few small technology companies, which provide services to businesses in the area.
Demographics
As of the 2010 census, the population of Brewster Hill was 1,845. The population is mostly white (94.3%), with a small percentage of African Americans (2.2%), Asians (1.2%), and other races (2.3%). The median household income in the hamlet is $63,750, and the median home value is $310,000.
The majority of the population (90.3%) is over the age of 18, and the median age is 43. The hamlet is home to a few schools, including Brewster Hill Elementary School and Brewster Hill High School. The hamlet is also home to a few churches, including the Brewster Hill United Methodist Church and the Brewster Hill Presbyterian Church.
Common Questions
What is Per Capita Income in Brewster Hill?
Per Capita income in Brewster Hill is $39,288.
What is the Median Family Income in Brewster Hill?
Median Family Income in Brewster Hill is $97,997.
What is the Median Household income in Brewster Hill?
Median Household Income in Brewster Hill is $89,967.
What is Income or Wage Gap in Brewster Hill?
Income or Wage Gap in Brewster Hill is 5.4%.
Women in Brewster Hill earn 94.6 cents for every dollar earned by a man.
What is Inequality or Gini Index in Brewster Hill?
Inequality or Gini Index in Brewster Hill is 0.38.
What is the Total Population of Brewster Hill?
Total Population of Brewster Hill is 2,568.
What is the Total Male Population of Brewster Hill?
Total Male Population of Brewster Hill is 1,336.
What is the Total Female Population of Brewster Hill?
Total Female Population of Brewster Hill is 1,232.
What is the Ratio of Males per 100 Females in Brewster Hill?
There are 108.44 Males per 100 Females in Brewster Hill.
What is the Ratio of Females per 100 Males in Brewster Hill?
There are 92.22 Females per 100 Males in Brewster Hill.
What is the Median Population Age in Brewster Hill?
Median Population Age in Brewster Hill is 43.1 Years.
What is the Average Family Size in Brewster Hill
Average Family Size in Brewster Hill is 2.8 People.
What is the Average Household Size in Brewster Hill
Average Household Size in Brewster Hill is 2.5 People.
How Large is the Labor Force in Brewster Hill?
There are 1,264 People in the Labor Forcein in Brewster Hill.
What is the Percentage of People in the Labor Force in Brewster Hill?
61.4% of People are in the Labor Force in Brewster Hill.
What is the Unemployment Rate in Brewster Hill?
Unemployment Rate in Brewster Hill is 5.9%.