Mooers, NY Map & Demographics
Mooers Map
Mooers Overview
$20,294
PER CAPITA INCOME
$65,800
AVG FAMILY INCOME
$59,886
AVG HOUSEHOLD INCOME
0.28
INEQUALITY / GINI INDEX
524
TOTAL POPULATION
342
MALE POPULATION
182
FEMALE POPULATION
187.91
MALES / 100 FEMALES
53.22
FEMALES / 100 MALES
34.5
MEDIAN AGE
3.6
AVG FAMILY SIZE
3.5
AVG HOUSEHOLD SIZE
271
LABOR FORCE [ PEOPLE ]
64.2%
PERCENT IN LABOR FORCE
11.4%
UNEMPLOYMENT RATE
Mooers Zip Codes
Mooers Area Codes
Income in Mooers
Income Overview in Mooers
Per Capita Income in Mooers is $20,294, while median incomes of families and households are $65,800 and $59,886 respectively.
| Characteristic | Number | Measure |
| Per Capita Income | 524 | $20,294 |
| Median Family Income | 132 | $65,800 |
| Mean Family Income | 132 | $72,940 |
| Median Household Income | 151 | $59,886 |
| Mean Household Income | 151 | $73,280 |
| Income Deficit | 132 | $0 |
| Wage / Income Gap (%) | 524 | 0.00% |
| Wage / Income Gap ($) | 524 | 100.00¢ per $1 |
| Gini / Inequality Index | 524 | 0.28 |
Earnings by Sex in Mooers
| Sex | Number | Average Earnings |
| Male | 193 (66.5%) | $0 |
| Female | 97 (33.5%) | $0 |
| Total | 290 (100.0%) | $0 |
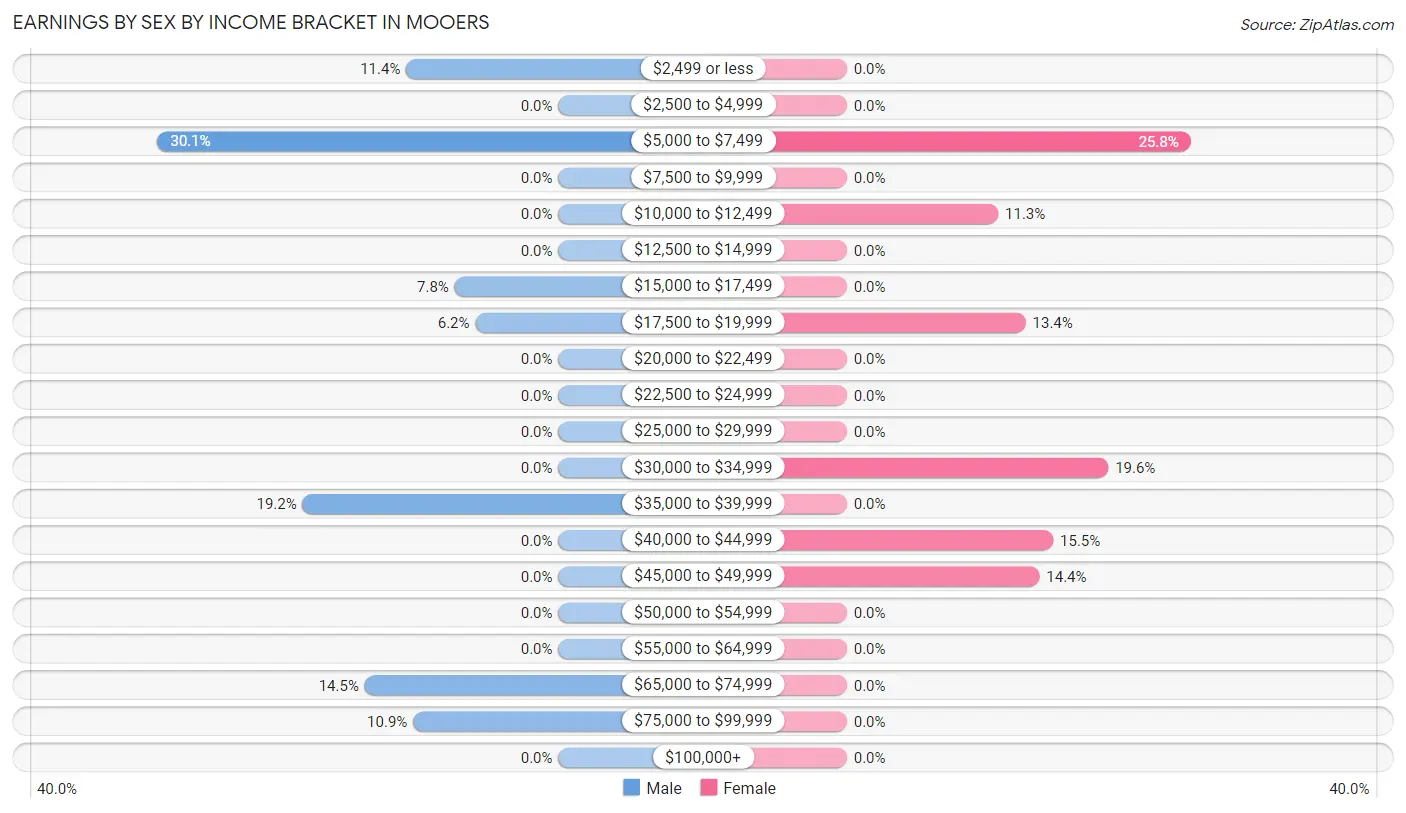
Earnings by Sex by Income Bracket in Mooers
The most common earnings brackets in Mooers are $5,000 to $7,499 for men (58 | 30.0%) and $5,000 to $7,499 for women (25 | 25.8%).
| Income | Male | Female |
| $2,499 or less | 22 (11.4%) | 0 (0.0%) |
| $2,500 to $4,999 | 0 (0.0%) | 0 (0.0%) |
| $5,000 to $7,499 | 58 (30.0%) | 25 (25.8%) |
| $7,500 to $9,999 | 0 (0.0%) | 0 (0.0%) |
| $10,000 to $12,499 | 0 (0.0%) | 11 (11.3%) |
| $12,500 to $14,999 | 0 (0.0%) | 0 (0.0%) |
| $15,000 to $17,499 | 15 (7.8%) | 0 (0.0%) |
| $17,500 to $19,999 | 12 (6.2%) | 13 (13.4%) |
| $20,000 to $22,499 | 0 (0.0%) | 0 (0.0%) |
| $22,500 to $24,999 | 0 (0.0%) | 0 (0.0%) |
| $25,000 to $29,999 | 0 (0.0%) | 0 (0.0%) |
| $30,000 to $34,999 | 0 (0.0%) | 19 (19.6%) |
| $35,000 to $39,999 | 37 (19.2%) | 0 (0.0%) |
| $40,000 to $44,999 | 0 (0.0%) | 15 (15.5%) |
| $45,000 to $49,999 | 0 (0.0%) | 14 (14.4%) |
| $50,000 to $54,999 | 0 (0.0%) | 0 (0.0%) |
| $55,000 to $64,999 | 0 (0.0%) | 0 (0.0%) |
| $65,000 to $74,999 | 28 (14.5%) | 0 (0.0%) |
| $75,000 to $99,999 | 21 (10.9%) | 0 (0.0%) |
| $100,000+ | 0 (0.0%) | 0 (0.0%) |
| Total | 193 (100.0%) | 97 (100.0%) |
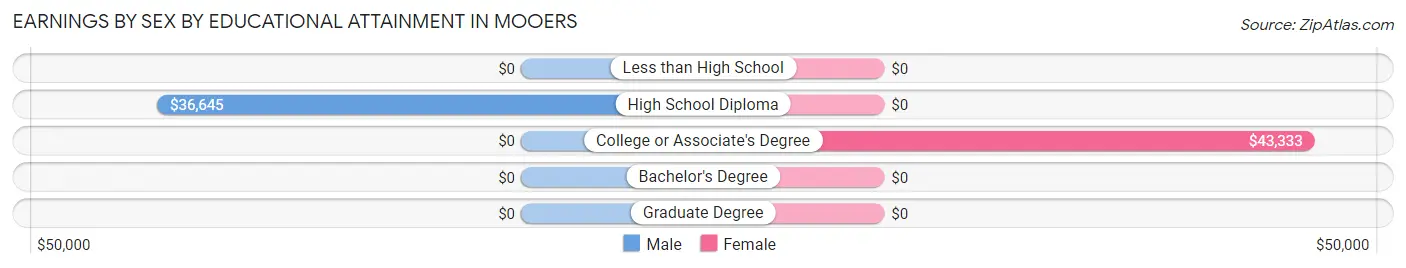
Earnings by Sex by Educational Attainment in Mooers
| Educational Attainment | Male Income | Female Income |
| Less than High School | - | - |
| High School Diploma | $36,645 | $0 |
| College or Associate's Degree | - | - |
| Bachelor's Degree | - | - |
| Graduate Degree | - | - |
| Total | $38,958 | $0 |
Family Income in Mooers
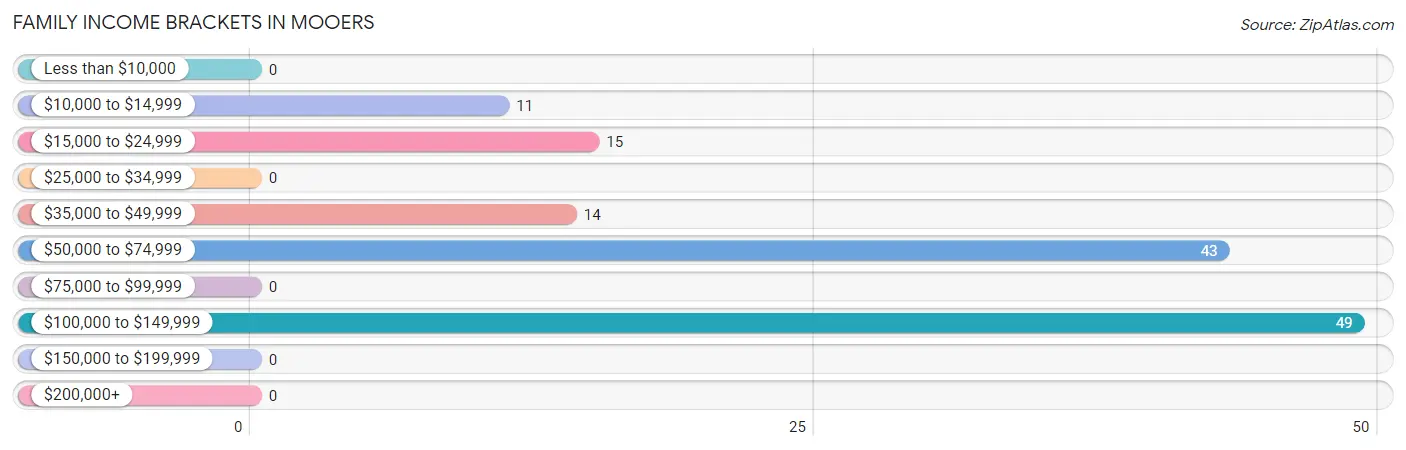
Family Income Brackets in Mooers
According to the Mooers family income data, there are 49 families falling into the $100,000 to $149,999 income range, which is the most common income bracket and makes up 37.1% of all families.
| Income Bracket | # Families | % Families |
| Less than $10,000 | 0 | 0.0% |
| $10,000 to $14,999 | 11 | 8.3% |
| $15,000 to $24,999 | 15 | 11.4% |
| $25,000 to $34,999 | 0 | 0.0% |
| $35,000 to $49,999 | 14 | 10.6% |
| $50,000 to $74,999 | 43 | 32.6% |
| $75,000 to $99,999 | 0 | 0.0% |
| $100,000 to $149,999 | 49 | 37.1% |
| $150,000 to $199,999 | 0 | 0.0% |
| $200,000+ | 0 | 0.0% |
Family Income by Famaliy Size in Mooers
| Income Bracket | # Families | Median Income |
| 2-Person Families | 57 (43.2%) | $0 |
| 3-Person Families | 11 (8.3%) | $0 |
| 4-Person Families | 18 (13.6%) | $0 |
| 5-Person Families | 21 (15.9%) | $0 |
| 6-Person Families | 25 (18.9%) | $0 |
| 7+ Person Families | 0 (0.0%) | $0 |
| Total | 132 (100.0%) | $65,800 |
Family Income by Number of Earners in Mooers
| Number of Earners | # Families | Median Income |
| No Earners | 0 (0.0%) | $0 |
| 1 Earner | 68 (51.5%) | $0 |
| 2 Earners | 43 (32.6%) | $0 |
| 3+ Earners | 21 (15.9%) | $0 |
| Total | 132 (100.0%) | $65,800 |
Household Income in Mooers
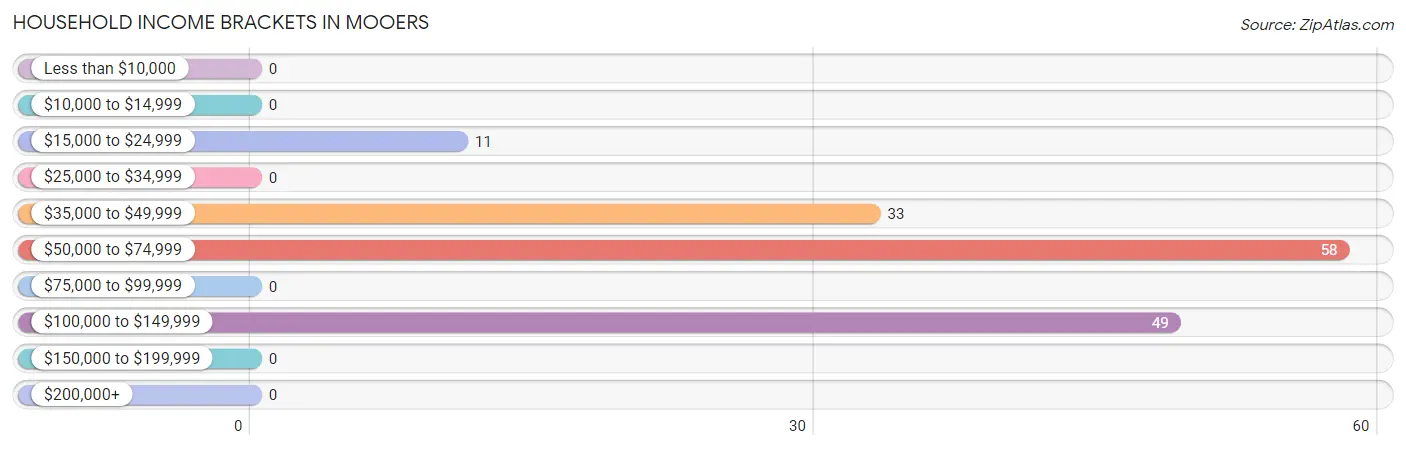
Household Income Brackets in Mooers
With 58 households falling in the category, the $50,000 to $74,999 income range is the most frequent in Mooers, accounting for 38.4% of all households.
| Income Bracket | # Households | % Households |
| Less than $10,000 | 0 | 0.0% |
| $10,000 to $14,999 | 0 | 0.0% |
| $15,000 to $24,999 | 11 | 7.3% |
| $25,000 to $34,999 | 0 | 0.0% |
| $35,000 to $49,999 | 33 | 21.9% |
| $50,000 to $74,999 | 58 | 38.4% |
| $75,000 to $99,999 | 0 | 0.0% |
| $100,000 to $149,999 | 49 | 32.5% |
| $150,000 to $199,999 | 0 | 0.0% |
| $200,000+ | 0 | 0.0% |
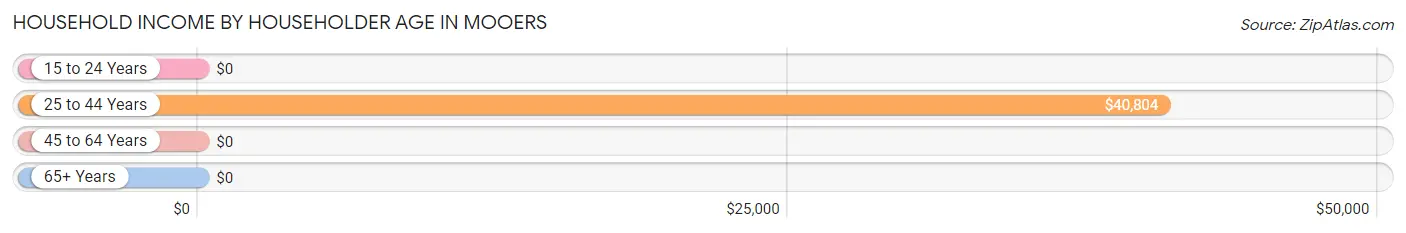
Household Income by Householder Age in Mooers
The median household income in Mooers is $59,886, with the highest median household income of $40,804 found in the 25 to 44 years age bracket for the primary householder. A total of 69 households (45.7%) fall into this category.
| Income Bracket | # Households | Median Income |
| 15 to 24 Years | 0 (0.0%) | $0 |
| 25 to 44 Years | 69 (45.7%) | $40,804 |
| 45 to 64 Years | 54 (35.8%) | $0 |
| 65+ Years | 28 (18.5%) | $0 |
| Total | 151 (100.0%) | $59,886 |
Poverty in Mooers
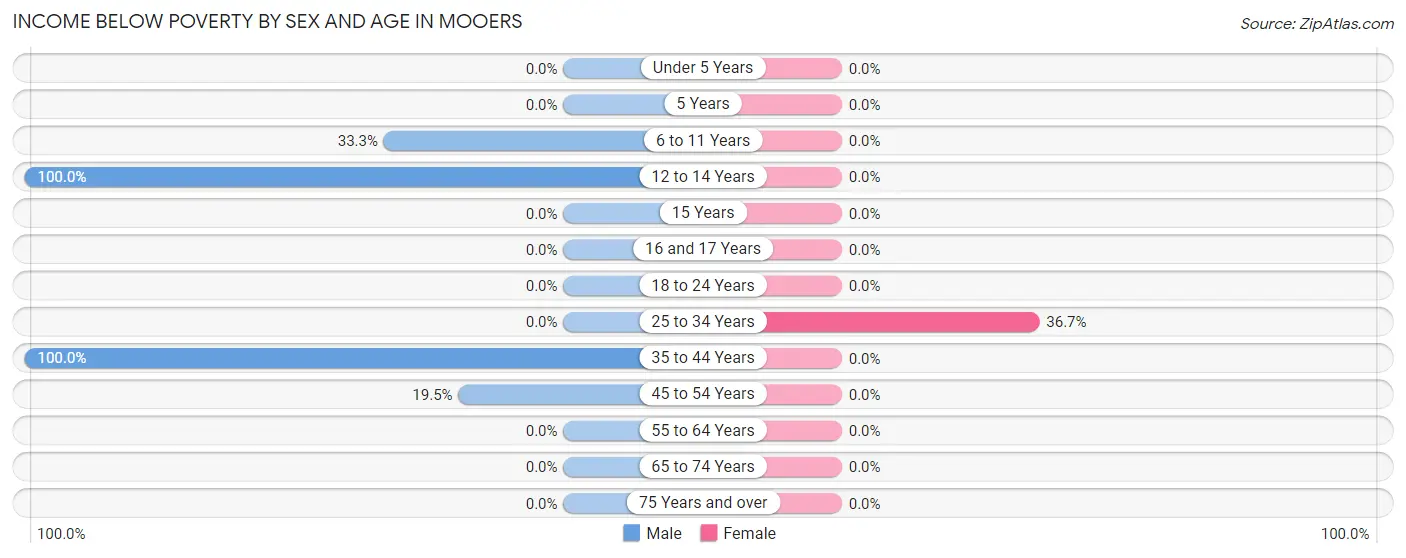
Income Below Poverty by Sex and Age in Mooers
With 18.4% poverty level for males and 6.0% for females among the residents of Mooers, 12 to 14 year old males and 25 to 34 year old females are the most vulnerable to poverty, with 25 males (100.0%) and 11 females (36.7%) in their respective age groups living below the poverty level.
| Age Bracket | Male | Female |
| Under 5 Years | 0 (0.0%) | 0 (0.0%) |
| 5 Years | 0 (0.0%) | 0 (0.0%) |
| 6 to 11 Years | 11 (33.3%) | 0 (0.0%) |
| 12 to 14 Years | 25 (100.0%) | 0 (0.0%) |
| 15 Years | 0 (0.0%) | 0 (0.0%) |
| 16 and 17 Years | 0 (0.0%) | 0 (0.0%) |
| 18 to 24 Years | 0 (0.0%) | 0 (0.0%) |
| 25 to 34 Years | 0 (0.0%) | 11 (36.7%) |
| 35 to 44 Years | 12 (100.0%) | 0 (0.0%) |
| 45 to 54 Years | 15 (19.5%) | 0 (0.0%) |
| 55 to 64 Years | 0 (0.0%) | 0 (0.0%) |
| 65 to 74 Years | 0 (0.0%) | 0 (0.0%) |
| 75 Years and over | 0 (0.0%) | 0 (0.0%) |
| Total | 63 (18.4%) | 11 (6.0%) |
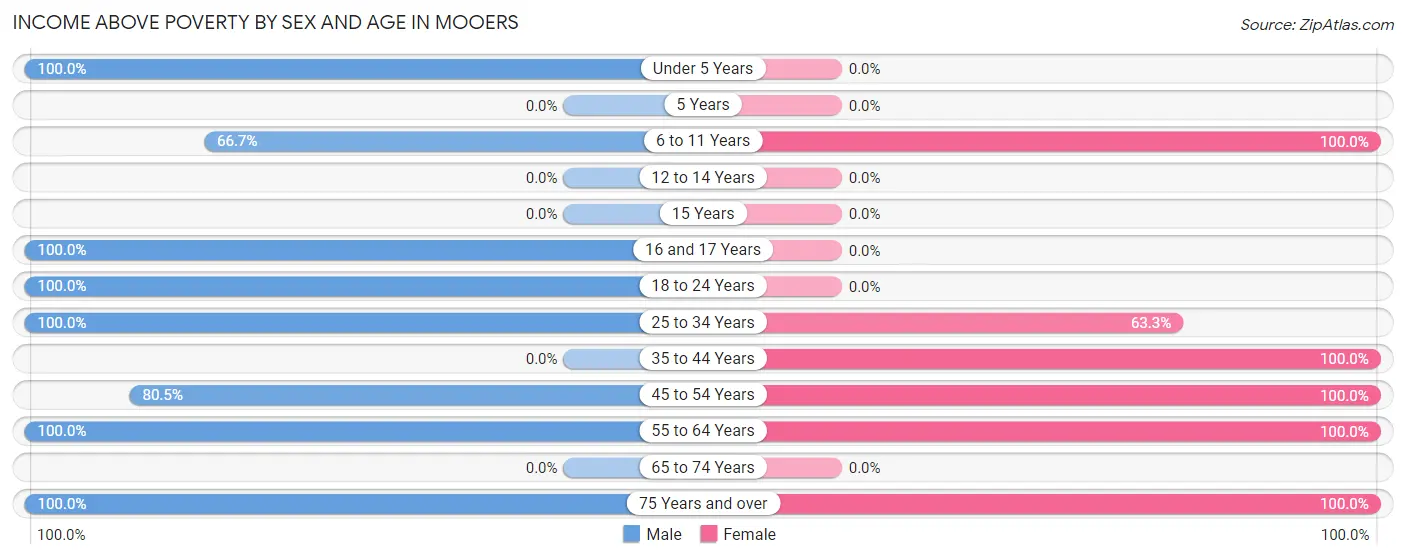
Income Above Poverty by Sex and Age in Mooers
According to the poverty statistics in Mooers, males aged under 5 years and females aged 6 to 11 years are the age groups that are most secure financially, with 100.0% of males and 100.0% of females in these age groups living above the poverty line.
| Age Bracket | Male | Female |
| Under 5 Years | 25 (100.0%) | 0 (0.0%) |
| 5 Years | 0 (0.0%) | 0 (0.0%) |
| 6 to 11 Years | 22 (66.7%) | 19 (100.0%) |
| 12 to 14 Years | 0 (0.0%) | 0 (0.0%) |
| 15 Years | 0 (0.0%) | 0 (0.0%) |
| 16 and 17 Years | 22 (100.0%) | 0 (0.0%) |
| 18 to 24 Years | 89 (100.0%) | 0 (0.0%) |
| 25 to 34 Years | 19 (100.0%) | 19 (63.3%) |
| 35 to 44 Years | 0 (0.0%) | 67 (100.0%) |
| 45 to 54 Years | 62 (80.5%) | 14 (100.0%) |
| 55 to 64 Years | 12 (100.0%) | 16 (100.0%) |
| 65 to 74 Years | 0 (0.0%) | 0 (0.0%) |
| 75 Years and over | 28 (100.0%) | 36 (100.0%) |
| Total | 279 (81.6%) | 171 (94.0%) |
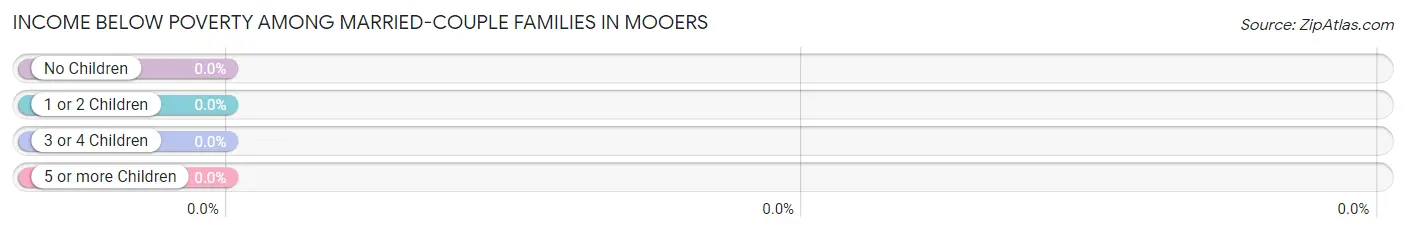
Income Below Poverty Among Married-Couple Families in Mooers
| Children | Above Poverty | Below Poverty |
| No Children | 42 (100.0%) | 0 (0.0%) |
| 1 or 2 Children | 64 (100.0%) | 0 (0.0%) |
| 3 or 4 Children | 0 (0.0%) | 0 (0.0%) |
| 5 or more Children | 0 (0.0%) | 0 (0.0%) |
| Total | 106 (100.0%) | 0 (0.0%) |
Income Below Poverty Among Single-Parent Households in Mooers
According to the poverty data in Mooers, 100.0% or 15 single-father households and 100.0% or 11 single-mother households are living below the poverty line. Among single-father households, those with 1 or 2 children have the highest poverty rate, with 15 households (100.0%) experiencing poverty. Likewise, among single-mother households, those with 1 or 2 children have the highest poverty rate, with 11 households (100.0%) falling below the poverty line.
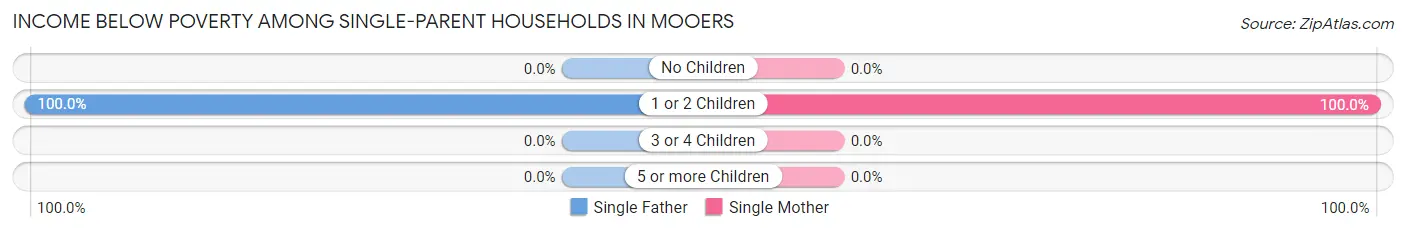
| Children | Single Father | Single Mother |
| No Children | 0 (0.0%) | 0 (0.0%) |
| 1 or 2 Children | 15 (100.0%) | 11 (100.0%) |
| 3 or 4 Children | 0 (0.0%) | 0 (0.0%) |
| 5 or more Children | 0 (0.0%) | 0 (0.0%) |
| Total | 15 (100.0%) | 11 (100.0%) |
Income Below Poverty Among Married-Couple vs Single-Parent Households in Mooers
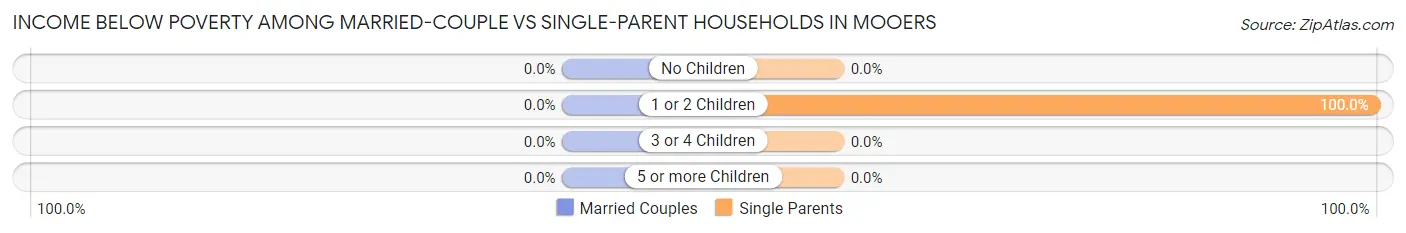
| Children | Married-Couple Families | Single-Parent Households |
| No Children | 0 (0.0%) | 0 (0.0%) |
| 1 or 2 Children | 0 (0.0%) | 26 (100.0%) |
| 3 or 4 Children | 0 (0.0%) | 0 (0.0%) |
| 5 or more Children | 0 (0.0%) | 0 (0.0%) |
| Total | 0 (0.0%) | 26 (100.0%) |
Race in Mooers
The most populous races in Mooers are , and White / Caucasian (524 | 100.0%).
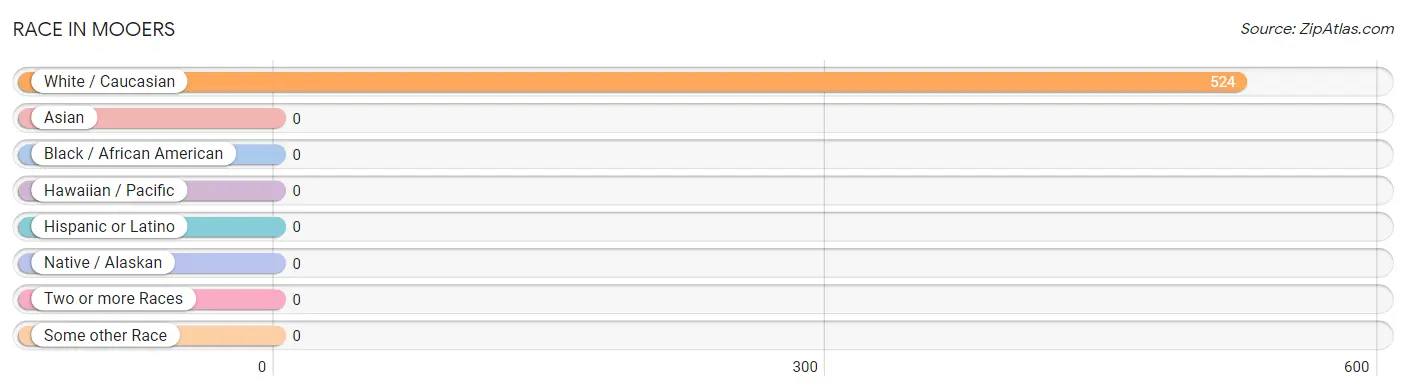
| Race | # Population | % Population |
| Asian | 0 | 0.0% |
| Black / African American | 0 | 0.0% |
| Hawaiian / Pacific | 0 | 0.0% |
| Hispanic or Latino | 0 | 0.0% |
| Native / Alaskan | 0 | 0.0% |
| White / Caucasian | 524 | 100.0% |
| Two or more Races | 0 | 0.0% |
| Some other Race | 0 | 0.0% |
| Total | 524 | 100.0% |
Ancestry in Mooers
The most populous ancestries reported in Mooers are American (44 | 8.4%), French (36 | 6.9%), German (36 | 6.9%), Irish (28 | 5.3%), and Welsh (28 | 5.3%), together accounting for 32.8% of all Mooers residents.
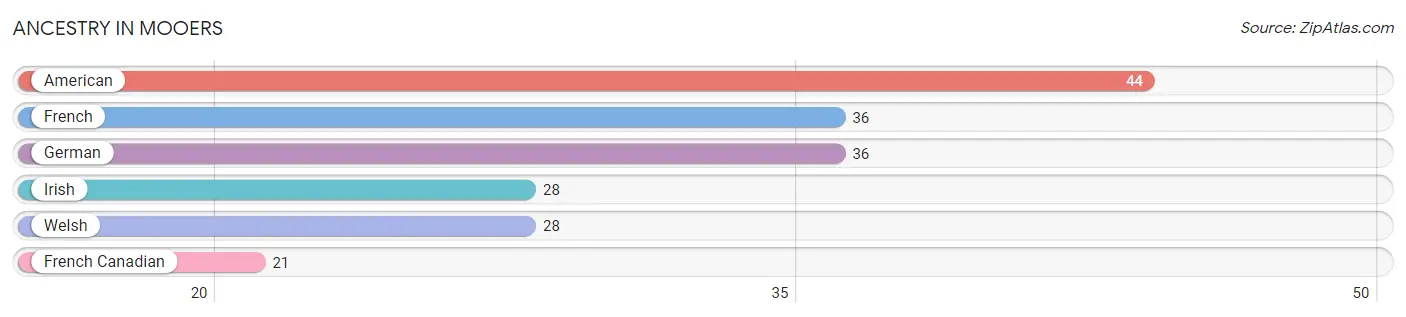
| Ancestry | # Population | % Population |
| American | 44 | 8.4% |
| French | 36 | 6.9% |
| French Canadian | 21 | 4.0% |
| German | 36 | 6.9% |
| Irish | 28 | 5.3% |
| Welsh | 28 | 5.3% | View All 6 Rows |
Immigrants in Mooers

| Immigration Origin | # Population | % Population | View All 0 Rows |
Sex and Age in Mooers
Sex and Age in Mooers
The most populous age groups in Mooers are 20 to 24 Years (89 | 26.0%) for men and 40 to 44 Years (39 | 21.4%) for women.
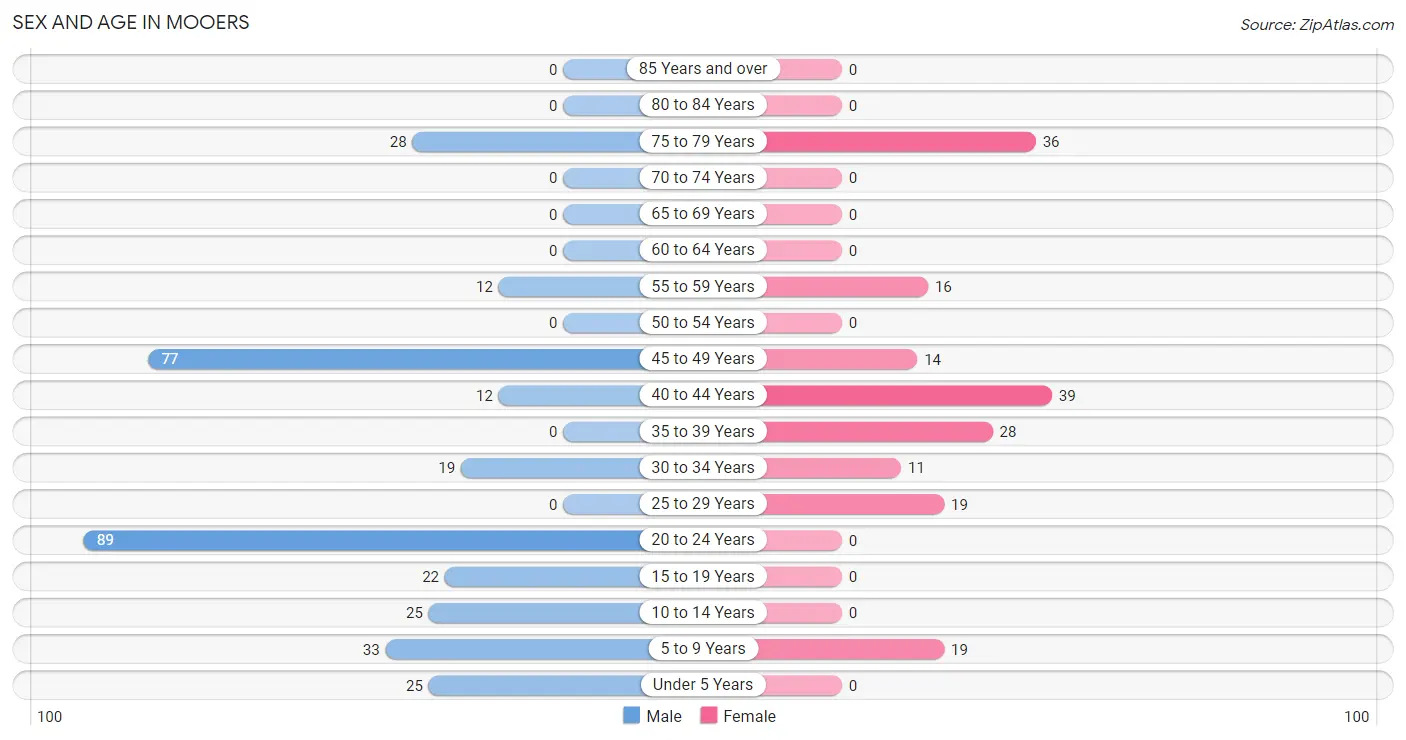
| Age Bracket | Male | Female |
| Under 5 Years | 25 (7.3%) | 0 (0.0%) |
| 5 to 9 Years | 33 (9.7%) | 19 (10.4%) |
| 10 to 14 Years | 25 (7.3%) | 0 (0.0%) |
| 15 to 19 Years | 22 (6.4%) | 0 (0.0%) |
| 20 to 24 Years | 89 (26.0%) | 0 (0.0%) |
| 25 to 29 Years | 0 (0.0%) | 19 (10.4%) |
| 30 to 34 Years | 19 (5.6%) | 11 (6.0%) |
| 35 to 39 Years | 0 (0.0%) | 28 (15.4%) |
| 40 to 44 Years | 12 (3.5%) | 39 (21.4%) |
| 45 to 49 Years | 77 (22.5%) | 14 (7.7%) |
| 50 to 54 Years | 0 (0.0%) | 0 (0.0%) |
| 55 to 59 Years | 12 (3.5%) | 16 (8.8%) |
| 60 to 64 Years | 0 (0.0%) | 0 (0.0%) |
| 65 to 69 Years | 0 (0.0%) | 0 (0.0%) |
| 70 to 74 Years | 0 (0.0%) | 0 (0.0%) |
| 75 to 79 Years | 28 (8.2%) | 36 (19.8%) |
| 80 to 84 Years | 0 (0.0%) | 0 (0.0%) |
| 85 Years and over | 0 (0.0%) | 0 (0.0%) |
| Total | 342 (100.0%) | 182 (100.0%) |
Families and Households in Mooers
Median Family Size in Mooers
The median family size in Mooers is 3.62 persons per family, with married-couple families (106 | 80.3%) accounting for the largest median family size of 3.92 persons per family. On the other hand, single male/father families (15 | 11.4%) represent the smallest median family size with 1.93 persons per family.
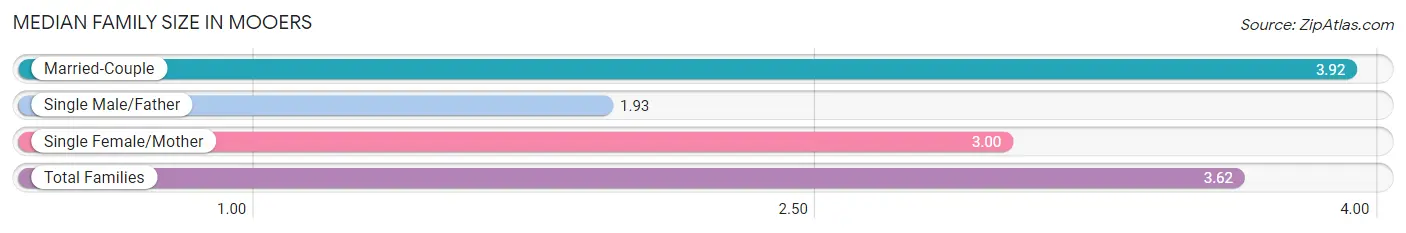
| Family Type | # Families | Family Size |
| Married-Couple | 106 (80.3%) | 3.92 |
| Single Male/Father | 15 (11.4%) | 1.93 |
| Single Female/Mother | 11 (8.3%) | 3.00 |
| Total Families | 132 (100.0%) | 3.62 |
Median Household Size in Mooers
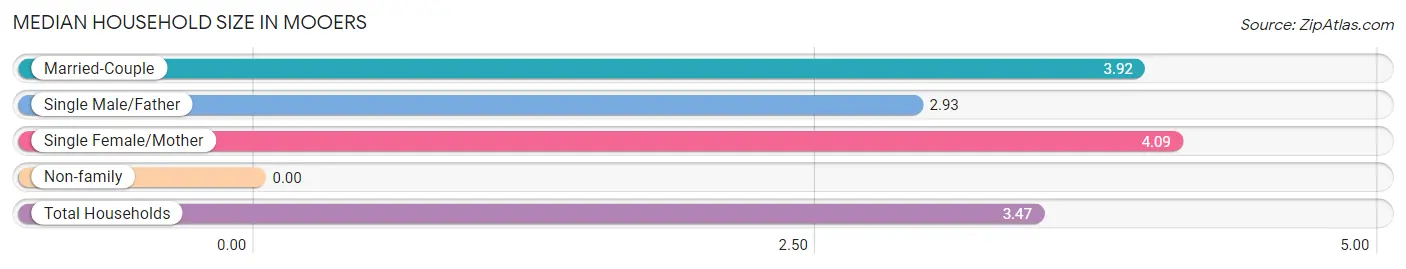
| Household Type | # Households | Household Size |
| Married-Couple | 106 (70.2%) | 3.92 |
| Single Male/Father | 15 (9.9%) | 2.93 |
| Single Female/Mother | 11 (7.3%) | 4.09 |
| Non-family | 19 (12.6%) | - |
| Total Households | 151 (100.0%) | 3.47 |
Household Size by Marriage Status in Mooers
Out of a total of 151 households in Mooers, 132 (87.4%) are family households, while 19 (12.6%) are nonfamily households. The most numerous type of family households are 2-person households, comprising 42, and the most common type of nonfamily households are 1-person households, comprising 19.
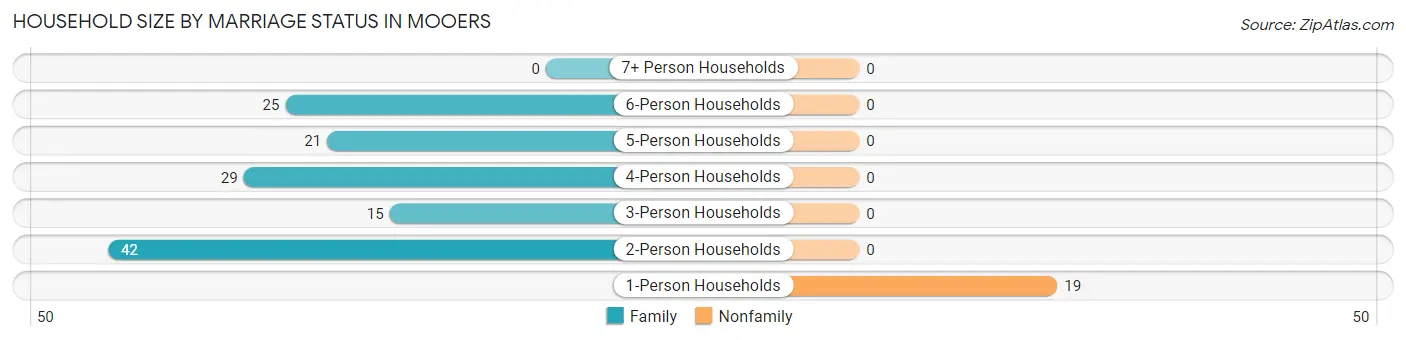
| Household Size | Family Households | Nonfamily Households |
| 1-Person Households | - | 19 (12.6%) |
| 2-Person Households | 42 (27.8%) | 0 (0.0%) |
| 3-Person Households | 15 (9.9%) | 0 (0.0%) |
| 4-Person Households | 29 (19.2%) | 0 (0.0%) |
| 5-Person Households | 21 (13.9%) | 0 (0.0%) |
| 6-Person Households | 25 (16.6%) | 0 (0.0%) |
| 7+ Person Households | 0 (0.0%) | 0 (0.0%) |
| Total | 132 (87.4%) | 19 (12.6%) |
Female Fertility in Mooers
Fertility by Age in Mooers
| Age Bracket | Women with Births | Births / 1,000 Women |
| 15 to 19 years | 0 (0.0%) | 0.0 |
| 20 to 34 years | 0 (0.0%) | 0.0 |
| 35 to 50 years | 0 (0.0%) | 0.0 |
| Total | 0 (0.0%) | 0.0 |
Fertility by Age by Marriage Status in Mooers
| Age Bracket | Married | Unmarried |
| 15 to 19 years | 0 (0.0%) | 0 (0.0%) |
| 20 to 34 years | 0 (0.0%) | 0 (0.0%) |
| 35 to 50 years | 0 (0.0%) | 0 (0.0%) |
| Total | 0 (0.0%) | 0 (0.0%) |
Fertility by Education in Mooers
| Educational Attainment | Women with Births | Births / 1,000 Women |
| Less than High School | 0 (0.0%) | 0.0 |
| High School Diploma | 0 (0.0%) | 0.0 |
| College or Associate's Degree | 0 (0.0%) | 0.0 |
| Bachelor's Degree | 0 (0.0%) | 0.0 |
| Graduate Degree | 0 (0.0%) | 0.0 |
| Total | 0 (0.0%) | 0.0 |
Fertility by Education by Marriage Status in Mooers
| Educational Attainment | Married | Unmarried |
| Less than High School | 0 (0.0%) | 0 (0.0%) |
| High School Diploma | 0 (0.0%) | 0 (0.0%) |
| College or Associate's Degree | 0 (0.0%) | 0 (0.0%) |
| Bachelor's Degree | 0 (0.0%) | 0 (0.0%) |
| Graduate Degree | 0 (0.0%) | 0 (0.0%) |
| Total | 0 (0.0%) | 0 (0.0%) |
Employment Characteristics in Mooers
Employment by Class of Employer in Mooers
Among the 200 employed individuals in Mooers, private company employees (142 | 71.0%), not-for-profit organizations (25 | 12.5%), and state government employees (21 | 10.5%) make up the most common classes of employment.
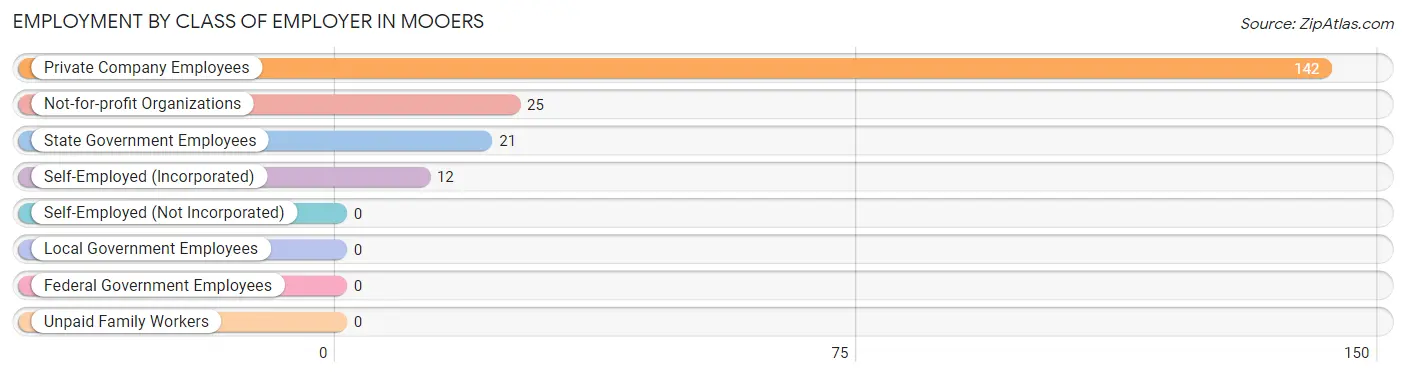
| Employer Class | # Employees | % Employees |
| Private Company Employees | 142 | 71.0% |
| Self-Employed (Incorporated) | 12 | 6.0% |
| Self-Employed (Not Incorporated) | 0 | 0.0% |
| Not-for-profit Organizations | 25 | 12.5% |
| Local Government Employees | 0 | 0.0% |
| State Government Employees | 21 | 10.5% |
| Federal Government Employees | 0 | 0.0% |
| Unpaid Family Workers | 0 | 0.0% |
| Total | 200 | 100.0% |
Employment Status by Age in Mooers
According to the labor force statistics for Mooers, out of the total population over 16 years of age (422), 64.2% or 271 individuals are in the labor force, with 11.4% or 31 of them unemployed. The age group with the highest labor force participation rate is 20 to 24 years, with 100.0% or 89 individuals in the labor force. Within the labor force, the 20 to 24 years age range has the highest percentage of unemployed individuals, with 34.8% or 31 of them being unemployed.
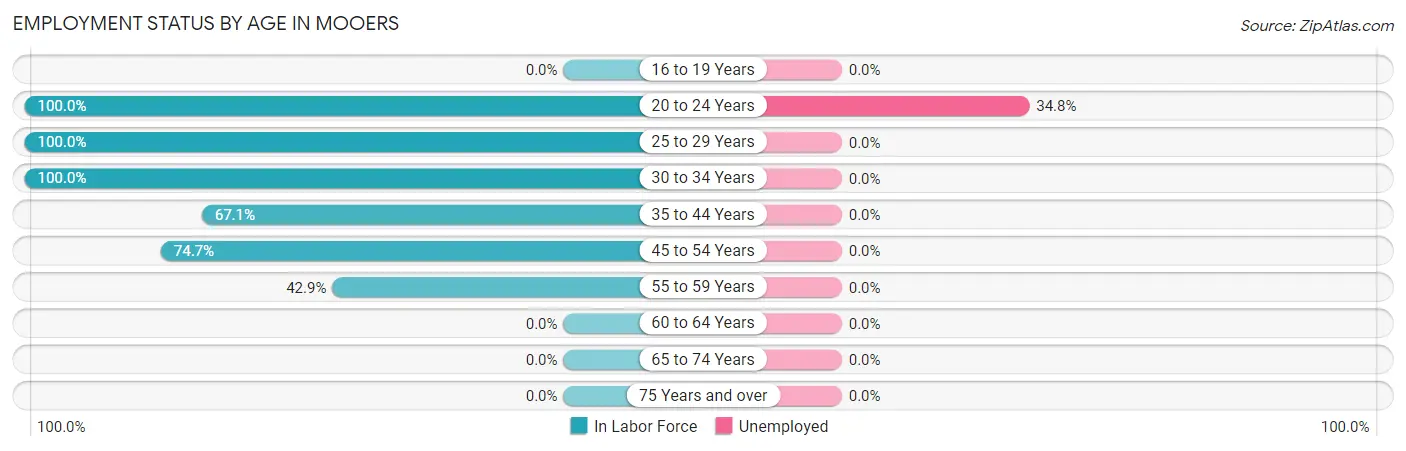
| Age Bracket | In Labor Force | Unemployed |
| 16 to 19 Years | 0 (0.0%) | 0 (0.0%) |
| 20 to 24 Years | 89 (100.0%) | 31 (34.8%) |
| 25 to 29 Years | 19 (100.0%) | 0 (0.0%) |
| 30 to 34 Years | 30 (100.0%) | 0 (0.0%) |
| 35 to 44 Years | 53 (67.1%) | 0 (0.0%) |
| 45 to 54 Years | 68 (74.7%) | 0 (0.0%) |
| 55 to 59 Years | 12 (42.9%) | 0 (0.0%) |
| 60 to 64 Years | 0 (0.0%) | 0 (0.0%) |
| 65 to 74 Years | 0 (0.0%) | 0 (0.0%) |
| 75 Years and over | 0 (0.0%) | 0 (0.0%) |
| Total | 271 (64.2%) | 31 (11.4%) |
Employment Status by Educational Attainment in Mooers
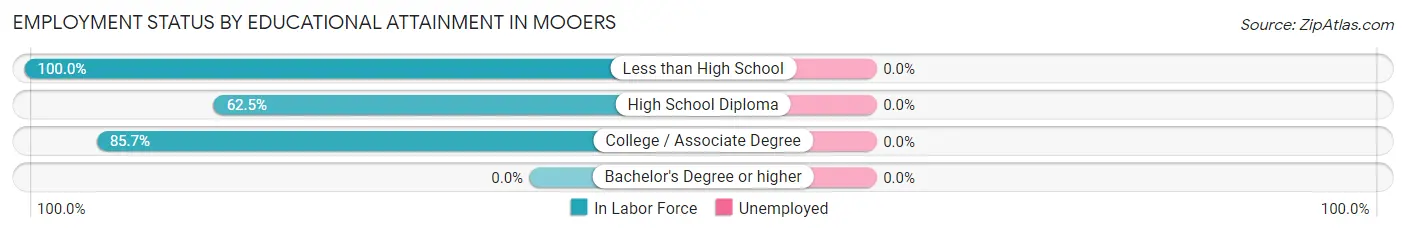
| Educational Attainment | In Labor Force | Unemployed |
| Less than High School | 13 (100.0%) | 0 (0.0%) |
| High School Diploma | 85 (62.5%) | 0 (0.0%) |
| College / Associate Degree | 84 (85.7%) | 0 (0.0%) |
| Bachelor's Degree or higher | 0 (0.0%) | 0 (0.0%) |
| Total | 182 (73.7%) | 0 (0.0%) |
Employment Occupations by Sex in Mooers
Management, Business, Science and Arts Occupations
The most common Management, Business, Science and Arts occupations in Mooers are , and Health Diagnosing & Treating (14 | 5.8%).
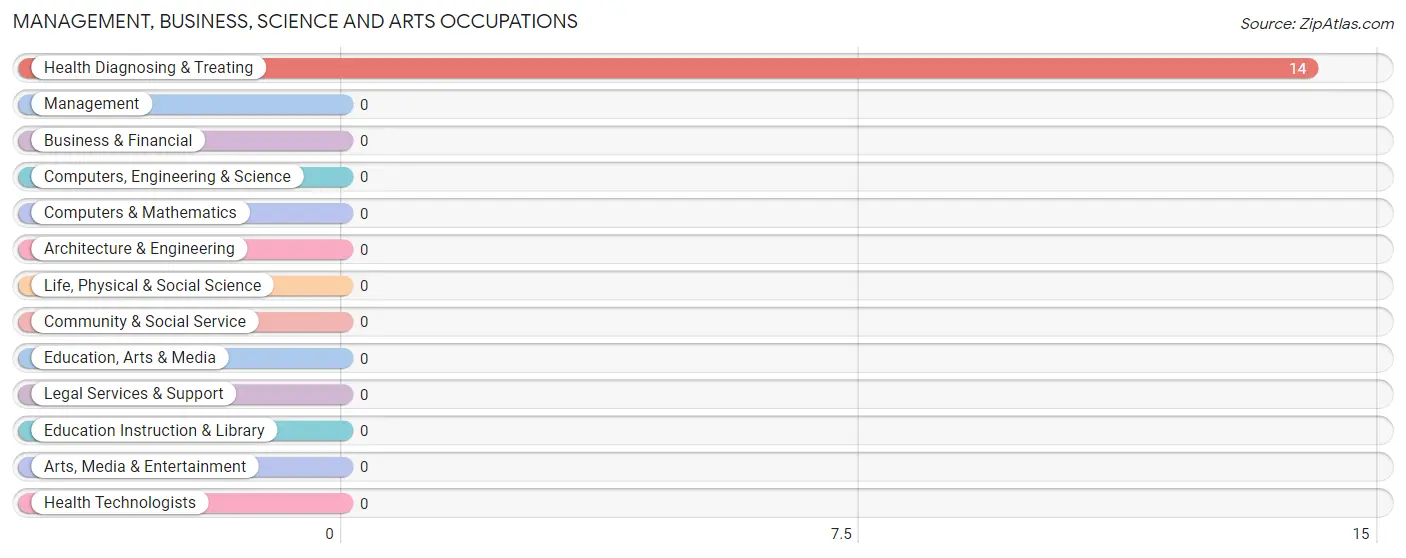
Management, Business, Science and Arts Occupations by Sex
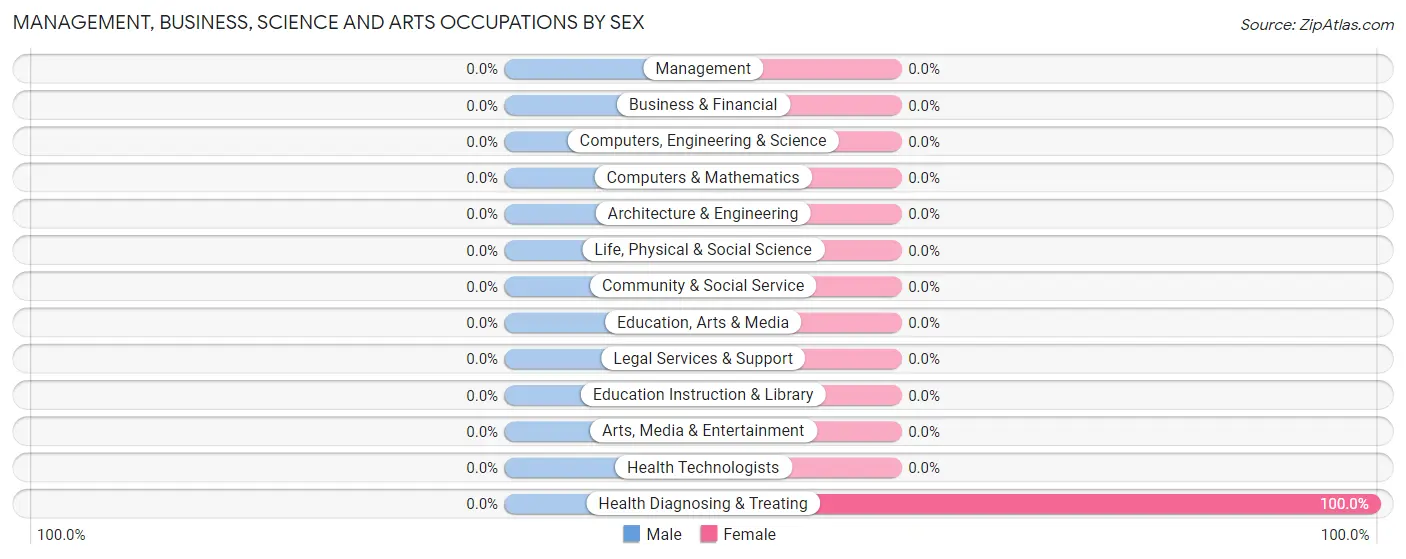
| Occupation | Male | Female |
| Management | 0 (0.0%) | 0 (0.0%) |
| Business & Financial | 0 (0.0%) | 0 (0.0%) |
| Computers, Engineering & Science | 0 (0.0%) | 0 (0.0%) |
| Computers & Mathematics | 0 (0.0%) | 0 (0.0%) |
| Architecture & Engineering | 0 (0.0%) | 0 (0.0%) |
| Life, Physical & Social Science | 0 (0.0%) | 0 (0.0%) |
| Community & Social Service | 0 (0.0%) | 0 (0.0%) |
| Education, Arts & Media | 0 (0.0%) | 0 (0.0%) |
| Legal Services & Support | 0 (0.0%) | 0 (0.0%) |
| Education Instruction & Library | 0 (0.0%) | 0 (0.0%) |
| Arts, Media & Entertainment | 0 (0.0%) | 0 (0.0%) |
| Health Diagnosing & Treating | 0 (0.0%) | 14 (100.0%) |
| Health Technologists | 0 (0.0%) | 0 (0.0%) |
| Total (Category) | 0 (0.0%) | 14 (100.0%) |
| Total (Overall) | 143 (59.6%) | 97 (40.4%) |
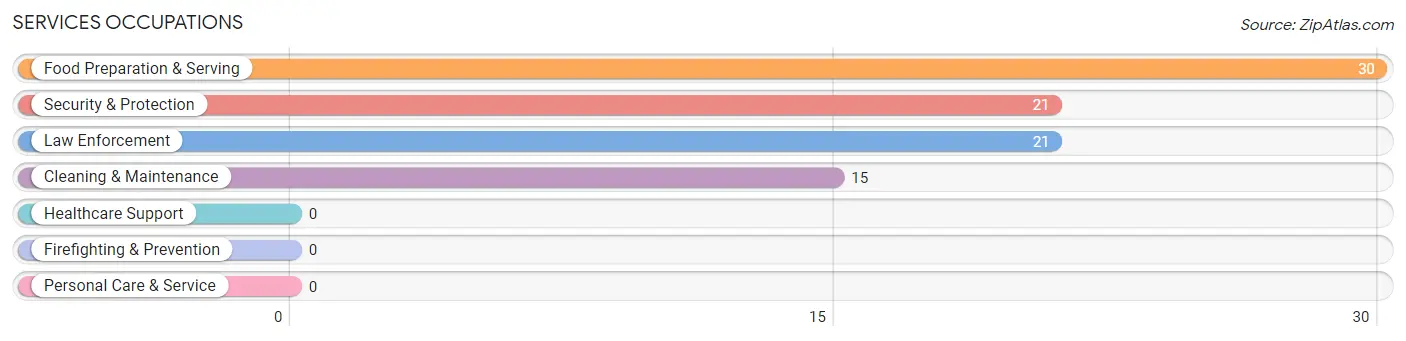
Services Occupations
The most common Services occupations in Mooers are Food Preparation & Serving (30 | 12.5%), Security & Protection (21 | 8.7%), Law Enforcement (21 | 8.7%), and Cleaning & Maintenance (15 | 6.2%).
Services Occupations by Sex
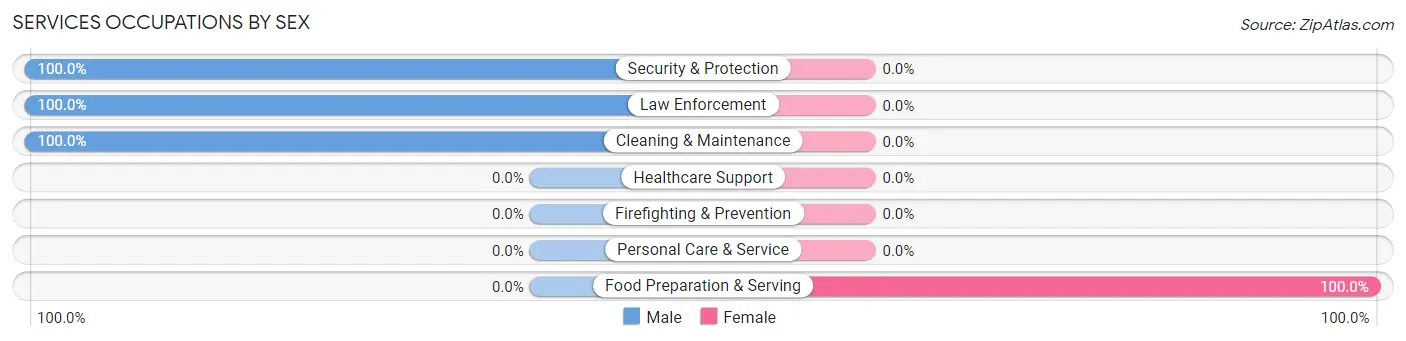
| Occupation | Male | Female |
| Healthcare Support | 0 (0.0%) | 0 (0.0%) |
| Security & Protection | 21 (100.0%) | 0 (0.0%) |
| Firefighting & Prevention | 0 (0.0%) | 0 (0.0%) |
| Law Enforcement | 21 (100.0%) | 0 (0.0%) |
| Food Preparation & Serving | 0 (0.0%) | 30 (100.0%) |
| Cleaning & Maintenance | 15 (100.0%) | 0 (0.0%) |
| Personal Care & Service | 0 (0.0%) | 0 (0.0%) |
| Total (Category) | 36 (54.5%) | 30 (45.5%) |
| Total (Overall) | 143 (59.6%) | 97 (40.4%) |
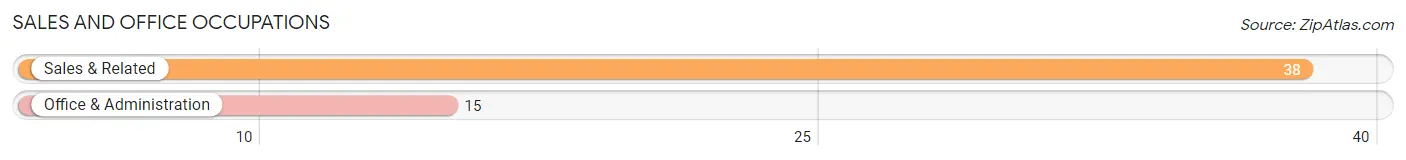
Sales and Office Occupations
The most common Sales and Office occupations in Mooers are Sales & Related (38 | 15.8%), and Office & Administration (15 | 6.2%).
Sales and Office Occupations by Sex
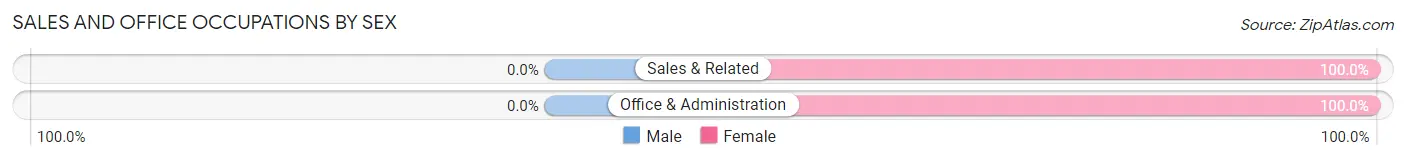
| Occupation | Male | Female |
| Sales & Related | 0 (0.0%) | 38 (100.0%) |
| Office & Administration | 0 (0.0%) | 15 (100.0%) |
| Total (Category) | 0 (0.0%) | 53 (100.0%) |
| Total (Overall) | 143 (59.6%) | 97 (40.4%) |
Natural Resources, Construction and Maintenance Occupations
The most common Natural Resources, Construction and Maintenance occupations in Mooers are , and Installation, Maintenance & Repair (12 | 5.0%).
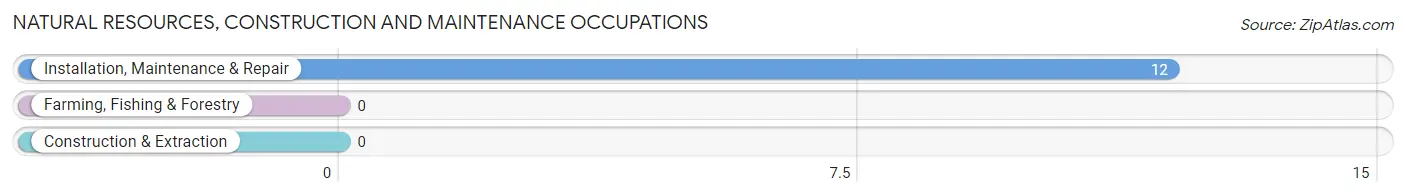
Natural Resources, Construction and Maintenance Occupations by Sex
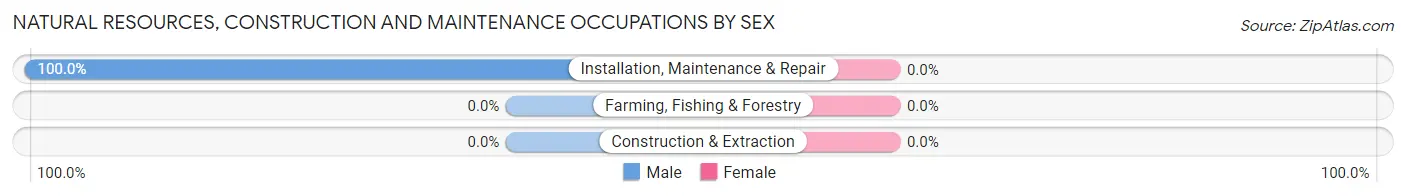
| Occupation | Male | Female |
| Farming, Fishing & Forestry | 0 (0.0%) | 0 (0.0%) |
| Construction & Extraction | 0 (0.0%) | 0 (0.0%) |
| Installation, Maintenance & Repair | 12 (100.0%) | 0 (0.0%) |
| Total (Category) | 12 (100.0%) | 0 (0.0%) |
| Total (Overall) | 143 (59.6%) | 97 (40.4%) |
Production, Transportation and Moving Occupations
The most common Production, Transportation and Moving occupations in Mooers are Production (77 | 32.1%), and Transportation (18 | 7.5%).
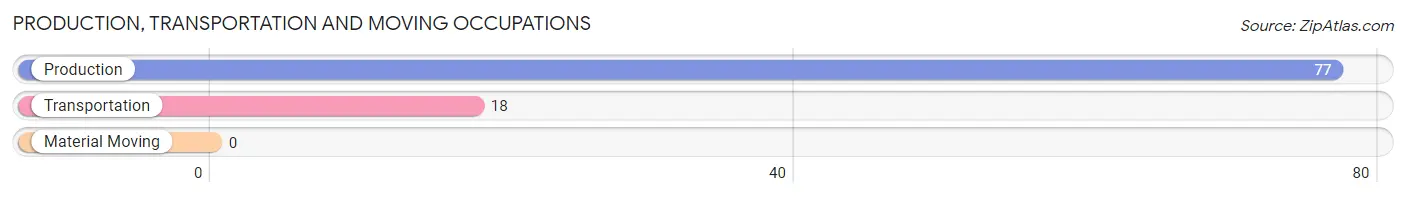
Production, Transportation and Moving Occupations by Sex
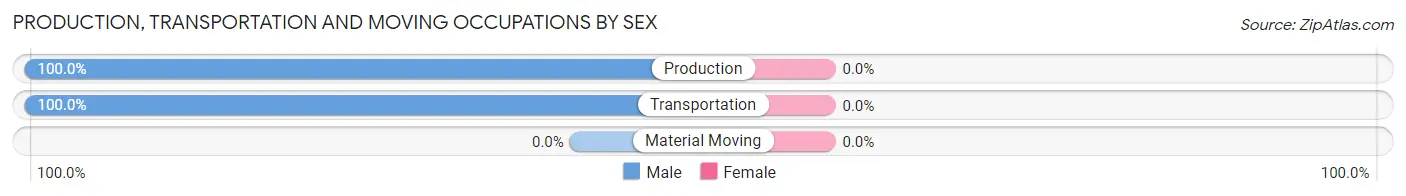
| Occupation | Male | Female |
| Production | 77 (100.0%) | 0 (0.0%) |
| Transportation | 18 (100.0%) | 0 (0.0%) |
| Material Moving | 0 (0.0%) | 0 (0.0%) |
| Total (Category) | 95 (100.0%) | 0 (0.0%) |
| Total (Overall) | 143 (59.6%) | 97 (40.4%) |
Employment Industries by Sex in Mooers
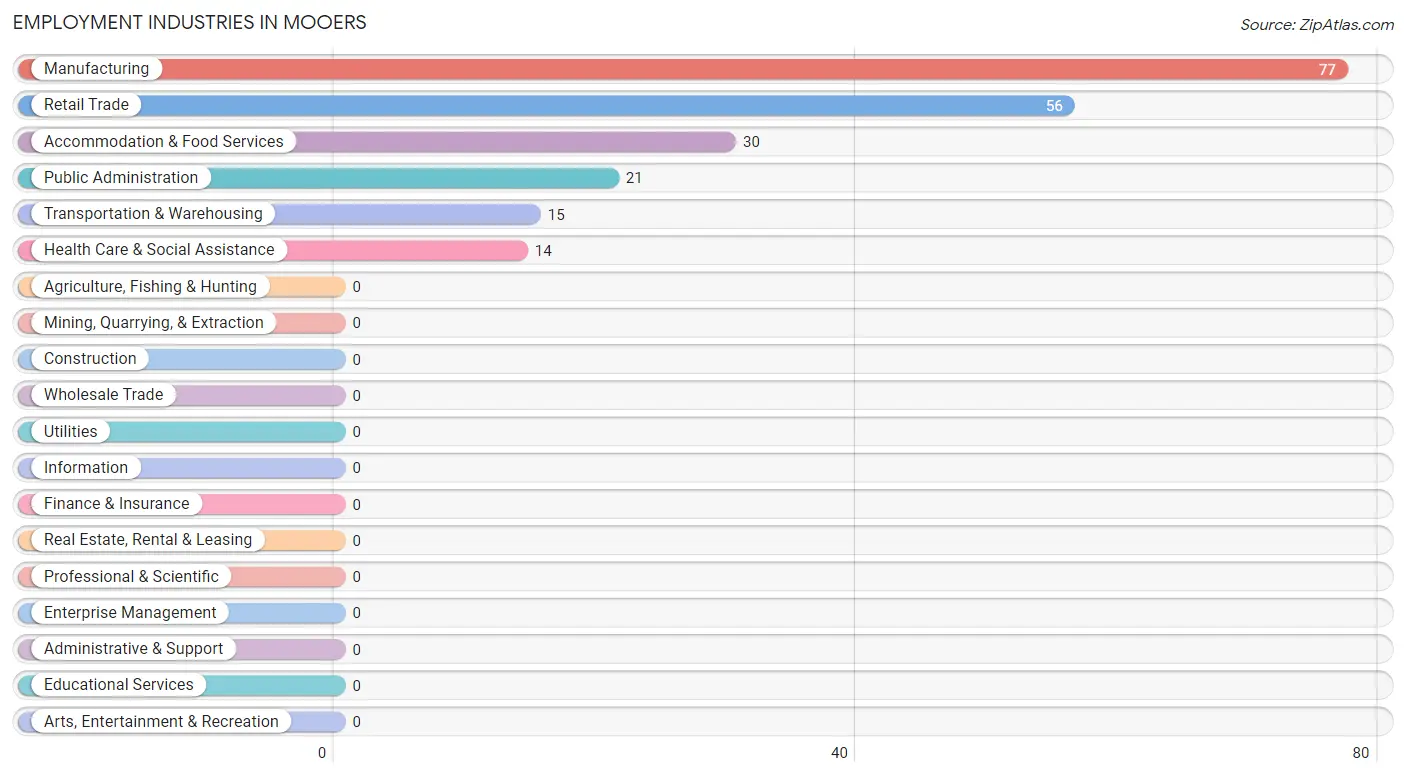
Employment Industries in Mooers
The major employment industries in Mooers include Manufacturing (77 | 32.1%), Retail Trade (56 | 23.3%), Accommodation & Food Services (30 | 12.5%), Public Administration (21 | 8.7%), and Transportation & Warehousing (15 | 6.2%).
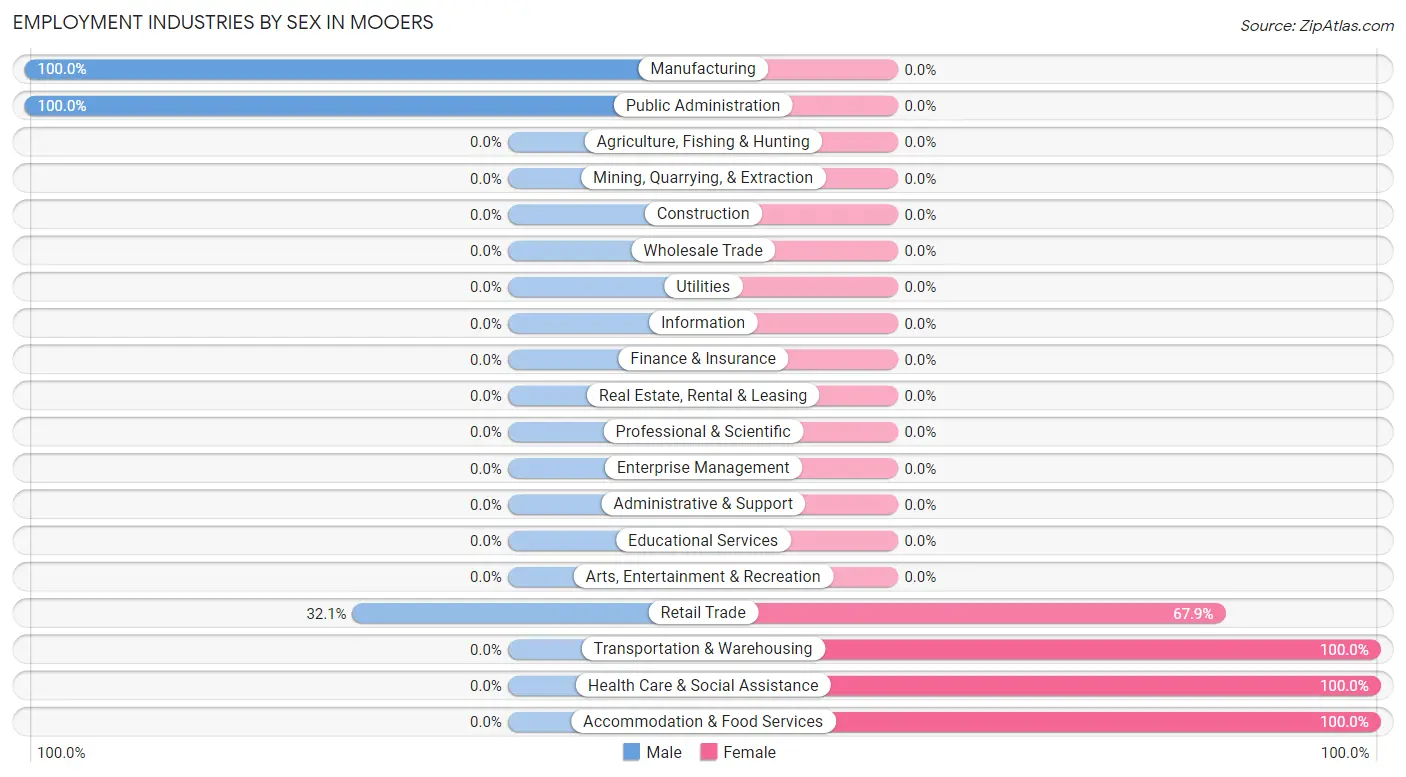
Employment Industries by Sex in Mooers
The Mooers industries that see more men than women are Manufacturing (100.0%), Public Administration (100.0%), and Retail Trade (32.1%), whereas the industries that tend to have a higher number of women are Transportation & Warehousing (100.0%), Health Care & Social Assistance (100.0%), and Accommodation & Food Services (100.0%).
| Industry | Male | Female |
| Agriculture, Fishing & Hunting | 0 (0.0%) | 0 (0.0%) |
| Mining, Quarrying, & Extraction | 0 (0.0%) | 0 (0.0%) |
| Construction | 0 (0.0%) | 0 (0.0%) |
| Manufacturing | 77 (100.0%) | 0 (0.0%) |
| Wholesale Trade | 0 (0.0%) | 0 (0.0%) |
| Retail Trade | 18 (32.1%) | 38 (67.9%) |
| Transportation & Warehousing | 0 (0.0%) | 15 (100.0%) |
| Utilities | 0 (0.0%) | 0 (0.0%) |
| Information | 0 (0.0%) | 0 (0.0%) |
| Finance & Insurance | 0 (0.0%) | 0 (0.0%) |
| Real Estate, Rental & Leasing | 0 (0.0%) | 0 (0.0%) |
| Professional & Scientific | 0 (0.0%) | 0 (0.0%) |
| Enterprise Management | 0 (0.0%) | 0 (0.0%) |
| Administrative & Support | 0 (0.0%) | 0 (0.0%) |
| Educational Services | 0 (0.0%) | 0 (0.0%) |
| Health Care & Social Assistance | 0 (0.0%) | 14 (100.0%) |
| Arts, Entertainment & Recreation | 0 (0.0%) | 0 (0.0%) |
| Accommodation & Food Services | 0 (0.0%) | 30 (100.0%) |
| Public Administration | 21 (100.0%) | 0 (0.0%) |
| Total | 143 (59.6%) | 97 (40.4%) |
Education in Mooers
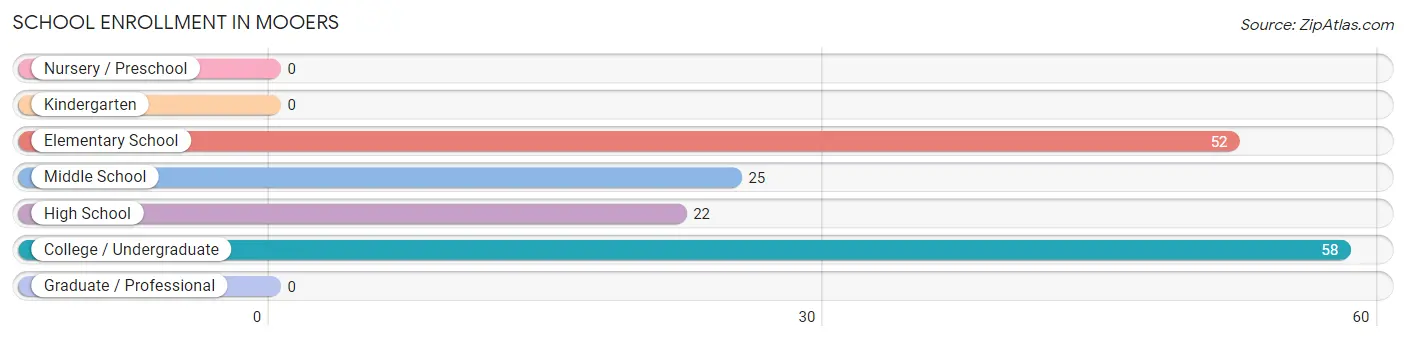
School Enrollment in Mooers
The most common levels of schooling among the 157 students in Mooers are college / undergraduate (58 | 36.9%), elementary school (52 | 33.1%), and middle school (25 | 15.9%).
| School Level | # Students | % Students |
| Nursery / Preschool | 0 | 0.0% |
| Kindergarten | 0 | 0.0% |
| Elementary School | 52 | 33.1% |
| Middle School | 25 | 15.9% |
| High School | 22 | 14.0% |
| College / Undergraduate | 58 | 36.9% |
| Graduate / Professional | 0 | 0.0% |
| Total | 157 | 100.0% |
School Enrollment by Age by Funding Source in Mooers
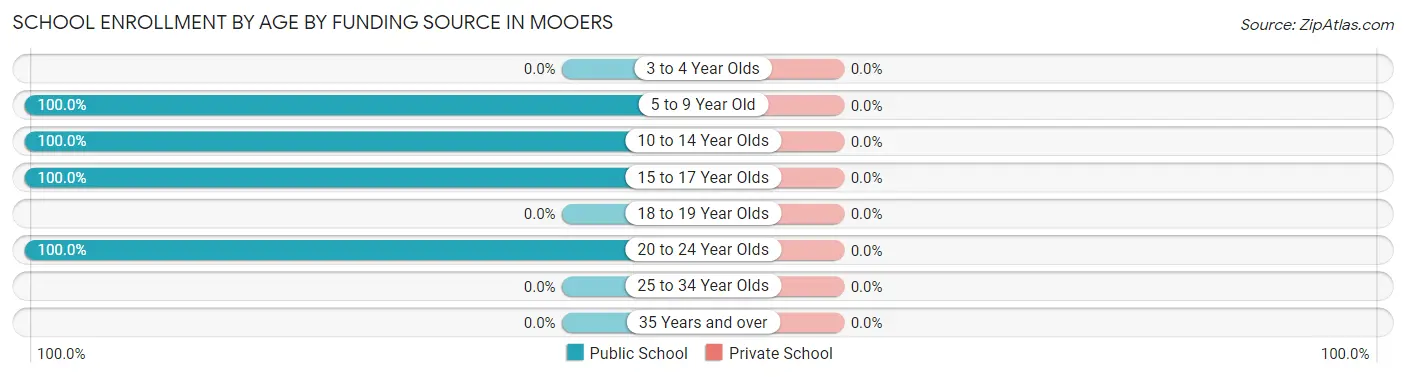
| Age Bracket | Public School | Private School |
| 3 to 4 Year Olds | 0 (0.0%) | 0 (0.0%) |
| 5 to 9 Year Old | 52 (100.0%) | 0 (0.0%) |
| 10 to 14 Year Olds | 25 (100.0%) | 0 (0.0%) |
| 15 to 17 Year Olds | 22 (100.0%) | 0 (0.0%) |
| 18 to 19 Year Olds | 0 (0.0%) | 0 (0.0%) |
| 20 to 24 Year Olds | 58 (100.0%) | 0 (0.0%) |
| 25 to 34 Year Olds | 0 (0.0%) | 0 (0.0%) |
| 35 Years and over | 0 (0.0%) | 0 (0.0%) |
| Total | 157 (100.0%) | 0 (0.0%) |
Educational Attainment by Field of Study in Mooers
Education (36 | 56.2%), and bio, nature & agricultural (28 | 43.8%) are the most common fields of study among 64 individuals in Mooers who have obtained a bachelor's degree or higher.
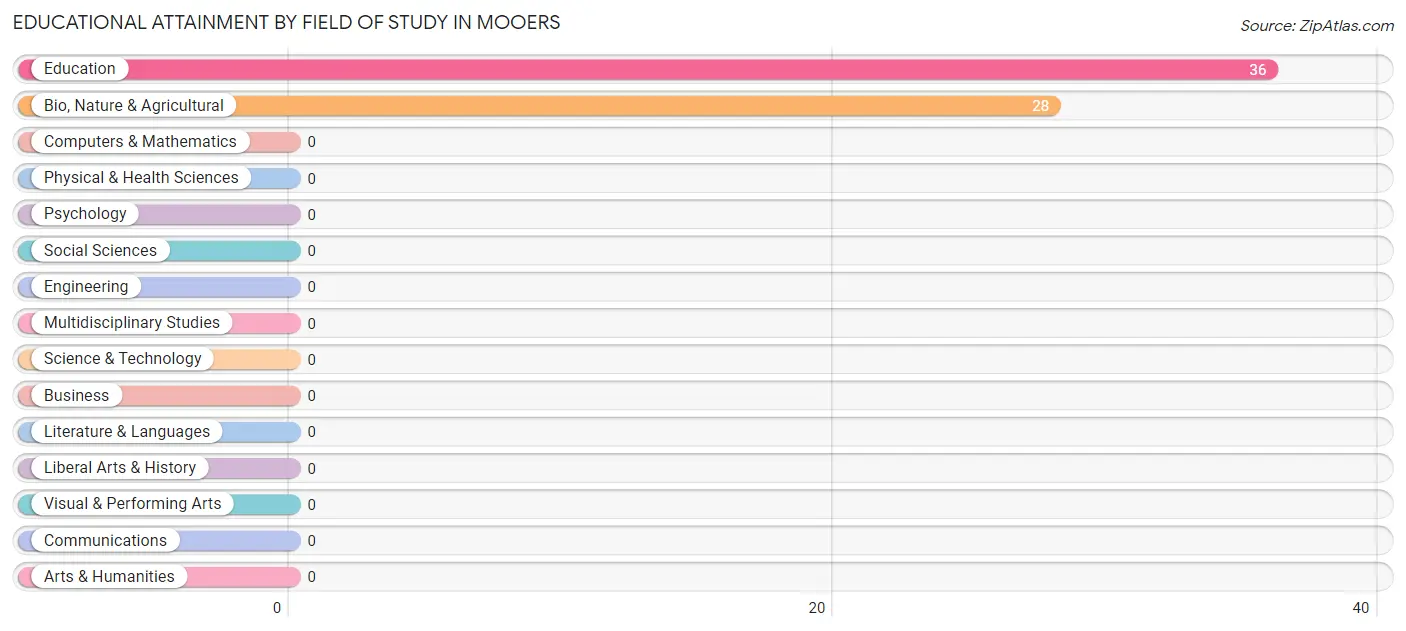
| Field of Study | # Graduates | % Graduates |
| Computers & Mathematics | 0 | 0.0% |
| Bio, Nature & Agricultural | 28 | 43.8% |
| Physical & Health Sciences | 0 | 0.0% |
| Psychology | 0 | 0.0% |
| Social Sciences | 0 | 0.0% |
| Engineering | 0 | 0.0% |
| Multidisciplinary Studies | 0 | 0.0% |
| Science & Technology | 0 | 0.0% |
| Business | 0 | 0.0% |
| Education | 36 | 56.2% |
| Literature & Languages | 0 | 0.0% |
| Liberal Arts & History | 0 | 0.0% |
| Visual & Performing Arts | 0 | 0.0% |
| Communications | 0 | 0.0% |
| Arts & Humanities | 0 | 0.0% |
| Total | 64 | 100.0% |
Transportation & Commute in Mooers
Vehicle Availability by Sex in Mooers
The most prevalent vehicle ownership categories in Mooers are males with 5 or more vehicles (91, accounting for 71.1%) and females with 5 or more vehicles (14, making up 126.4%).
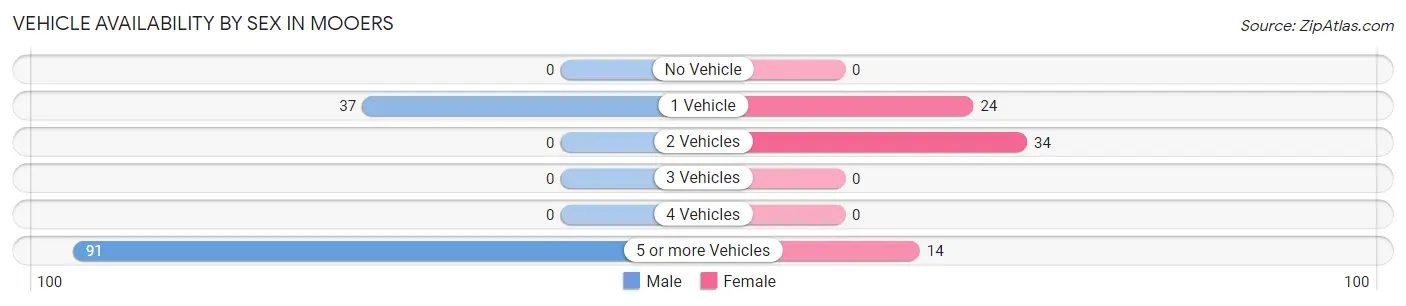
| Vehicles Available | Male | Female |
| No Vehicle | 0 (0.0%) | 0 (0.0%) |
| 1 Vehicle | 37 (28.9%) | 24 (33.3%) |
| 2 Vehicles | 0 (0.0%) | 34 (47.2%) |
| 3 Vehicles | 0 (0.0%) | 0 (0.0%) |
| 4 Vehicles | 0 (0.0%) | 0 (0.0%) |
| 5 or more Vehicles | 91 (71.1%) | 14 (19.4%) |
| Total | 128 (100.0%) | 72 (100.0%) |
Commute Time in Mooers
The most frequently occuring commute durations in Mooers are 15 to 19 minutes (58 commuters, 29.0%), 10 to 14 minutes (50 commuters, 25.0%), and 35 to 39 minutes (24 commuters, 12.0%).
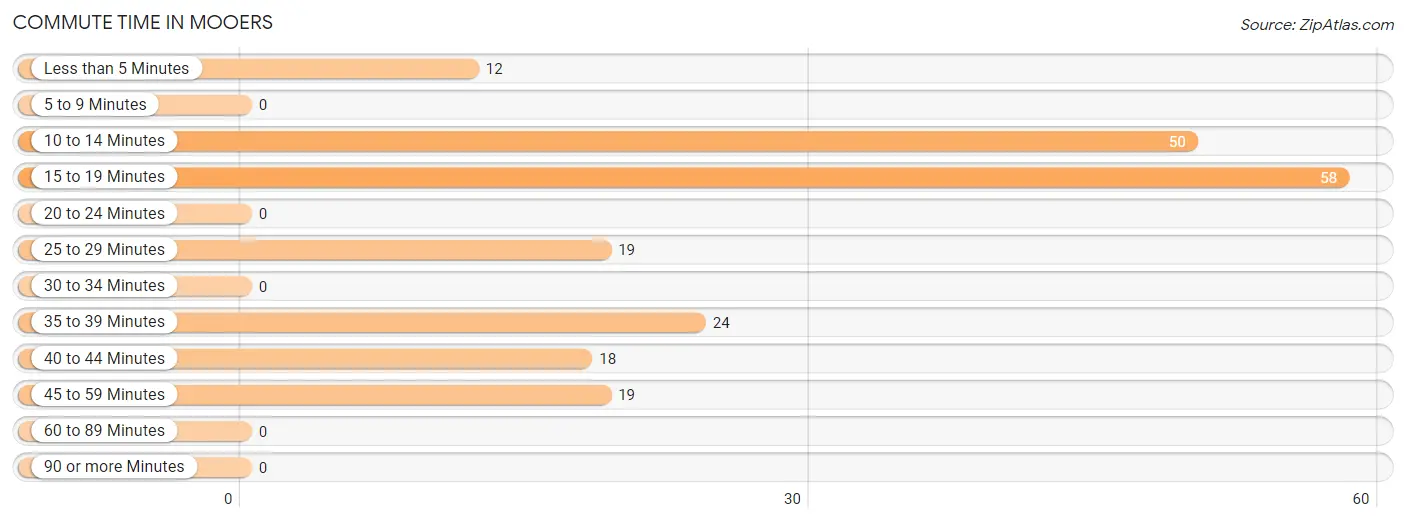
| Commute Time | # Commuters | % Commuters |
| Less than 5 Minutes | 12 | 6.0% |
| 5 to 9 Minutes | 0 | 0.0% |
| 10 to 14 Minutes | 50 | 25.0% |
| 15 to 19 Minutes | 58 | 29.0% |
| 20 to 24 Minutes | 0 | 0.0% |
| 25 to 29 Minutes | 19 | 9.5% |
| 30 to 34 Minutes | 0 | 0.0% |
| 35 to 39 Minutes | 24 | 12.0% |
| 40 to 44 Minutes | 18 | 9.0% |
| 45 to 59 Minutes | 19 | 9.5% |
| 60 to 89 Minutes | 0 | 0.0% |
| 90 or more Minutes | 0 | 0.0% |
Commute Time by Sex in Mooers
The most common commute times in Mooers are 15 to 19 minutes (58 commuters, 45.3%) for males and 10 to 14 minutes (29 commuters, 40.3%) for females.
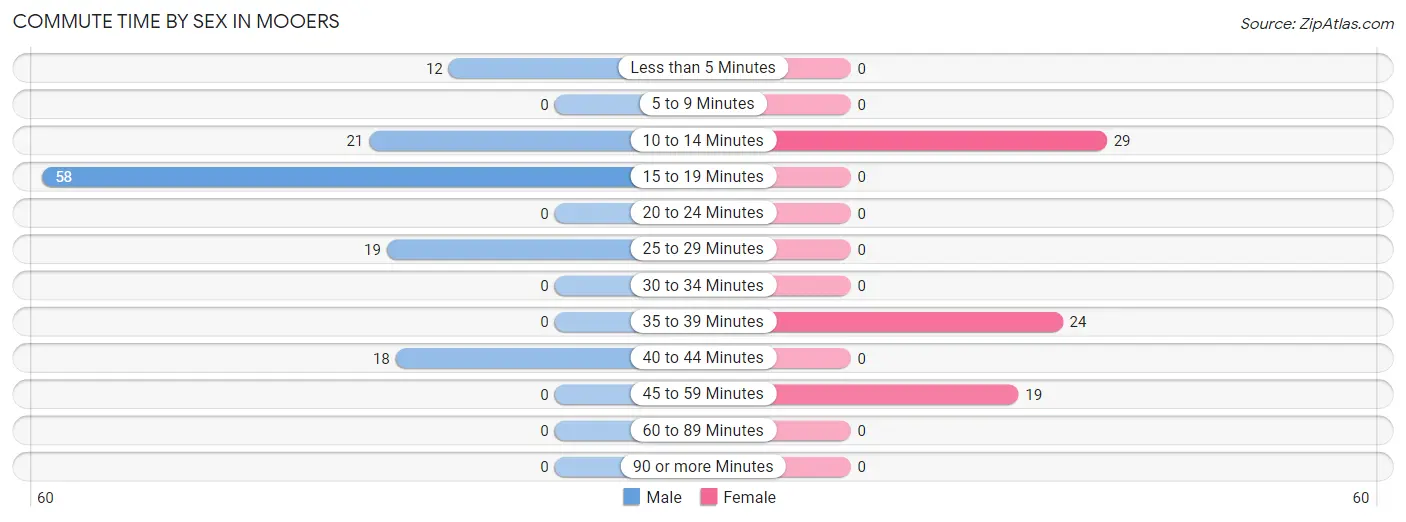
| Commute Time | Male | Female |
| Less than 5 Minutes | 12 (9.4%) | 0 (0.0%) |
| 5 to 9 Minutes | 0 (0.0%) | 0 (0.0%) |
| 10 to 14 Minutes | 21 (16.4%) | 29 (40.3%) |
| 15 to 19 Minutes | 58 (45.3%) | 0 (0.0%) |
| 20 to 24 Minutes | 0 (0.0%) | 0 (0.0%) |
| 25 to 29 Minutes | 19 (14.8%) | 0 (0.0%) |
| 30 to 34 Minutes | 0 (0.0%) | 0 (0.0%) |
| 35 to 39 Minutes | 0 (0.0%) | 24 (33.3%) |
| 40 to 44 Minutes | 18 (14.1%) | 0 (0.0%) |
| 45 to 59 Minutes | 0 (0.0%) | 19 (26.4%) |
| 60 to 89 Minutes | 0 (0.0%) | 0 (0.0%) |
| 90 or more Minutes | 0 (0.0%) | 0 (0.0%) |
Time of Departure to Work by Sex in Mooers
The most frequent times of departure to work in Mooers are 7:00 AM to 7:29 AM (76, 59.4%) for males and 10:00 AM to 10:59 AM (19, 26.4%) for females.
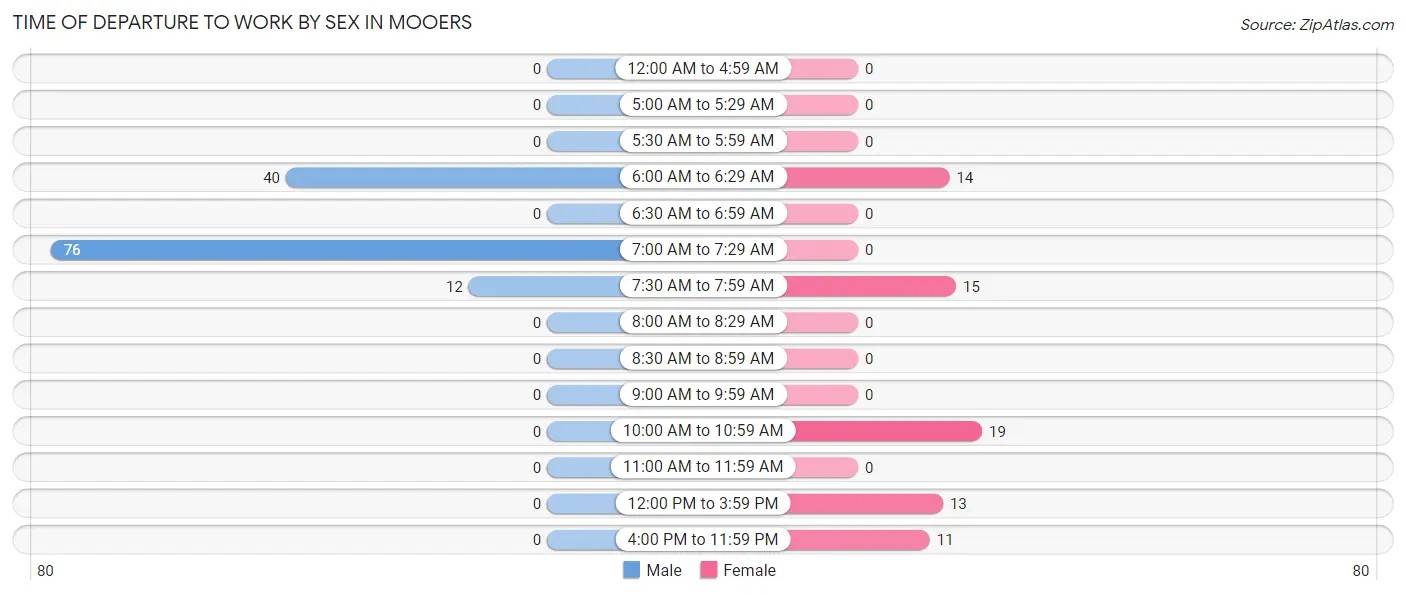
| Time of Departure | Male | Female |
| 12:00 AM to 4:59 AM | 0 (0.0%) | 0 (0.0%) |
| 5:00 AM to 5:29 AM | 0 (0.0%) | 0 (0.0%) |
| 5:30 AM to 5:59 AM | 0 (0.0%) | 0 (0.0%) |
| 6:00 AM to 6:29 AM | 40 (31.2%) | 14 (19.4%) |
| 6:30 AM to 6:59 AM | 0 (0.0%) | 0 (0.0%) |
| 7:00 AM to 7:29 AM | 76 (59.4%) | 0 (0.0%) |
| 7:30 AM to 7:59 AM | 12 (9.4%) | 15 (20.8%) |
| 8:00 AM to 8:29 AM | 0 (0.0%) | 0 (0.0%) |
| 8:30 AM to 8:59 AM | 0 (0.0%) | 0 (0.0%) |
| 9:00 AM to 9:59 AM | 0 (0.0%) | 0 (0.0%) |
| 10:00 AM to 10:59 AM | 0 (0.0%) | 19 (26.4%) |
| 11:00 AM to 11:59 AM | 0 (0.0%) | 0 (0.0%) |
| 12:00 PM to 3:59 PM | 0 (0.0%) | 13 (18.1%) |
| 4:00 PM to 11:59 PM | 0 (0.0%) | 11 (15.3%) |
| Total | 128 (100.0%) | 72 (100.0%) |
Housing Occupancy in Mooers
Occupancy by Ownership in Mooers
Of the total 151 dwellings in Mooers, owner-occupied units account for 140 (92.7%), while renter-occupied units make up 11 (7.3%).
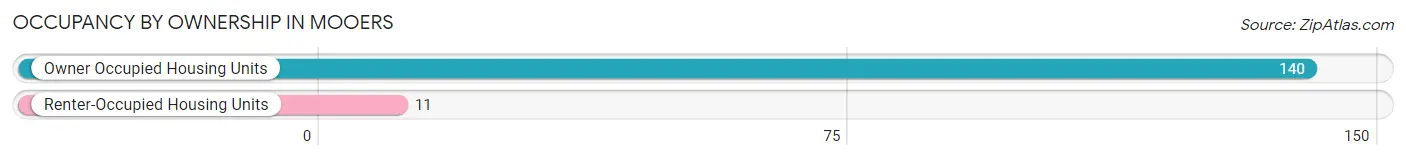
| Occupancy | # Housing Units | % Housing Units |
| Owner Occupied Housing Units | 140 | 92.7% |
| Renter-Occupied Housing Units | 11 | 7.3% |
| Total Occupied Housing Units | 151 | 100.0% |
Occupancy by Household Size in Mooers
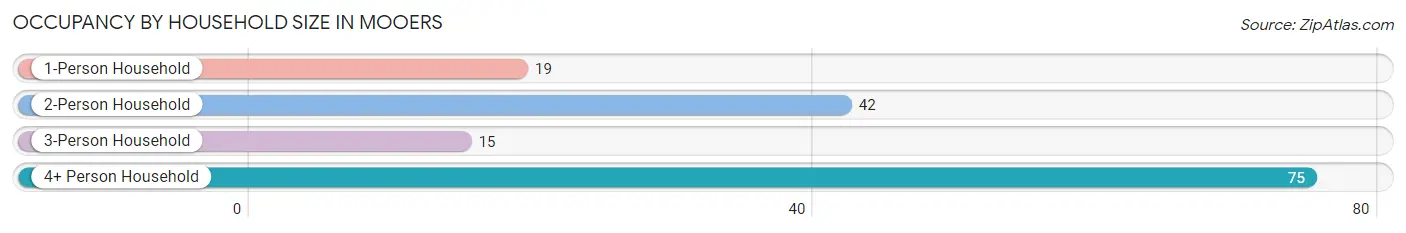
| Household Size | # Housing Units | % Housing Units |
| 1-Person Household | 19 | 12.6% |
| 2-Person Household | 42 | 27.8% |
| 3-Person Household | 15 | 9.9% |
| 4+ Person Household | 75 | 49.7% |
| Total Housing Units | 151 | 100.0% |
Occupancy by Ownership by Household Size in Mooers
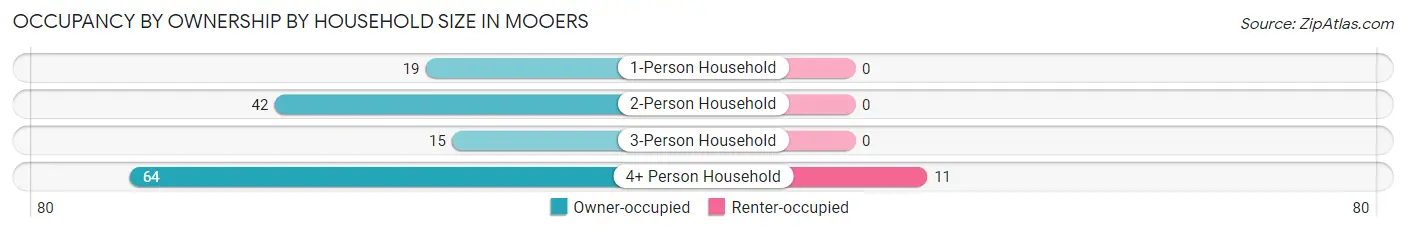
| Household Size | Owner-occupied | Renter-occupied |
| 1-Person Household | 19 (100.0%) | 0 (0.0%) |
| 2-Person Household | 42 (100.0%) | 0 (0.0%) |
| 3-Person Household | 15 (100.0%) | 0 (0.0%) |
| 4+ Person Household | 64 (85.3%) | 11 (14.7%) |
| Total Housing Units | 140 (92.7%) | 11 (7.3%) |
Occupancy by Educational Attainment in Mooers
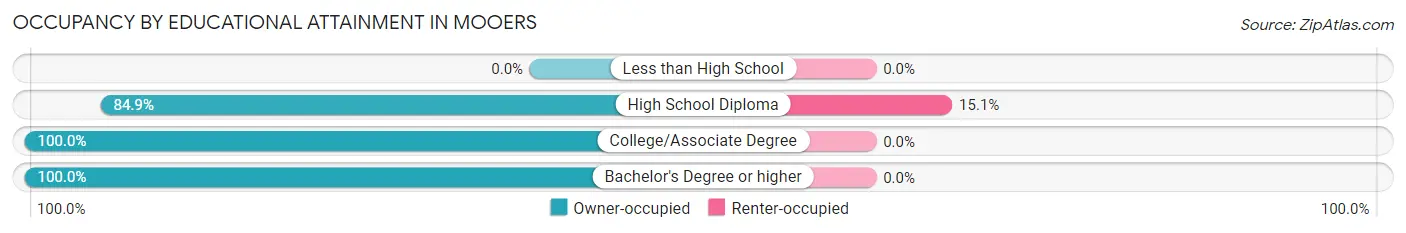
| Household Size | Owner-occupied | Renter-occupied |
| Less than High School | 0 (0.0%) | 0 (0.0%) |
| High School Diploma | 62 (84.9%) | 11 (15.1%) |
| College/Associate Degree | 50 (100.0%) | 0 (0.0%) |
| Bachelor's Degree or higher | 28 (100.0%) | 0 (0.0%) |
Occupancy by Age of Householder in Mooers
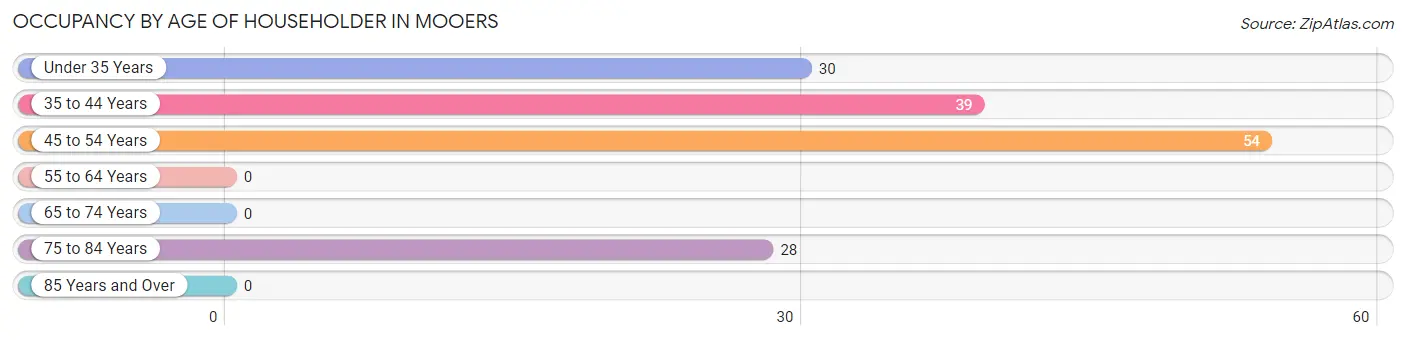
| Age Bracket | # Households | % Households |
| Under 35 Years | 30 | 19.9% |
| 35 to 44 Years | 39 | 25.8% |
| 45 to 54 Years | 54 | 35.8% |
| 55 to 64 Years | 0 | 0.0% |
| 65 to 74 Years | 0 | 0.0% |
| 75 to 84 Years | 28 | 18.5% |
| 85 Years and Over | 0 | 0.0% |
| Total | 151 | 100.0% |
Housing Finances in Mooers
Median Income by Occupancy in Mooers
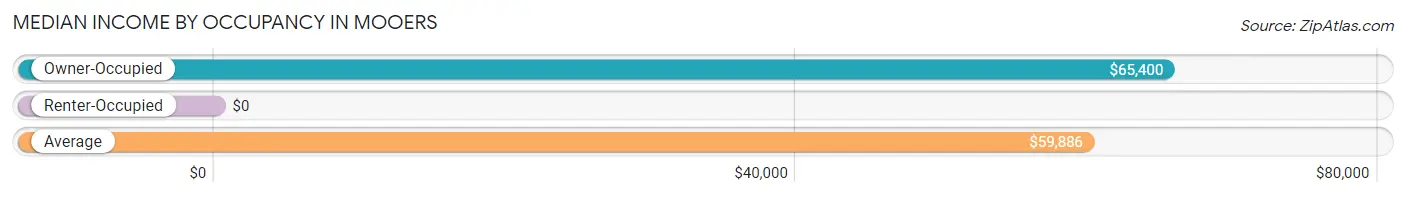
| Occupancy Type | # Households | Median Income |
| Owner-Occupied | 140 (92.7%) | $65,400 |
| Renter-Occupied | 11 (7.3%) | $0 |
| Average | 151 (100.0%) | $59,886 |
Occupancy by Householder Income Bracket in Mooers
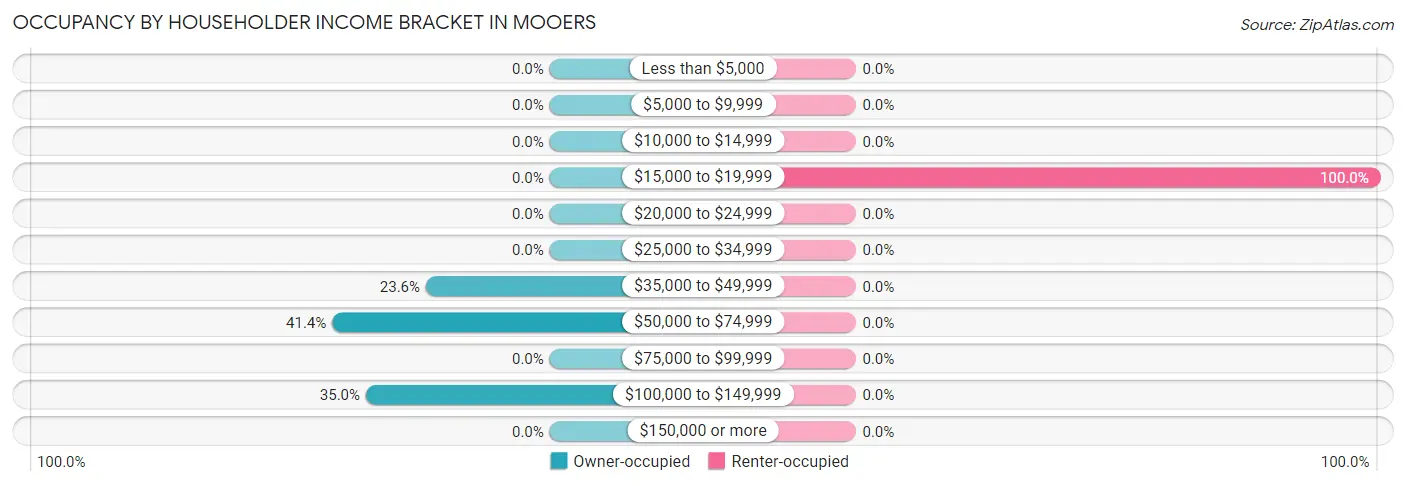
| Income Bracket | Owner-occupied | Renter-occupied |
| Less than $5,000 | 0 (0.0%) | 0 (0.0%) |
| $5,000 to $9,999 | 0 (0.0%) | 0 (0.0%) |
| $10,000 to $14,999 | 0 (0.0%) | 0 (0.0%) |
| $15,000 to $19,999 | 0 (0.0%) | 11 (100.0%) |
| $20,000 to $24,999 | 0 (0.0%) | 0 (0.0%) |
| $25,000 to $34,999 | 0 (0.0%) | 0 (0.0%) |
| $35,000 to $49,999 | 33 (23.6%) | 0 (0.0%) |
| $50,000 to $74,999 | 58 (41.4%) | 0 (0.0%) |
| $75,000 to $99,999 | 0 (0.0%) | 0 (0.0%) |
| $100,000 to $149,999 | 49 (35.0%) | 0 (0.0%) |
| $150,000 or more | 0 (0.0%) | 0 (0.0%) |
| Total | 140 (100.0%) | 11 (100.0%) |
Monthly Housing Cost Tiers in Mooers
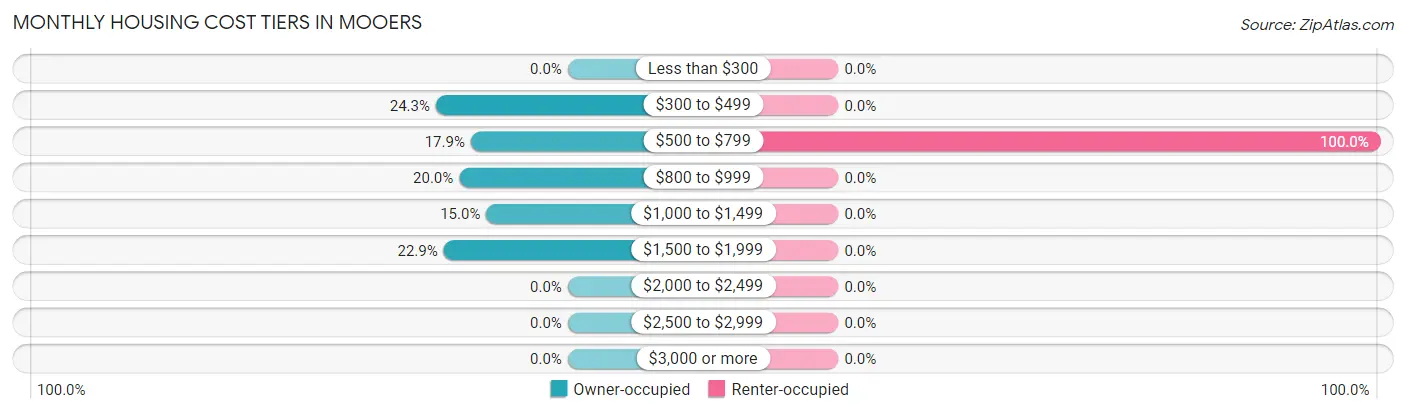
| Monthly Cost | Owner-occupied | Renter-occupied |
| Less than $300 | 0 (0.0%) | 0 (0.0%) |
| $300 to $499 | 34 (24.3%) | 0 (0.0%) |
| $500 to $799 | 25 (17.9%) | 11 (100.0%) |
| $800 to $999 | 28 (20.0%) | 0 (0.0%) |
| $1,000 to $1,499 | 21 (15.0%) | 0 (0.0%) |
| $1,500 to $1,999 | 32 (22.9%) | 0 (0.0%) |
| $2,000 to $2,499 | 0 (0.0%) | 0 (0.0%) |
| $2,500 to $2,999 | 0 (0.0%) | 0 (0.0%) |
| $3,000 or more | 0 (0.0%) | 0 (0.0%) |
| Total | 140 (100.0%) | 11 (100.0%) |
Physical Housing Characteristics in Mooers
Housing Structures in Mooers
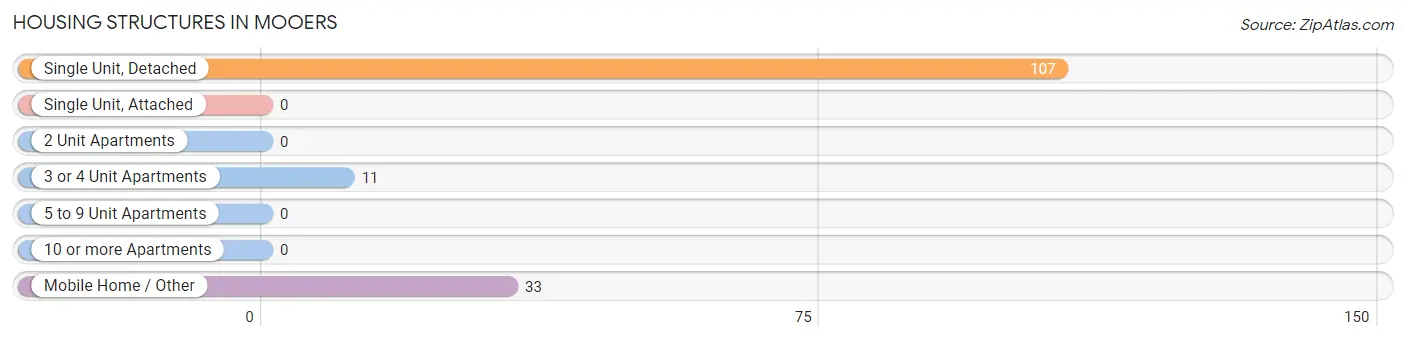
| Structure Type | # Housing Units | % Housing Units |
| Single Unit, Detached | 107 | 70.9% |
| Single Unit, Attached | 0 | 0.0% |
| 2 Unit Apartments | 0 | 0.0% |
| 3 or 4 Unit Apartments | 11 | 7.3% |
| 5 to 9 Unit Apartments | 0 | 0.0% |
| 10 or more Apartments | 0 | 0.0% |
| Mobile Home / Other | 33 | 21.8% |
| Total | 151 | 100.0% |
Housing Structures by Occupancy in Mooers
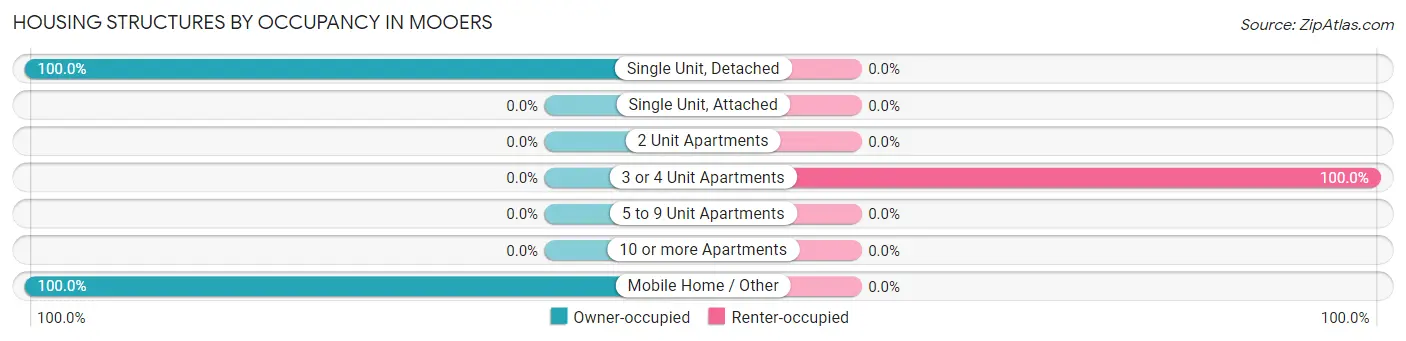
| Structure Type | Owner-occupied | Renter-occupied |
| Single Unit, Detached | 107 (100.0%) | 0 (0.0%) |
| Single Unit, Attached | 0 (0.0%) | 0 (0.0%) |
| 2 Unit Apartments | 0 (0.0%) | 0 (0.0%) |
| 3 or 4 Unit Apartments | 0 (0.0%) | 11 (100.0%) |
| 5 to 9 Unit Apartments | 0 (0.0%) | 0 (0.0%) |
| 10 or more Apartments | 0 (0.0%) | 0 (0.0%) |
| Mobile Home / Other | 33 (100.0%) | 0 (0.0%) |
| Total | 140 (92.7%) | 11 (7.3%) |
Housing Structures by Number of Rooms in Mooers
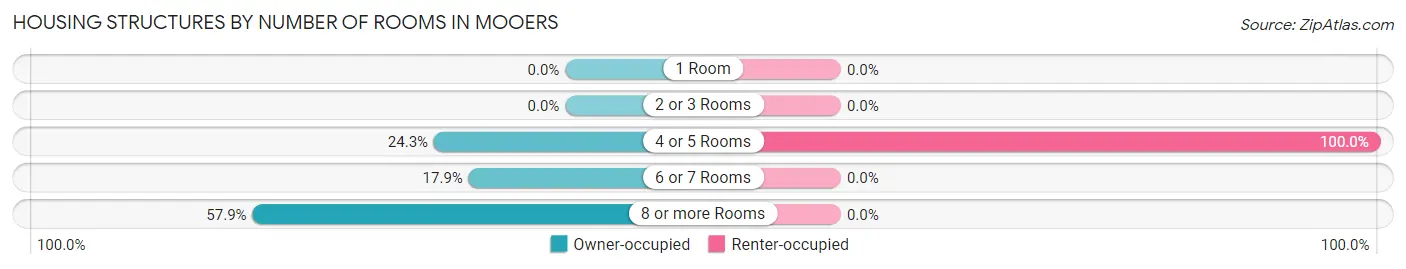
| Number of Rooms | Owner-occupied | Renter-occupied |
| 1 Room | 0 (0.0%) | 0 (0.0%) |
| 2 or 3 Rooms | 0 (0.0%) | 0 (0.0%) |
| 4 or 5 Rooms | 34 (24.3%) | 11 (100.0%) |
| 6 or 7 Rooms | 25 (17.9%) | 0 (0.0%) |
| 8 or more Rooms | 81 (57.9%) | 0 (0.0%) |
| Total | 140 (100.0%) | 11 (100.0%) |
Housing Structure by Heating Type in Mooers
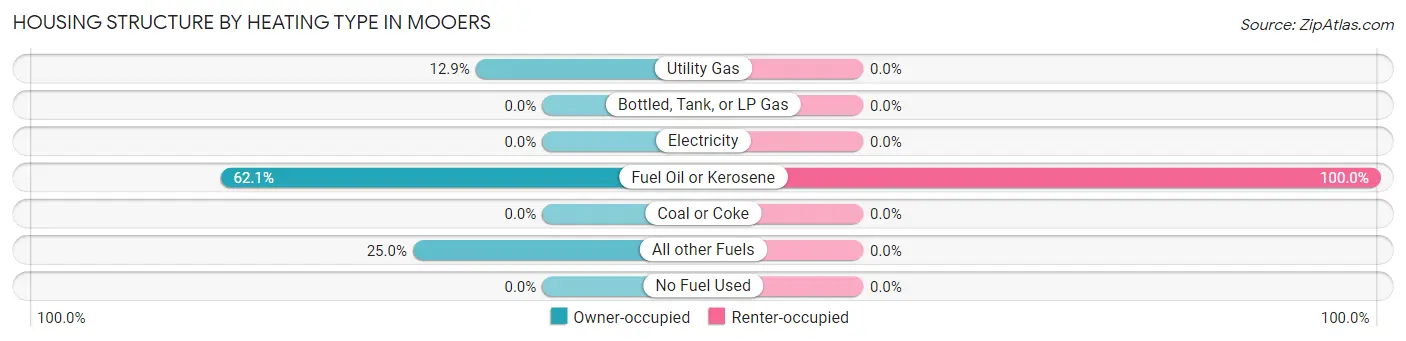
| Heating Type | Owner-occupied | Renter-occupied |
| Utility Gas | 18 (12.9%) | 0 (0.0%) |
| Bottled, Tank, or LP Gas | 0 (0.0%) | 0 (0.0%) |
| Electricity | 0 (0.0%) | 0 (0.0%) |
| Fuel Oil or Kerosene | 87 (62.1%) | 11 (100.0%) |
| Coal or Coke | 0 (0.0%) | 0 (0.0%) |
| All other Fuels | 35 (25.0%) | 0 (0.0%) |
| No Fuel Used | 0 (0.0%) | 0 (0.0%) |
| Total | 140 (100.0%) | 11 (100.0%) |
Household Vehicle Usage in Mooers
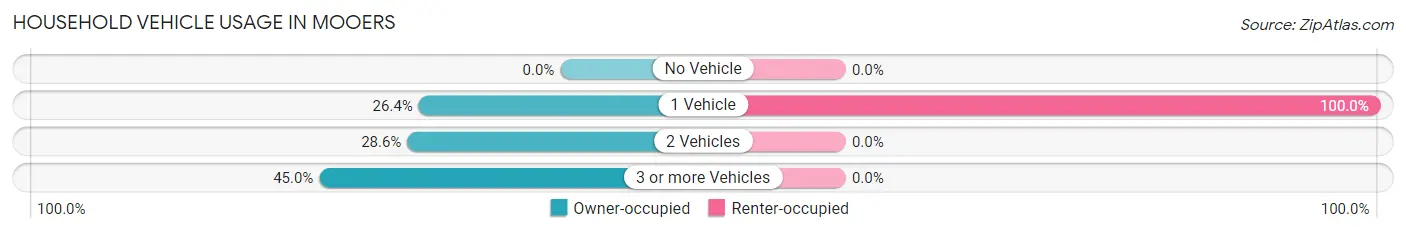
| Vehicles per Household | Owner-occupied | Renter-occupied |
| No Vehicle | 0 (0.0%) | 0 (0.0%) |
| 1 Vehicle | 37 (26.4%) | 11 (100.0%) |
| 2 Vehicles | 40 (28.6%) | 0 (0.0%) |
| 3 or more Vehicles | 63 (45.0%) | 0 (0.0%) |
| Total | 140 (100.0%) | 11 (100.0%) |
Real Estate & Mortgages in Mooers
Real Estate and Mortgage Overview in Mooers
| Characteristic | Without Mortgage | With Mortgage |
| Housing Units | 72 | 68 |
| Median Property Value | $117,000 | $156,000 |
| Median Household Income | $66,700 | $0 |
| Monthly Housing Costs | $668 | $0 |
| Real Estate Taxes | - | - |
Property Value by Mortgage Status in Mooers
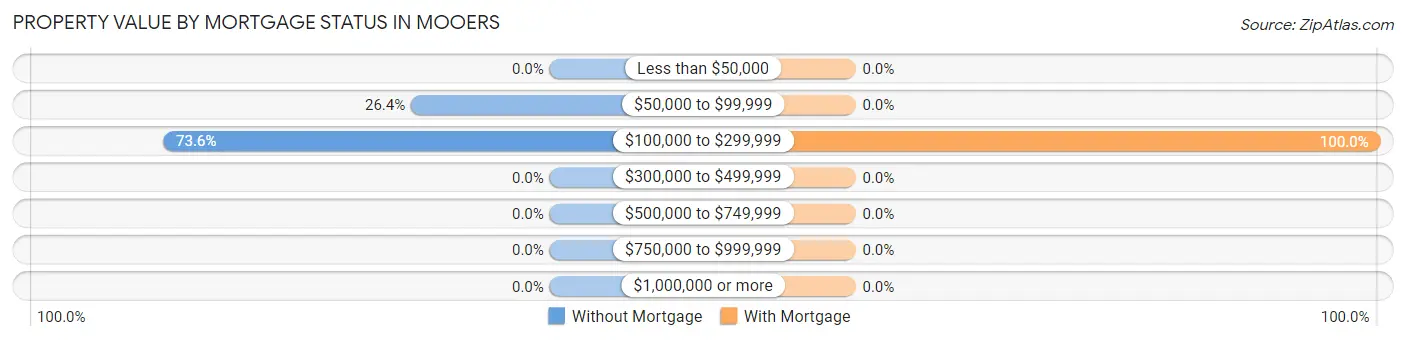
| Property Value | Without Mortgage | With Mortgage |
| Less than $50,000 | 0 (0.0%) | 0 (0.0%) |
| $50,000 to $99,999 | 19 (26.4%) | 0 (0.0%) |
| $100,000 to $299,999 | 53 (73.6%) | 68 (100.0%) |
| $300,000 to $499,999 | 0 (0.0%) | 0 (0.0%) |
| $500,000 to $749,999 | 0 (0.0%) | 0 (0.0%) |
| $750,000 to $999,999 | 0 (0.0%) | 0 (0.0%) |
| $1,000,000 or more | 0 (0.0%) | 0 (0.0%) |
| Total | 72 (100.0%) | 68 (100.0%) |
Household Income by Mortgage Status in Mooers
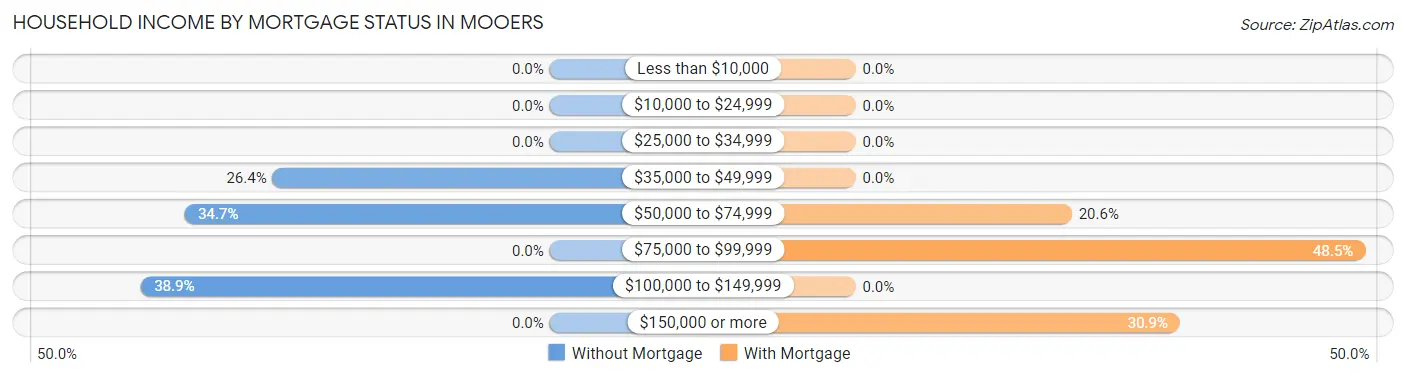
| Household Income | Without Mortgage | With Mortgage |
| Less than $10,000 | 0 (0.0%) | 0 (0.0%) |
| $10,000 to $24,999 | 0 (0.0%) | 0 (0.0%) |
| $25,000 to $34,999 | 0 (0.0%) | 0 (0.0%) |
| $35,000 to $49,999 | 19 (26.4%) | 0 (0.0%) |
| $50,000 to $74,999 | 25 (34.7%) | 14 (20.6%) |
| $75,000 to $99,999 | 0 (0.0%) | 33 (48.5%) |
| $100,000 to $149,999 | 28 (38.9%) | 0 (0.0%) |
| $150,000 or more | 0 (0.0%) | 21 (30.9%) |
| Total | 72 (100.0%) | 68 (100.0%) |
Property Value to Household Income Ratio in Mooers
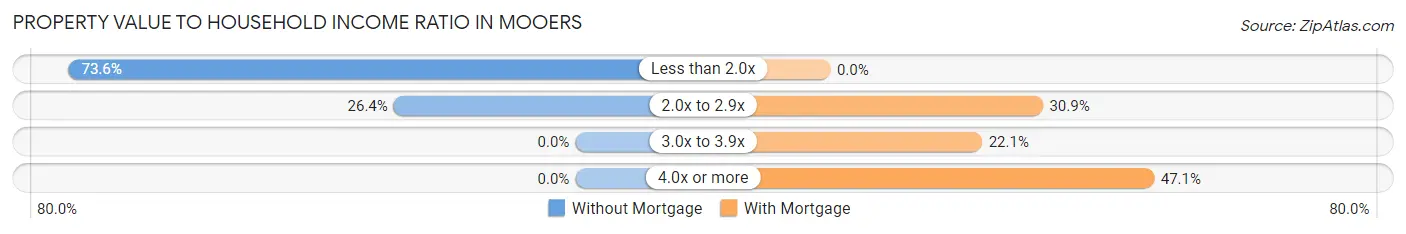
| Value-to-Income Ratio | Without Mortgage | With Mortgage |
| Less than 2.0x | 53 (73.6%) | 0 (0.0%) |
| 2.0x to 2.9x | 19 (26.4%) | 21 (30.9%) |
| 3.0x to 3.9x | 0 (0.0%) | 15 (22.1%) |
| 4.0x or more | 0 (0.0%) | 32 (47.1%) |
| Total | 72 (100.0%) | 68 (100.0%) |
Real Estate Taxes by Mortgage Status in Mooers
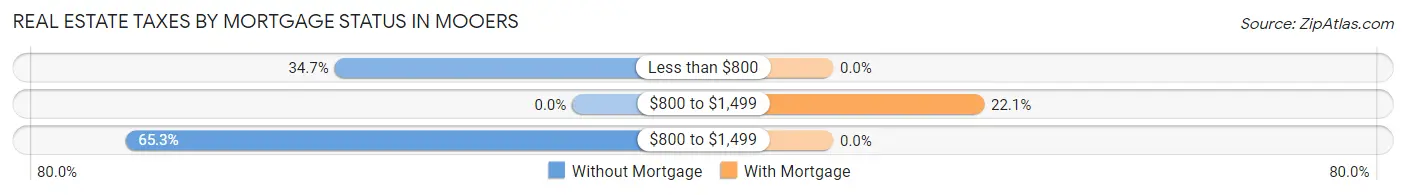
| Property Taxes | Without Mortgage | With Mortgage |
| Less than $800 | 25 (34.7%) | 0 (0.0%) |
| $800 to $1,499 | 0 (0.0%) | 15 (22.1%) |
| $800 to $1,499 | 47 (65.3%) | 0 (0.0%) |
| Total | 72 (100.0%) | 68 (100.0%) |
Health & Disability in Mooers
Health Insurance Coverage by Age in Mooers
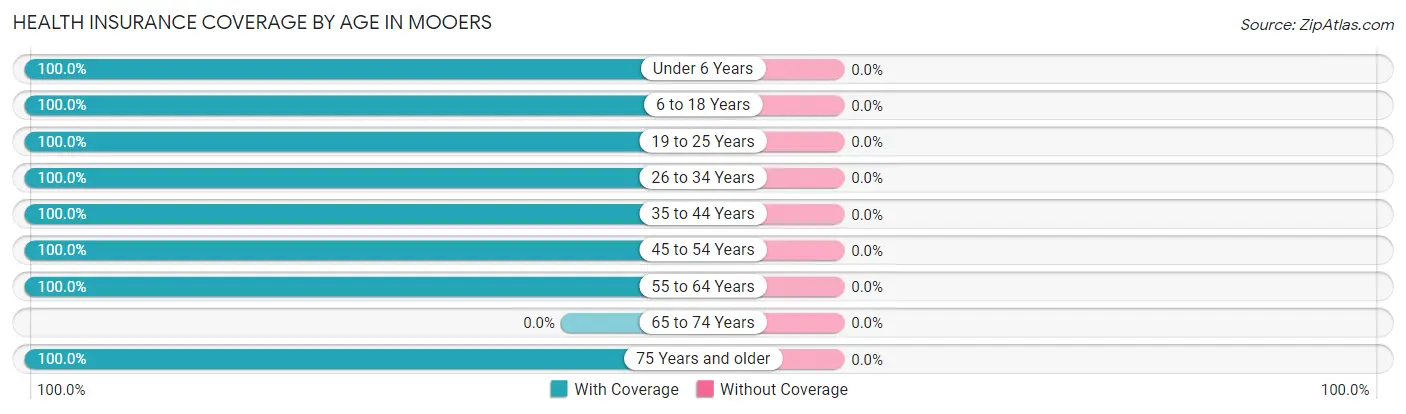
| Age Bracket | With Coverage | Without Coverage |
| Under 6 Years | 25 (100.0%) | 0 (0.0%) |
| 6 to 18 Years | 99 (100.0%) | 0 (0.0%) |
| 19 to 25 Years | 108 (100.0%) | 0 (0.0%) |
| 26 to 34 Years | 30 (100.0%) | 0 (0.0%) |
| 35 to 44 Years | 79 (100.0%) | 0 (0.0%) |
| 45 to 54 Years | 91 (100.0%) | 0 (0.0%) |
| 55 to 64 Years | 28 (100.0%) | 0 (0.0%) |
| 65 to 74 Years | 0 (0.0%) | 0 (0.0%) |
| 75 Years and older | 64 (100.0%) | 0 (0.0%) |
| Total | 524 (100.0%) | 0 (0.0%) |
Health Insurance Coverage by Citizenship Status in Mooers
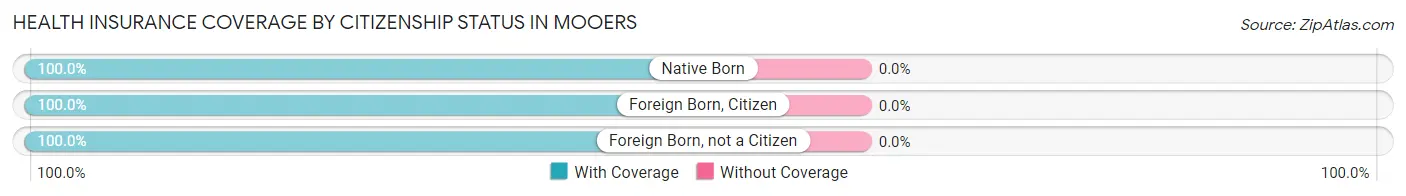
| Citizenship Status | With Coverage | Without Coverage |
| Native Born | 25 (100.0%) | 0 (0.0%) |
| Foreign Born, Citizen | 99 (100.0%) | 0 (0.0%) |
| Foreign Born, not a Citizen | 108 (100.0%) | 0 (0.0%) |
Health Insurance Coverage by Household Income in Mooers
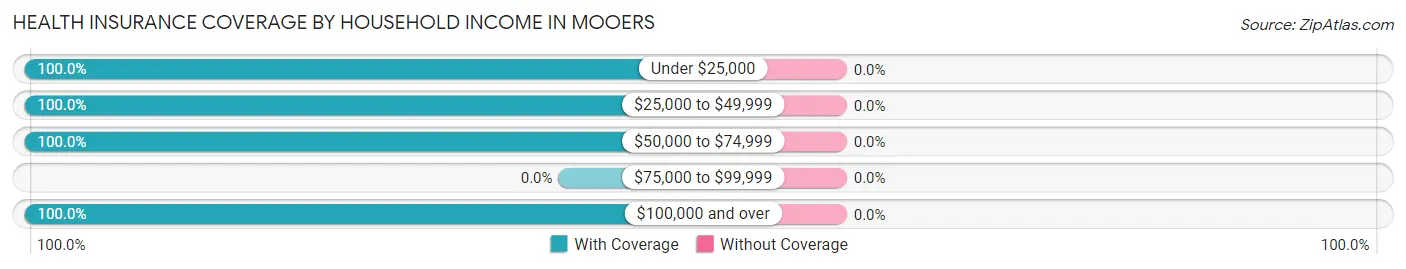
| Household Income | With Coverage | Without Coverage |
| Under $25,000 | 45 (100.0%) | 0 (0.0%) |
| $25,000 to $49,999 | 45 (100.0%) | 0 (0.0%) |
| $50,000 to $74,999 | 255 (100.0%) | 0 (0.0%) |
| $75,000 to $99,999 | 0 (0.0%) | 0 (0.0%) |
| $100,000 and over | 179 (100.0%) | 0 (0.0%) |
Public vs Private Health Insurance Coverage by Age in Mooers
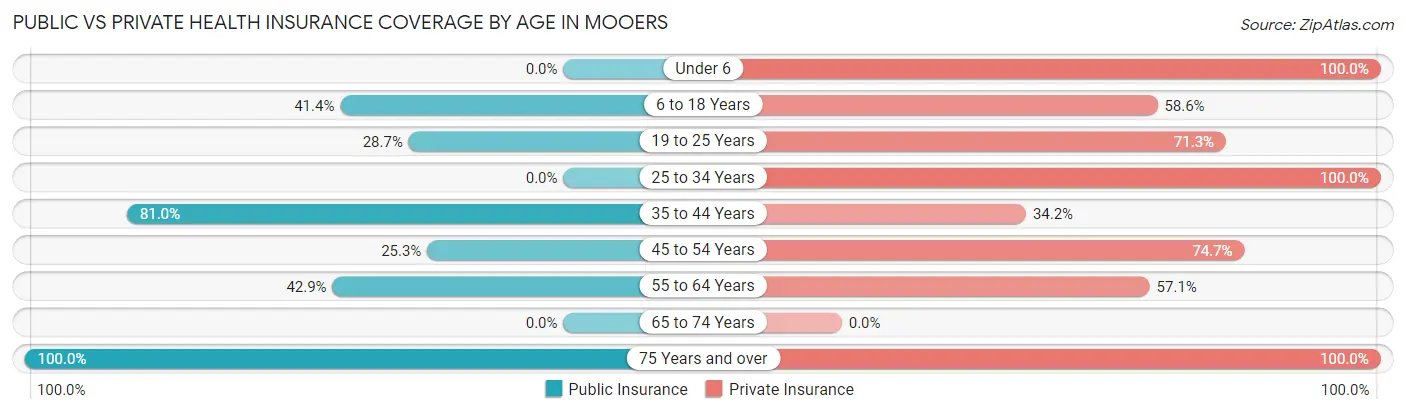
| Age Bracket | Public Insurance | Private Insurance |
| Under 6 | 0 (0.0%) | 25 (100.0%) |
| 6 to 18 Years | 41 (41.4%) | 58 (58.6%) |
| 19 to 25 Years | 31 (28.7%) | 77 (71.3%) |
| 25 to 34 Years | 0 (0.0%) | 30 (100.0%) |
| 35 to 44 Years | 64 (81.0%) | 27 (34.2%) |
| 45 to 54 Years | 23 (25.3%) | 68 (74.7%) |
| 55 to 64 Years | 12 (42.9%) | 16 (57.1%) |
| 65 to 74 Years | 0 (0.0%) | 0 (0.0%) |
| 75 Years and over | 64 (100.0%) | 64 (100.0%) |
| Total | 235 (44.9%) | 365 (69.7%) |
Disability Status by Sex by Age in Mooers
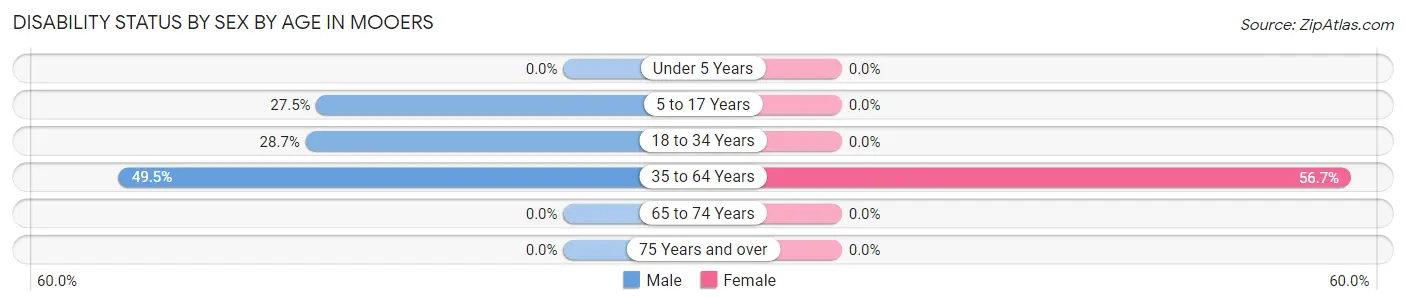
| Age Bracket | Male | Female |
| Under 5 Years | 0 (0.0%) | 0 (0.0%) |
| 5 to 17 Years | 22 (27.5%) | 0 (0.0%) |
| 18 to 34 Years | 31 (28.7%) | 0 (0.0%) |
| 35 to 64 Years | 50 (49.5%) | 55 (56.7%) |
| 65 to 74 Years | 0 (0.0%) | 0 (0.0%) |
| 75 Years and over | 0 (0.0%) | 0 (0.0%) |
Disability Class by Sex by Age in Mooers
Disability Class: Hearing Difficulty
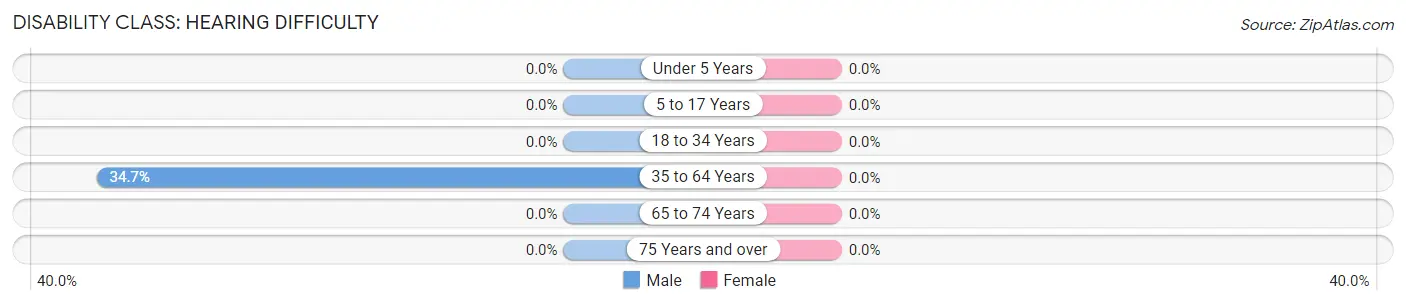
| Age Bracket | Male | Female |
| Under 5 Years | 0 (0.0%) | 0 (0.0%) |
| 5 to 17 Years | 0 (0.0%) | 0 (0.0%) |
| 18 to 34 Years | 0 (0.0%) | 0 (0.0%) |
| 35 to 64 Years | 35 (34.6%) | 0 (0.0%) |
| 65 to 74 Years | 0 (0.0%) | 0 (0.0%) |
| 75 Years and over | 0 (0.0%) | 0 (0.0%) |
Disability Class: Vision Difficulty
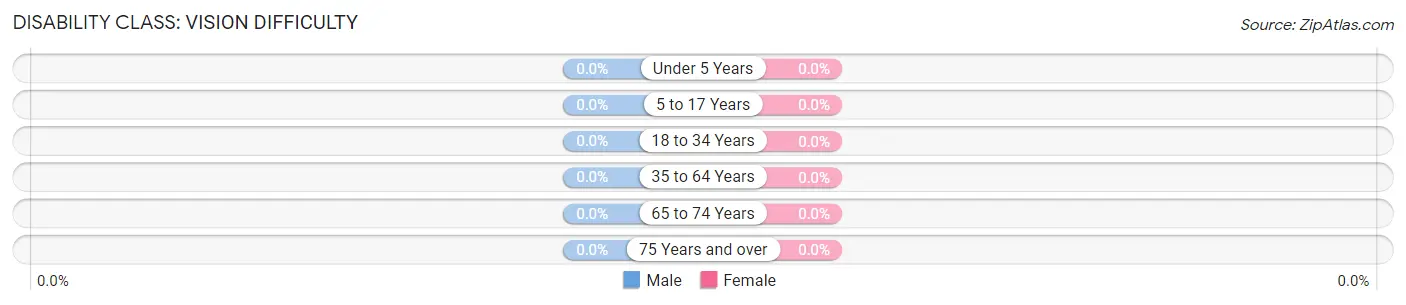
| Age Bracket | Male | Female |
| Under 5 Years | 0 (0.0%) | 0 (0.0%) |
| 5 to 17 Years | 0 (0.0%) | 0 (0.0%) |
| 18 to 34 Years | 0 (0.0%) | 0 (0.0%) |
| 35 to 64 Years | 0 (0.0%) | 0 (0.0%) |
| 65 to 74 Years | 0 (0.0%) | 0 (0.0%) |
| 75 Years and over | 0 (0.0%) | 0 (0.0%) |
Disability Class: Cognitive Difficulty
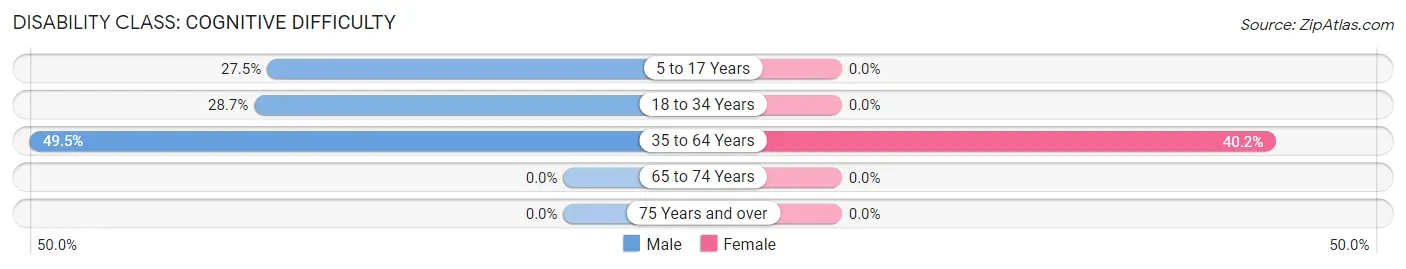
| Age Bracket | Male | Female |
| 5 to 17 Years | 22 (27.5%) | 0 (0.0%) |
| 18 to 34 Years | 31 (28.7%) | 0 (0.0%) |
| 35 to 64 Years | 50 (49.5%) | 39 (40.2%) |
| 65 to 74 Years | 0 (0.0%) | 0 (0.0%) |
| 75 Years and over | 0 (0.0%) | 0 (0.0%) |
Disability Class: Ambulatory Difficulty
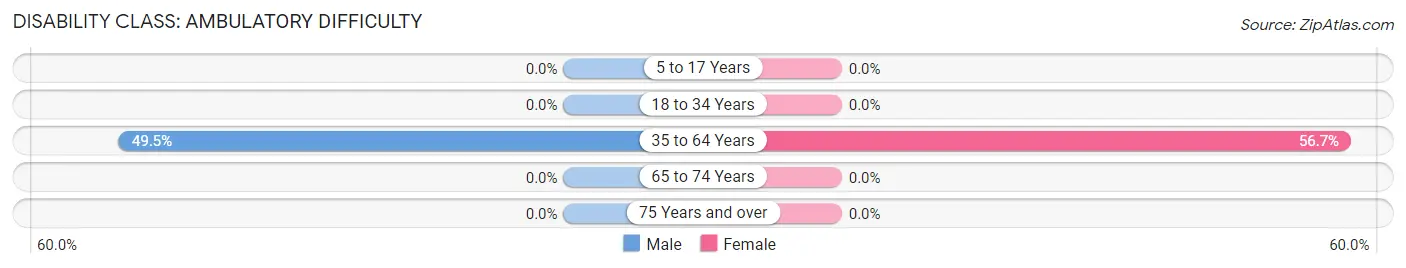
| Age Bracket | Male | Female |
| 5 to 17 Years | 0 (0.0%) | 0 (0.0%) |
| 18 to 34 Years | 0 (0.0%) | 0 (0.0%) |
| 35 to 64 Years | 50 (49.5%) | 55 (56.7%) |
| 65 to 74 Years | 0 (0.0%) | 0 (0.0%) |
| 75 Years and over | 0 (0.0%) | 0 (0.0%) |
Disability Class: Self-Care Difficulty
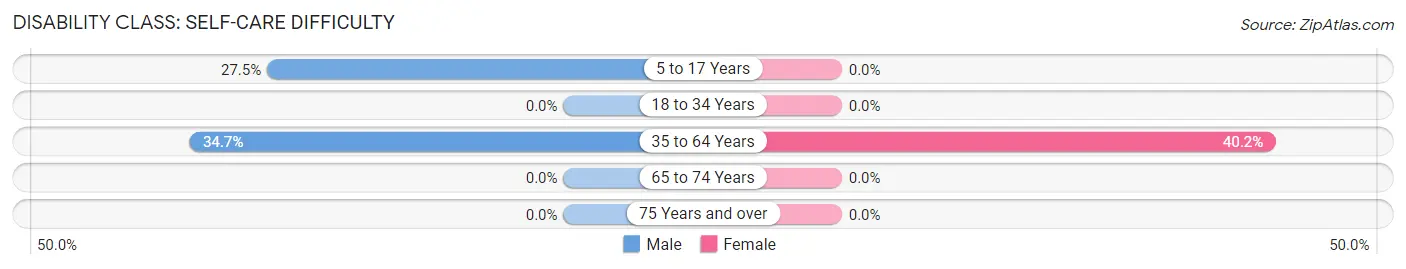
| Age Bracket | Male | Female |
| 5 to 17 Years | 22 (27.5%) | 0 (0.0%) |
| 18 to 34 Years | 0 (0.0%) | 0 (0.0%) |
| 35 to 64 Years | 35 (34.6%) | 39 (40.2%) |
| 65 to 74 Years | 0 (0.0%) | 0 (0.0%) |
| 75 Years and over | 0 (0.0%) | 0 (0.0%) |
Technology Access in Mooers
Computing Device Access in Mooers
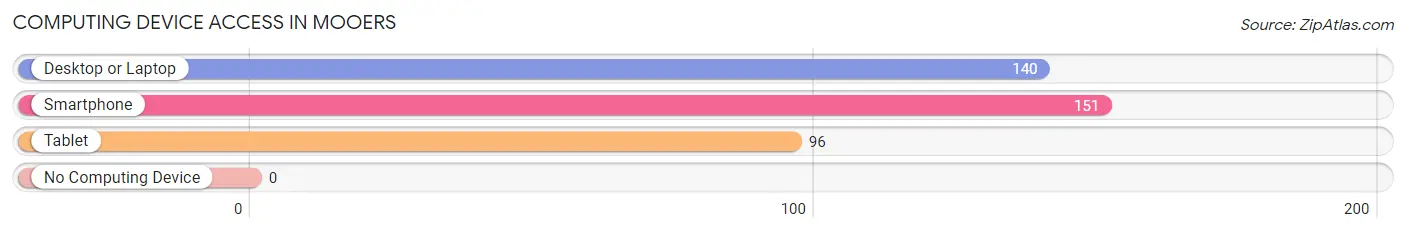
| Device Type | # Households | % Households |
| Desktop or Laptop | 140 | 92.7% |
| Smartphone | 151 | 100.0% |
| Tablet | 96 | 63.6% |
| No Computing Device | 0 | 0.0% |
| Total | 151 | 100.0% |
Internet Access in Mooers
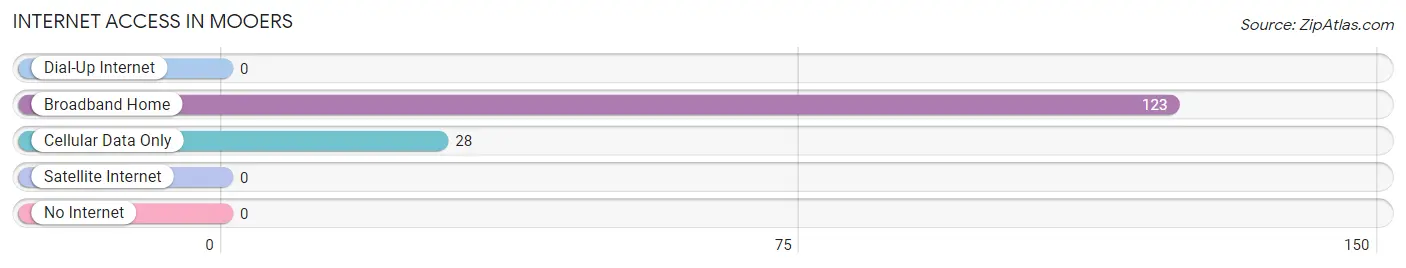
| Internet Type | # Households | % Households |
| Dial-Up Internet | 0 | 0.0% |
| Broadband Home | 123 | 81.5% |
| Cellular Data Only | 28 | 18.5% |
| Satellite Internet | 0 | 0.0% |
| No Internet | 0 | 0.0% |
| Total | 151 | 100.0% |
Mooers Summary
Mooers is a town located in Clinton County, New York, United States. The population was 2,845 at the 2010 census. The town is named after an early settler, John Mooers.
Geography
Mooers is located in the northeast corner of Clinton County, bordered by the towns of Altona to the north, Chazy to the east, and Mooers Forks to the south. The town is located on the Canada–US border, with the Canadian province of Quebec to the north. The town is located on the Salmon River, which flows through the town from east to west.
The town is located in the Adirondack Mountains, with the highest point in the town being an unnamed peak in the northern part of the town, at an elevation of 2,890 feet (881 m).
Demographics
As of the census of 2000, there were 2,845 people, 1,093 households, and 790 families residing in the town. The population density was 33.3 people per square mile (12.9/km^2). There were 1,521 housing units at an average density of 17.9 per square mile (6.9/km^2). The racial makeup of the town was 97.90% White, 0.21% African American, 0.53% Native American, 0.14% Asian, 0.11% Pacific Islander, 0.21% from other races, and 0.90% from two or more races. Hispanic or Latino of any race were 0.53% of the population.
There were 1,093 households, out of which 33.2% had children under the age of 18 living with them, 57.2% were married couples living together, 9.7% had a female householder with no husband present, and 28.2% were non-families. 22.7% of all households were made up of individuals, and 9.2% had someone living alone who was 65 years of age or older. The average household size was 2.60 and the average family size was 3.03.
In the town, the population was spread out, with 26.2% under the age of 18, 7.2% from 18 to 24, 28.7% from 25 to 44, 24.2% from 45 to 64, and 13.7% who were 65 years of age or older. The median age was 38 years. For every 100 females, there were 97.2 males. For every 100 females age 18 and over, there were 95.2 males.
The median income for a household in the town was $35,938, and the median income for a family was $41,250. Males had a median income of $30,938 versus $21,964 for females. The per capita income for the town was $16,845. About 8.2% of families and 11.2% of the population were below the poverty line, including 14.2% of those under age 18 and 8.2% of those age 65 or over.
Economy
Mooers is a rural town with a primarily agricultural economy. The town is home to several dairy farms, as well as a number of other farms that produce a variety of crops. The town is also home to a number of small businesses, including a few restaurants, a grocery store, and a few other retail stores.
The town is also home to a number of small manufacturing businesses, including a furniture manufacturer, a woodworking shop, and a metal fabrication shop. The town is also home to a number of logging and lumber companies, as well as a number of logging and lumber-related businesses.
The town is also home to a number of tourist attractions, including a number of campgrounds, a golf course, and a number of other outdoor recreational activities. The town is also home to a number of historic sites, including a number of old churches and a number of old homes.
Conclusion
Mooers is a small town located in the northeast corner of Clinton County, New York. The town is located on the Canada–US border, with the Canadian province of Quebec to the north. The town is located in the Adirondack Mountains, and is home to a primarily agricultural economy. The town is also home to a number of small businesses, as well as a number of tourist attractions and historic sites. The population of the town was 2,845 at the 2010 census.
Common Questions
What is Per Capita Income in Mooers?
Per Capita income in Mooers is $20,294.
What is the Median Family Income in Mooers?
Median Family Income in Mooers is $65,800.
What is the Median Household income in Mooers?
Median Household Income in Mooers is $59,886.
What is Inequality or Gini Index in Mooers?
Inequality or Gini Index in Mooers is 0.28.
What is the Total Population of Mooers?
Total Population of Mooers is 524.
What is the Total Male Population of Mooers?
Total Male Population of Mooers is 342.
What is the Total Female Population of Mooers?
Total Female Population of Mooers is 182.
What is the Ratio of Males per 100 Females in Mooers?
There are 187.91 Males per 100 Females in Mooers.
What is the Ratio of Females per 100 Males in Mooers?
There are 53.22 Females per 100 Males in Mooers.
What is the Median Population Age in Mooers?
Median Population Age in Mooers is 34.5 Years.
What is the Average Family Size in Mooers
Average Family Size in Mooers is 3.6 People.
What is the Average Household Size in Mooers
Average Household Size in Mooers is 3.5 People.
How Large is the Labor Force in Mooers?
There are 271 People in the Labor Forcein in Mooers.
What is the Percentage of People in the Labor Force in Mooers?
64.2% of People are in the Labor Force in Mooers.
What is the Unemployment Rate in Mooers?
Unemployment Rate in Mooers is 11.4%.