Cities with the Highest Percentage of Population Employed in Retail Trade in New York
RELATED REPORTS & OPTIONS
Retail Trade
New York
Compare Cities
Map of Cities with the Highest Percentage of Population Employed in Retail Trade in New York
0.0%
80.0%
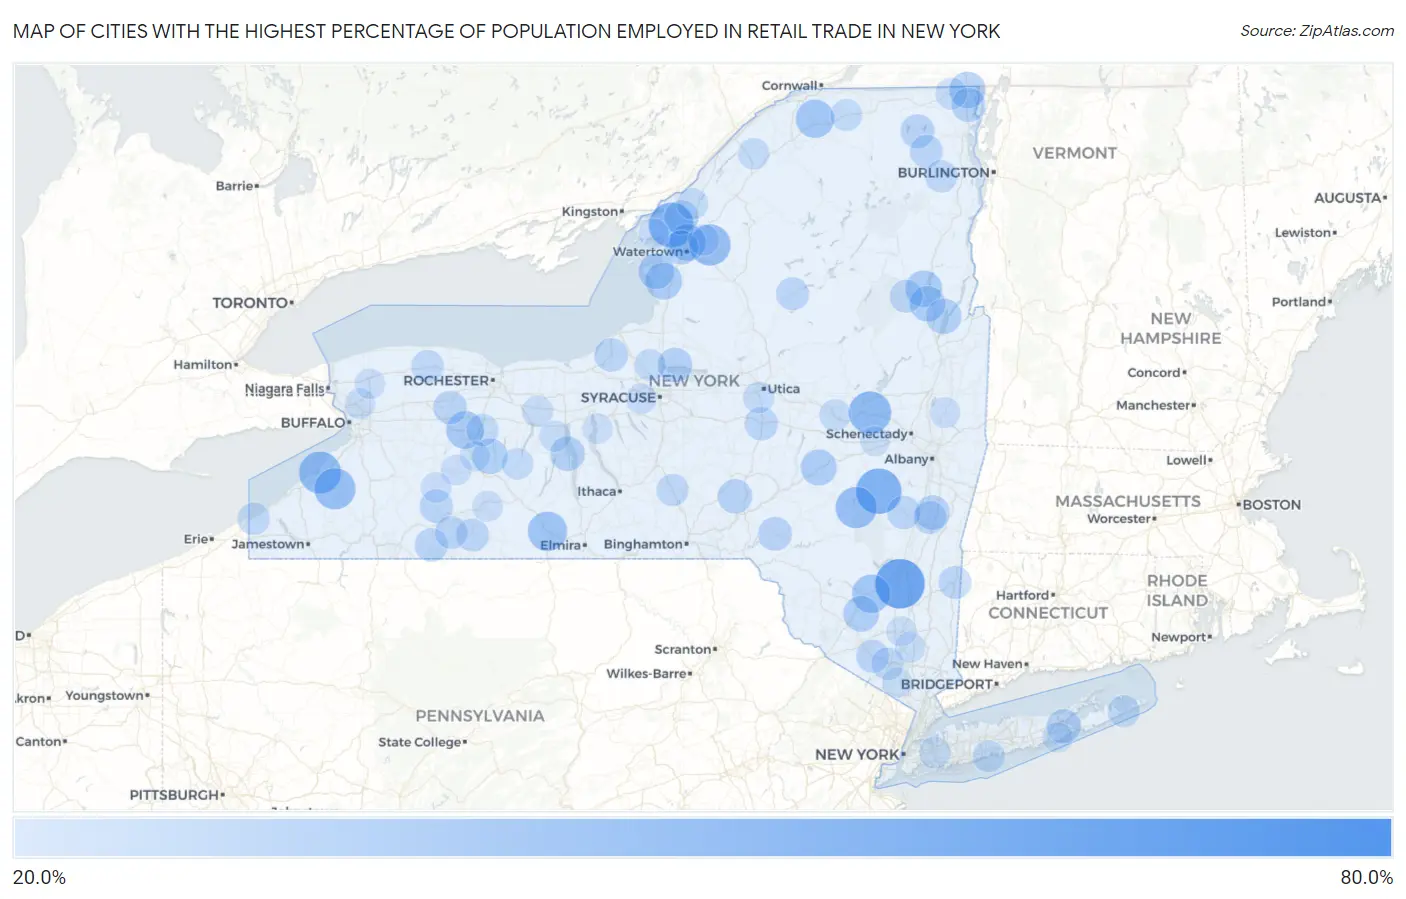
Cities with the Highest Percentage of Population Employed in Retail Trade in New York
| City | % Employed | vs State | vs National | |
| 1. | Mongaup Valley | 68.3% | 9.8% (+58.5)#1 | 11.0% (+57.3)#99 |
| 2. | Springfield Center | 57.3% | 9.8% (+47.5)#2 | 11.0% (+46.3)#171 |
| 3. | Rifton | 54.7% | 9.8% (+44.8)#3 | 11.0% (+43.7)#195 |
| 4. | South Cairo | 54.5% | 9.8% (+44.6)#4 | 11.0% (+43.5)#198 |
| 5. | Preston Potter Hollow | 47.6% | 9.8% (+37.7)#5 | 11.0% (+36.6)#291 |
| 6. | Depauville | 46.4% | 9.8% (+36.5)#6 | 11.0% (+35.4)#309 |
| 7. | Tribes Hill | 41.9% | 9.8% (+32.1)#7 | 11.0% (+30.9)#423 |
| 8. | Sunset Bay | 41.2% | 9.8% (+31.3)#8 | 11.0% (+30.2)#444 |
| 9. | Great Bend | 40.0% | 9.8% (+30.2)#9 | 11.0% (+29.0)#474 |
| 10. | Prattsville | 40.0% | 9.8% (+30.2)#10 | 11.0% (+29.0)#479 |
| 11. | Perrysburg | 39.5% | 9.8% (+29.7)#11 | 11.0% (+28.5)#497 |
| 12. | Schuyler Lake | 39.1% | 9.8% (+29.3)#12 | 11.0% (+28.1)#510 |
| 13. | Coopers Plains | 36.4% | 9.8% (+26.6)#13 | 11.0% (+25.4)#621 |
| 14. | East Durham | 36.0% | 9.8% (+26.2)#14 | 11.0% (+25.0)#643 |
| 15. | Kerhonkson | 34.7% | 9.8% (+24.8)#15 | 11.0% (+23.7)#711 |
| 16. | Brasher Falls | 34.6% | 9.8% (+24.8)#16 | 11.0% (+23.6)#715 |
| 17. | Piffard | 33.3% | 9.8% (+23.5)#17 | 11.0% (+22.3)#778 |
| 18. | Mclean | 33.2% | 9.8% (+23.3)#18 | 11.0% (+22.2)#818 |
| 19. | Pamelia Center | 32.0% | 9.8% (+22.2)#19 | 11.0% (+21.0)#904 |
| 20. | Belleville | 31.9% | 9.8% (+22.0)#20 | 11.0% (+20.9)#915 |
| 21. | Pottersville | 31.6% | 9.8% (+21.8)#21 | 11.0% (+20.7)#926 |
| 22. | Champlain | 31.1% | 9.8% (+21.3)#22 | 11.0% (+20.1)#967 |
| 23. | Worcester | 30.7% | 9.8% (+20.8)#23 | 11.0% (+19.7)#1,003 |
| 24. | Henderson | 30.3% | 9.8% (+20.5)#24 | 11.0% (+19.3)#1,032 |
| 25. | Niagara University | 30.2% | 9.8% (+20.4)#25 | 11.0% (+19.2)#1,036 |
| 26. | Walker Valley | 30.0% | 9.8% (+20.2)#26 | 11.0% (+19.1)#1,054 |
| 27. | Chestertown | 29.9% | 9.8% (+20.0)#27 | 11.0% (+18.9)#1,074 |
| 28. | Websters Crossing | 29.7% | 9.8% (+19.8)#28 | 11.0% (+18.7)#1,094 |
| 29. | Bolton Landing | 29.5% | 9.8% (+19.7)#29 | 11.0% (+18.5)#1,118 |
| 30. | Dresden | 28.3% | 9.8% (+18.5)#30 | 11.0% (+17.3)#1,252 |
| 31. | Constantia | 28.2% | 9.8% (+18.3)#31 | 11.0% (+17.2)#1,267 |
| 32. | Stottville | 28.0% | 9.8% (+18.2)#32 | 11.0% (+17.0)#1,287 |
| 33. | Guilford | 27.8% | 9.8% (+18.0)#33 | 11.0% (+16.9)#1,305 |
| 34. | Chazy | 27.7% | 9.8% (+17.9)#34 | 11.0% (+16.7)#1,323 |
| 35. | Flanders | 27.7% | 9.8% (+17.9)#35 | 11.0% (+16.7)#1,326 |
| 36. | Marcy | 27.6% | 9.8% (+17.8)#36 | 11.0% (+16.6)#1,340 |
| 37. | La Fargeville | 27.5% | 9.8% (+17.6)#37 | 11.0% (+16.5)#1,353 |
| 38. | Glen Park | 27.4% | 9.8% (+17.5)#38 | 11.0% (+16.4)#1,359 |
| 39. | Lyon Mountain | 27.1% | 9.8% (+17.3)#39 | 11.0% (+16.2)#1,396 |
| 40. | North Bay | 27.1% | 9.8% (+17.3)#40 | 11.0% (+16.1)#1,402 |
| 41. | Walton | 27.0% | 9.8% (+17.2)#41 | 11.0% (+16.0)#1,418 |
| 42. | Belfast | 26.4% | 9.8% (+16.6)#42 | 11.0% (+15.4)#1,494 |
| 43. | Le Roy | 26.4% | 9.8% (+16.5)#43 | 11.0% (+15.4)#1,504 |
| 44. | Cairo | 26.1% | 9.8% (+16.3)#44 | 11.0% (+15.2)#1,527 |
| 45. | Hannibal | 26.1% | 9.8% (+16.3)#45 | 11.0% (+15.1)#1,531 |
| 46. | Richburg | 26.0% | 9.8% (+16.2)#46 | 11.0% (+15.0)#1,551 |
| 47. | Bridgewater | 25.9% | 9.8% (+16.0)#47 | 11.0% (+14.9)#1,576 |
| 48. | Lorenz Park | 25.5% | 9.8% (+15.7)#48 | 11.0% (+14.5)#1,630 |
| 49. | Old Forge | 25.4% | 9.8% (+15.6)#49 | 11.0% (+14.4)#1,652 |
| 50. | Redford | 25.3% | 9.8% (+15.5)#50 | 11.0% (+14.4)#1,667 |
| 51. | North Creek | 25.3% | 9.8% (+15.5)#51 | 11.0% (+14.3)#1,676 |
| 52. | Andover | 25.3% | 9.8% (+15.4)#52 | 11.0% (+14.3)#1,681 |
| 53. | Chester | 25.3% | 9.8% (+15.4)#53 | 11.0% (+14.3)#1,684 |
| 54. | Barryville | 25.2% | 9.8% (+15.3)#54 | 11.0% (+14.2)#1,694 |
| 55. | Amenia | 25.1% | 9.8% (+15.3)#55 | 11.0% (+14.1)#1,714 |
| 56. | Scio | 25.0% | 9.8% (+15.2)#56 | 11.0% (+14.0)#1,725 |
| 57. | East Worcester | 24.6% | 9.8% (+14.8)#57 | 11.0% (+13.6)#1,827 |
| 58. | Albion | 24.6% | 9.8% (+14.8)#58 | 11.0% (+13.6)#1,830 |
| 59. | Au Sable Forks | 24.5% | 9.8% (+14.7)#59 | 11.0% (+13.5)#1,860 |
| 60. | Harriman | 24.4% | 9.8% (+14.6)#60 | 11.0% (+13.4)#1,875 |
| 61. | Ripley | 24.2% | 9.8% (+14.4)#61 | 11.0% (+13.2)#1,908 |
| 62. | Marathon | 24.2% | 9.8% (+14.4)#62 | 11.0% (+13.2)#1,910 |
| 63. | Lakeville | 24.1% | 9.8% (+14.3)#63 | 11.0% (+13.1)#1,932 |
| 64. | Napeague | 24.1% | 9.8% (+14.3)#64 | 11.0% (+13.1)#1,946 |
| 65. | Akwesasne | 23.9% | 9.8% (+14.1)#65 | 11.0% (+13.0)#1,977 |
| 66. | Brushton | 23.6% | 9.8% (+13.8)#66 | 11.0% (+12.6)#2,056 |
| 67. | Nassau Lake | 23.5% | 9.8% (+13.7)#67 | 11.0% (+12.5)#2,088 |
| 68. | West Bay Shore | 23.4% | 9.8% (+13.6)#68 | 11.0% (+12.4)#2,115 |
| 69. | Mooers | 23.3% | 9.8% (+13.5)#69 | 11.0% (+12.3)#2,142 |
| 70. | Mount Vision | 23.3% | 9.8% (+13.5)#70 | 11.0% (+12.3)#2,146 |
| 71. | Bellerose Terrace | 23.3% | 9.8% (+13.4)#71 | 11.0% (+12.3)#2,159 |
| 72. | Naples | 23.2% | 9.8% (+13.3)#72 | 11.0% (+12.2)#2,178 |
| 73. | Plessis | 23.1% | 9.8% (+13.3)#73 | 11.0% (+12.1)#2,184 |
| 74. | Nelliston | 23.1% | 9.8% (+13.3)#74 | 11.0% (+12.1)#2,187 |
| 75. | Sand Ridge | 23.0% | 9.8% (+13.2)#75 | 11.0% (+12.0)#2,223 |
| 76. | Rosendale | 23.0% | 9.8% (+13.1)#76 | 11.0% (+12.0)#2,233 |
| 77. | Rensselaer Falls | 22.8% | 9.8% (+13.0)#77 | 11.0% (+11.8)#2,273 |
| 78. | Chelsea Cove | 22.7% | 9.8% (+12.9)#78 | 11.0% (+11.7)#2,296 |
| 79. | Washington Mills | 22.7% | 9.8% (+12.9)#79 | 11.0% (+11.7)#2,304 |
| 80. | Shortsville | 22.5% | 9.8% (+12.7)#80 | 11.0% (+11.5)#2,353 |
| 81. | Fort Drum | 22.2% | 9.8% (+12.3)#81 | 11.0% (+11.2)#2,460 |
| 82. | Hall | 22.1% | 9.8% (+12.3)#82 | 11.0% (+11.1)#2,474 |
| 83. | Ruby | 22.1% | 9.8% (+12.3)#83 | 11.0% (+11.1)#2,475 |
| 84. | Conesus | 22.0% | 9.8% (+12.2)#84 | 11.0% (+11.0)#2,491 |
| 85. | Camillus | 21.7% | 9.8% (+11.8)#85 | 11.0% (+10.7)#2,598 |
| 86. | Cold Spring | 21.6% | 9.8% (+11.8)#86 | 11.0% (+10.7)#2,607 |
| 87. | Hornell | 21.6% | 9.8% (+11.8)#87 | 11.0% (+10.6)#2,612 |
| 88. | Stillwater | 21.5% | 9.8% (+11.7)#88 | 11.0% (+10.5)#2,647 |
| 89. | University At Buffalo | 21.5% | 9.8% (+11.6)#89 | 11.0% (+10.5)#2,660 |
| 90. | Nunda | 21.4% | 9.8% (+11.5)#90 | 11.0% (+10.4)#2,708 |
| 91. | Fillmore | 21.3% | 9.8% (+11.5)#91 | 11.0% (+10.3)#2,718 |
| 92. | Three Mile Bay | 21.1% | 9.8% (+11.2)#92 | 11.0% (+10.1)#2,822 |
| 93. | South Lockport | 21.0% | 9.8% (+11.2)#93 | 11.0% (+10.0)#2,831 |
| 94. | Union Springs | 21.0% | 9.8% (+11.2)#94 | 11.0% (+9.99)#2,850 |
| 95. | Greenville Cdp Greene County | 20.8% | 9.8% (+11.0)#95 | 11.0% (+9.83)#2,913 |
| 96. | Groveland Station | 20.8% | 9.8% (+10.9)#96 | 11.0% (+9.78)#2,926 |
| 97. | Balmville | 20.8% | 9.8% (+10.9)#97 | 11.0% (+9.76)#2,932 |
| 98. | Pomona | 20.7% | 9.8% (+10.9)#98 | 11.0% (+9.72)#2,948 |
| 99. | Westhampton | 20.7% | 9.8% (+10.9)#99 | 11.0% (+9.69)#2,962 |
| 100. | Esperance | 20.6% | 9.8% (+10.8)#100 | 11.0% (+9.60)#2,999 |
Common Questions
What are the Top 10 Cities with the Highest Percentage of Population Employed in Retail Trade in New York?
Top 10 Cities with the Highest Percentage of Population Employed in Retail Trade in New York are:
#1
54.7%
#2
47.6%
#3
46.4%
#4
41.9%
#5
41.2%
#6
40.0%
#7
40.0%
#8
39.5%
#9
36.4%
#10
34.7%
What city has the Highest Percentage of Population Employed in Retail Trade in New York?
Rifton has the Highest Percentage of Population Employed in Retail Trade in New York with 54.7%.
What is the Percentage of Population Employed in Retail Trade in the State of New York?
Percentage of Population Employed in Retail Trade in New York is 9.8%.
What is the Percentage of Population Employed in Retail Trade in the United States?
Percentage of Population Employed in Retail Trade in the United States is 11.0%.