St Bonaventure, NY Map & Demographics
St Bonaventure Map
St Bonaventure Overview
$20,363
PER CAPITA INCOME
$78,500
AVG FAMILY INCOME
$52,992
AVG HOUSEHOLD INCOME
5.1%
WAGE / INCOME GAP [ % ]
94.9¢/ $1
WAGE / INCOME GAP [ $ ]
0.38
INEQUALITY / GINI INDEX
2,093
TOTAL POPULATION
1,015
MALE POPULATION
1,078
FEMALE POPULATION
94.16
MALES / 100 FEMALES
106.21
FEMALES / 100 MALES
20.9
MEDIAN AGE
2.7
AVG FAMILY SIZE
1.9
AVG HOUSEHOLD SIZE
764
LABOR FORCE [ PEOPLE ]
37.2%
PERCENT IN LABOR FORCE
5.6%
UNEMPLOYMENT RATE
Income in St Bonaventure
Income Overview in St Bonaventure
Per Capita Income in St Bonaventure is $20,363, while median incomes of families and households are $78,500 and $52,992 respectively.
| Characteristic | Number | Measure |
| Per Capita Income | 2,093 | $20,363 |
| Median Family Income | 170 | $78,500 |
| Mean Family Income | 170 | $90,252 |
| Median Household Income | 319 | $52,992 |
| Mean Household Income | 319 | $61,928 |
| Income Deficit | 170 | $0 |
| Wage / Income Gap (%) | 2,093 | 5.14% |
| Wage / Income Gap ($) | 2,093 | 94.86¢ per $1 |
| Gini / Inequality Index | 2,093 | 0.38 |
Earnings by Sex in St Bonaventure
Average Earnings in St Bonaventure are $6,560, $6,313 for men and $6,655 for women, a difference of 5.1%.
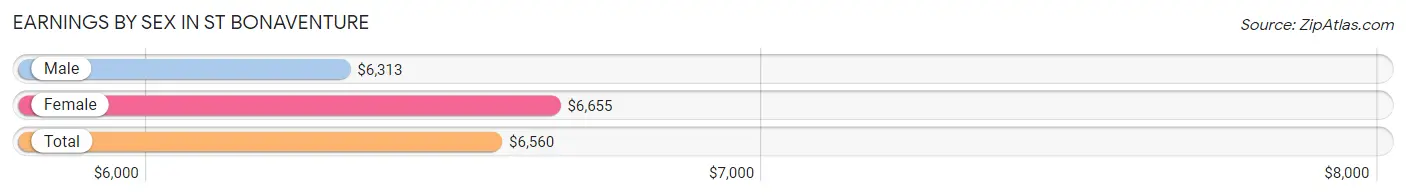
| Sex | Number | Average Earnings |
| Male | 596 (46.0%) | $6,313 |
| Female | 699 (54.0%) | $6,655 |
| Total | 1,295 (100.0%) | $6,560 |
Earnings by Sex by Income Bracket in St Bonaventure
The most common earnings brackets in St Bonaventure are $2,500 to $4,999 for men (141 | 23.7%) and $2,499 or less for women (161 | 23.0%).
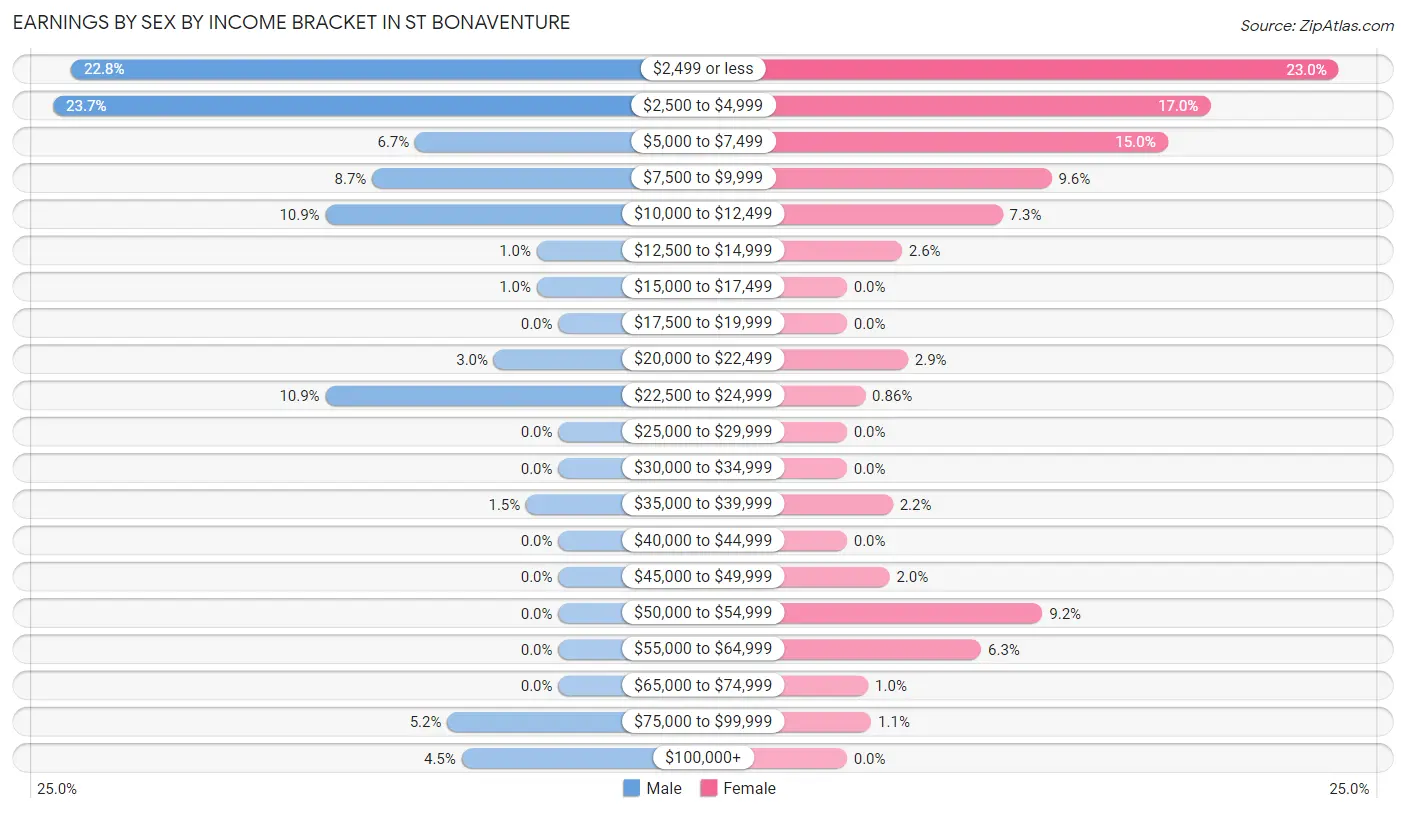
| Income | Male | Female |
| $2,499 or less | 136 (22.8%) | 161 (23.0%) |
| $2,500 to $4,999 | 141 (23.7%) | 119 (17.0%) |
| $5,000 to $7,499 | 40 (6.7%) | 105 (15.0%) |
| $7,500 to $9,999 | 52 (8.7%) | 67 (9.6%) |
| $10,000 to $12,499 | 65 (10.9%) | 51 (7.3%) |
| $12,500 to $14,999 | 6 (1.0%) | 18 (2.6%) |
| $15,000 to $17,499 | 6 (1.0%) | 0 (0.0%) |
| $17,500 to $19,999 | 0 (0.0%) | 0 (0.0%) |
| $20,000 to $22,499 | 18 (3.0%) | 20 (2.9%) |
| $22,500 to $24,999 | 65 (10.9%) | 6 (0.9%) |
| $25,000 to $29,999 | 0 (0.0%) | 0 (0.0%) |
| $30,000 to $34,999 | 0 (0.0%) | 0 (0.0%) |
| $35,000 to $39,999 | 9 (1.5%) | 15 (2.1%) |
| $40,000 to $44,999 | 0 (0.0%) | 0 (0.0%) |
| $45,000 to $49,999 | 0 (0.0%) | 14 (2.0%) |
| $50,000 to $54,999 | 0 (0.0%) | 64 (9.2%) |
| $55,000 to $64,999 | 0 (0.0%) | 44 (6.3%) |
| $65,000 to $74,999 | 0 (0.0%) | 7 (1.0%) |
| $75,000 to $99,999 | 31 (5.2%) | 8 (1.1%) |
| $100,000+ | 27 (4.5%) | 0 (0.0%) |
| Total | 596 (100.0%) | 699 (100.0%) |
Earnings by Sex by Educational Attainment in St Bonaventure
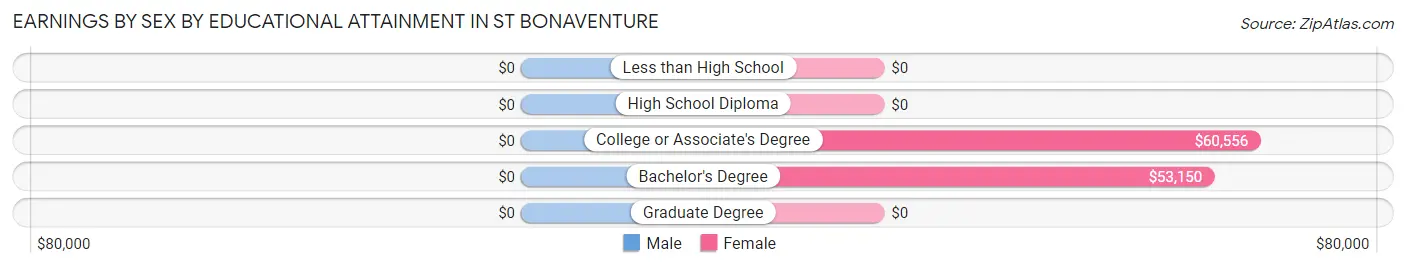
| Educational Attainment | Male Income | Female Income |
| Less than High School | - | - |
| High School Diploma | - | - |
| College or Associate's Degree | - | - |
| Bachelor's Degree | - | - |
| Graduate Degree | - | - |
| Total | - | - |
Family Income in St Bonaventure
Family Income Brackets in St Bonaventure
According to the St Bonaventure family income data, there are 57 families falling into the $75,000 to $99,999 income range, which is the most common income bracket and makes up 33.5% of all families.
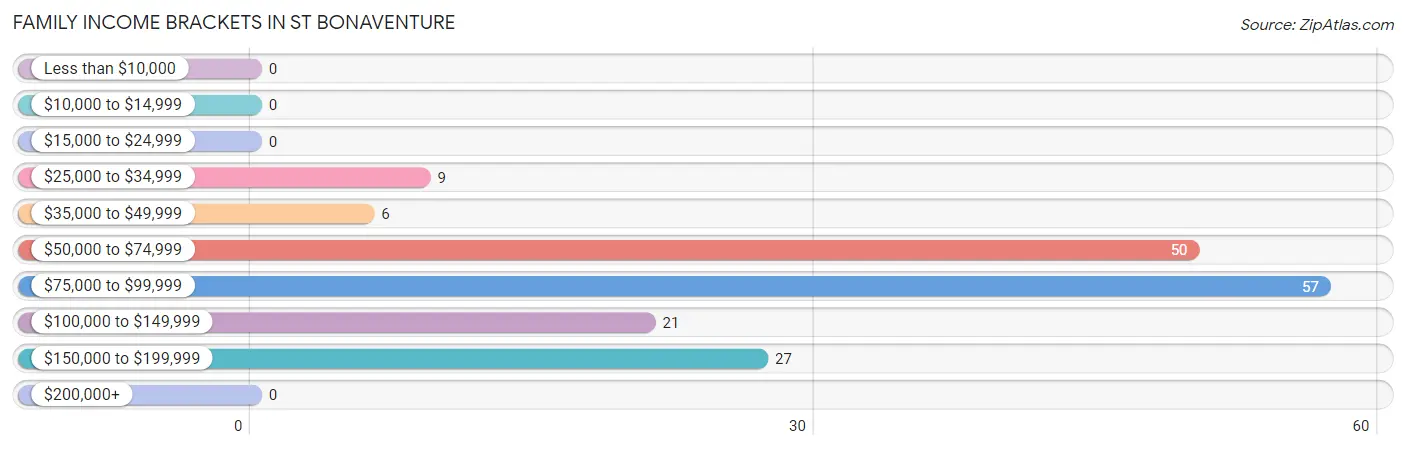
| Income Bracket | # Families | % Families |
| Less than $10,000 | 0 | 0.0% |
| $10,000 to $14,999 | 0 | 0.0% |
| $15,000 to $24,999 | 0 | 0.0% |
| $25,000 to $34,999 | 9 | 5.3% |
| $35,000 to $49,999 | 6 | 3.5% |
| $50,000 to $74,999 | 50 | 29.4% |
| $75,000 to $99,999 | 57 | 33.5% |
| $100,000 to $149,999 | 21 | 12.4% |
| $150,000 to $199,999 | 27 | 15.9% |
| $200,000+ | 0 | 0.0% |
Family Income by Famaliy Size in St Bonaventure
2-person families (88 | 51.8%) account for the highest median family income in St Bonaventure with $78,950 per family, while 2-person families (88 | 51.8%) have the highest median income of $39,475 per family member.
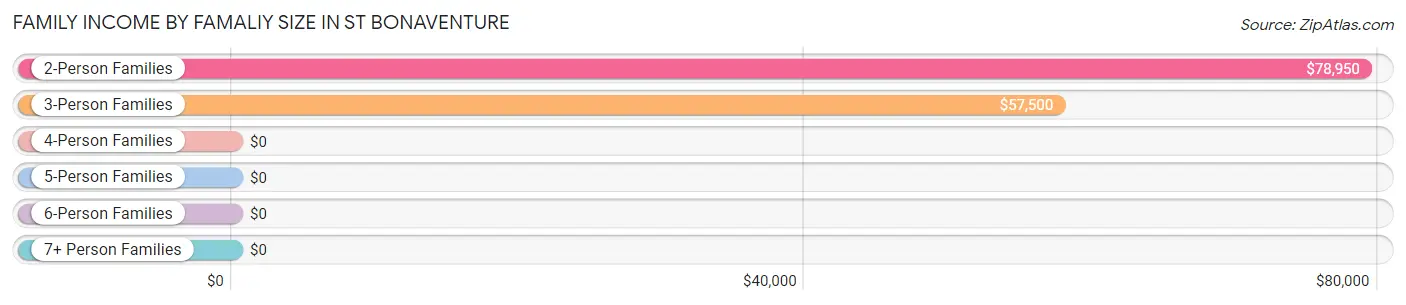
| Income Bracket | # Families | Median Income |
| 2-Person Families | 88 (51.8%) | $78,950 |
| 3-Person Families | 66 (38.8%) | $57,500 |
| 4-Person Families | 7 (4.1%) | $0 |
| 5-Person Families | 9 (5.3%) | $0 |
| 6-Person Families | 0 (0.0%) | $0 |
| 7+ Person Families | 0 (0.0%) | $0 |
| Total | 170 (100.0%) | $78,500 |
Family Income by Number of Earners in St Bonaventure
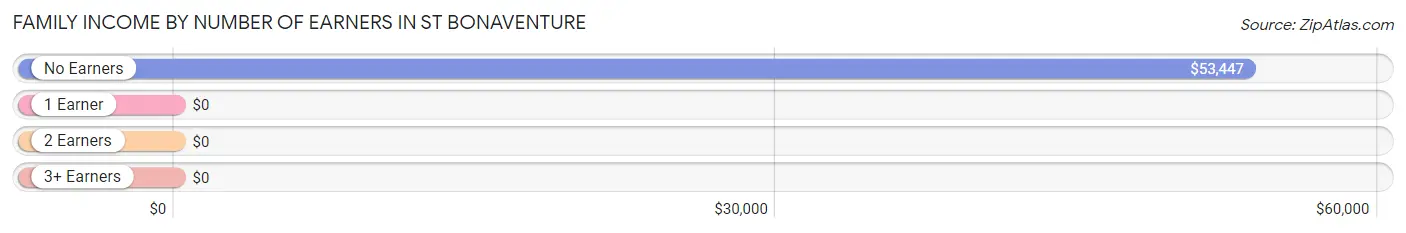
| Number of Earners | # Families | Median Income |
| No Earners | 55 (32.4%) | $53,447 |
| 1 Earner | 17 (10.0%) | $0 |
| 2 Earners | 82 (48.2%) | $0 |
| 3+ Earners | 16 (9.4%) | $0 |
| Total | 170 (100.0%) | $78,500 |
Household Income in St Bonaventure
Household Income Brackets in St Bonaventure
With 83 households falling in the category, the $15,000 to $24,999 income range is the most frequent in St Bonaventure, accounting for 26.0% of all households.
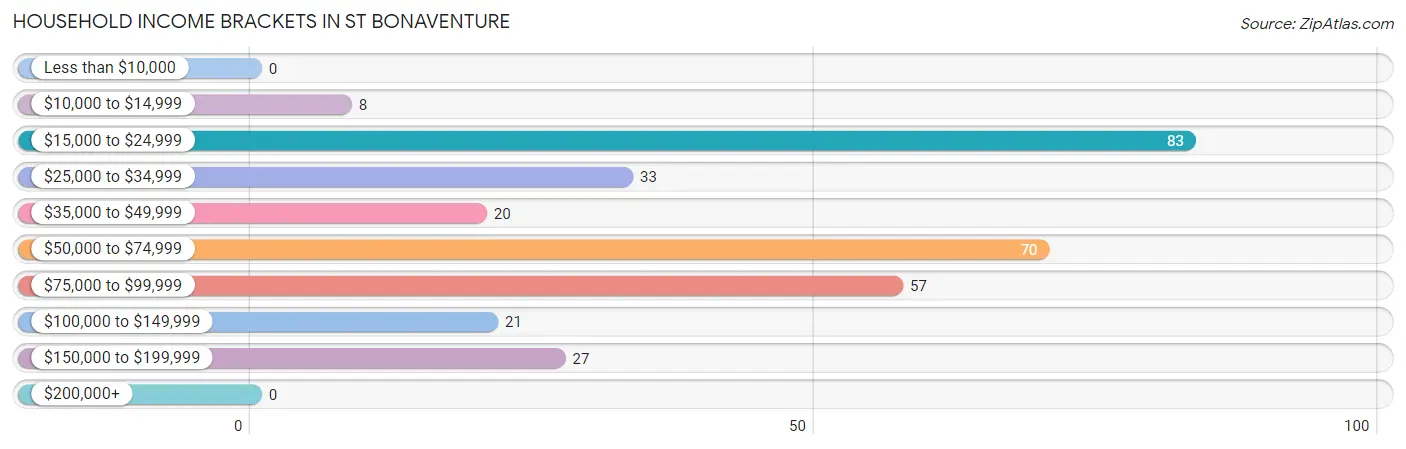
| Income Bracket | # Households | % Households |
| Less than $10,000 | 0 | 0.0% |
| $10,000 to $14,999 | 8 | 2.5% |
| $15,000 to $24,999 | 83 | 26.0% |
| $25,000 to $34,999 | 33 | 10.3% |
| $35,000 to $49,999 | 20 | 6.3% |
| $50,000 to $74,999 | 70 | 21.9% |
| $75,000 to $99,999 | 57 | 17.9% |
| $100,000 to $149,999 | 21 | 6.6% |
| $150,000 to $199,999 | 27 | 8.5% |
| $200,000+ | 0 | 0.0% |
Household Income by Householder Age in St Bonaventure
The median household income in St Bonaventure is $52,992, with the highest median household income of $63,068 found in the 45 to 64 years age bracket for the primary householder. A total of 181 households (56.7%) fall into this category.
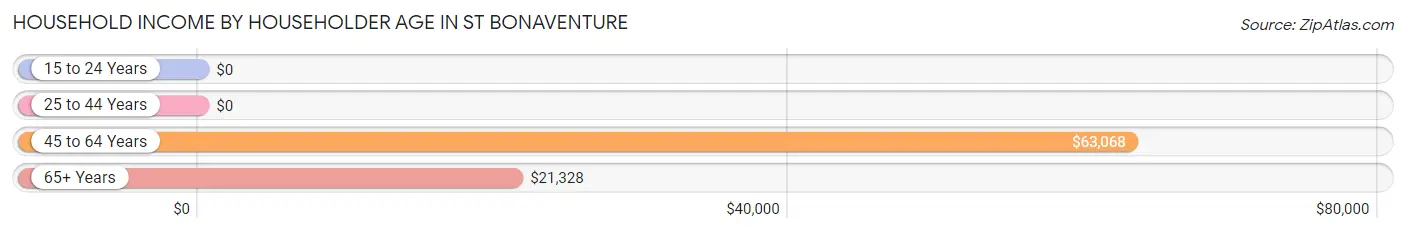
| Income Bracket | # Households | Median Income |
| 15 to 24 Years | 0 (0.0%) | $0 |
| 25 to 44 Years | 16 (5.0%) | $0 |
| 45 to 64 Years | 181 (56.7%) | $63,068 |
| 65+ Years | 122 (38.2%) | $21,328 |
| Total | 319 (100.0%) | $52,992 |
Poverty in St Bonaventure
Income Below Poverty by Sex and Age in St Bonaventure
With 4.6% poverty level for males and 18.8% for females among the residents of St Bonaventure, 18 to 24 year old males and 75 year old and over females are the most vulnerable to poverty, with 5 males (100.0%) and 55 females (57.9%) in their respective age groups living below the poverty level.
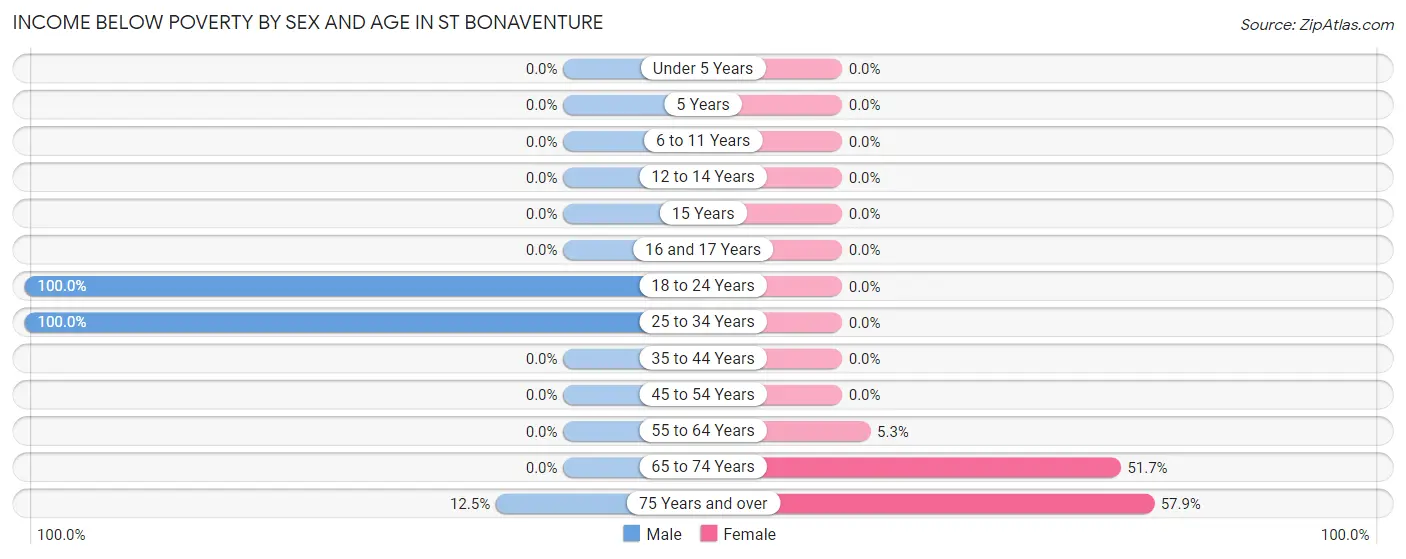
| Age Bracket | Male | Female |
| Under 5 Years | 0 (0.0%) | 0 (0.0%) |
| 5 Years | 0 (0.0%) | 0 (0.0%) |
| 6 to 11 Years | 0 (0.0%) | 0 (0.0%) |
| 12 to 14 Years | 0 (0.0%) | 0 (0.0%) |
| 15 Years | 0 (0.0%) | 0 (0.0%) |
| 16 and 17 Years | 0 (0.0%) | 0 (0.0%) |
| 18 to 24 Years | 5 (100.0%) | 0 (0.0%) |
| 25 to 34 Years | 2 (100.0%) | 0 (0.0%) |
| 35 to 44 Years | 0 (0.0%) | 0 (0.0%) |
| 45 to 54 Years | 0 (0.0%) | 0 (0.0%) |
| 55 to 64 Years | 0 (0.0%) | 5 (5.3%) |
| 65 to 74 Years | 0 (0.0%) | 15 (51.7%) |
| 75 Years and over | 8 (12.5%) | 55 (57.9%) |
| Total | 15 (4.6%) | 75 (18.8%) |
Income Above Poverty by Sex and Age in St Bonaventure
According to the poverty statistics in St Bonaventure, males aged under 5 years and females aged 12 to 14 years are the age groups that are most secure financially, with 100.0% of males and 100.0% of females in these age groups living above the poverty line.
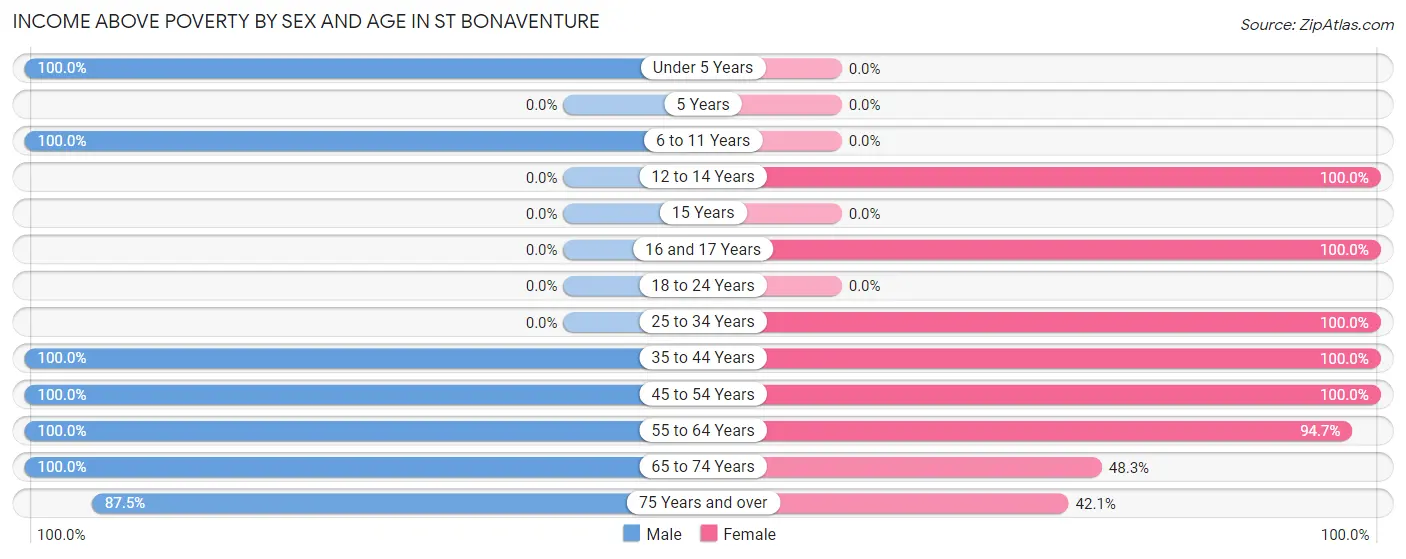
| Age Bracket | Male | Female |
| Under 5 Years | 7 (100.0%) | 0 (0.0%) |
| 5 Years | 0 (0.0%) | 0 (0.0%) |
| 6 to 11 Years | 14 (100.0%) | 0 (0.0%) |
| 12 to 14 Years | 0 (0.0%) | 16 (100.0%) |
| 15 Years | 0 (0.0%) | 0 (0.0%) |
| 16 and 17 Years | 0 (0.0%) | 16 (100.0%) |
| 18 to 24 Years | 0 (0.0%) | 0 (0.0%) |
| 25 to 34 Years | 0 (0.0%) | 27 (100.0%) |
| 35 to 44 Years | 9 (100.0%) | 7 (100.0%) |
| 45 to 54 Years | 9 (100.0%) | 115 (100.0%) |
| 55 to 64 Years | 166 (100.0%) | 90 (94.7%) |
| 65 to 74 Years | 52 (100.0%) | 14 (48.3%) |
| 75 Years and over | 56 (87.5%) | 40 (42.1%) |
| Total | 313 (95.4%) | 325 (81.2%) |
Income Below Poverty Among Married-Couple Families in St Bonaventure
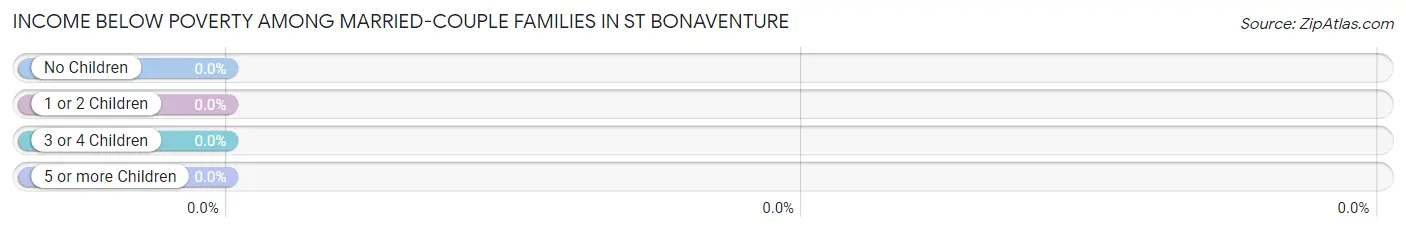
| Children | Above Poverty | Below Poverty |
| No Children | 137 (100.0%) | 0 (0.0%) |
| 1 or 2 Children | 24 (100.0%) | 0 (0.0%) |
| 3 or 4 Children | 9 (100.0%) | 0 (0.0%) |
| 5 or more Children | 0 (0.0%) | 0 (0.0%) |
| Total | 170 (100.0%) | 0 (0.0%) |
Income Below Poverty Among Single-Parent Households in St Bonaventure
| Children | Single Father | Single Mother |
| No Children | 0 (0.0%) | 0 (0.0%) |
| 1 or 2 Children | 0 (0.0%) | 0 (0.0%) |
| 3 or 4 Children | 0 (0.0%) | 0 (0.0%) |
| 5 or more Children | 0 (0.0%) | 0 (0.0%) |
| Total | 0 (0.0%) | 0 (0.0%) |
Income Below Poverty Among Married-Couple vs Single-Parent Households in St Bonaventure
| Children | Married-Couple Families | Single-Parent Households |
| No Children | 0 (0.0%) | 0 (0.0%) |
| 1 or 2 Children | 0 (0.0%) | 0 (0.0%) |
| 3 or 4 Children | 0 (0.0%) | 0 (0.0%) |
| 5 or more Children | 0 (0.0%) | 0 (0.0%) |
| Total | 0 (0.0%) | 0 (0.0%) |
Race in St Bonaventure
The most populous races in St Bonaventure are White / Caucasian (1,837 | 87.8%), Black / African American (119 | 5.7%), and Hispanic or Latino (107 | 5.1%).
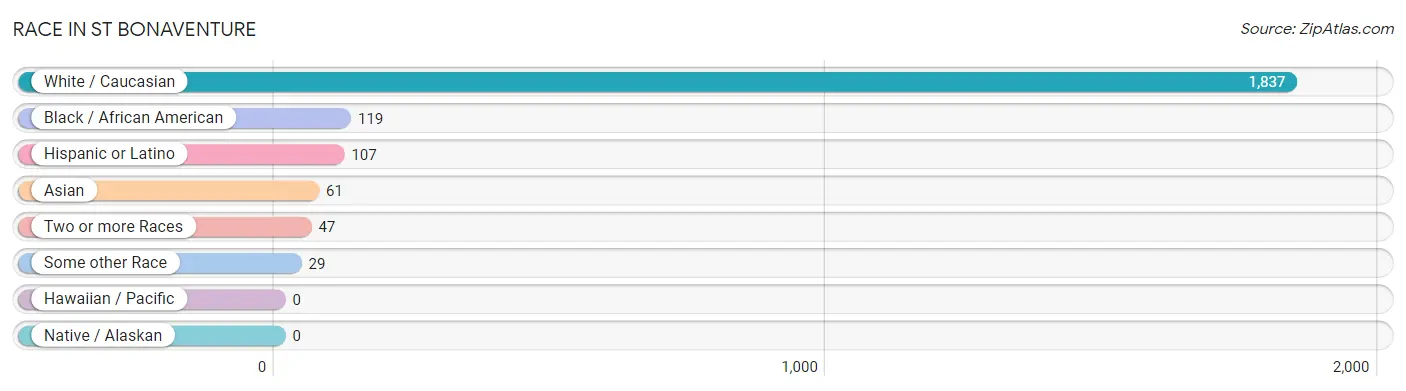
| Race | # Population | % Population |
| Asian | 61 | 2.9% |
| Black / African American | 119 | 5.7% |
| Hawaiian / Pacific | 0 | 0.0% |
| Hispanic or Latino | 107 | 5.1% |
| Native / Alaskan | 0 | 0.0% |
| White / Caucasian | 1,837 | 87.8% |
| Two or more Races | 47 | 2.2% |
| Some other Race | 29 | 1.4% |
| Total | 2,093 | 100.0% |
Ancestry in St Bonaventure
The most populous ancestries reported in St Bonaventure are Irish (428 | 20.4%), German (383 | 18.3%), Italian (380 | 18.2%), Polish (242 | 11.6%), and English (191 | 9.1%), together accounting for 77.6% of all St Bonaventure residents.
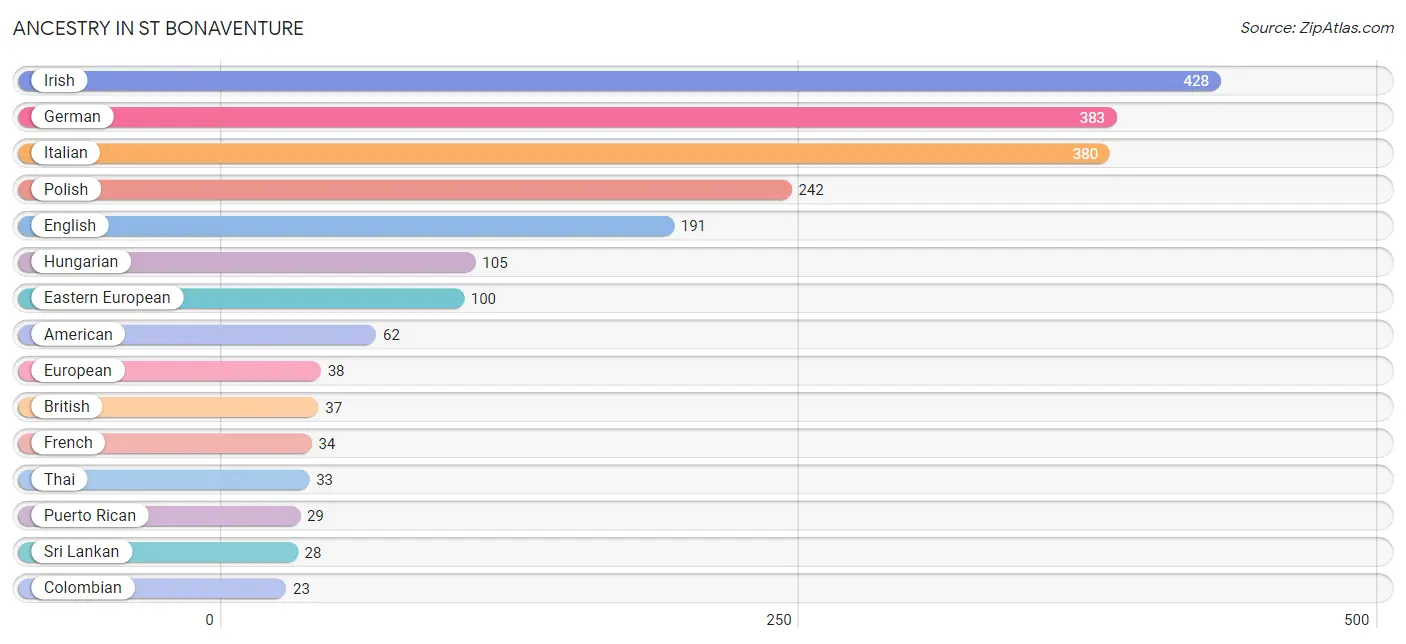
| Ancestry | # Population | % Population |
| African | 12 | 0.6% |
| American | 62 | 3.0% |
| British | 37 | 1.8% |
| Canadian | 5 | 0.2% |
| Colombian | 23 | 1.1% |
| Cuban | 6 | 0.3% |
| Dominican | 11 | 0.5% |
| Dutch | 19 | 0.9% |
| Eastern European | 100 | 4.8% |
| English | 191 | 9.1% |
| European | 38 | 1.8% |
| Finnish | 7 | 0.3% |
| French | 34 | 1.6% |
| French Canadian | 7 | 0.3% |
| German | 383 | 18.3% |
| Hungarian | 105 | 5.0% |
| Irish | 428 | 20.4% |
| Italian | 380 | 18.2% |
| Jamaican | 12 | 0.6% |
| Korean | 5 | 0.2% |
| Latvian | 6 | 0.3% |
| Macedonian | 8 | 0.4% |
| Mexican | 6 | 0.3% |
| Native Hawaiian | 5 | 0.2% |
| Norwegian | 6 | 0.3% |
| Polish | 242 | 11.6% |
| Puerto Rican | 29 | 1.4% |
| Russian | 11 | 0.5% |
| Scottish | 18 | 0.9% |
| Slovak | 17 | 0.8% |
| South American | 23 | 1.1% |
| Spanish | 5 | 0.2% |
| Sri Lankan | 28 | 1.3% |
| Subsaharan African | 12 | 0.6% |
| Swedish | 21 | 1.0% |
| Thai | 33 | 1.6% |
| Ukrainian | 7 | 0.3% |
| Welsh | 13 | 0.6% | View All 38 Rows |
Immigrants in St Bonaventure
The most numerous immigrant groups reported in St Bonaventure came from Europe (65 | 3.1%), Northern Europe (59 | 2.8%), Latin America (25 | 1.2%), South America (25 | 1.2%), and Colombia (23 | 1.1%), together accounting for 9.4% of all St Bonaventure residents.
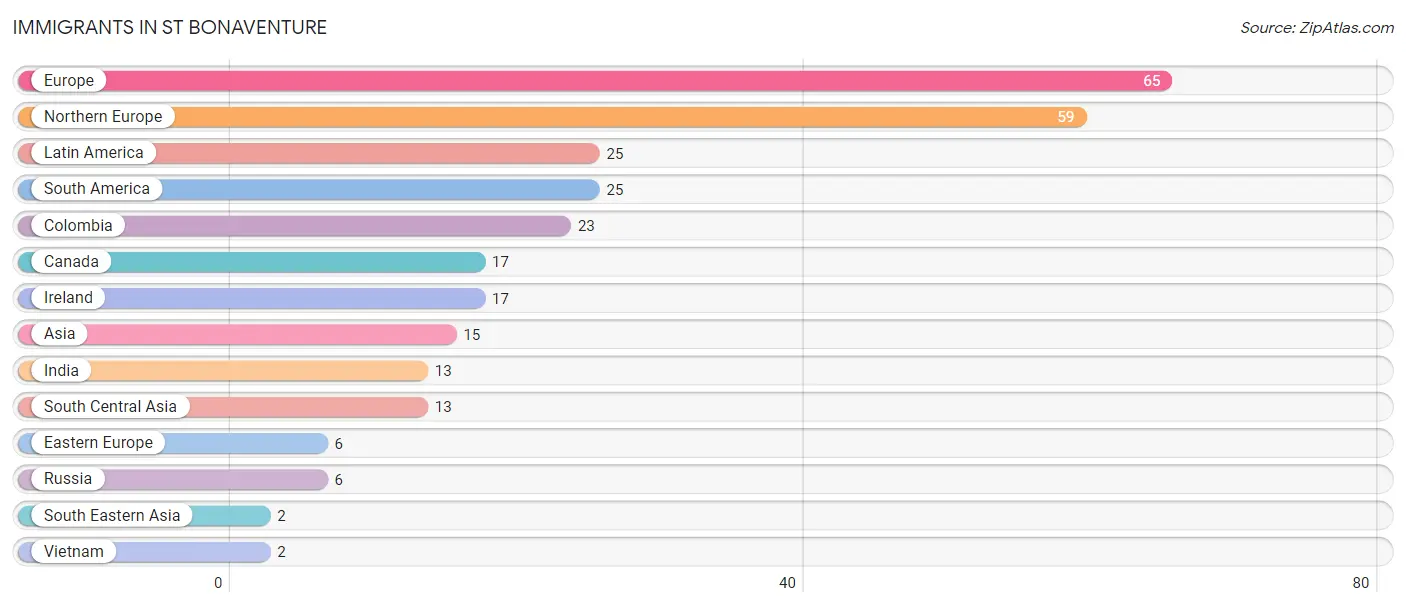
| Immigration Origin | # Population | % Population |
| Asia | 15 | 0.7% |
| Canada | 17 | 0.8% |
| Colombia | 23 | 1.1% |
| Eastern Europe | 6 | 0.3% |
| Europe | 65 | 3.1% |
| India | 13 | 0.6% |
| Ireland | 17 | 0.8% |
| Latin America | 25 | 1.2% |
| Northern Europe | 59 | 2.8% |
| Russia | 6 | 0.3% |
| South America | 25 | 1.2% |
| South Central Asia | 13 | 0.6% |
| South Eastern Asia | 2 | 0.1% |
| Vietnam | 2 | 0.1% | View All 14 Rows |
Sex and Age in St Bonaventure
Sex and Age in St Bonaventure
The most populous age groups in St Bonaventure are 15 to 19 Years (434 | 42.8%) for men and 15 to 19 Years (360 | 33.4%) for women.
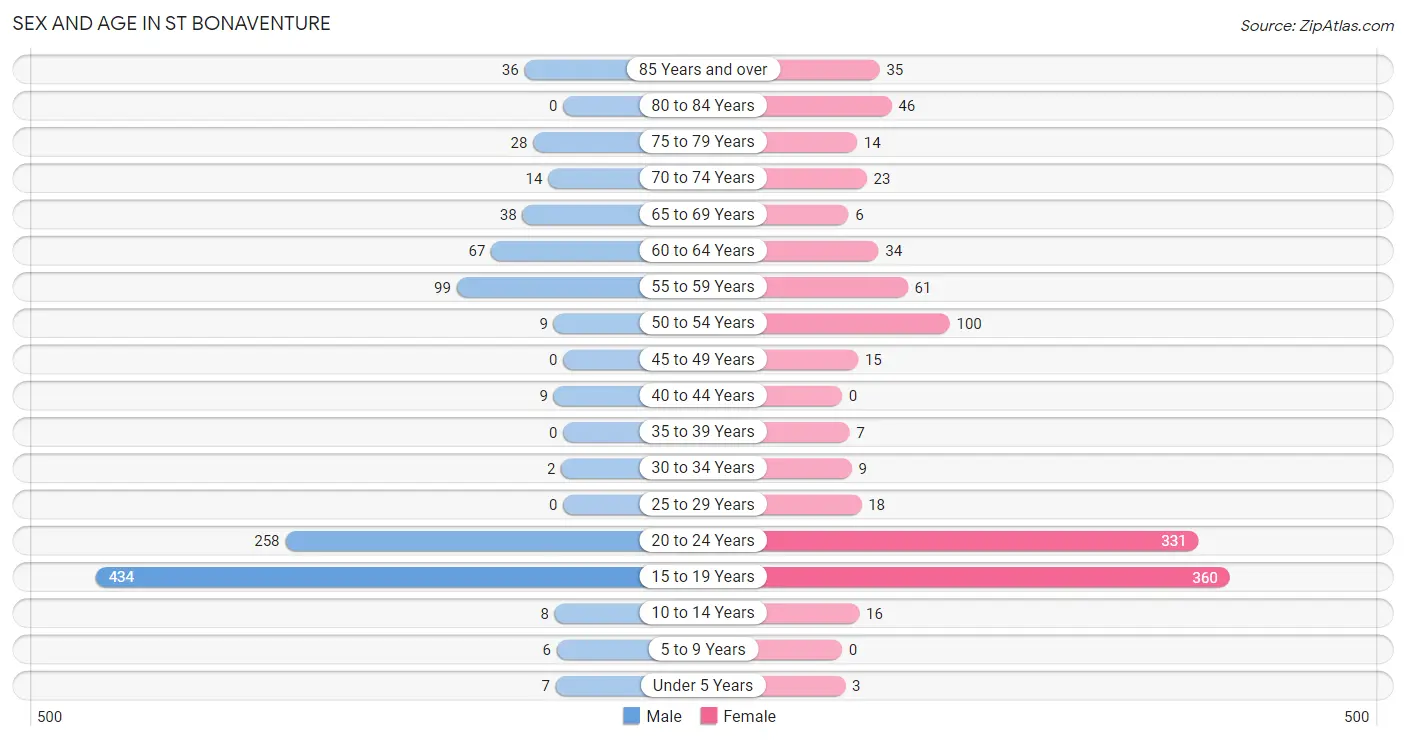
| Age Bracket | Male | Female |
| Under 5 Years | 7 (0.7%) | 3 (0.3%) |
| 5 to 9 Years | 6 (0.6%) | 0 (0.0%) |
| 10 to 14 Years | 8 (0.8%) | 16 (1.5%) |
| 15 to 19 Years | 434 (42.8%) | 360 (33.4%) |
| 20 to 24 Years | 258 (25.4%) | 331 (30.7%) |
| 25 to 29 Years | 0 (0.0%) | 18 (1.7%) |
| 30 to 34 Years | 2 (0.2%) | 9 (0.8%) |
| 35 to 39 Years | 0 (0.0%) | 7 (0.6%) |
| 40 to 44 Years | 9 (0.9%) | 0 (0.0%) |
| 45 to 49 Years | 0 (0.0%) | 15 (1.4%) |
| 50 to 54 Years | 9 (0.9%) | 100 (9.3%) |
| 55 to 59 Years | 99 (9.8%) | 61 (5.7%) |
| 60 to 64 Years | 67 (6.6%) | 34 (3.2%) |
| 65 to 69 Years | 38 (3.7%) | 6 (0.6%) |
| 70 to 74 Years | 14 (1.4%) | 23 (2.1%) |
| 75 to 79 Years | 28 (2.8%) | 14 (1.3%) |
| 80 to 84 Years | 0 (0.0%) | 46 (4.3%) |
| 85 Years and over | 36 (3.5%) | 35 (3.3%) |
| Total | 1,015 (100.0%) | 1,078 (100.0%) |
Families and Households in St Bonaventure
Median Family Size in St Bonaventure
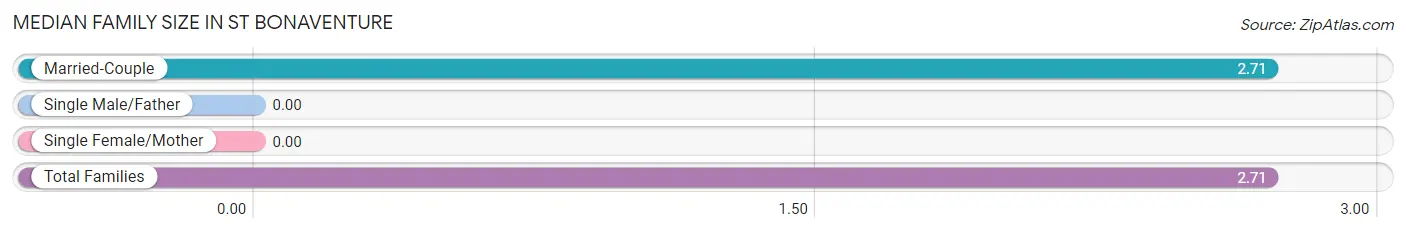
| Family Type | # Families | Family Size |
| Married-Couple | 170 (100.0%) | 2.71 |
| Single Male/Father | 0 (0.0%) | - |
| Single Female/Mother | 0 (0.0%) | - |
| Total Families | 170 (100.0%) | 2.71 |
Median Household Size in St Bonaventure
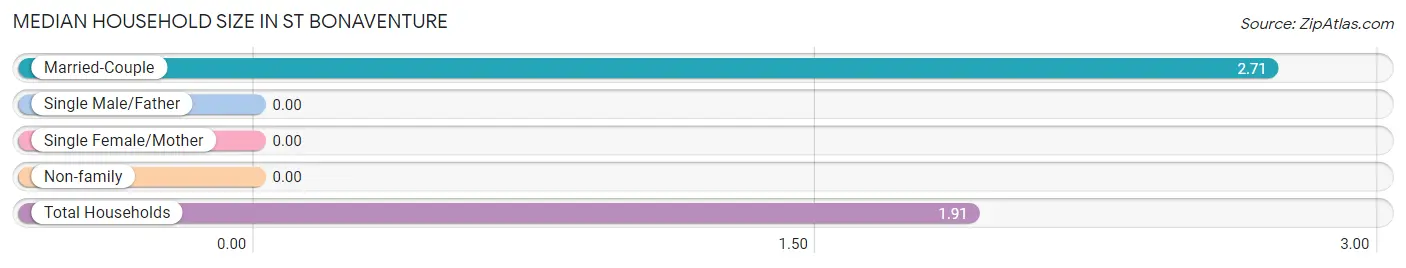
| Household Type | # Households | Household Size |
| Married-Couple | 170 (53.3%) | 2.71 |
| Single Male/Father | 0 (0.0%) | - |
| Single Female/Mother | 0 (0.0%) | - |
| Non-family | 149 (46.7%) | - |
| Total Households | 319 (100.0%) | 1.91 |
Household Size by Marriage Status in St Bonaventure
Out of a total of 319 households in St Bonaventure, 170 (53.3%) are family households, while 149 (46.7%) are nonfamily households. The most numerous type of family households are 2-person households, comprising 88, and the most common type of nonfamily households are 1-person households, comprising 149.
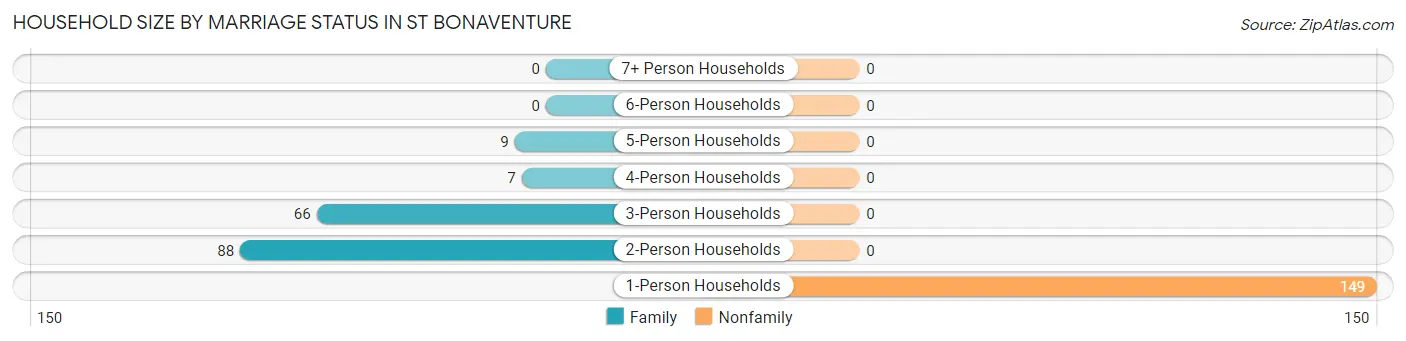
| Household Size | Family Households | Nonfamily Households |
| 1-Person Households | - | 149 (46.7%) |
| 2-Person Households | 88 (27.6%) | 0 (0.0%) |
| 3-Person Households | 66 (20.7%) | 0 (0.0%) |
| 4-Person Households | 7 (2.2%) | 0 (0.0%) |
| 5-Person Households | 9 (2.8%) | 0 (0.0%) |
| 6-Person Households | 0 (0.0%) | 0 (0.0%) |
| 7+ Person Households | 0 (0.0%) | 0 (0.0%) |
| Total | 170 (53.3%) | 149 (46.7%) |
Female Fertility in St Bonaventure
Fertility by Age in St Bonaventure
| Age Bracket | Women with Births | Births / 1,000 Women |
| 15 to 19 years | 0 (0.0%) | 0.0 |
| 20 to 34 years | 0 (0.0%) | 0.0 |
| 35 to 50 years | 0 (0.0%) | 0.0 |
| Total | 0 (0.0%) | 0.0 |
Fertility by Age by Marriage Status in St Bonaventure
| Age Bracket | Married | Unmarried |
| 15 to 19 years | 0 (0.0%) | 0 (0.0%) |
| 20 to 34 years | 0 (0.0%) | 0 (0.0%) |
| 35 to 50 years | 0 (0.0%) | 0 (0.0%) |
| Total | 0 (0.0%) | 0 (0.0%) |
Fertility by Education in St Bonaventure
| Educational Attainment | Women with Births | Births / 1,000 Women |
| Less than High School | 0 (0.0%) | 0.0 |
| High School Diploma | 0 (0.0%) | 0.0 |
| College or Associate's Degree | 0 (0.0%) | 0.0 |
| Bachelor's Degree | 0 (0.0%) | 0.0 |
| Graduate Degree | 0 (0.0%) | 0.0 |
| Total | 0 (0.0%) | 0.0 |
Fertility by Education by Marriage Status in St Bonaventure
| Educational Attainment | Married | Unmarried |
| Less than High School | 0 (0.0%) | 0 (0.0%) |
| High School Diploma | 0 (0.0%) | 0 (0.0%) |
| College or Associate's Degree | 0 (0.0%) | 0 (0.0%) |
| Bachelor's Degree | 0 (0.0%) | 0 (0.0%) |
| Graduate Degree | 0 (0.0%) | 0 (0.0%) |
| Total | 0 (0.0%) | 0 (0.0%) |
Employment Characteristics in St Bonaventure
Employment by Class of Employer in St Bonaventure
Among the 641 employed individuals in St Bonaventure, private company employees (356 | 55.5%), local government employees (86 | 13.4%), and not-for-profit organizations (75 | 11.7%) make up the most common classes of employment.
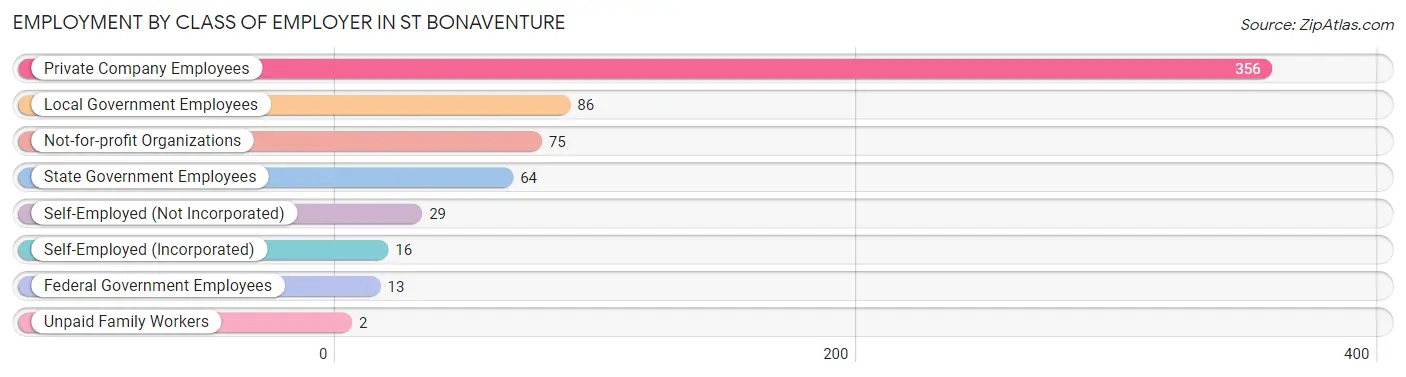
| Employer Class | # Employees | % Employees |
| Private Company Employees | 356 | 55.5% |
| Self-Employed (Incorporated) | 16 | 2.5% |
| Self-Employed (Not Incorporated) | 29 | 4.5% |
| Not-for-profit Organizations | 75 | 11.7% |
| Local Government Employees | 86 | 13.4% |
| State Government Employees | 64 | 10.0% |
| Federal Government Employees | 13 | 2.0% |
| Unpaid Family Workers | 2 | 0.3% |
| Total | 641 | 100.0% |
Employment Status by Age in St Bonaventure
According to the labor force statistics for St Bonaventure, out of the total population over 16 years of age (2,053), 37.2% or 764 individuals are in the labor force, with 5.6% or 43 of them unemployed. The age group with the highest labor force participation rate is 25 to 29 years, with 100.0% or 18 individuals in the labor force. Within the labor force, the 45 to 54 years age range has the highest percentage of unemployed individuals, with 44.4% or 32 of them being unemployed.
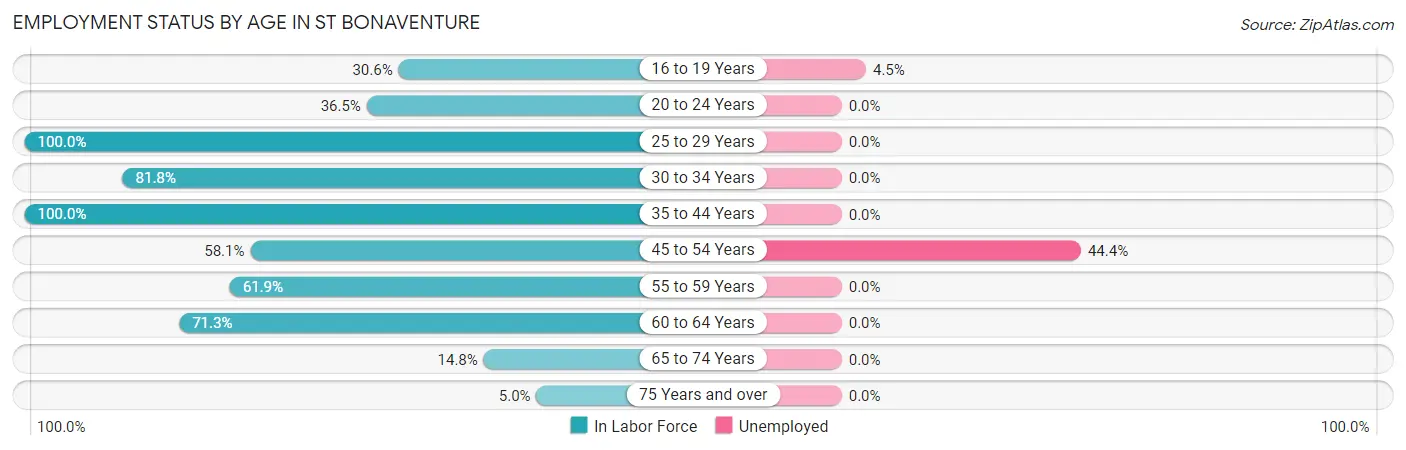
| Age Bracket | In Labor Force | Unemployed |
| 16 to 19 Years | 243 (30.6%) | 11 (4.5%) |
| 20 to 24 Years | 215 (36.5%) | 0 (0.0%) |
| 25 to 29 Years | 18 (100.0%) | 0 (0.0%) |
| 30 to 34 Years | 9 (81.8%) | 0 (0.0%) |
| 35 to 44 Years | 16 (100.0%) | 0 (0.0%) |
| 45 to 54 Years | 72 (58.1%) | 32 (44.4%) |
| 55 to 59 Years | 99 (61.9%) | 0 (0.0%) |
| 60 to 64 Years | 72 (71.3%) | 0 (0.0%) |
| 65 to 74 Years | 12 (14.8%) | 0 (0.0%) |
| 75 Years and over | 8 (5.0%) | 0 (0.0%) |
| Total | 764 (37.2%) | 43 (5.6%) |
Employment Status by Educational Attainment in St Bonaventure
According to labor force statistics for St Bonaventure, 66.5% of individuals (286) out of the total population between 25 and 64 years of age (430) are in the labor force, with 11.2% or 32 of them being unemployed. The group with the highest labor force participation rate are those with the educational attainment of bachelor's degree or higher, with 92.6% or 113 individuals in the labor force. Within the labor force, individuals with high school diploma education have the highest percentage of unemployment, with 39.5% or 32 of them being unemployed.
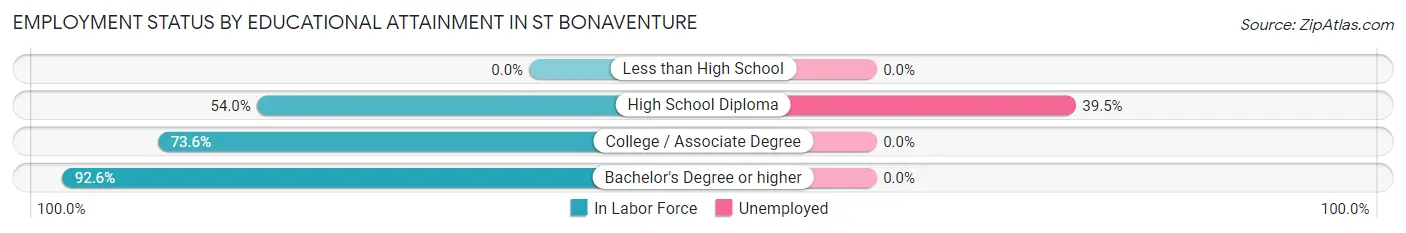
| Educational Attainment | In Labor Force | Unemployed |
| Less than High School | 0 (0.0%) | 0 (0.0%) |
| High School Diploma | 81 (54.0%) | 59 (39.5%) |
| College / Associate Degree | 92 (73.6%) | 0 (0.0%) |
| Bachelor's Degree or higher | 113 (92.6%) | 0 (0.0%) |
| Total | 286 (66.5%) | 48 (11.2%) |
Employment Occupations by Sex in St Bonaventure
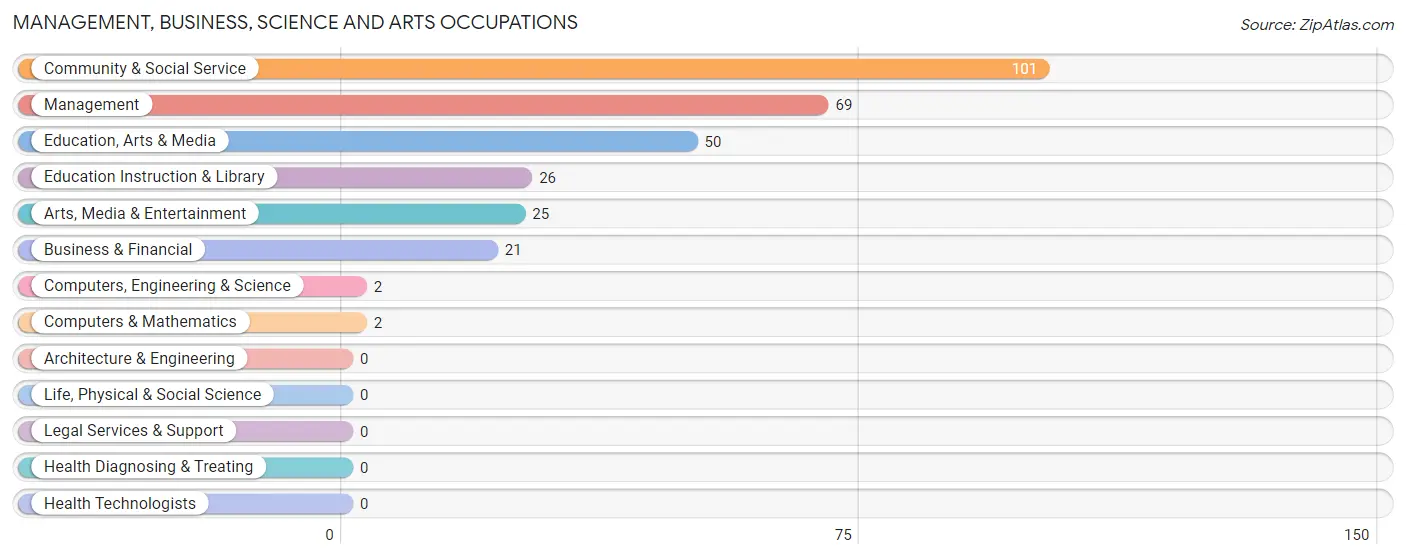
Management, Business, Science and Arts Occupations
The most common Management, Business, Science and Arts occupations in St Bonaventure are Community & Social Service (101 | 14.0%), Management (69 | 9.6%), Education, Arts & Media (50 | 6.9%), Education Instruction & Library (26 | 3.6%), and Arts, Media & Entertainment (25 | 3.5%).
Management, Business, Science and Arts Occupations by Sex
Within the Management, Business, Science and Arts occupations in St Bonaventure, the most male-oriented occupations are Computers, Engineering & Science (100.0%), Computers & Mathematics (100.0%), and Management (65.2%), while the most female-oriented occupations are Business & Financial (100.0%), Education, Arts & Media (100.0%), and Arts, Media & Entertainment (100.0%).
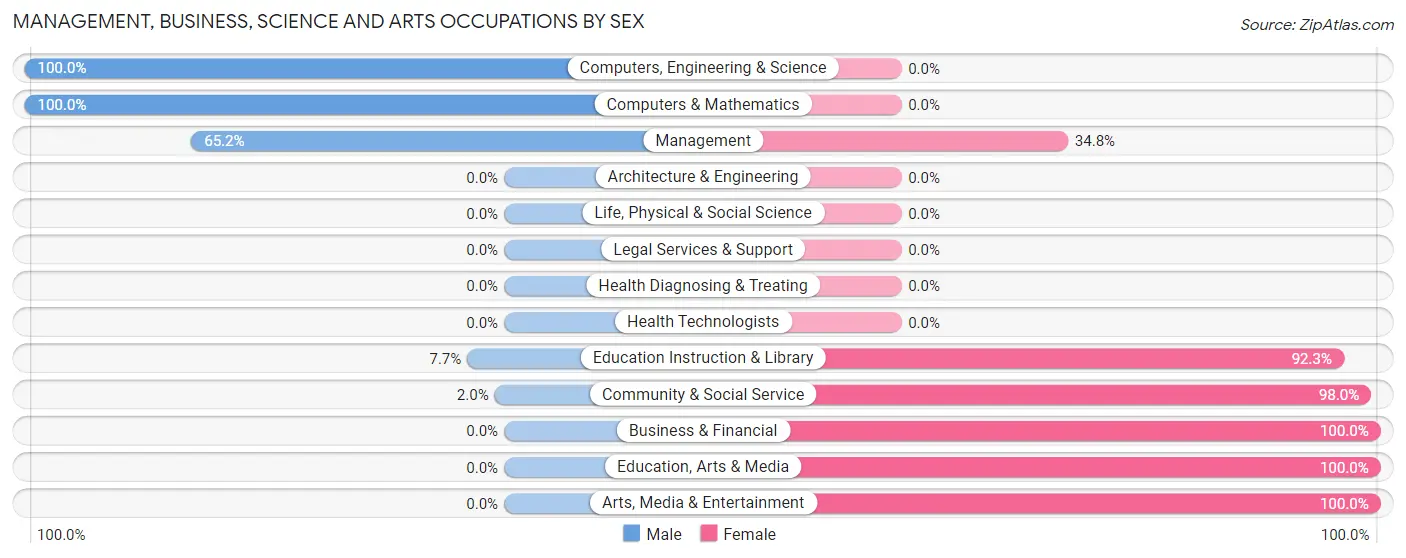
| Occupation | Male | Female |
| Management | 45 (65.2%) | 24 (34.8%) |
| Business & Financial | 0 (0.0%) | 21 (100.0%) |
| Computers, Engineering & Science | 2 (100.0%) | 0 (0.0%) |
| Computers & Mathematics | 2 (100.0%) | 0 (0.0%) |
| Architecture & Engineering | 0 (0.0%) | 0 (0.0%) |
| Life, Physical & Social Science | 0 (0.0%) | 0 (0.0%) |
| Community & Social Service | 2 (2.0%) | 99 (98.0%) |
| Education, Arts & Media | 0 (0.0%) | 50 (100.0%) |
| Legal Services & Support | 0 (0.0%) | 0 (0.0%) |
| Education Instruction & Library | 2 (7.7%) | 24 (92.3%) |
| Arts, Media & Entertainment | 0 (0.0%) | 25 (100.0%) |
| Health Diagnosing & Treating | 0 (0.0%) | 0 (0.0%) |
| Health Technologists | 0 (0.0%) | 0 (0.0%) |
| Total (Category) | 49 (25.4%) | 144 (74.6%) |
| Total (Overall) | 253 (35.1%) | 468 (64.9%) |
Services Occupations
The most common Services occupations in St Bonaventure are Food Preparation & Serving (130 | 18.0%), Personal Care & Service (45 | 6.2%), Security & Protection (27 | 3.7%), Law Enforcement (18 | 2.5%), and Cleaning & Maintenance (14 | 1.9%).
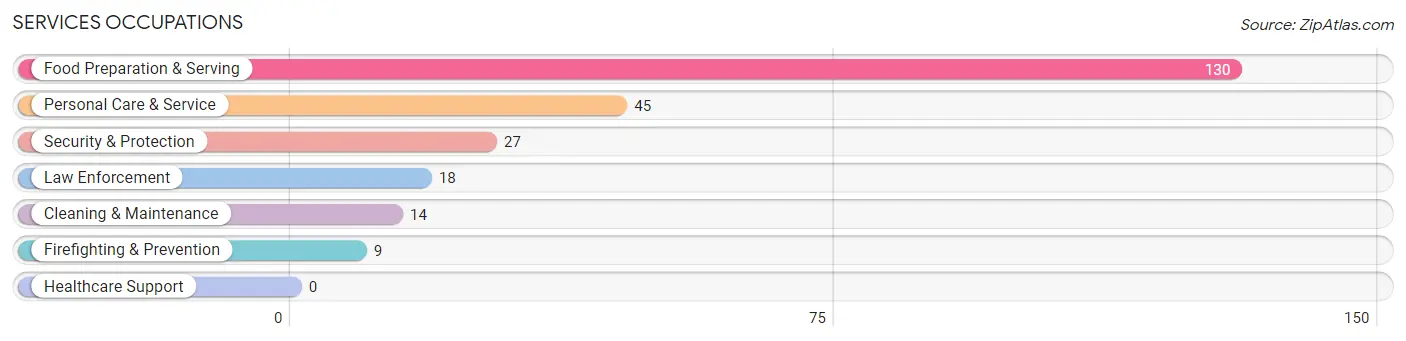
Services Occupations by Sex
Within the Services occupations in St Bonaventure, the most male-oriented occupations are Cleaning & Maintenance (100.0%), Personal Care & Service (57.8%), and Food Preparation & Serving (31.5%), while the most female-oriented occupations are Security & Protection (100.0%), Firefighting & Prevention (100.0%), and Law Enforcement (100.0%).
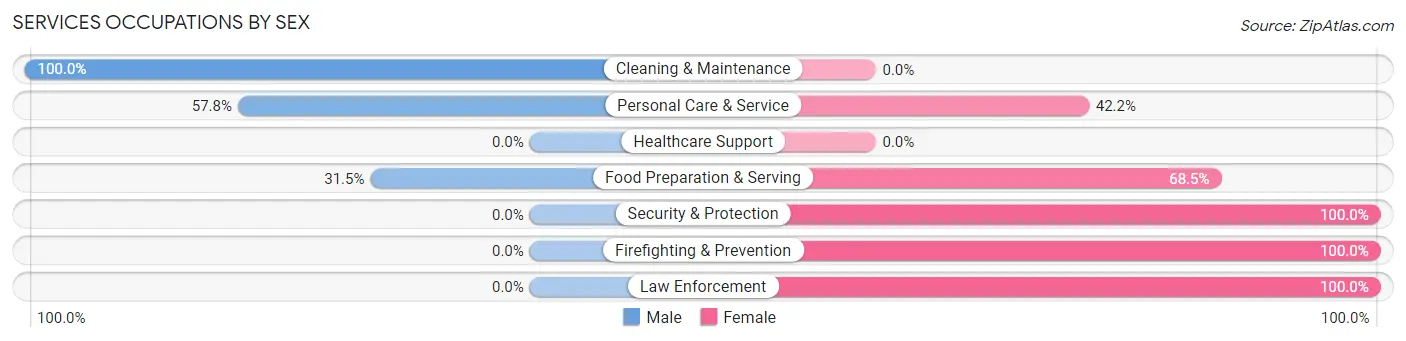
| Occupation | Male | Female |
| Healthcare Support | 0 (0.0%) | 0 (0.0%) |
| Security & Protection | 0 (0.0%) | 27 (100.0%) |
| Firefighting & Prevention | 0 (0.0%) | 9 (100.0%) |
| Law Enforcement | 0 (0.0%) | 18 (100.0%) |
| Food Preparation & Serving | 41 (31.5%) | 89 (68.5%) |
| Cleaning & Maintenance | 14 (100.0%) | 0 (0.0%) |
| Personal Care & Service | 26 (57.8%) | 19 (42.2%) |
| Total (Category) | 81 (37.5%) | 135 (62.5%) |
| Total (Overall) | 253 (35.1%) | 468 (64.9%) |
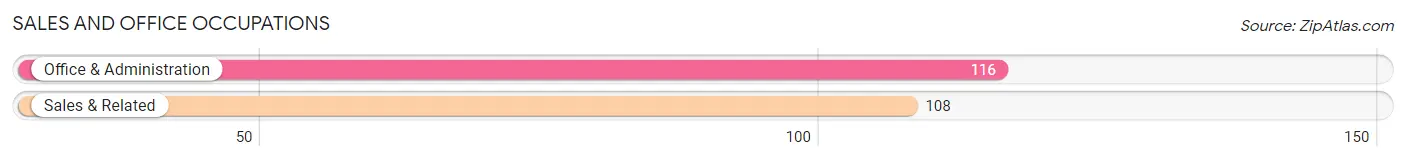
Sales and Office Occupations
The most common Sales and Office occupations in St Bonaventure are Office & Administration (116 | 16.1%), and Sales & Related (108 | 15.0%).
Sales and Office Occupations by Sex
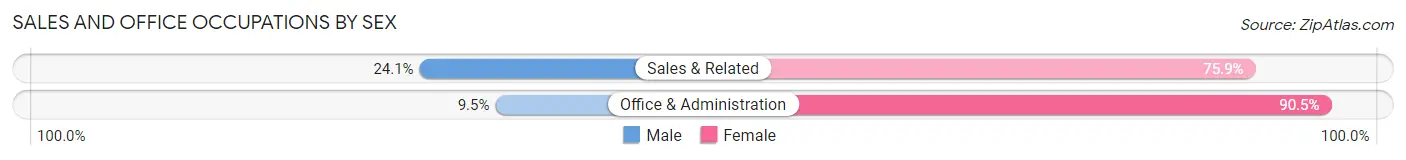
| Occupation | Male | Female |
| Sales & Related | 26 (24.1%) | 82 (75.9%) |
| Office & Administration | 11 (9.5%) | 105 (90.5%) |
| Total (Category) | 37 (16.5%) | 187 (83.5%) |
| Total (Overall) | 253 (35.1%) | 468 (64.9%) |
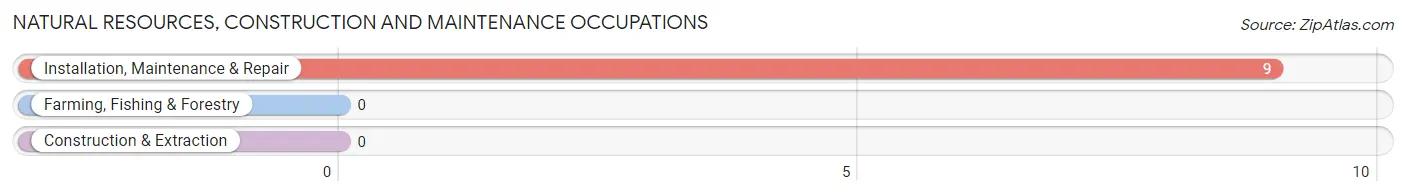
Natural Resources, Construction and Maintenance Occupations
The most common Natural Resources, Construction and Maintenance occupations in St Bonaventure are , and Installation, Maintenance & Repair (9 | 1.3%).
Natural Resources, Construction and Maintenance Occupations by Sex
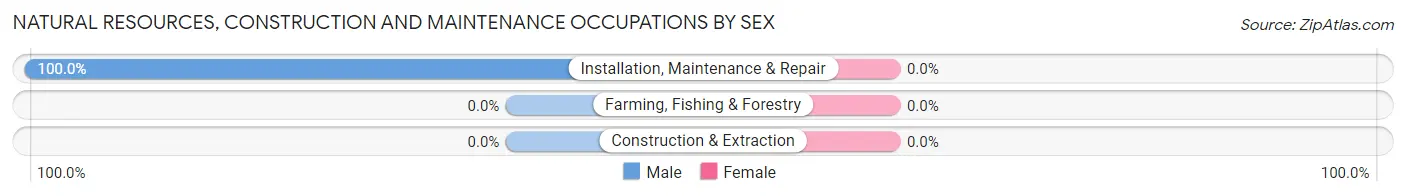
| Occupation | Male | Female |
| Farming, Fishing & Forestry | 0 (0.0%) | 0 (0.0%) |
| Construction & Extraction | 0 (0.0%) | 0 (0.0%) |
| Installation, Maintenance & Repair | 9 (100.0%) | 0 (0.0%) |
| Total (Category) | 9 (100.0%) | 0 (0.0%) |
| Total (Overall) | 253 (35.1%) | 468 (64.9%) |
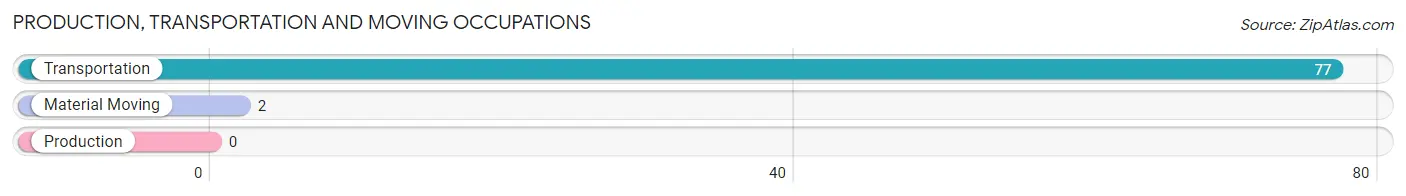
Production, Transportation and Moving Occupations
The most common Production, Transportation and Moving occupations in St Bonaventure are Transportation (77 | 10.7%), and Material Moving (2 | 0.3%).
Production, Transportation and Moving Occupations by Sex
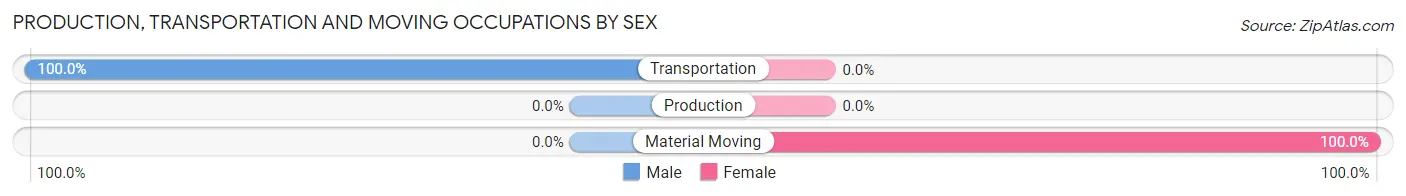
| Occupation | Male | Female |
| Production | 0 (0.0%) | 0 (0.0%) |
| Transportation | 77 (100.0%) | 0 (0.0%) |
| Material Moving | 0 (0.0%) | 2 (100.0%) |
| Total (Category) | 77 (97.5%) | 2 (2.5%) |
| Total (Overall) | 253 (35.1%) | 468 (64.9%) |
Employment Industries by Sex in St Bonaventure
Employment Industries in St Bonaventure
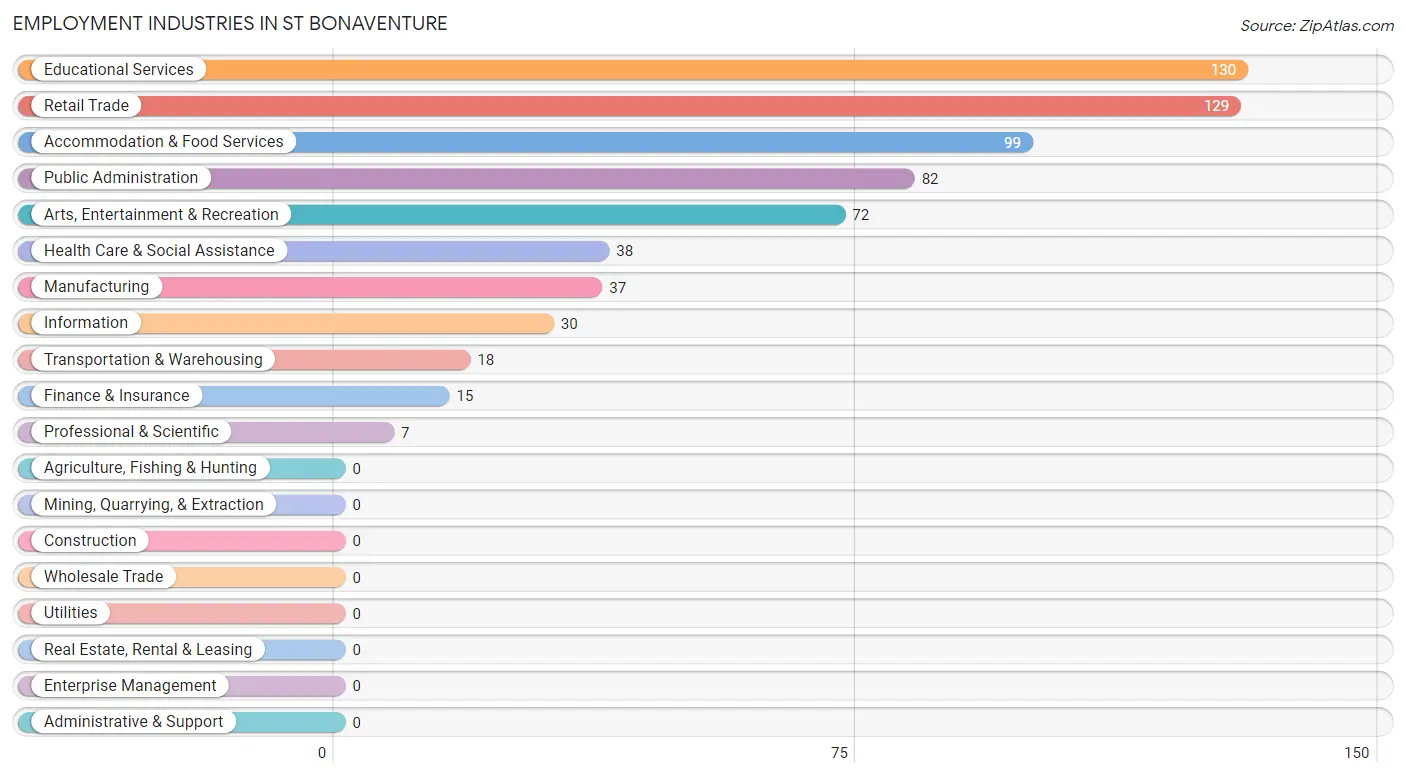
The major employment industries in St Bonaventure include Educational Services (130 | 18.0%), Retail Trade (129 | 17.9%), Accommodation & Food Services (99 | 13.7%), Public Administration (82 | 11.4%), and Arts, Entertainment & Recreation (72 | 10.0%).
Employment Industries by Sex in St Bonaventure
The St Bonaventure industries that see more men than women are Transportation & Warehousing (100.0%), Manufacturing (59.5%), and Arts, Entertainment & Recreation (40.3%), whereas the industries that tend to have a higher number of women are Information (100.0%), Finance & Insurance (100.0%), and Professional & Scientific (100.0%).
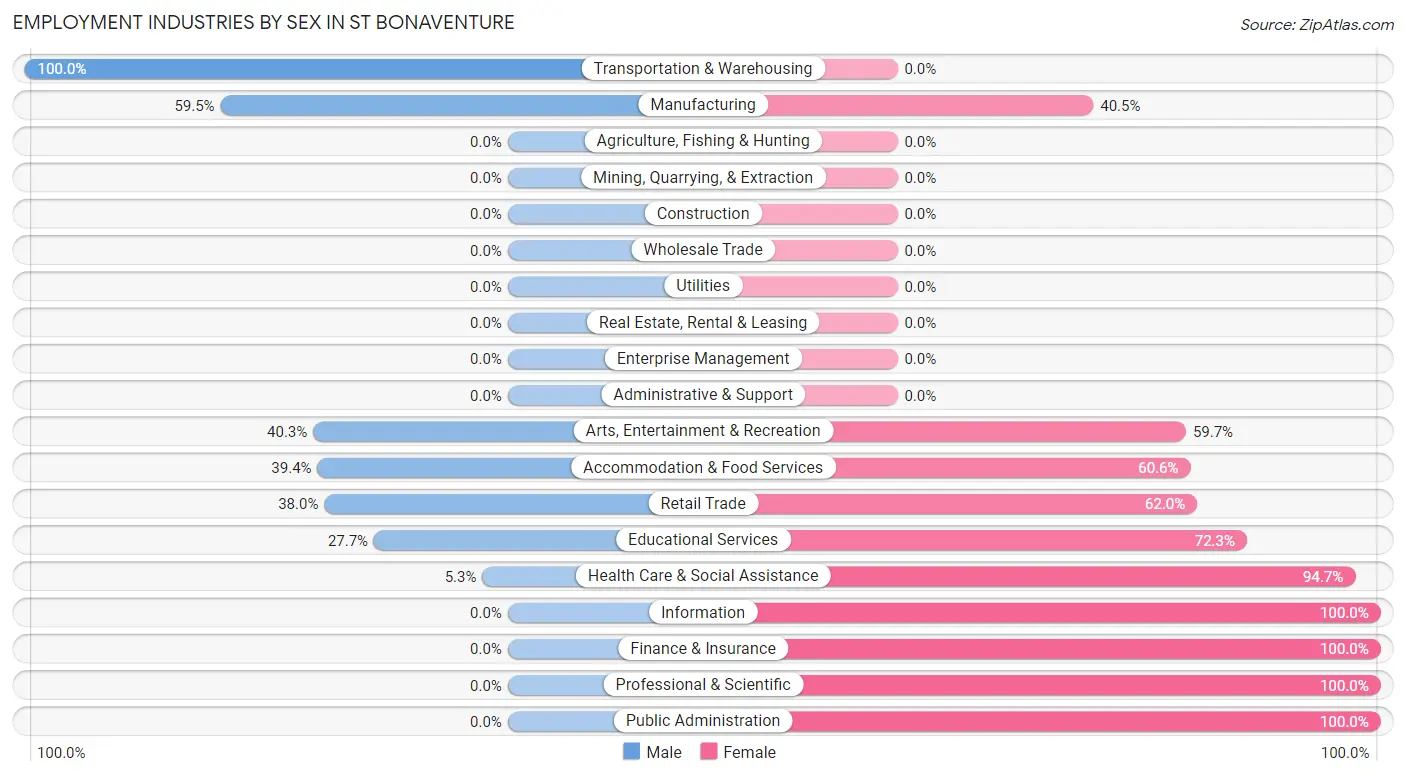
| Industry | Male | Female |
| Agriculture, Fishing & Hunting | 0 (0.0%) | 0 (0.0%) |
| Mining, Quarrying, & Extraction | 0 (0.0%) | 0 (0.0%) |
| Construction | 0 (0.0%) | 0 (0.0%) |
| Manufacturing | 22 (59.5%) | 15 (40.5%) |
| Wholesale Trade | 0 (0.0%) | 0 (0.0%) |
| Retail Trade | 49 (38.0%) | 80 (62.0%) |
| Transportation & Warehousing | 18 (100.0%) | 0 (0.0%) |
| Utilities | 0 (0.0%) | 0 (0.0%) |
| Information | 0 (0.0%) | 30 (100.0%) |
| Finance & Insurance | 0 (0.0%) | 15 (100.0%) |
| Real Estate, Rental & Leasing | 0 (0.0%) | 0 (0.0%) |
| Professional & Scientific | 0 (0.0%) | 7 (100.0%) |
| Enterprise Management | 0 (0.0%) | 0 (0.0%) |
| Administrative & Support | 0 (0.0%) | 0 (0.0%) |
| Educational Services | 36 (27.7%) | 94 (72.3%) |
| Health Care & Social Assistance | 2 (5.3%) | 36 (94.7%) |
| Arts, Entertainment & Recreation | 29 (40.3%) | 43 (59.7%) |
| Accommodation & Food Services | 39 (39.4%) | 60 (60.6%) |
| Public Administration | 0 (0.0%) | 82 (100.0%) |
| Total | 253 (35.1%) | 468 (64.9%) |
Education in St Bonaventure
School Enrollment in St Bonaventure
The most common levels of schooling among the 1,431 students in St Bonaventure are college / undergraduate (1,347 | 94.1%), graduate / professional (38 | 2.7%), and middle school (16 | 1.1%).
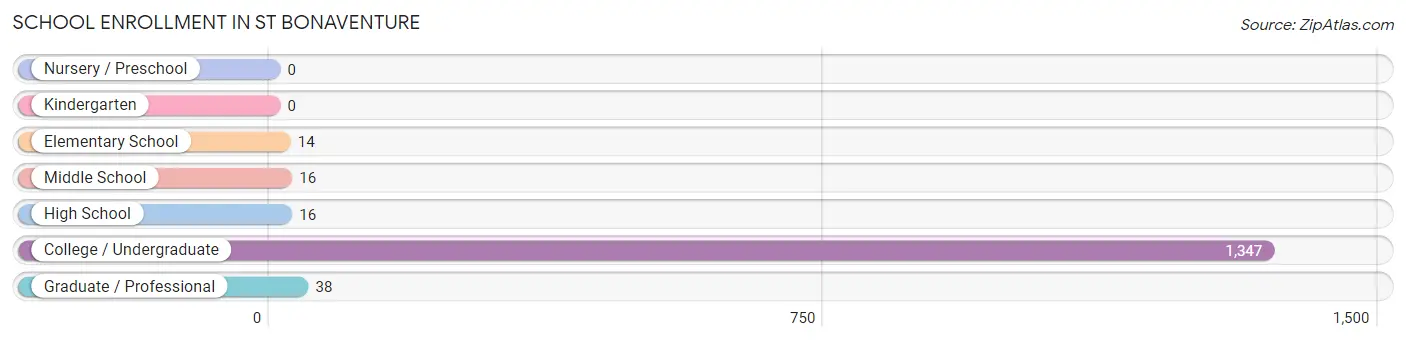
| School Level | # Students | % Students |
| Nursery / Preschool | 0 | 0.0% |
| Kindergarten | 0 | 0.0% |
| Elementary School | 14 | 1.0% |
| Middle School | 16 | 1.1% |
| High School | 16 | 1.1% |
| College / Undergraduate | 1,347 | 94.1% |
| Graduate / Professional | 38 | 2.7% |
| Total | 1,431 | 100.0% |
School Enrollment by Age by Funding Source in St Bonaventure
Out of a total of 1,431 students who are enrolled in schools in St Bonaventure, 1,264 (88.3%) attend a private institution, while the remaining 167 (11.7%) are enrolled in public schools. The age group of 35 years and over has the highest likelihood of being enrolled in private schools, with 21 (100.0% in the age bracket) enrolled. Conversely, the age group of 5 to 9 year old has the lowest likelihood of being enrolled in a private school, with 6 (100.0% in the age bracket) attending a public institution.
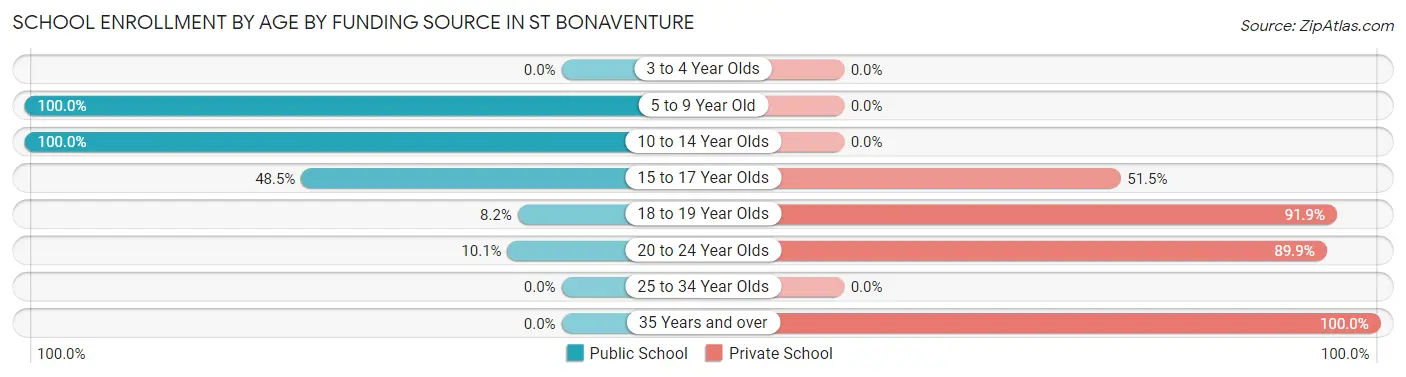
| Age Bracket | Public School | Private School |
| 3 to 4 Year Olds | 0 (0.0%) | 0 (0.0%) |
| 5 to 9 Year Old | 6 (100.0%) | 0 (0.0%) |
| 10 to 14 Year Olds | 24 (100.0%) | 0 (0.0%) |
| 15 to 17 Year Olds | 16 (48.5%) | 17 (51.5%) |
| 18 to 19 Year Olds | 62 (8.2%) | 699 (91.8%) |
| 20 to 24 Year Olds | 59 (10.1%) | 527 (89.9%) |
| 25 to 34 Year Olds | 0 (0.0%) | 0 (0.0%) |
| 35 Years and over | 0 (0.0%) | 21 (100.0%) |
| Total | 167 (11.7%) | 1,264 (88.3%) |
Educational Attainment by Field of Study in St Bonaventure
Literature & languages (80 | 35.9%), education (77 | 34.5%), arts & humanities (30 | 13.5%), bio, nature & agricultural (10 | 4.5%), and psychology (8 | 3.6%) are the most common fields of study among 223 individuals in St Bonaventure who have obtained a bachelor's degree or higher.
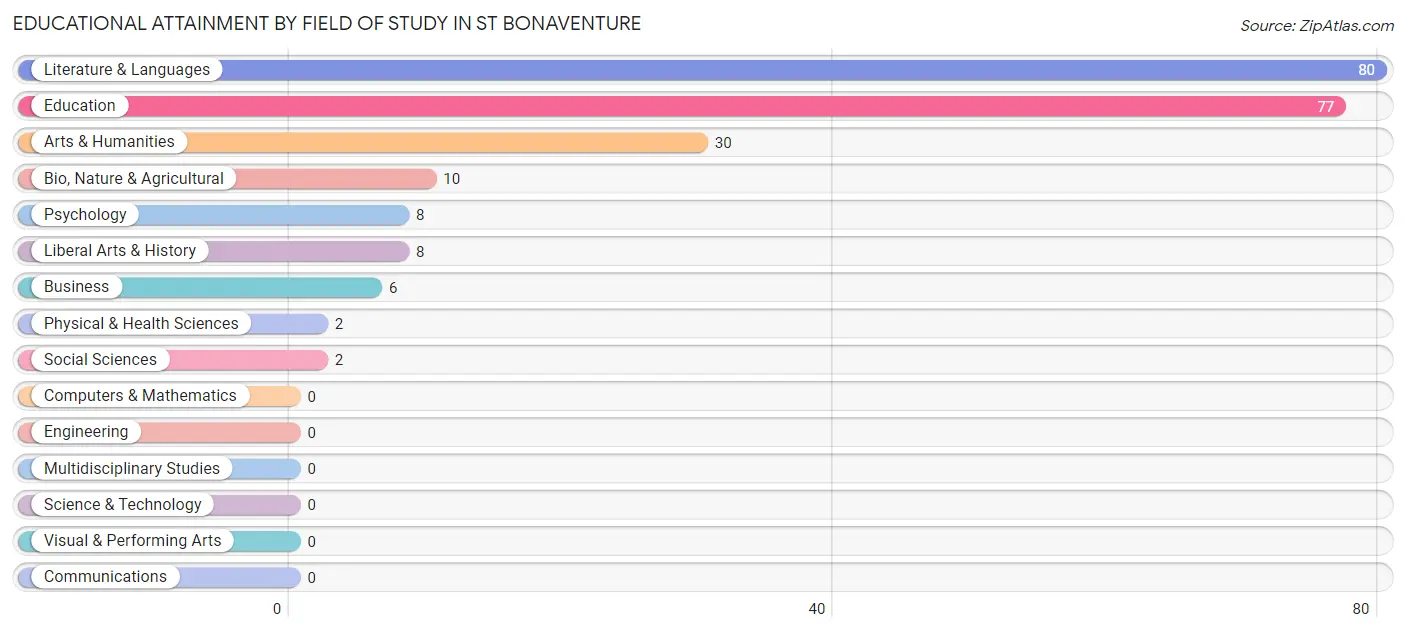
| Field of Study | # Graduates | % Graduates |
| Computers & Mathematics | 0 | 0.0% |
| Bio, Nature & Agricultural | 10 | 4.5% |
| Physical & Health Sciences | 2 | 0.9% |
| Psychology | 8 | 3.6% |
| Social Sciences | 2 | 0.9% |
| Engineering | 0 | 0.0% |
| Multidisciplinary Studies | 0 | 0.0% |
| Science & Technology | 0 | 0.0% |
| Business | 6 | 2.7% |
| Education | 77 | 34.5% |
| Literature & Languages | 80 | 35.9% |
| Liberal Arts & History | 8 | 3.6% |
| Visual & Performing Arts | 0 | 0.0% |
| Communications | 0 | 0.0% |
| Arts & Humanities | 30 | 13.5% |
| Total | 223 | 100.0% |
Transportation & Commute in St Bonaventure
Vehicle Availability by Sex in St Bonaventure
The most prevalent vehicle ownership categories in St Bonaventure are males with 2 vehicles (91, accounting for 72.2%) and females with 2 vehicles (75, making up 58.3%).
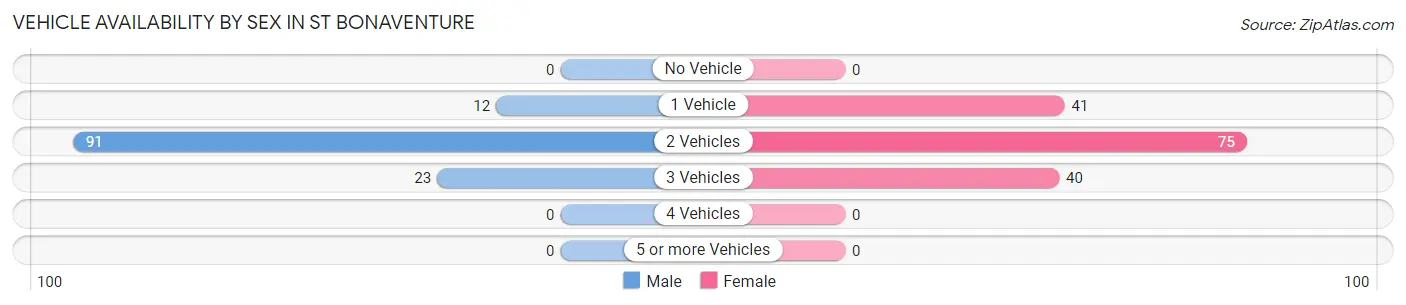
| Vehicles Available | Male | Female |
| No Vehicle | 0 (0.0%) | 0 (0.0%) |
| 1 Vehicle | 12 (9.5%) | 41 (26.3%) |
| 2 Vehicles | 91 (72.2%) | 75 (48.1%) |
| 3 Vehicles | 23 (18.2%) | 40 (25.6%) |
| 4 Vehicles | 0 (0.0%) | 0 (0.0%) |
| 5 or more Vehicles | 0 (0.0%) | 0 (0.0%) |
| Total | 126 (100.0%) | 156 (100.0%) |
Commute Time in St Bonaventure
The most frequently occuring commute durations in St Bonaventure are 5 to 9 minutes (155 commuters, 28.7%), 10 to 14 minutes (133 commuters, 24.6%), and less than 5 minutes (72 commuters, 13.3%).
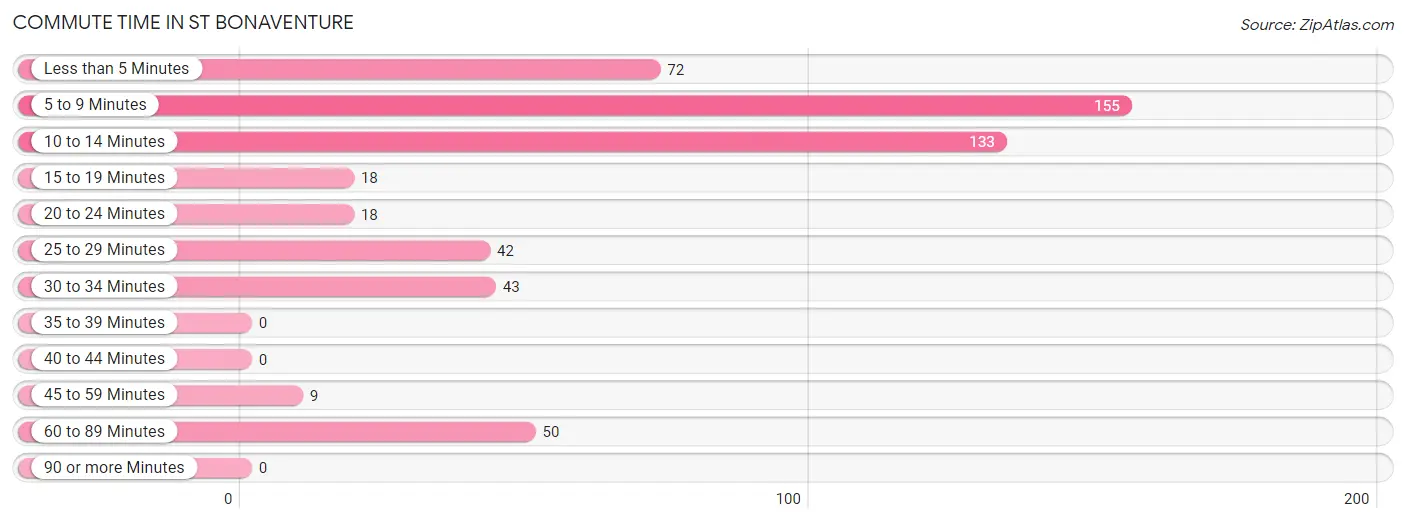
| Commute Time | # Commuters | % Commuters |
| Less than 5 Minutes | 72 | 13.3% |
| 5 to 9 Minutes | 155 | 28.7% |
| 10 to 14 Minutes | 133 | 24.6% |
| 15 to 19 Minutes | 18 | 3.3% |
| 20 to 24 Minutes | 18 | 3.3% |
| 25 to 29 Minutes | 42 | 7.8% |
| 30 to 34 Minutes | 43 | 8.0% |
| 35 to 39 Minutes | 0 | 0.0% |
| 40 to 44 Minutes | 0 | 0.0% |
| 45 to 59 Minutes | 9 | 1.7% |
| 60 to 89 Minutes | 50 | 9.3% |
| 90 or more Minutes | 0 | 0.0% |
Commute Time by Sex in St Bonaventure
The most common commute times in St Bonaventure are 10 to 14 minutes (72 commuters, 42.1%) for males and 5 to 9 minutes (109 commuters, 29.5%) for females.
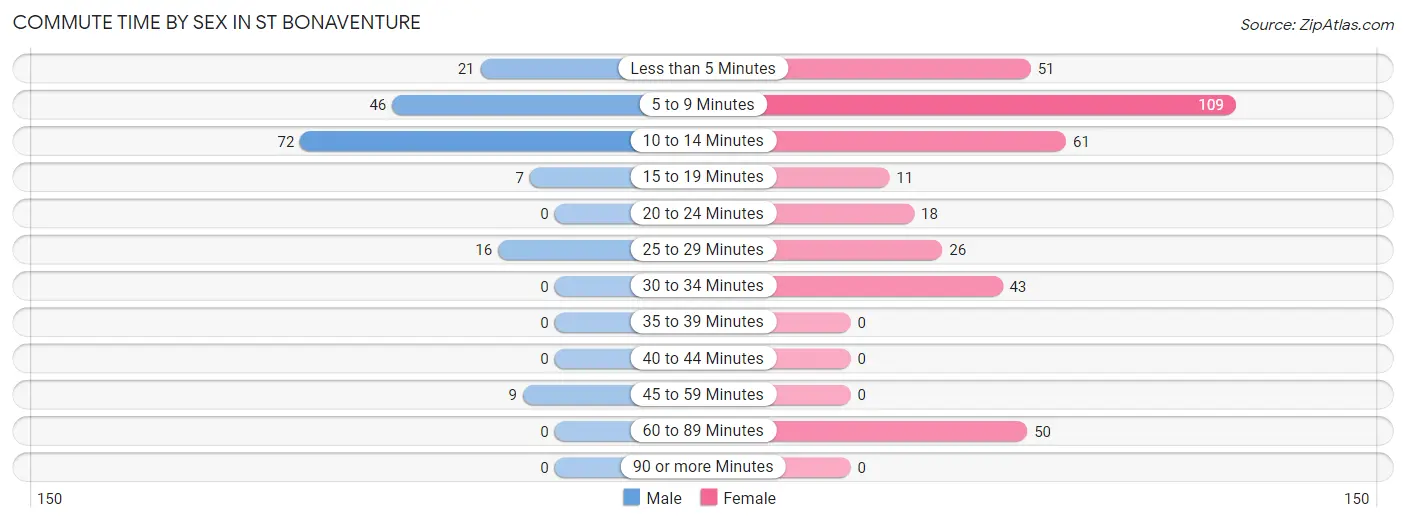
| Commute Time | Male | Female |
| Less than 5 Minutes | 21 (12.3%) | 51 (13.8%) |
| 5 to 9 Minutes | 46 (26.9%) | 109 (29.5%) |
| 10 to 14 Minutes | 72 (42.1%) | 61 (16.5%) |
| 15 to 19 Minutes | 7 (4.1%) | 11 (3.0%) |
| 20 to 24 Minutes | 0 (0.0%) | 18 (4.9%) |
| 25 to 29 Minutes | 16 (9.4%) | 26 (7.0%) |
| 30 to 34 Minutes | 0 (0.0%) | 43 (11.7%) |
| 35 to 39 Minutes | 0 (0.0%) | 0 (0.0%) |
| 40 to 44 Minutes | 0 (0.0%) | 0 (0.0%) |
| 45 to 59 Minutes | 9 (5.3%) | 0 (0.0%) |
| 60 to 89 Minutes | 0 (0.0%) | 50 (13.6%) |
| 90 or more Minutes | 0 (0.0%) | 0 (0.0%) |
Time of Departure to Work by Sex in St Bonaventure
The most frequent times of departure to work in St Bonaventure are 8:30 AM to 8:59 AM (58, 33.9%) for males and 12:00 PM to 3:59 PM (118, 32.0%) for females.
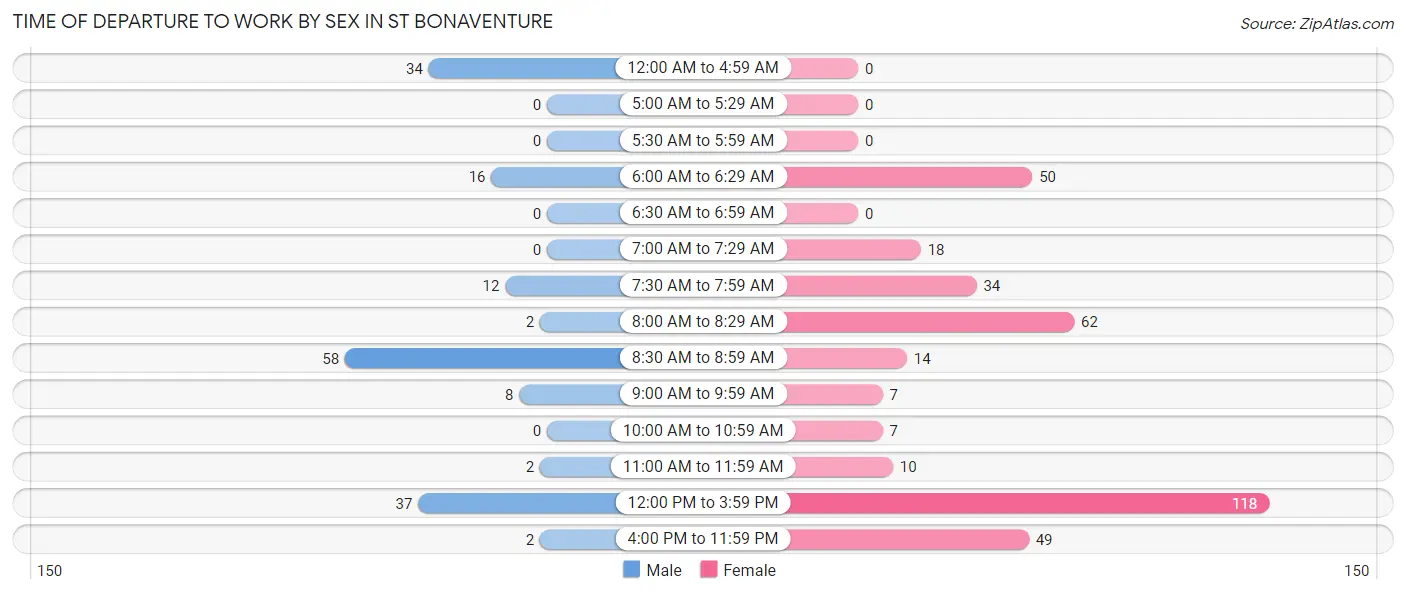
| Time of Departure | Male | Female |
| 12:00 AM to 4:59 AM | 34 (19.9%) | 0 (0.0%) |
| 5:00 AM to 5:29 AM | 0 (0.0%) | 0 (0.0%) |
| 5:30 AM to 5:59 AM | 0 (0.0%) | 0 (0.0%) |
| 6:00 AM to 6:29 AM | 16 (9.4%) | 50 (13.6%) |
| 6:30 AM to 6:59 AM | 0 (0.0%) | 0 (0.0%) |
| 7:00 AM to 7:29 AM | 0 (0.0%) | 18 (4.9%) |
| 7:30 AM to 7:59 AM | 12 (7.0%) | 34 (9.2%) |
| 8:00 AM to 8:29 AM | 2 (1.2%) | 62 (16.8%) |
| 8:30 AM to 8:59 AM | 58 (33.9%) | 14 (3.8%) |
| 9:00 AM to 9:59 AM | 8 (4.7%) | 7 (1.9%) |
| 10:00 AM to 10:59 AM | 0 (0.0%) | 7 (1.9%) |
| 11:00 AM to 11:59 AM | 2 (1.2%) | 10 (2.7%) |
| 12:00 PM to 3:59 PM | 37 (21.6%) | 118 (32.0%) |
| 4:00 PM to 11:59 PM | 2 (1.2%) | 49 (13.3%) |
| Total | 171 (100.0%) | 369 (100.0%) |
Housing Occupancy in St Bonaventure
Occupancy by Ownership in St Bonaventure
Of the total 319 dwellings in St Bonaventure, owner-occupied units account for 185 (58.0%), while renter-occupied units make up 134 (42.0%).
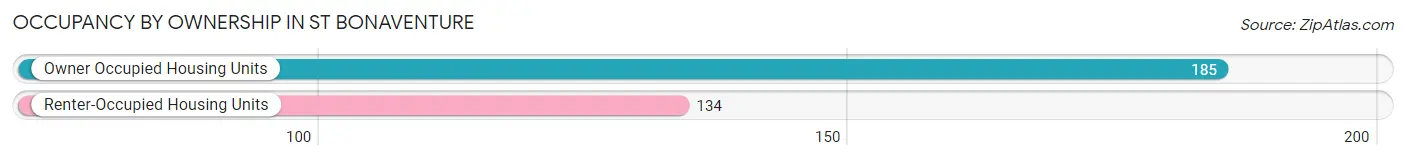
| Occupancy | # Housing Units | % Housing Units |
| Owner Occupied Housing Units | 185 | 58.0% |
| Renter-Occupied Housing Units | 134 | 42.0% |
| Total Occupied Housing Units | 319 | 100.0% |
Occupancy by Household Size in St Bonaventure
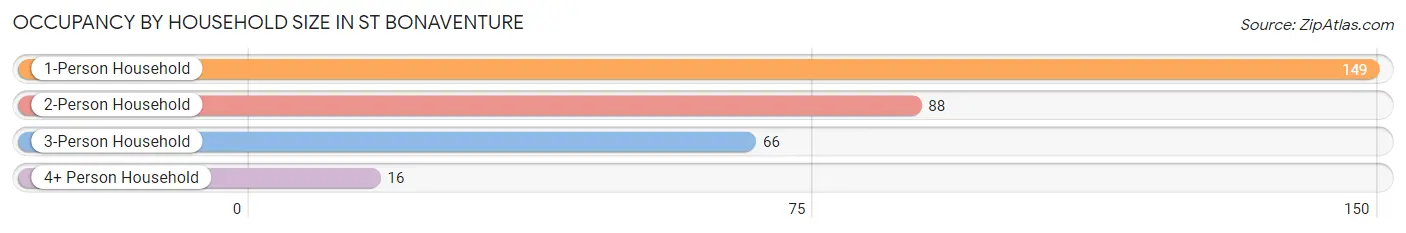
| Household Size | # Housing Units | % Housing Units |
| 1-Person Household | 149 | 46.7% |
| 2-Person Household | 88 | 27.6% |
| 3-Person Household | 66 | 20.7% |
| 4+ Person Household | 16 | 5.0% |
| Total Housing Units | 319 | 100.0% |
Occupancy by Ownership by Household Size in St Bonaventure
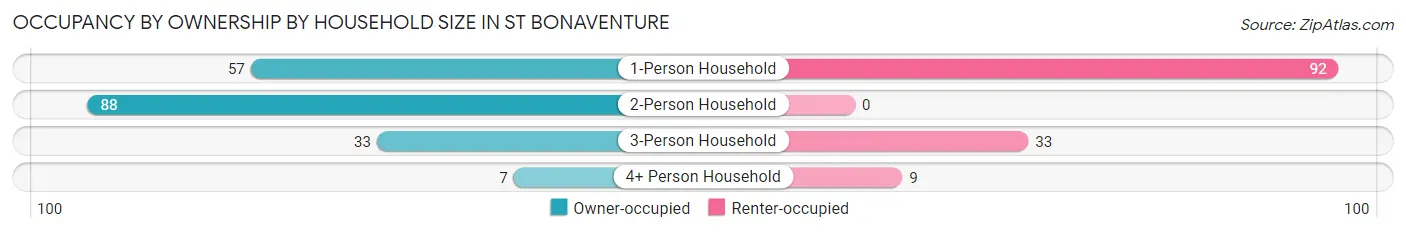
| Household Size | Owner-occupied | Renter-occupied |
| 1-Person Household | 57 (38.3%) | 92 (61.7%) |
| 2-Person Household | 88 (100.0%) | 0 (0.0%) |
| 3-Person Household | 33 (50.0%) | 33 (50.0%) |
| 4+ Person Household | 7 (43.8%) | 9 (56.2%) |
| Total Housing Units | 185 (58.0%) | 134 (42.0%) |
Occupancy by Educational Attainment in St Bonaventure
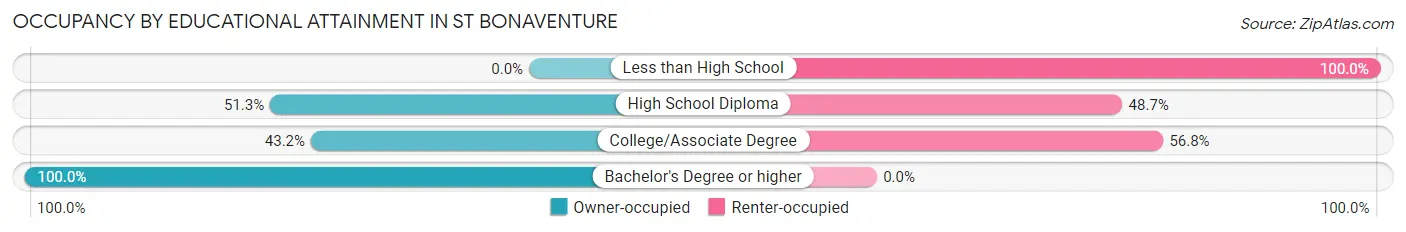
| Household Size | Owner-occupied | Renter-occupied |
| Less than High School | 0 (0.0%) | 37 (100.0%) |
| High School Diploma | 58 (51.3%) | 55 (48.7%) |
| College/Associate Degree | 32 (43.2%) | 42 (56.8%) |
| Bachelor's Degree or higher | 95 (100.0%) | 0 (0.0%) |
Occupancy by Age of Householder in St Bonaventure
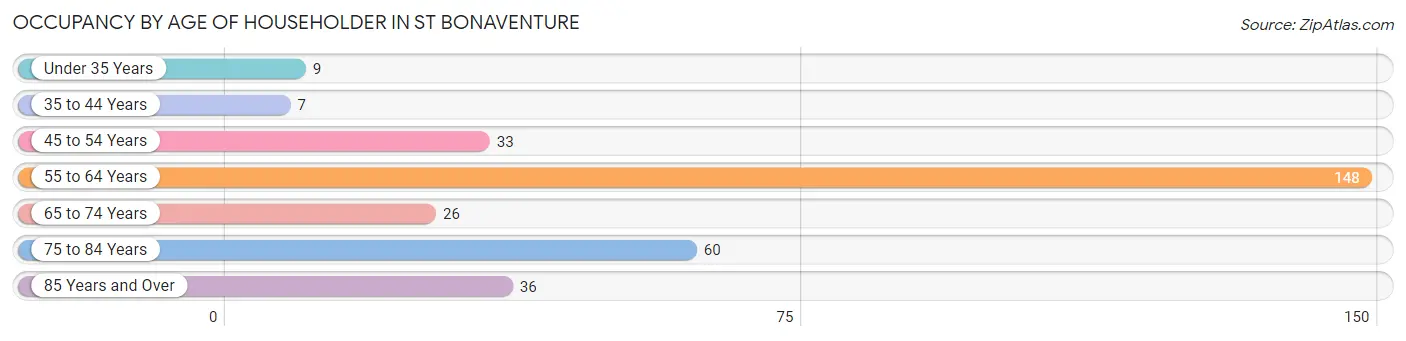
| Age Bracket | # Households | % Households |
| Under 35 Years | 9 | 2.8% |
| 35 to 44 Years | 7 | 2.2% |
| 45 to 54 Years | 33 | 10.3% |
| 55 to 64 Years | 148 | 46.4% |
| 65 to 74 Years | 26 | 8.2% |
| 75 to 84 Years | 60 | 18.8% |
| 85 Years and Over | 36 | 11.3% |
| Total | 319 | 100.0% |
Housing Finances in St Bonaventure
Median Income by Occupancy in St Bonaventure
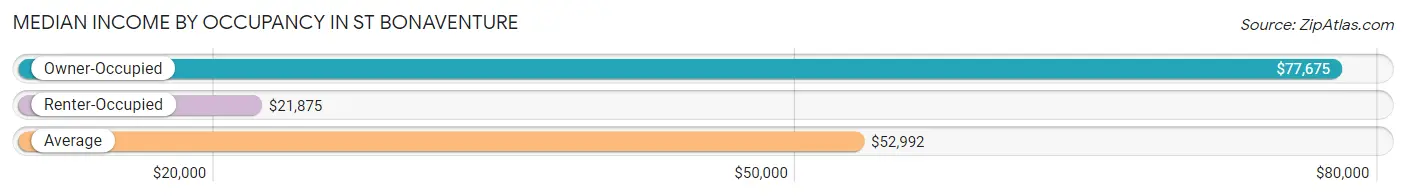
| Occupancy Type | # Households | Median Income |
| Owner-Occupied | 185 (58.0%) | $77,675 |
| Renter-Occupied | 134 (42.0%) | $21,875 |
| Average | 319 (100.0%) | $52,992 |
Occupancy by Householder Income Bracket in St Bonaventure
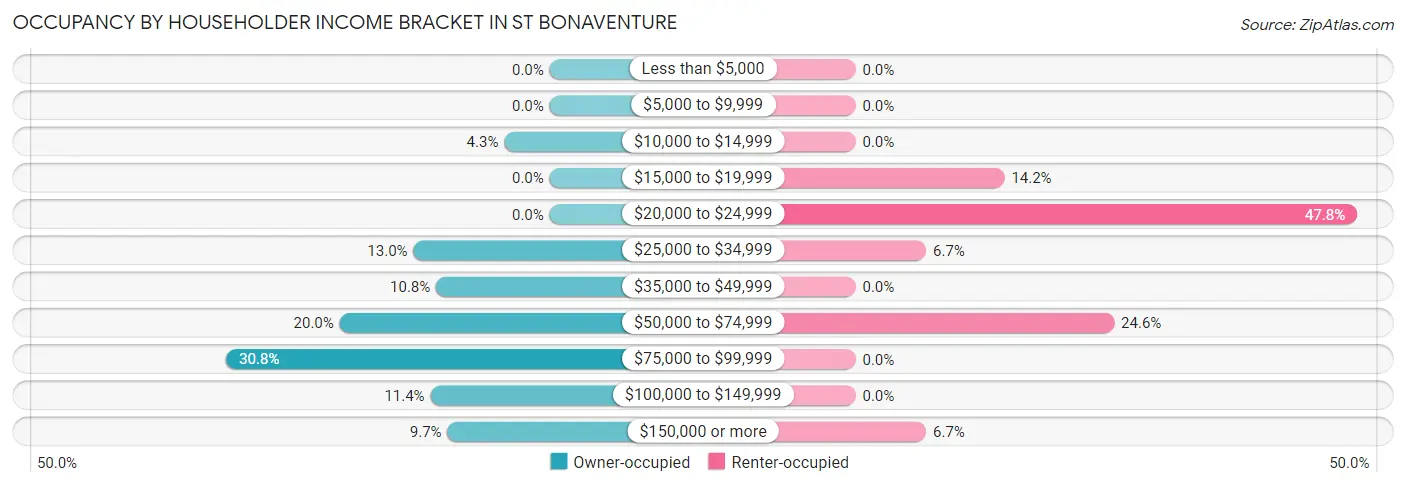
| Income Bracket | Owner-occupied | Renter-occupied |
| Less than $5,000 | 0 (0.0%) | 0 (0.0%) |
| $5,000 to $9,999 | 0 (0.0%) | 0 (0.0%) |
| $10,000 to $14,999 | 8 (4.3%) | 0 (0.0%) |
| $15,000 to $19,999 | 0 (0.0%) | 19 (14.2%) |
| $20,000 to $24,999 | 0 (0.0%) | 64 (47.8%) |
| $25,000 to $34,999 | 24 (13.0%) | 9 (6.7%) |
| $35,000 to $49,999 | 20 (10.8%) | 0 (0.0%) |
| $50,000 to $74,999 | 37 (20.0%) | 33 (24.6%) |
| $75,000 to $99,999 | 57 (30.8%) | 0 (0.0%) |
| $100,000 to $149,999 | 21 (11.4%) | 0 (0.0%) |
| $150,000 or more | 18 (9.7%) | 9 (6.7%) |
| Total | 185 (100.0%) | 134 (100.0%) |
Monthly Housing Cost Tiers in St Bonaventure
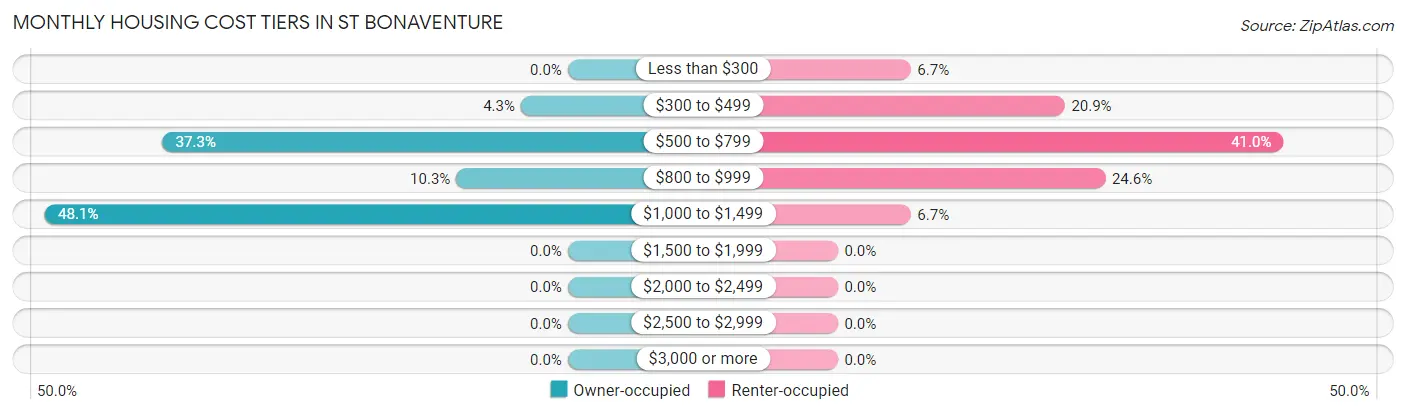
| Monthly Cost | Owner-occupied | Renter-occupied |
| Less than $300 | 0 (0.0%) | 9 (6.7%) |
| $300 to $499 | 8 (4.3%) | 28 (20.9%) |
| $500 to $799 | 69 (37.3%) | 55 (41.0%) |
| $800 to $999 | 19 (10.3%) | 33 (24.6%) |
| $1,000 to $1,499 | 89 (48.1%) | 9 (6.7%) |
| $1,500 to $1,999 | 0 (0.0%) | 0 (0.0%) |
| $2,000 to $2,499 | 0 (0.0%) | 0 (0.0%) |
| $2,500 to $2,999 | 0 (0.0%) | 0 (0.0%) |
| $3,000 or more | 0 (0.0%) | 0 (0.0%) |
| Total | 185 (100.0%) | 134 (100.0%) |
Physical Housing Characteristics in St Bonaventure
Housing Structures in St Bonaventure
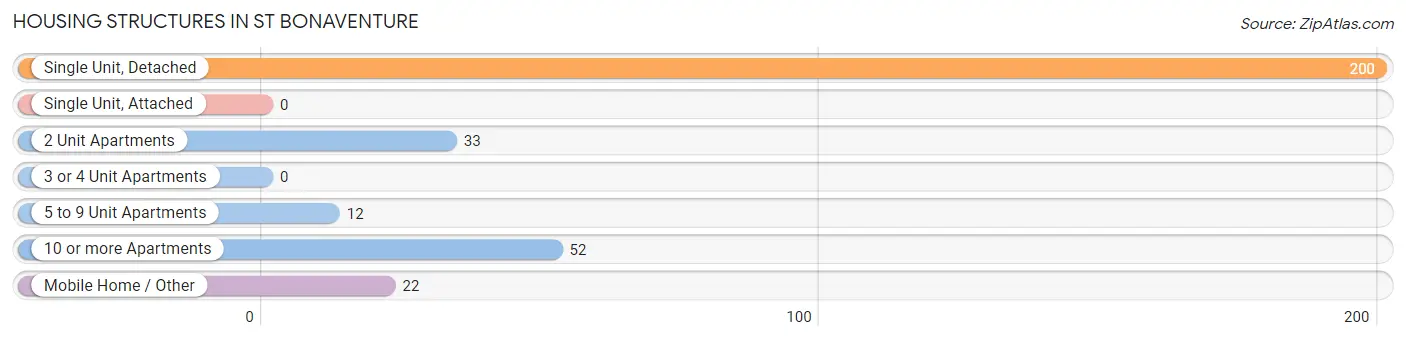
| Structure Type | # Housing Units | % Housing Units |
| Single Unit, Detached | 200 | 62.7% |
| Single Unit, Attached | 0 | 0.0% |
| 2 Unit Apartments | 33 | 10.3% |
| 3 or 4 Unit Apartments | 0 | 0.0% |
| 5 to 9 Unit Apartments | 12 | 3.8% |
| 10 or more Apartments | 52 | 16.3% |
| Mobile Home / Other | 22 | 6.9% |
| Total | 319 | 100.0% |
Housing Structures by Occupancy in St Bonaventure
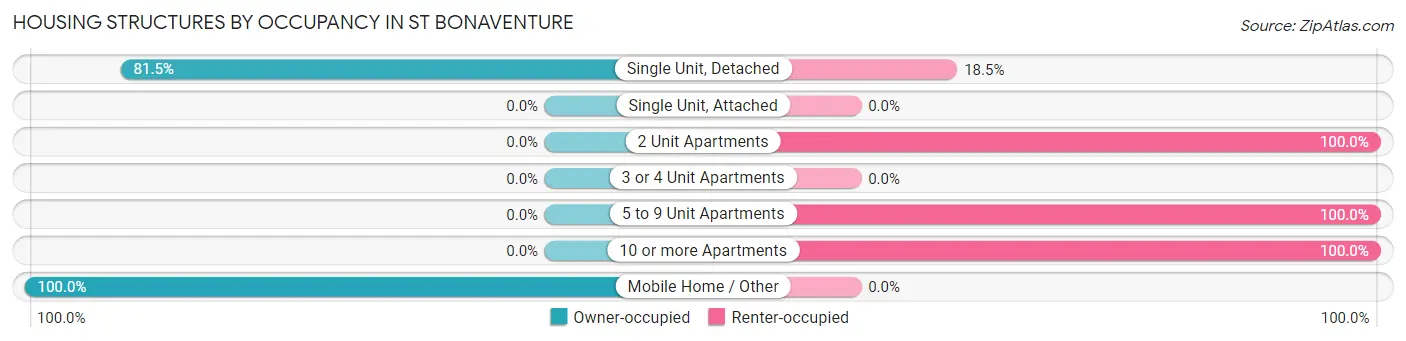
| Structure Type | Owner-occupied | Renter-occupied |
| Single Unit, Detached | 163 (81.5%) | 37 (18.5%) |
| Single Unit, Attached | 0 (0.0%) | 0 (0.0%) |
| 2 Unit Apartments | 0 (0.0%) | 33 (100.0%) |
| 3 or 4 Unit Apartments | 0 (0.0%) | 0 (0.0%) |
| 5 to 9 Unit Apartments | 0 (0.0%) | 12 (100.0%) |
| 10 or more Apartments | 0 (0.0%) | 52 (100.0%) |
| Mobile Home / Other | 22 (100.0%) | 0 (0.0%) |
| Total | 185 (58.0%) | 134 (42.0%) |
Housing Structures by Number of Rooms in St Bonaventure
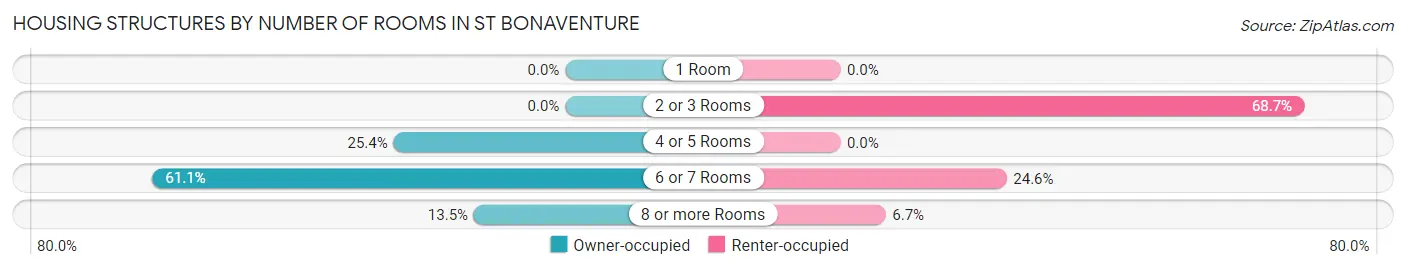
| Number of Rooms | Owner-occupied | Renter-occupied |
| 1 Room | 0 (0.0%) | 0 (0.0%) |
| 2 or 3 Rooms | 0 (0.0%) | 92 (68.7%) |
| 4 or 5 Rooms | 47 (25.4%) | 0 (0.0%) |
| 6 or 7 Rooms | 113 (61.1%) | 33 (24.6%) |
| 8 or more Rooms | 25 (13.5%) | 9 (6.7%) |
| Total | 185 (100.0%) | 134 (100.0%) |
Housing Structure by Heating Type in St Bonaventure
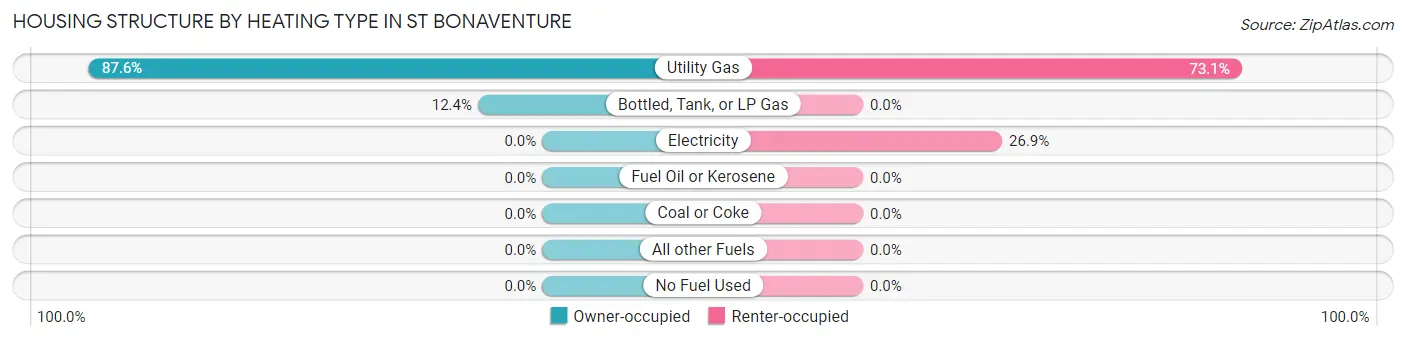
| Heating Type | Owner-occupied | Renter-occupied |
| Utility Gas | 162 (87.6%) | 98 (73.1%) |
| Bottled, Tank, or LP Gas | 23 (12.4%) | 0 (0.0%) |
| Electricity | 0 (0.0%) | 36 (26.9%) |
| Fuel Oil or Kerosene | 0 (0.0%) | 0 (0.0%) |
| Coal or Coke | 0 (0.0%) | 0 (0.0%) |
| All other Fuels | 0 (0.0%) | 0 (0.0%) |
| No Fuel Used | 0 (0.0%) | 0 (0.0%) |
| Total | 185 (100.0%) | 134 (100.0%) |
Household Vehicle Usage in St Bonaventure
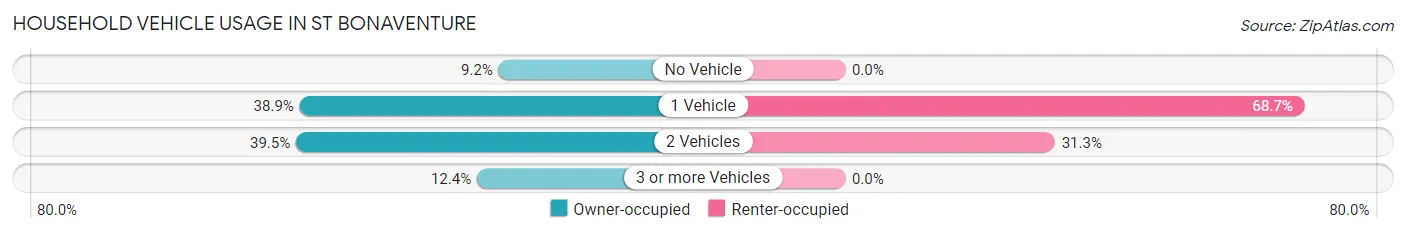
| Vehicles per Household | Owner-occupied | Renter-occupied |
| No Vehicle | 17 (9.2%) | 0 (0.0%) |
| 1 Vehicle | 72 (38.9%) | 92 (68.7%) |
| 2 Vehicles | 73 (39.5%) | 42 (31.3%) |
| 3 or more Vehicles | 23 (12.4%) | 0 (0.0%) |
| Total | 185 (100.0%) | 134 (100.0%) |
Real Estate & Mortgages in St Bonaventure
Real Estate and Mortgage Overview in St Bonaventure
| Characteristic | Without Mortgage | With Mortgage |
| Housing Units | 80 | 105 |
| Median Property Value | $108,900 | $137,100 |
| Median Household Income | $60,294 | $18 |
| Monthly Housing Costs | $608 | $0 |
| Real Estate Taxes | $2,464 | $0 |
Property Value by Mortgage Status in St Bonaventure
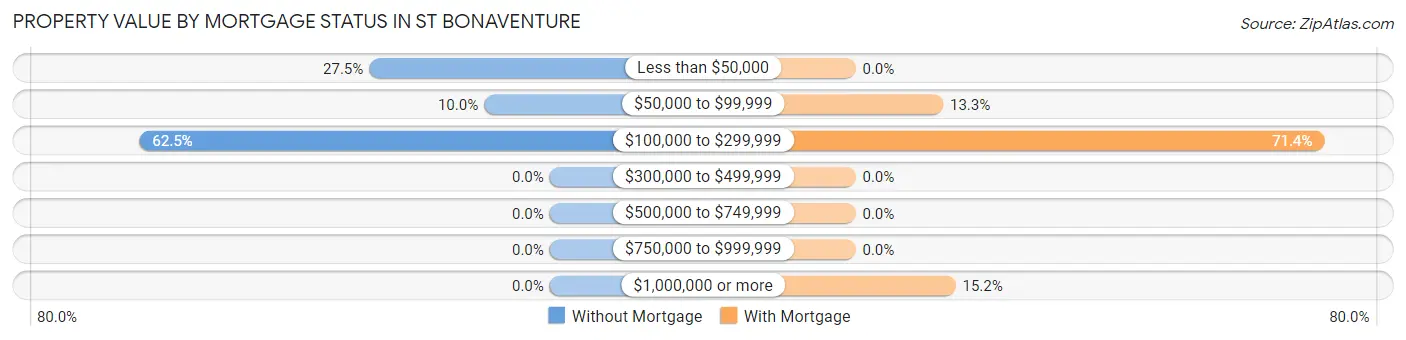
| Property Value | Without Mortgage | With Mortgage |
| Less than $50,000 | 22 (27.5%) | 0 (0.0%) |
| $50,000 to $99,999 | 8 (10.0%) | 14 (13.3%) |
| $100,000 to $299,999 | 50 (62.5%) | 75 (71.4%) |
| $300,000 to $499,999 | 0 (0.0%) | 0 (0.0%) |
| $500,000 to $749,999 | 0 (0.0%) | 0 (0.0%) |
| $750,000 to $999,999 | 0 (0.0%) | 0 (0.0%) |
| $1,000,000 or more | 0 (0.0%) | 16 (15.2%) |
| Total | 80 (100.0%) | 105 (100.0%) |
Household Income by Mortgage Status in St Bonaventure
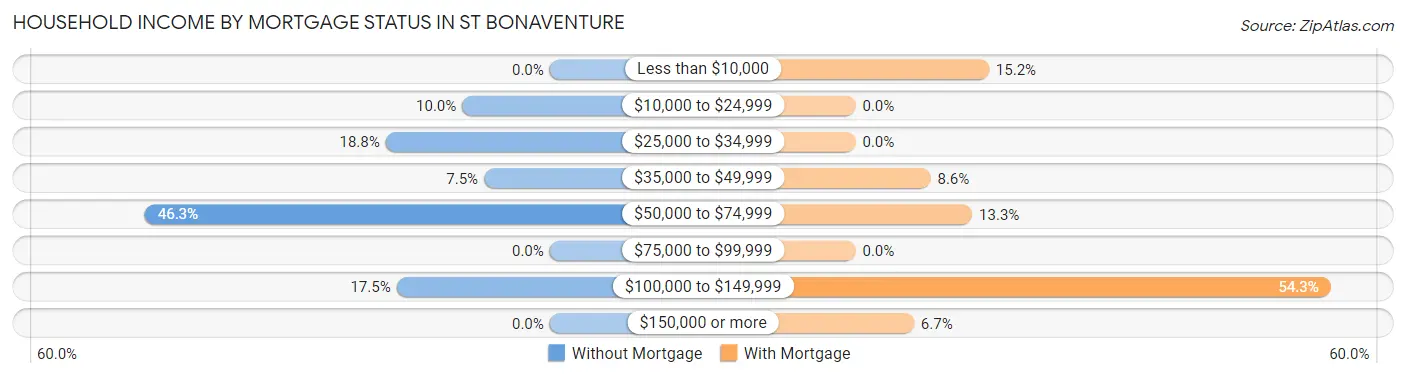
| Household Income | Without Mortgage | With Mortgage |
| Less than $10,000 | 0 (0.0%) | 16 (15.2%) |
| $10,000 to $24,999 | 8 (10.0%) | 0 (0.0%) |
| $25,000 to $34,999 | 15 (18.8%) | 0 (0.0%) |
| $35,000 to $49,999 | 6 (7.5%) | 9 (8.6%) |
| $50,000 to $74,999 | 37 (46.3%) | 14 (13.3%) |
| $75,000 to $99,999 | 0 (0.0%) | 0 (0.0%) |
| $100,000 to $149,999 | 14 (17.5%) | 57 (54.3%) |
| $150,000 or more | 0 (0.0%) | 7 (6.7%) |
| Total | 80 (100.0%) | 105 (100.0%) |
Property Value to Household Income Ratio in St Bonaventure
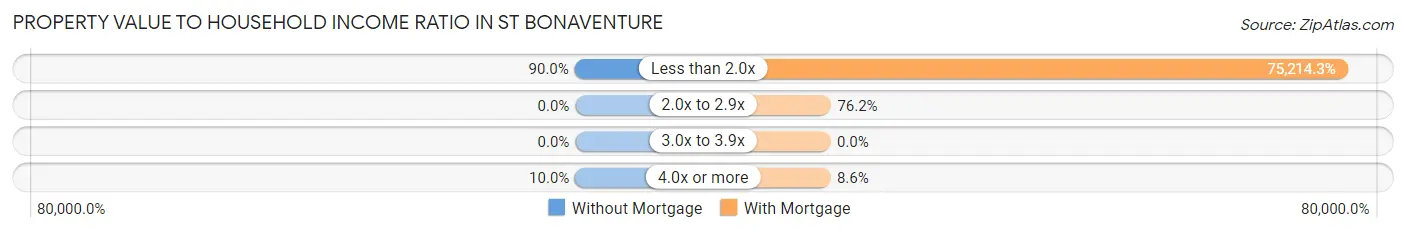
| Value-to-Income Ratio | Without Mortgage | With Mortgage |
| Less than 2.0x | 72 (90.0%) | 78,975 (75,214.3%) |
| 2.0x to 2.9x | 0 (0.0%) | 80 (76.2%) |
| 3.0x to 3.9x | 0 (0.0%) | 0 (0.0%) |
| 4.0x or more | 8 (10.0%) | 9 (8.6%) |
| Total | 80 (100.0%) | 105 (100.0%) |
Real Estate Taxes by Mortgage Status in St Bonaventure
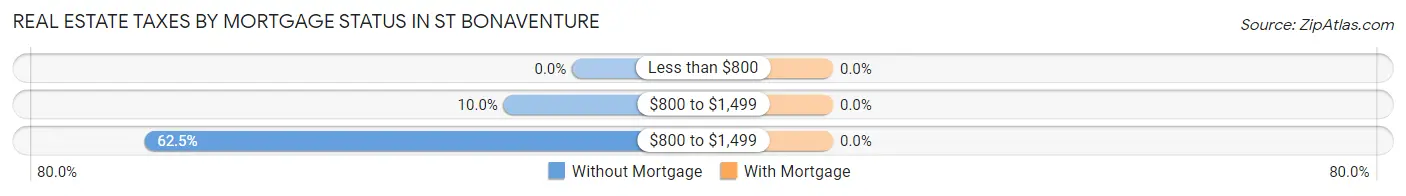
| Property Taxes | Without Mortgage | With Mortgage |
| Less than $800 | 0 (0.0%) | 0 (0.0%) |
| $800 to $1,499 | 8 (10.0%) | 0 (0.0%) |
| $800 to $1,499 | 50 (62.5%) | 0 (0.0%) |
| Total | 80 (100.0%) | 105 (100.0%) |
Health & Disability in St Bonaventure
Health Insurance Coverage by Age in St Bonaventure
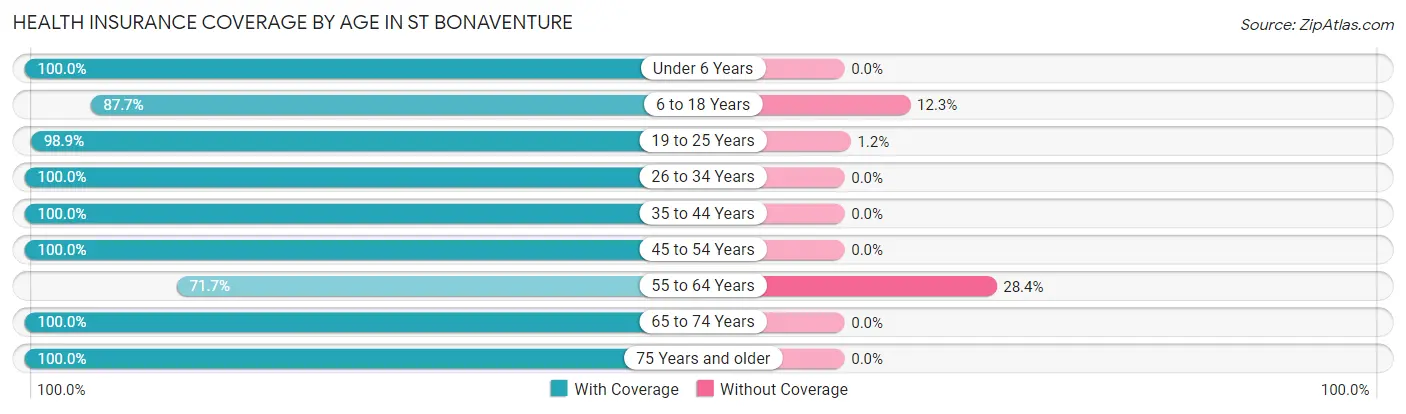
| Age Bracket | With Coverage | Without Coverage |
| Under 6 Years | 10 (100.0%) | 0 (0.0%) |
| 6 to 18 Years | 336 (87.7%) | 47 (12.3%) |
| 19 to 25 Years | 1,036 (98.9%) | 12 (1.1%) |
| 26 to 34 Years | 11 (100.0%) | 0 (0.0%) |
| 35 to 44 Years | 16 (100.0%) | 0 (0.0%) |
| 45 to 54 Years | 124 (100.0%) | 0 (0.0%) |
| 55 to 64 Years | 187 (71.7%) | 74 (28.3%) |
| 65 to 74 Years | 81 (100.0%) | 0 (0.0%) |
| 75 Years and older | 159 (100.0%) | 0 (0.0%) |
| Total | 1,960 (93.6%) | 133 (6.4%) |
Health Insurance Coverage by Citizenship Status in St Bonaventure
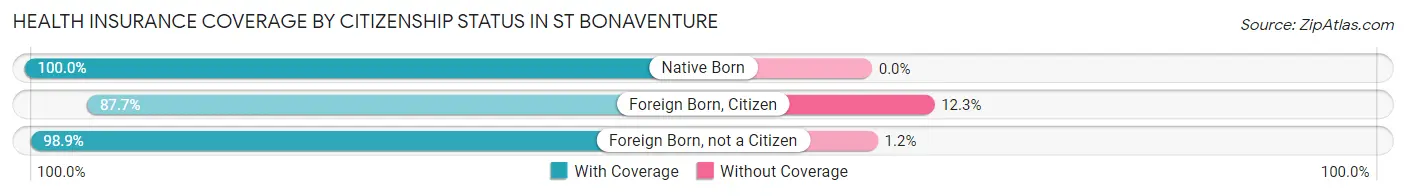
| Citizenship Status | With Coverage | Without Coverage |
| Native Born | 10 (100.0%) | 0 (0.0%) |
| Foreign Born, Citizen | 336 (87.7%) | 47 (12.3%) |
| Foreign Born, not a Citizen | 1,036 (98.9%) | 12 (1.1%) |
Health Insurance Coverage by Household Income in St Bonaventure
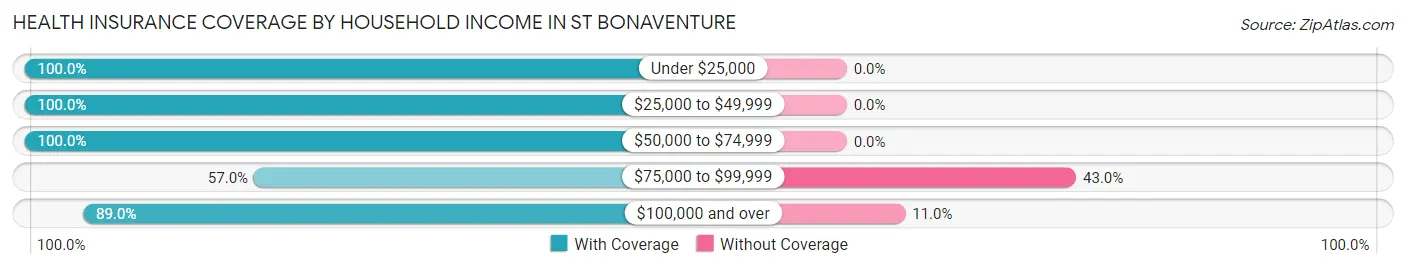
| Household Income | With Coverage | Without Coverage |
| Under $25,000 | 91 (100.0%) | 0 (0.0%) |
| $25,000 to $49,999 | 69 (100.0%) | 0 (0.0%) |
| $50,000 to $74,999 | 169 (100.0%) | 0 (0.0%) |
| $75,000 to $99,999 | 77 (57.0%) | 58 (43.0%) |
| $100,000 and over | 130 (89.0%) | 16 (11.0%) |
Public vs Private Health Insurance Coverage by Age in St Bonaventure
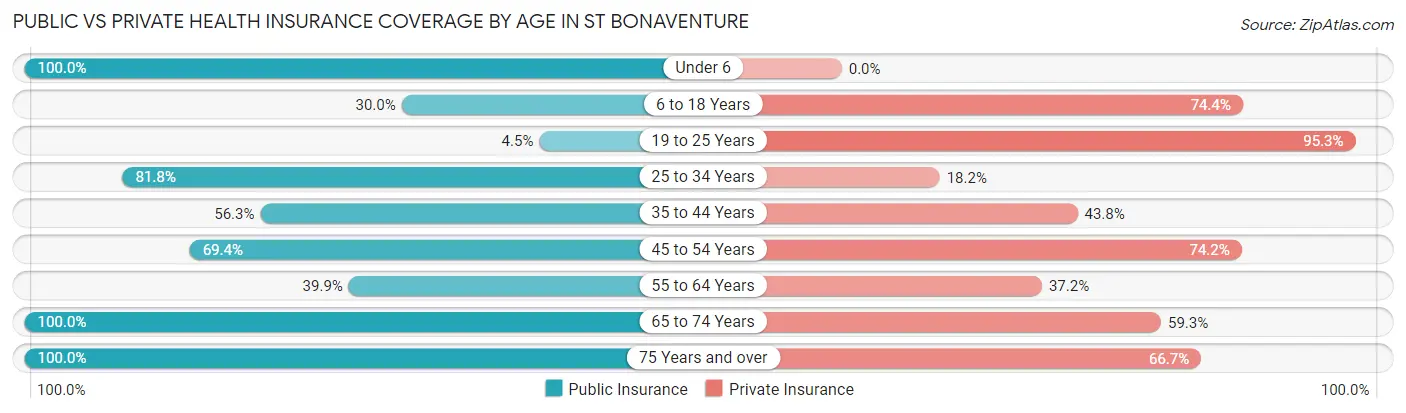
| Age Bracket | Public Insurance | Private Insurance |
| Under 6 | 10 (100.0%) | 0 (0.0%) |
| 6 to 18 Years | 115 (30.0%) | 285 (74.4%) |
| 19 to 25 Years | 47 (4.5%) | 999 (95.3%) |
| 25 to 34 Years | 9 (81.8%) | 2 (18.2%) |
| 35 to 44 Years | 9 (56.2%) | 7 (43.8%) |
| 45 to 54 Years | 86 (69.4%) | 92 (74.2%) |
| 55 to 64 Years | 104 (39.9%) | 97 (37.2%) |
| 65 to 74 Years | 81 (100.0%) | 48 (59.3%) |
| 75 Years and over | 159 (100.0%) | 106 (66.7%) |
| Total | 620 (29.6%) | 1,636 (78.2%) |
Disability Status by Sex by Age in St Bonaventure
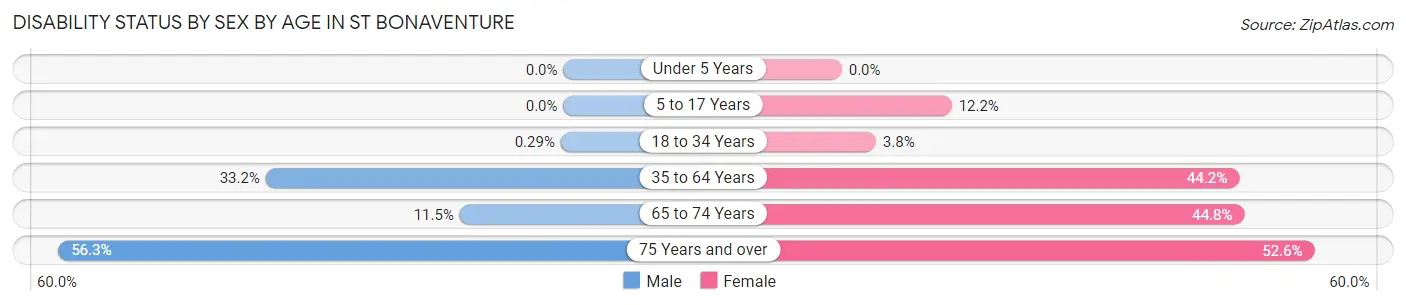
| Age Bracket | Male | Female |
| Under 5 Years | 0 (0.0%) | 0 (0.0%) |
| 5 to 17 Years | 0 (0.0%) | 6 (12.2%) |
| 18 to 34 Years | 2 (0.3%) | 26 (3.8%) |
| 35 to 64 Years | 61 (33.2%) | 96 (44.2%) |
| 65 to 74 Years | 6 (11.5%) | 13 (44.8%) |
| 75 Years and over | 36 (56.2%) | 50 (52.6%) |
Disability Class by Sex by Age in St Bonaventure
Disability Class: Hearing Difficulty
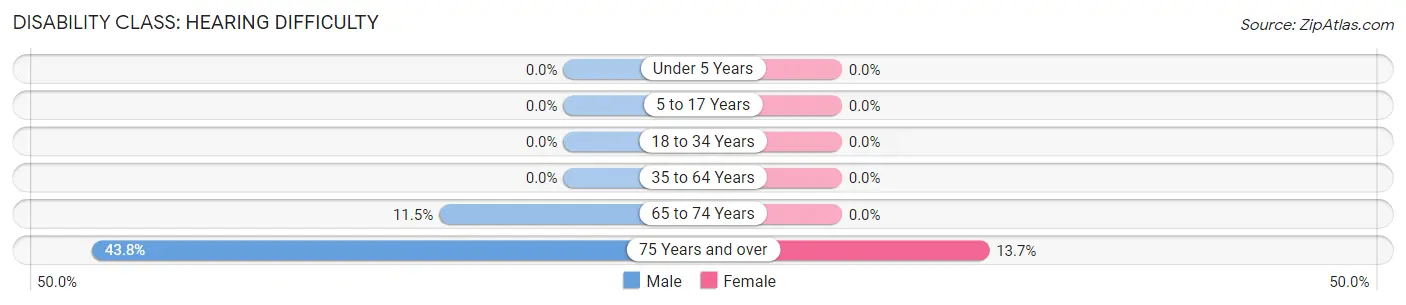
| Age Bracket | Male | Female |
| Under 5 Years | 0 (0.0%) | 0 (0.0%) |
| 5 to 17 Years | 0 (0.0%) | 0 (0.0%) |
| 18 to 34 Years | 0 (0.0%) | 0 (0.0%) |
| 35 to 64 Years | 0 (0.0%) | 0 (0.0%) |
| 65 to 74 Years | 6 (11.5%) | 0 (0.0%) |
| 75 Years and over | 28 (43.8%) | 13 (13.7%) |
Disability Class: Vision Difficulty
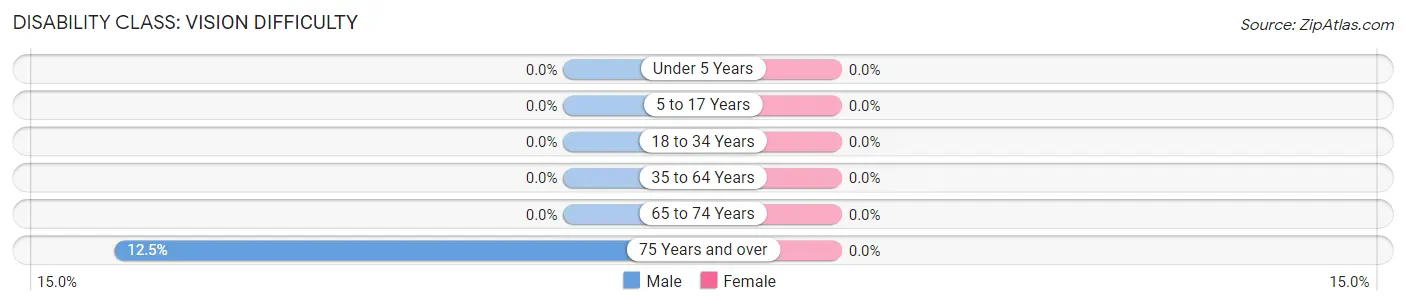
| Age Bracket | Male | Female |
| Under 5 Years | 0 (0.0%) | 0 (0.0%) |
| 5 to 17 Years | 0 (0.0%) | 0 (0.0%) |
| 18 to 34 Years | 0 (0.0%) | 0 (0.0%) |
| 35 to 64 Years | 0 (0.0%) | 0 (0.0%) |
| 65 to 74 Years | 0 (0.0%) | 0 (0.0%) |
| 75 Years and over | 8 (12.5%) | 0 (0.0%) |
Disability Class: Cognitive Difficulty
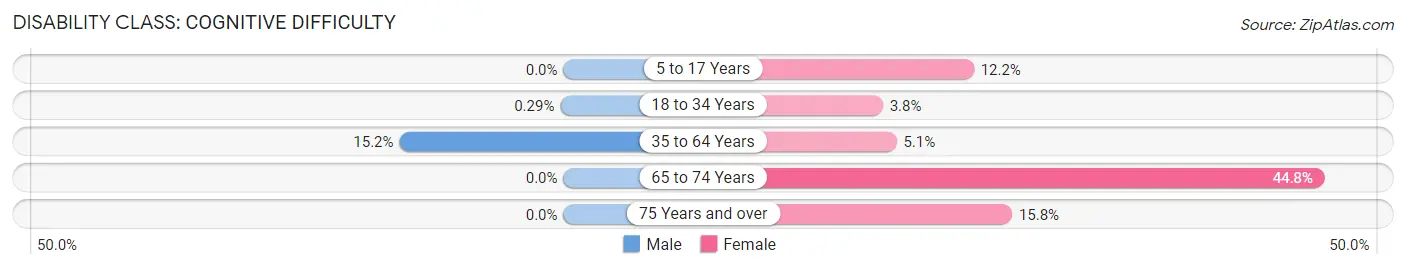
| Age Bracket | Male | Female |
| 5 to 17 Years | 0 (0.0%) | 6 (12.2%) |
| 18 to 34 Years | 2 (0.3%) | 26 (3.8%) |
| 35 to 64 Years | 28 (15.2%) | 11 (5.1%) |
| 65 to 74 Years | 0 (0.0%) | 13 (44.8%) |
| 75 Years and over | 0 (0.0%) | 15 (15.8%) |
Disability Class: Ambulatory Difficulty
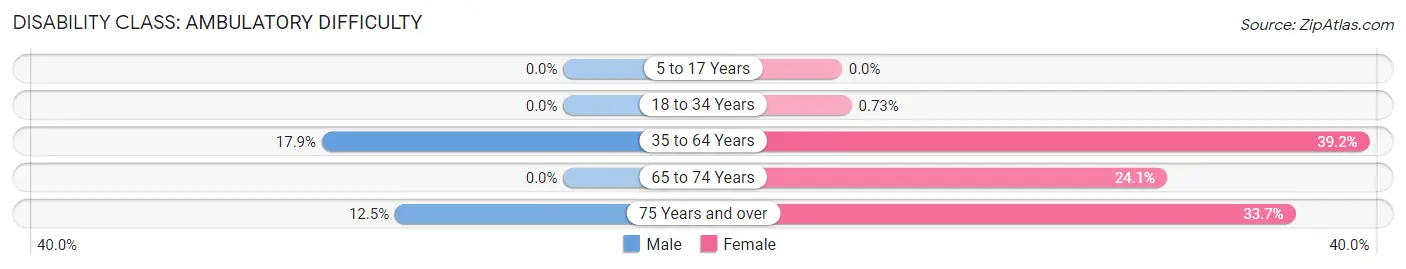
| Age Bracket | Male | Female |
| 5 to 17 Years | 0 (0.0%) | 0 (0.0%) |
| 18 to 34 Years | 0 (0.0%) | 5 (0.7%) |
| 35 to 64 Years | 33 (17.9%) | 85 (39.2%) |
| 65 to 74 Years | 0 (0.0%) | 7 (24.1%) |
| 75 Years and over | 8 (12.5%) | 32 (33.7%) |
Disability Class: Self-Care Difficulty
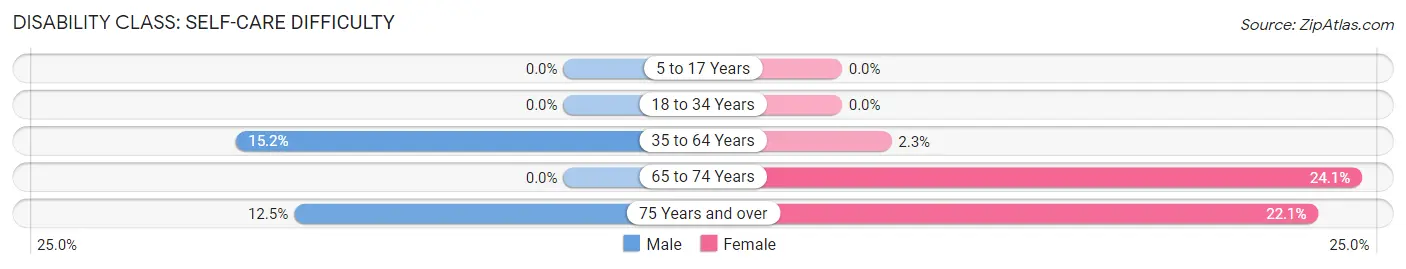
| Age Bracket | Male | Female |
| 5 to 17 Years | 0 (0.0%) | 0 (0.0%) |
| 18 to 34 Years | 0 (0.0%) | 0 (0.0%) |
| 35 to 64 Years | 28 (15.2%) | 5 (2.3%) |
| 65 to 74 Years | 0 (0.0%) | 7 (24.1%) |
| 75 Years and over | 8 (12.5%) | 21 (22.1%) |
Technology Access in St Bonaventure
Computing Device Access in St Bonaventure
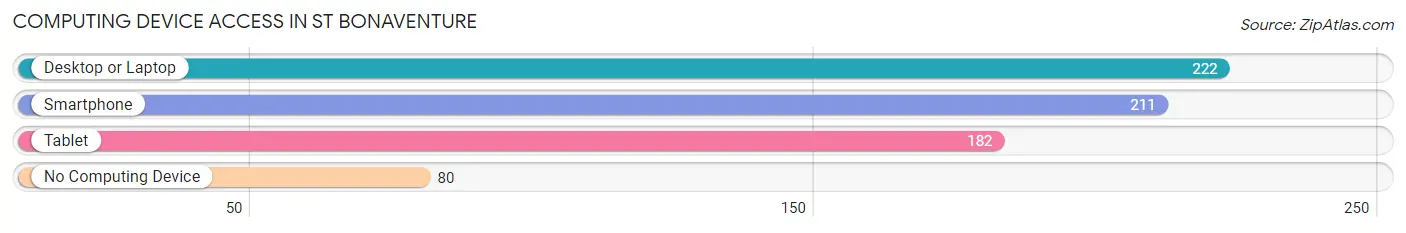
| Device Type | # Households | % Households |
| Desktop or Laptop | 222 | 69.6% |
| Smartphone | 211 | 66.1% |
| Tablet | 182 | 57.1% |
| No Computing Device | 80 | 25.1% |
| Total | 319 | 100.0% |
Internet Access in St Bonaventure
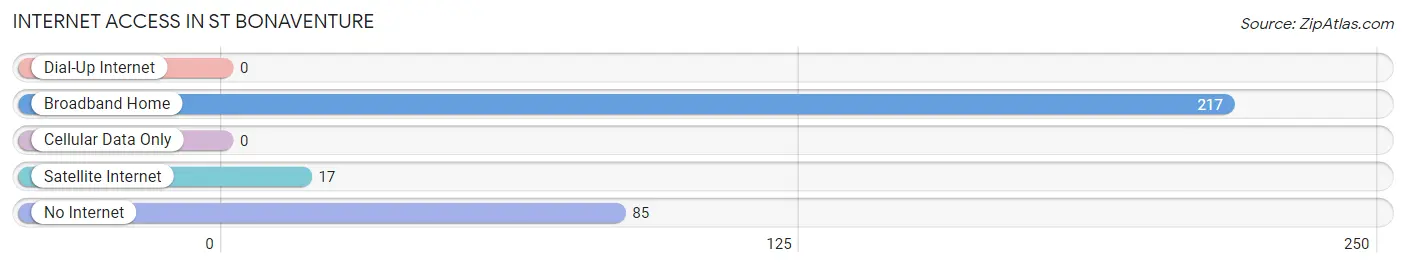
| Internet Type | # Households | % Households |
| Dial-Up Internet | 0 | 0.0% |
| Broadband Home | 217 | 68.0% |
| Cellular Data Only | 0 | 0.0% |
| Satellite Internet | 17 | 5.3% |
| No Internet | 85 | 26.7% |
| Total | 319 | 100.0% |
St Bonaventure Summary
St. Bonaventure, New York is a small village located in Allegany County, New York. It is situated in the foothills of the Allegheny Mountains, and is home to St. Bonaventure University. The village has a population of approximately 1,500 people, and is a popular tourist destination due to its proximity to the Allegheny National Forest and the Finger Lakes region.
History
St. Bonaventure was founded in 1858 by Father John Timon, a Jesuit priest from Buffalo, New York. He named the village after St. Bonaventure, a 13th century Franciscan friar and theologian. Father Timon purchased the land from the Seneca Nation, and established a college and seminary on the site. The college was later renamed St. Bonaventure University, and is now a private, Catholic university.
The village of St. Bonaventure was incorporated in 1871, and the first mayor was elected in 1872. The village was a popular tourist destination in the late 19th and early 20th centuries, and was known for its mineral springs and spas. The village was also home to a number of factories, including a paper mill, a tannery, and a furniture factory.
Geography
St. Bonaventure is located in the foothills of the Allegheny Mountains, and is situated on the Allegheny River. The village is surrounded by rolling hills and forests, and is home to a number of parks and recreational areas. The village is located approximately 30 miles south of Buffalo, New York, and is accessible via Interstate 86.
Economy
St. Bonaventure is primarily a tourist destination, and the village is home to a number of hotels, restaurants, and shops. The village is also home to St. Bonaventure University, which is a major employer in the area. The university employs a number of faculty and staff, and provides a number of services to the local community.
Demographics
As of the 2010 census, the population of St. Bonaventure was 1,521. The racial makeup of the village was 95.3% White, 1.2% African American, 0.7% Native American, 0.7% Asian, 0.2% from other races, and 1.9% from two or more races. The median household income was $37,917, and the median family income was $45,938. The per capita income was $19,945.
St. Bonaventure is a small village with a rich history and a vibrant economy. The village is home to St. Bonaventure University, and is a popular tourist destination due to its proximity to the Allegheny National Forest and the Finger Lakes region. The village has a diverse population, and is a great place to live and work.
Common Questions
What is Per Capita Income in St Bonaventure?
Per Capita income in St Bonaventure is $20,363.
What is the Median Family Income in St Bonaventure?
Median Family Income in St Bonaventure is $78,500.
What is the Median Household income in St Bonaventure?
Median Household Income in St Bonaventure is $52,992.
What is Income or Wage Gap in St Bonaventure?
Income or Wage Gap in St Bonaventure is 5.1%.
Women in St Bonaventure earn 94.9 cents for every dollar earned by a man.
What is Inequality or Gini Index in St Bonaventure?
Inequality or Gini Index in St Bonaventure is 0.38.
What is the Total Population of St Bonaventure?
Total Population of St Bonaventure is 2,093.
What is the Total Male Population of St Bonaventure?
Total Male Population of St Bonaventure is 1,015.
What is the Total Female Population of St Bonaventure?
Total Female Population of St Bonaventure is 1,078.
What is the Ratio of Males per 100 Females in St Bonaventure?
There are 94.16 Males per 100 Females in St Bonaventure.
What is the Ratio of Females per 100 Males in St Bonaventure?
There are 106.21 Females per 100 Males in St Bonaventure.
What is the Median Population Age in St Bonaventure?
Median Population Age in St Bonaventure is 20.9 Years.
What is the Average Family Size in St Bonaventure
Average Family Size in St Bonaventure is 2.7 People.
What is the Average Household Size in St Bonaventure
Average Household Size in St Bonaventure is 1.9 People.
How Large is the Labor Force in St Bonaventure?
There are 764 People in the Labor Forcein in St Bonaventure.
What is the Percentage of People in the Labor Force in St Bonaventure?
37.2% of People are in the Labor Force in St Bonaventure.
What is the Unemployment Rate in St Bonaventure?
Unemployment Rate in St Bonaventure is 5.6%.