Zip Codes with the Highest Percentage of Population Employed in Food Preparation & Serving in Little Neck, NY
RELATED REPORTS & OPTIONS
Food Preparation & Serving
Little Neck
Compare Zip Codes
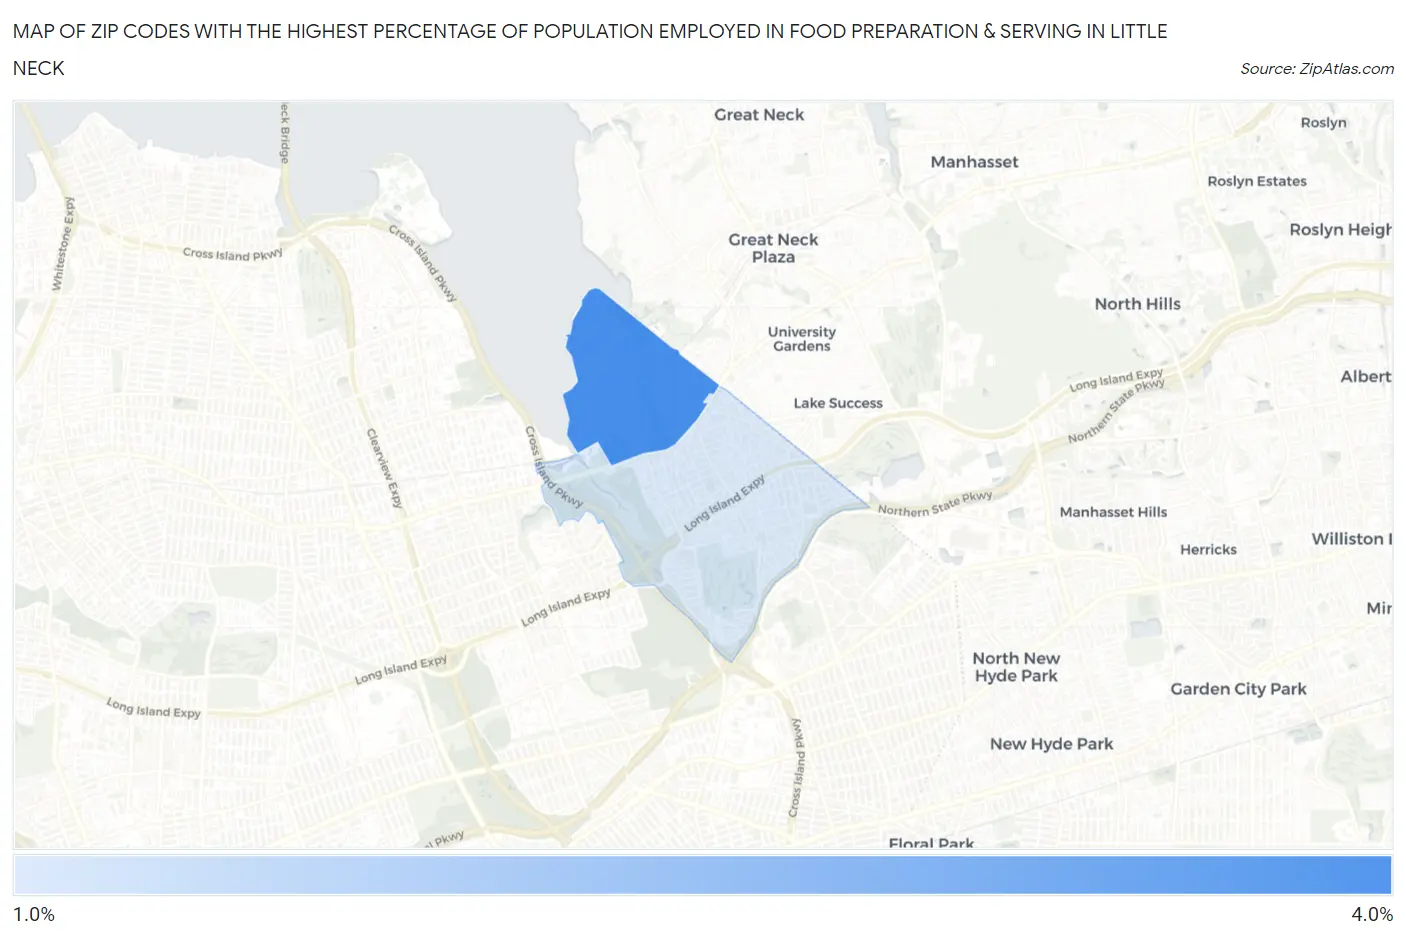
Map of Zip Codes with the Highest Percentage of Population Employed in Food Preparation & Serving in Little Neck
1.0%
3.9%
Zip Codes with the Highest Percentage of Population Employed in Food Preparation & Serving in Little Neck, NY
| Zip Code | % Employed | vs State | vs National | |
| 1. | 11363 | 3.9% | 4.8%(-0.897)#881 | 5.3%(-1.37)#17,456 |
| 2. | 11362 | 1.0% | 4.8%(-3.81)#1,451 | 5.3%(-4.28)#26,958 |
1
Common Questions
What are the Top Zip Codes with the Highest Percentage of Population Employed in Food Preparation & Serving in Little Neck, NY?
Top Zip Codes with the Highest Percentage of Population Employed in Food Preparation & Serving in Little Neck, NY are:
What zip code has the Highest Percentage of Population Employed in Food Preparation & Serving in Little Neck, NY?
11363 has the Highest Percentage of Population Employed in Food Preparation & Serving in Little Neck, NY with 3.9%.
What is the Percentage of Population Employed in Food Preparation & Serving in New York?
Percentage of Population Employed in Food Preparation & Serving in New York is 4.8%.
What is the Percentage of Population Employed in Food Preparation & Serving in the United States?
Percentage of Population Employed in Food Preparation & Serving in the United States is 5.3%.