Zip Codes with the Highest Percentage of Population Employed in Food Preparation & Serving in Hempstead, NY
RELATED REPORTS & OPTIONS
Food Preparation & Serving
Hempstead
Compare Zip Codes
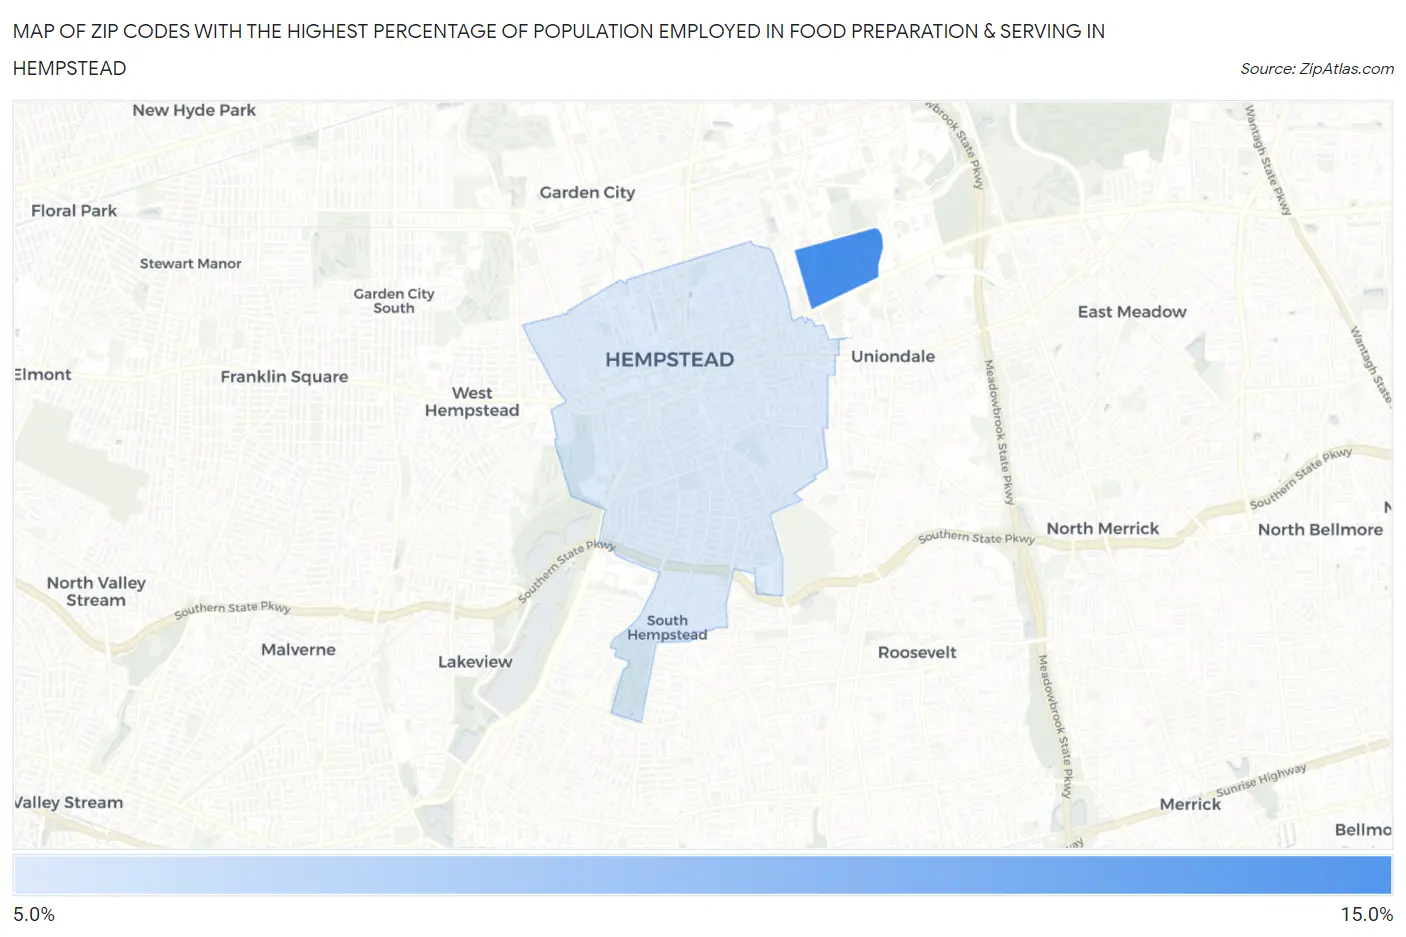
Map of Zip Codes with the Highest Percentage of Population Employed in Food Preparation & Serving in Hempstead
6.3%
11.9%
Zip Codes with the Highest Percentage of Population Employed in Food Preparation & Serving in Hempstead, NY
| Zip Code | % Employed | vs State | vs National | |
| 1. | 11549 | 11.9% | 4.8%(+7.04)#97 | 5.3%(+6.57)#1,716 |
| 2. | 11550 | 6.3% | 4.8%(+1.46)#422 | 5.3%(+0.994)#8,488 |
1
Common Questions
What are the Top Zip Codes with the Highest Percentage of Population Employed in Food Preparation & Serving in Hempstead, NY?
Top Zip Codes with the Highest Percentage of Population Employed in Food Preparation & Serving in Hempstead, NY are:
What zip code has the Highest Percentage of Population Employed in Food Preparation & Serving in Hempstead, NY?
11549 has the Highest Percentage of Population Employed in Food Preparation & Serving in Hempstead, NY with 11.9%.
What is the Percentage of Population Employed in Food Preparation & Serving in Hempstead, NY?
Percentage of Population Employed in Food Preparation & Serving in Hempstead is 6.5%.
What is the Percentage of Population Employed in Food Preparation & Serving in New York?
Percentage of Population Employed in Food Preparation & Serving in New York is 4.8%.
What is the Percentage of Population Employed in Food Preparation & Serving in the United States?
Percentage of Population Employed in Food Preparation & Serving in the United States is 5.3%.