Zip Codes with the Highest Percentage of Population Employed in Food Preparation & Serving in Far Rockaway, NY
RELATED REPORTS & OPTIONS
Food Preparation & Serving
Far Rockaway
Compare Zip Codes
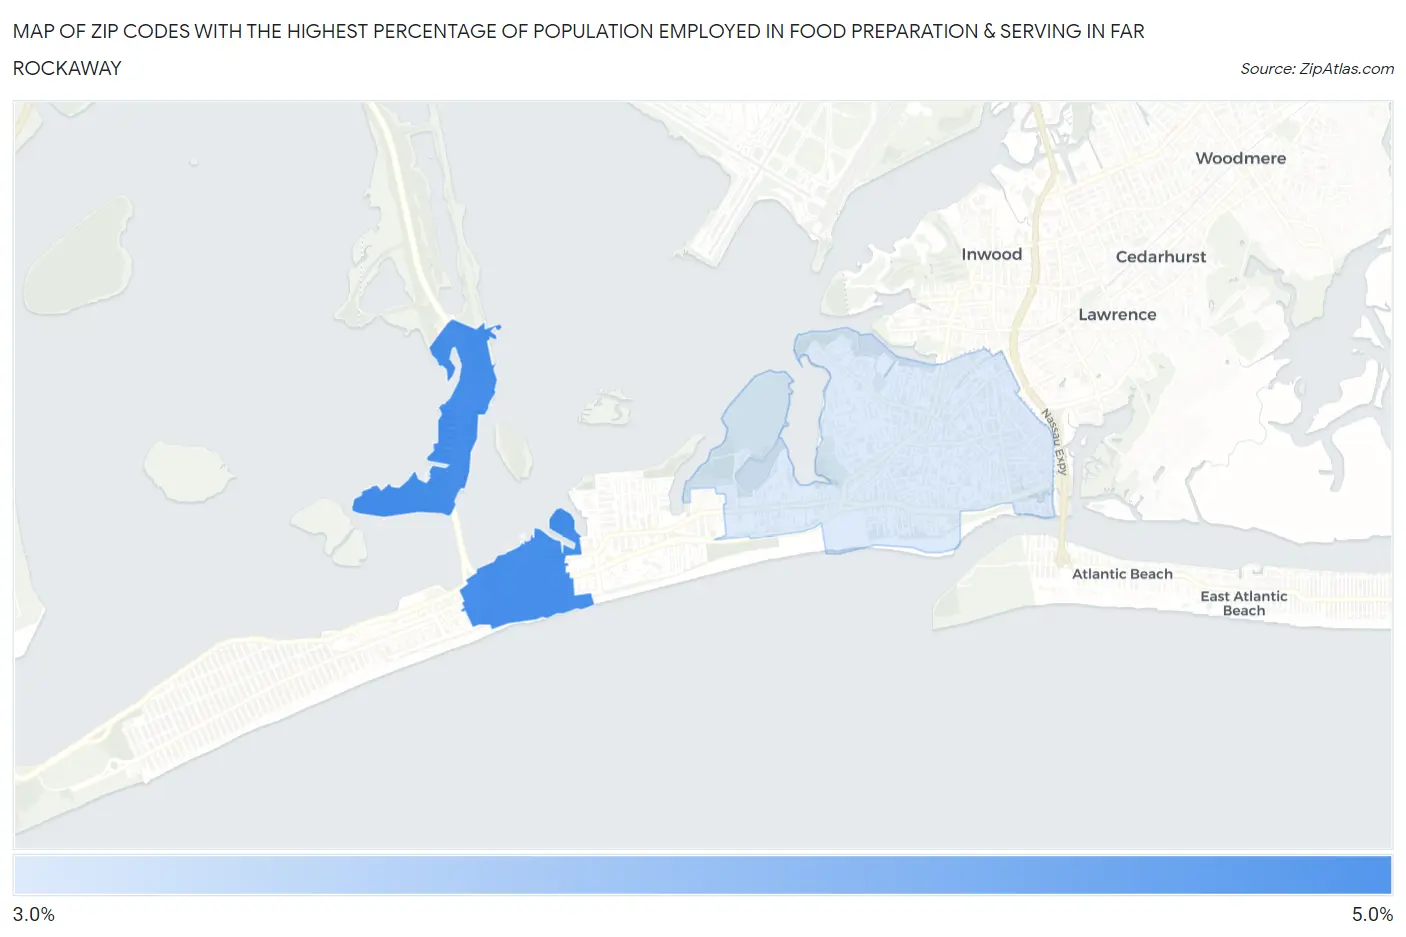
Map of Zip Codes with the Highest Percentage of Population Employed in Food Preparation & Serving in Far Rockaway
4.0%
4.7%
Zip Codes with the Highest Percentage of Population Employed in Food Preparation & Serving in Far Rockaway, NY
| Zip Code | % Employed | vs State | vs National | |
| 1. | 11693 | 4.7% | 4.8%(-0.118)#677 | 5.3%(-0.589)#14,167 |
| 2. | 11691 | 4.0% | 4.8%(-0.857)#868 | 5.3%(-1.33)#17,292 |
1
Common Questions
What are the Top Zip Codes with the Highest Percentage of Population Employed in Food Preparation & Serving in Far Rockaway, NY?
Top Zip Codes with the Highest Percentage of Population Employed in Food Preparation & Serving in Far Rockaway, NY are:
What zip code has the Highest Percentage of Population Employed in Food Preparation & Serving in Far Rockaway, NY?
11693 has the Highest Percentage of Population Employed in Food Preparation & Serving in Far Rockaway, NY with 4.7%.
What is the Percentage of Population Employed in Food Preparation & Serving in New York?
Percentage of Population Employed in Food Preparation & Serving in New York is 4.8%.
What is the Percentage of Population Employed in Food Preparation & Serving in the United States?
Percentage of Population Employed in Food Preparation & Serving in the United States is 5.3%.