Zip Codes with the Highest Percentage of Population Employed in Food Preparation & Serving in New York
RELATED REPORTS & OPTIONS
Food Preparation & Serving
New York
Compare Zip Codes
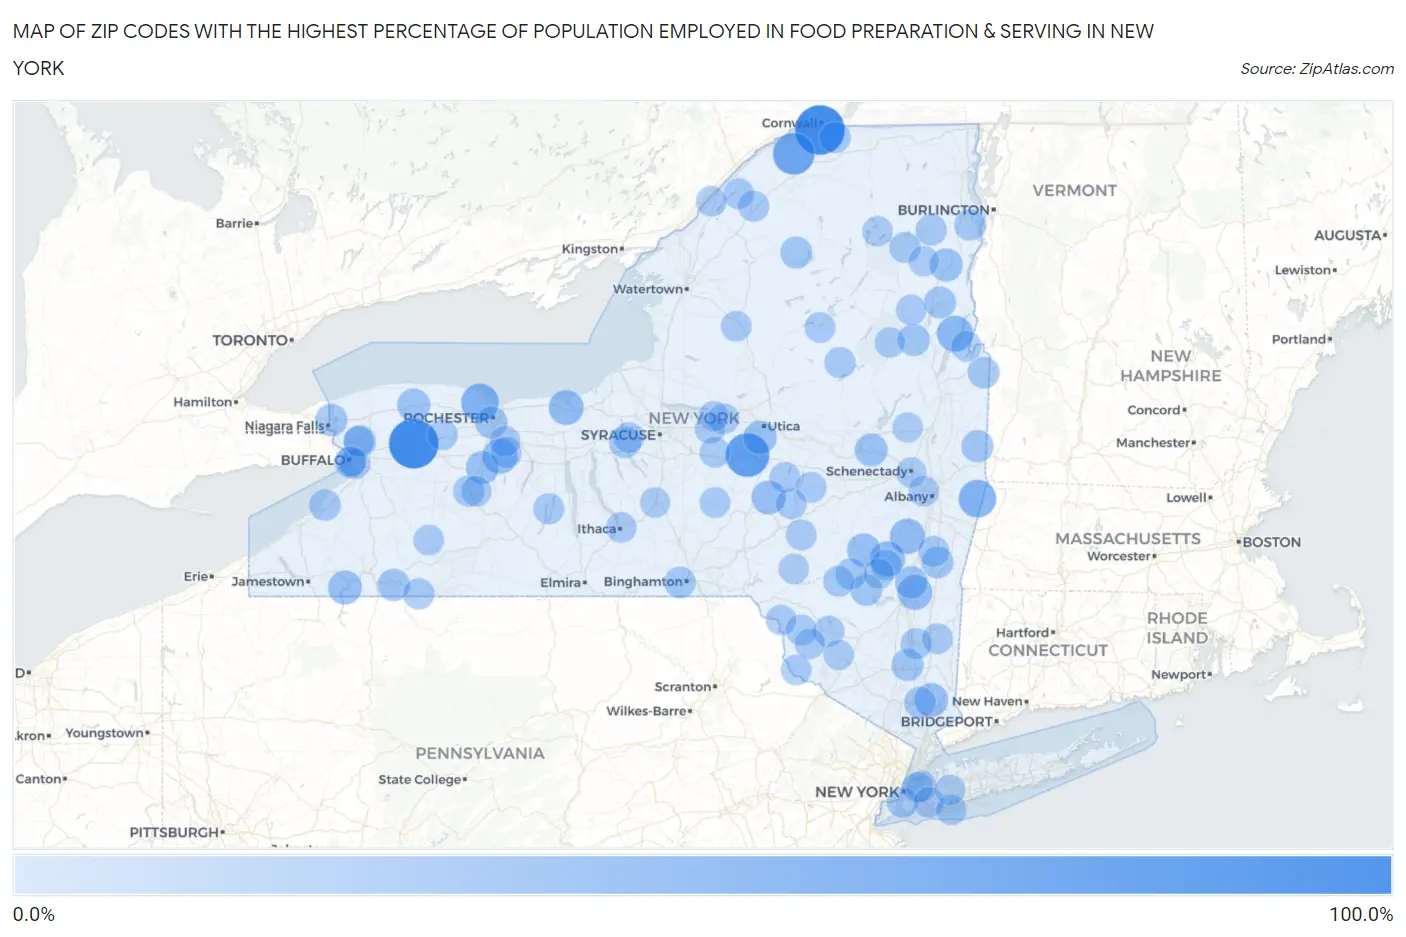
Map of Zip Codes with the Highest Percentage of Population Employed in Food Preparation & Serving in New York
0.0%
100.0%
Zip Codes with the Highest Percentage of Population Employed in Food Preparation & Serving in New York
| Zip Code | % Employed | vs State | vs National | |
| 1. | 14056 | 100.0% | 4.8%(+95.2)#1 | 5.3%(+94.7)#6 |
| 2. | 13683 | 100.0% | 4.8%(+95.2)#2 | 5.3%(+94.7)#8 |
| 3. | 13455 | 72.7% | 4.8%(+67.9)#3 | 5.3%(+67.4)#21 |
| 4. | 13678 | 62.7% | 4.8%(+57.9)#4 | 5.3%(+57.4)#28 |
| 5. | 14515 | 45.0% | 4.8%(+40.1)#5 | 5.3%(+39.7)#75 |
| 6. | 12040 | 44.4% | 4.8%(+39.6)#6 | 5.3%(+39.2)#78 |
| 7. | 12874 | 37.7% | 4.8%(+32.9)#7 | 5.3%(+32.4)#120 |
| 8. | 12176 | 33.7% | 4.8%(+28.8)#8 | 5.3%(+28.4)#166 |
| 9. | 12424 | 33.0% | 4.8%(+28.2)#9 | 5.3%(+27.8)#172 |
| 10. | 14585 | 32.8% | 4.8%(+28.0)#10 | 5.3%(+27.5)#175 |
| 11. | 14413 | 32.0% | 4.8%(+27.2)#11 | 5.3%(+26.7)#185 |
| 12. | 12504 | 32.0% | 4.8%(+27.1)#12 | 5.3%(+26.7)#187 |
| 13. | 13342 | 28.2% | 4.8%(+23.4)#13 | 5.3%(+22.9)#245 |
| 14. | 14783 | 27.8% | 4.8%(+23.0)#14 | 5.3%(+22.5)#249 |
| 15. | 10527 | 27.2% | 4.8%(+22.4)#15 | 5.3%(+21.9)#260 |
| 16. | 13319 | 25.4% | 4.8%(+20.6)#16 | 5.3%(+20.1)#300 |
| 17. | 12407 | 25.0% | 4.8%(+20.2)#17 | 5.3%(+19.7)#315 |
| 18. | 12964 | 24.3% | 4.8%(+19.5)#18 | 5.3%(+19.0)#331 |
| 19. | 14480 | 24.0% | 4.8%(+19.2)#19 | 5.3%(+18.7)#341 |
| 20. | 14479 | 23.9% | 4.8%(+19.1)#20 | 5.3%(+18.6)#348 |
| 21. | 12177 | 23.7% | 4.8%(+18.9)#21 | 5.3%(+18.5)#353 |
| 22. | 12453 | 22.0% | 4.8%(+17.2)#22 | 5.3%(+16.7)#418 |
| 23. | 14109 | 20.7% | 4.8%(+15.9)#23 | 5.3%(+15.4)#467 |
| 24. | 14778 | 20.6% | 4.8%(+15.7)#24 | 5.3%(+15.3)#477 |
| 25. | 14627 | 20.4% | 4.8%(+15.6)#25 | 5.3%(+15.1)#482 |
| 26. | 14261 | 20.2% | 4.8%(+15.4)#26 | 5.3%(+14.9)#494 |
| 27. | 12862 | 20.0% | 4.8%(+15.2)#27 | 5.3%(+14.7)#502 |
| 28. | 12512 | 20.0% | 4.8%(+15.2)#28 | 5.3%(+14.7)#504 |
| 29. | 12057 | 19.9% | 4.8%(+15.1)#29 | 5.3%(+14.6)#514 |
| 30. | 12513 | 18.9% | 4.8%(+14.1)#30 | 5.3%(+13.6)#576 |
| 31. | 13666 | 18.8% | 4.8%(+14.0)#31 | 5.3%(+13.5)#582 |
| 32. | 12858 | 18.8% | 4.8%(+13.9)#32 | 5.3%(+13.5)#588 |
| 33. | 12849 | 17.9% | 4.8%(+13.1)#33 | 5.3%(+12.6)#665 |
| 34. | 12464 | 17.9% | 4.8%(+13.1)#34 | 5.3%(+12.6)#669 |
| 35. | 10517 | 17.6% | 4.8%(+12.7)#35 | 5.3%(+12.3)#700 |
| 36. | 14061 | 17.5% | 4.8%(+12.7)#36 | 5.3%(+12.2)#708 |
| 37. | 13153 | 17.0% | 4.8%(+12.2)#37 | 5.3%(+11.8)#745 |
| 38. | 12914 | 16.8% | 4.8%(+12.0)#38 | 5.3%(+11.5)#763 |
| 39. | 13902 | 16.8% | 4.8%(+12.0)#39 | 5.3%(+11.5)#765 |
| 40. | 12465 | 16.7% | 4.8%(+11.9)#40 | 5.3%(+11.4)#779 |
| 41. | 12996 | 16.6% | 4.8%(+11.8)#41 | 5.3%(+11.3)#788 |
| 42. | 14203 | 16.0% | 4.8%(+11.2)#42 | 5.3%(+10.7)#865 |
| 43. | 12987 | 15.9% | 4.8%(+11.1)#43 | 5.3%(+10.6)#872 |
| 44. | 14721 | 15.7% | 4.8%(+10.9)#44 | 5.3%(+10.4)#892 |
| 45. | 12604 | 15.5% | 4.8%(+10.7)#45 | 5.3%(+10.2)#913 |
| 46. | 14556 | 15.4% | 4.8%(+10.6)#46 | 5.3%(+10.1)#928 |
| 47. | 12139 | 15.4% | 4.8%(+10.6)#47 | 5.3%(+10.1)#930 |
| 48. | 12946 | 15.1% | 4.8%(+10.3)#48 | 5.3%(+9.84)#964 |
| 49. | 11368 | 15.1% | 4.8%(+10.2)#49 | 5.3%(+9.78)#973 |
| 50. | 14475 | 14.9% | 4.8%(+10.1)#50 | 5.3%(+9.63)#991 |
| 51. | 12406 | 14.9% | 4.8%(+10.1)#51 | 5.3%(+9.63)#992 |
| 52. | 14478 | 14.9% | 4.8%(+10.1)#52 | 5.3%(+9.61)#995 |
| 53. | 13630 | 14.9% | 4.8%(+10.1)#53 | 5.3%(+9.60)#999 |
| 54. | 12172 | 14.7% | 4.8%(+9.92)#54 | 5.3%(+9.45)#1,022 |
| 55. | 12485 | 14.7% | 4.8%(+9.87)#55 | 5.3%(+9.40)#1,033 |
| 56. | 11220 | 14.5% | 4.8%(+9.65)#56 | 5.3%(+9.18)#1,066 |
| 57. | 12747 | 14.2% | 4.8%(+9.36)#57 | 5.3%(+8.89)#1,129 |
| 58. | 13450 | 14.2% | 4.8%(+9.36)#58 | 5.3%(+8.89)#1,130 |
| 59. | 13360 | 13.9% | 4.8%(+9.05)#59 | 5.3%(+8.58)#1,192 |
| 60. | 14506 | 13.8% | 4.8%(+9.01)#60 | 5.3%(+8.54)#1,201 |
| 61. | 13807 | 13.8% | 4.8%(+9.00)#61 | 5.3%(+8.53)#1,202 |
| 62. | 13654 | 13.8% | 4.8%(+8.99)#62 | 5.3%(+8.52)#1,205 |
| 63. | 14717 | 13.8% | 4.8%(+8.98)#63 | 5.3%(+8.51)#1,208 |
| 64. | 11373 | 13.8% | 4.8%(+8.97)#64 | 5.3%(+8.50)#1,212 |
| 65. | 13757 | 13.7% | 4.8%(+8.89)#65 | 5.3%(+8.41)#1,231 |
| 66. | 12585 | 13.7% | 4.8%(+8.88)#66 | 5.3%(+8.41)#1,233 |
| 67. | 12748 | 13.7% | 4.8%(+8.87)#67 | 5.3%(+8.40)#1,234 |
| 68. | 11430 | 13.3% | 4.8%(+8.52)#68 | 5.3%(+8.05)#1,306 |
| 69. | 13457 | 13.3% | 4.8%(+8.52)#69 | 5.3%(+8.05)#1,313 |
| 70. | 13060 | 13.3% | 4.8%(+8.45)#70 | 5.3%(+7.98)#1,326 |
| 71. | 13404 | 13.2% | 4.8%(+8.39)#71 | 5.3%(+7.92)#1,338 |
| 72. | 13408 | 13.2% | 4.8%(+8.36)#72 | 5.3%(+7.89)#1,344 |
| 73. | 12222 | 13.2% | 4.8%(+8.34)#73 | 5.3%(+7.86)#1,358 |
| 74. | 13478 | 13.1% | 4.8%(+8.32)#74 | 5.3%(+7.85)#1,360 |
| 75. | 14853 | 13.1% | 4.8%(+8.27)#75 | 5.3%(+7.80)#1,371 |
| 76. | 12792 | 13.0% | 4.8%(+8.18)#76 | 5.3%(+7.71)#1,396 |
| 77. | 14462 | 13.0% | 4.8%(+8.14)#77 | 5.3%(+7.67)#1,402 |
| 78. | 13614 | 13.0% | 4.8%(+8.14)#78 | 5.3%(+7.67)#1,403 |
| 79. | 13163 | 12.8% | 4.8%(+8.00)#79 | 5.3%(+7.53)#1,436 |
| 80. | 12741 | 12.8% | 4.8%(+8.00)#80 | 5.3%(+7.53)#1,437 |
| 81. | 13844 | 12.8% | 4.8%(+7.98)#81 | 5.3%(+7.50)#1,443 |
| 82. | 12857 | 12.8% | 4.8%(+7.94)#82 | 5.3%(+7.47)#1,451 |
| 83. | 14557 | 12.7% | 4.8%(+7.88)#83 | 5.3%(+7.41)#1,467 |
| 84. | 12749 | 12.7% | 4.8%(+7.87)#84 | 5.3%(+7.40)#1,470 |
| 85. | 12819 | 12.7% | 4.8%(+7.86)#85 | 5.3%(+7.39)#1,474 |
| 86. | 13054 | 12.2% | 4.8%(+7.37)#86 | 5.3%(+6.90)#1,604 |
| 87. | 13045 | 12.1% | 4.8%(+7.29)#87 | 5.3%(+6.82)#1,627 |
| 88. | 11569 | 12.1% | 4.8%(+7.27)#88 | 5.3%(+6.80)#1,633 |
| 89. | 12856 | 12.1% | 4.8%(+7.26)#89 | 5.3%(+6.79)#1,636 |
| 90. | 14210 | 12.1% | 4.8%(+7.26)#90 | 5.3%(+6.79)#1,639 |
| 91. | 12850 | 12.0% | 4.8%(+7.23)#91 | 5.3%(+6.76)#1,647 |
| 92. | 12775 | 12.0% | 4.8%(+7.15)#92 | 5.3%(+6.68)#1,680 |
| 93. | 14260 | 11.9% | 4.8%(+7.13)#93 | 5.3%(+6.66)#1,686 |
| 94. | 12945 | 11.9% | 4.8%(+7.11)#94 | 5.3%(+6.64)#1,696 |
| 95. | 13782 | 11.9% | 4.8%(+7.05)#95 | 5.3%(+6.58)#1,712 |
| 96. | 14204 | 11.9% | 4.8%(+7.05)#96 | 5.3%(+6.58)#1,715 |
| 97. | 11549 | 11.9% | 4.8%(+7.04)#97 | 5.3%(+6.57)#1,716 |
| 98. | 12943 | 11.8% | 4.8%(+6.95)#98 | 5.3%(+6.48)#1,751 |
| 99. | 12307 | 11.7% | 4.8%(+6.89)#99 | 5.3%(+6.42)#1,770 |
| 100. | 12450 | 11.7% | 4.8%(+6.84)#100 | 5.3%(+6.37)#1,791 |
Common Questions
What are the Top 10 Zip Codes with the Highest Percentage of Population Employed in Food Preparation & Serving in New York?
Top 10 Zip Codes with the Highest Percentage of Population Employed in Food Preparation & Serving in New York are:
What zip code has the Highest Percentage of Population Employed in Food Preparation & Serving in New York?
14056 has the Highest Percentage of Population Employed in Food Preparation & Serving in New York with 100.0%.
What is the Percentage of Population Employed in Food Preparation & Serving in the State of New York?
Percentage of Population Employed in Food Preparation & Serving in New York is 4.8%.
What is the Percentage of Population Employed in Food Preparation & Serving in the United States?
Percentage of Population Employed in Food Preparation & Serving in the United States is 5.3%.