Cities with the Highest Percentage of Population Employed in Utilities in New York
RELATED REPORTS & OPTIONS
Utilities
New York
Compare Cities
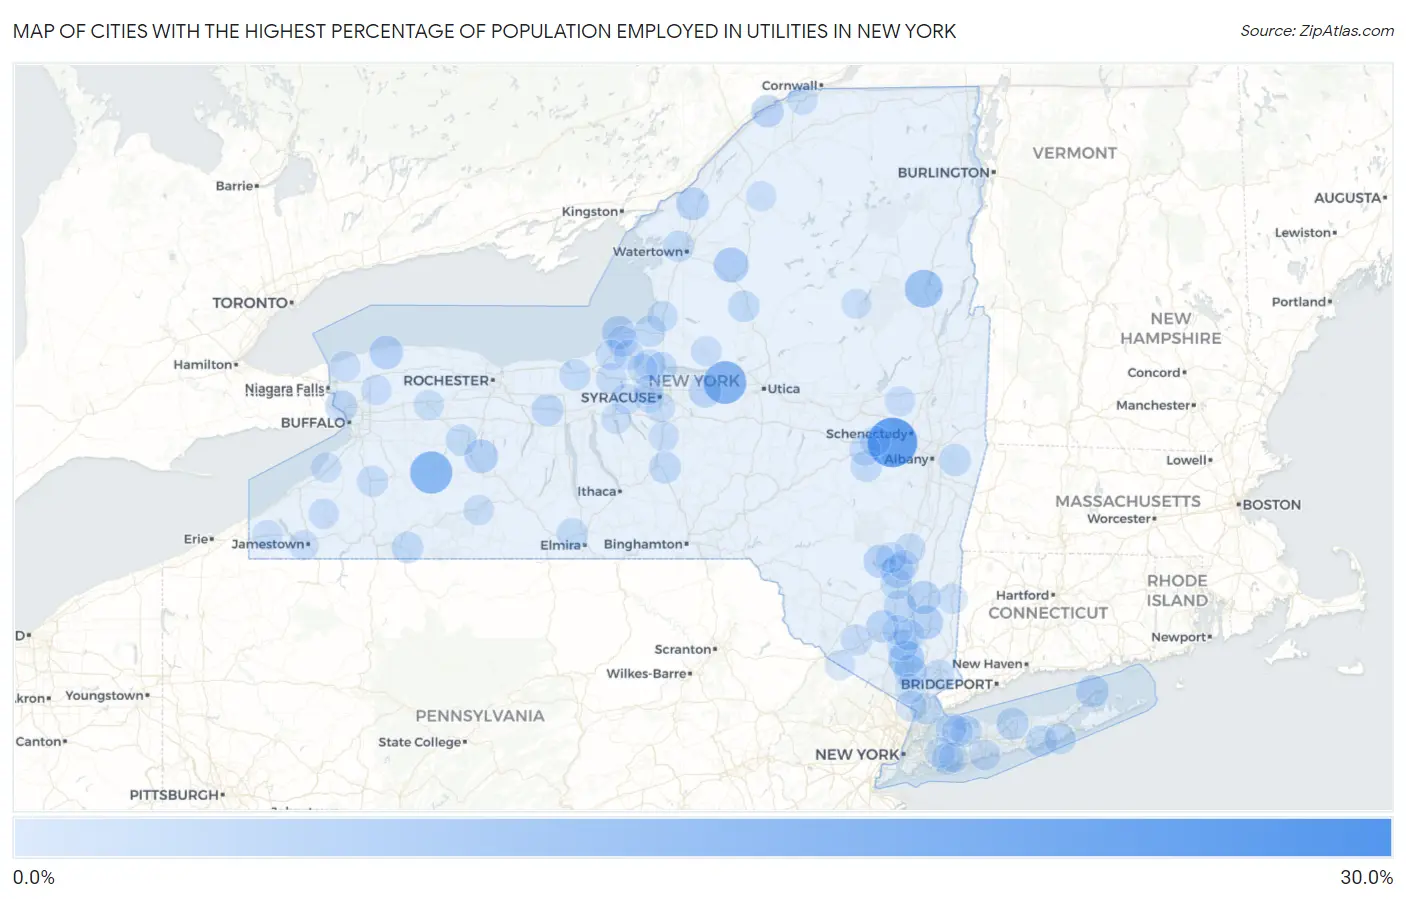
Map of Cities with the Highest Percentage of Population Employed in Utilities in New York
0.0%
30.0%
Cities with the Highest Percentage of Population Employed in Utilities in New York
| City | % Employed | vs State | vs National | |
| 1. | Haines Falls | 30.0% | 0.64%(+29.4)#1 | 0.84%(+29.2)#78 |
| 2. | Duane Lake | 25.0% | 0.64%(+24.4)#2 | 0.84%(+24.2)#114 |
| 3. | Bridgeville | 17.6% | 0.64%(+17.0)#3 | 0.84%(+16.8)#211 |
| 4. | Verona | 16.9% | 0.64%(+16.3)#4 | 0.84%(+16.1)#229 |
| 5. | Pike | 16.3% | 0.64%(+15.7)#5 | 0.84%(+15.5)#252 |
| 6. | Grahamsville | 14.7% | 0.64%(+14.1)#6 | 0.84%(+13.9)#297 |
| 7. | Upper Red Hook | 13.9% | 0.64%(+13.2)#7 | 0.84%(+13.1)#328 |
| 8. | Otter Lake | 13.3% | 0.64%(+12.7)#8 | 0.84%(+12.5)#348 |
| 9. | Pottersville | 11.4% | 0.64%(+10.8)#9 | 0.84%(+10.6)#445 |
| 10. | Fort Montgomery | 9.0% | 0.64%(+8.36)#10 | 0.84%(+8.16)#619 |
| 11. | Castorland | 8.0% | 0.64%(+7.38)#11 | 0.84%(+7.19)#722 |
| 12. | Ruby | 6.6% | 0.64%(+5.92)#12 | 0.84%(+5.73)#962 |
| 13. | Scottsburg | 6.5% | 0.64%(+5.88)#13 | 0.84%(+5.68)#975 |
| 14. | Hopewell Junction | 6.5% | 0.64%(+5.87)#14 | 0.84%(+5.67)#978 |
| 15. | Burlington Flats | 6.5% | 0.64%(+5.81)#15 | 0.84%(+5.61)#991 |
| 16. | Oswego | 6.3% | 0.64%(+5.63)#16 | 0.84%(+5.43)#1,028 |
| 17. | Pleasant Valley | 6.2% | 0.64%(+5.59)#17 | 0.84%(+5.39)#1,045 |
| 18. | Barker | 6.2% | 0.64%(+5.54)#18 | 0.84%(+5.34)#1,059 |
| 19. | Hurley | 5.8% | 0.64%(+5.15)#19 | 0.84%(+4.96)#1,170 |
| 20. | Buchanan | 5.7% | 0.64%(+5.05)#20 | 0.84%(+4.86)#1,204 |
| 21. | Plessis | 5.6% | 0.64%(+4.98)#21 | 0.84%(+4.79)#1,224 |
| 22. | Barryville | 5.6% | 0.64%(+4.95)#22 | 0.84%(+4.76)#1,230 |
| 23. | Shokan | 5.6% | 0.64%(+4.94)#23 | 0.84%(+4.75)#1,232 |
| 24. | Walden | 5.3% | 0.64%(+4.62)#24 | 0.84%(+4.42)#1,349 |
| 25. | Canastota | 5.2% | 0.64%(+4.54)#25 | 0.84%(+4.35)#1,385 |
| 26. | Waddington | 5.1% | 0.64%(+4.50)#26 | 0.84%(+4.30)#1,403 |
| 27. | East Marion | 5.1% | 0.64%(+4.48)#27 | 0.84%(+4.28)#1,412 |
| 28. | Terryville | 4.9% | 0.64%(+4.27)#28 | 0.84%(+4.08)#1,506 |
| 29. | Clifton Springs | 4.8% | 0.64%(+4.20)#29 | 0.84%(+4.00)#1,536 |
| 30. | Clintondale | 4.8% | 0.64%(+4.14)#30 | 0.84%(+3.94)#1,560 |
| 31. | Grandyle Village | 4.6% | 0.64%(+3.92)#31 | 0.84%(+3.73)#1,678 |
| 32. | Averill Park | 4.5% | 0.64%(+3.83)#32 | 0.84%(+3.64)#1,744 |
| 33. | Mcgraw | 4.4% | 0.64%(+3.79)#33 | 0.84%(+3.59)#1,767 |
| 34. | Weston Mills | 4.4% | 0.64%(+3.79)#34 | 0.84%(+3.59)#1,768 |
| 35. | South Hempstead | 4.4% | 0.64%(+3.73)#35 | 0.84%(+3.53)#1,810 |
| 36. | Fort Covington | 4.3% | 0.64%(+3.64)#36 | 0.84%(+3.45)#1,854 |
| 37. | Shorehaven | 4.2% | 0.64%(+3.52)#37 | 0.84%(+3.33)#1,923 |
| 38. | Crest View Heights | 4.2% | 0.64%(+3.52)#38 | 0.84%(+3.33)#1,936 |
| 39. | Round Top | 4.2% | 0.64%(+3.51)#39 | 0.84%(+3.32)#1,942 |
| 40. | Turin | 4.1% | 0.64%(+3.44)#40 | 0.84%(+3.24)#1,984 |
| 41. | Mexico | 4.0% | 0.64%(+3.32)#41 | 0.84%(+3.13)#2,068 |
| 42. | Cornwall On Hudson | 4.0% | 0.64%(+3.31)#42 | 0.84%(+3.11)#2,075 |
| 43. | Brownville | 3.9% | 0.64%(+3.26)#43 | 0.84%(+3.06)#2,114 |
| 44. | Middleburgh | 3.9% | 0.64%(+3.24)#44 | 0.84%(+3.04)#2,127 |
| 45. | Sand Ridge | 3.9% | 0.64%(+3.23)#45 | 0.84%(+3.04)#2,132 |
| 46. | Big Flats | 3.9% | 0.64%(+3.23)#46 | 0.84%(+3.03)#2,137 |
| 47. | Central Bridge | 3.9% | 0.64%(+3.23)#47 | 0.84%(+3.03)#2,138 |
| 48. | Tillson | 3.8% | 0.64%(+3.18)#48 | 0.84%(+2.99)#2,173 |
| 49. | Hartsdale | 3.8% | 0.64%(+3.18)#49 | 0.84%(+2.98)#2,177 |
| 50. | Center Moriches | 3.8% | 0.64%(+3.16)#50 | 0.84%(+2.97)#2,188 |
| 51. | North Rose | 3.8% | 0.64%(+3.12)#51 | 0.84%(+2.92)#2,224 |
| 52. | Cold Spring Harbor | 3.8% | 0.64%(+3.11)#52 | 0.84%(+2.92)#2,232 |
| 53. | Beacon | 3.7% | 0.64%(+3.07)#53 | 0.84%(+2.87)#2,275 |
| 54. | Quiogue | 3.7% | 0.64%(+3.04)#54 | 0.84%(+2.84)#2,303 |
| 55. | Brewerton | 3.7% | 0.64%(+3.03)#55 | 0.84%(+2.83)#2,310 |
| 56. | Locust Valley | 3.7% | 0.64%(+3.01)#56 | 0.84%(+2.81)#2,332 |
| 57. | Leicester | 3.6% | 0.64%(+2.96)#57 | 0.84%(+2.76)#2,365 |
| 58. | Springville | 3.6% | 0.64%(+2.92)#58 | 0.84%(+2.72)#2,398 |
| 59. | Saugerties South | 3.5% | 0.64%(+2.86)#59 | 0.84%(+2.66)#2,445 |
| 60. | Sparkill | 3.5% | 0.64%(+2.82)#60 | 0.84%(+2.63)#2,481 |
| 61. | Cato | 3.5% | 0.64%(+2.82)#61 | 0.84%(+2.63)#2,483 |
| 62. | Washington Heights | 3.5% | 0.64%(+2.82)#62 | 0.84%(+2.63)#2,487 |
| 63. | Bedford Hills | 3.4% | 0.64%(+2.79)#63 | 0.84%(+2.60)#2,512 |
| 64. | New Hackensack | 3.3% | 0.64%(+2.62)#64 | 0.84%(+2.42)#2,689 |
| 65. | Minetto | 3.2% | 0.64%(+2.54)#65 | 0.84%(+2.35)#2,756 |
| 66. | Pulaski | 3.2% | 0.64%(+2.52)#66 | 0.84%(+2.32)#2,779 |
| 67. | Oyster Bay | 3.1% | 0.64%(+2.47)#67 | 0.84%(+2.27)#2,822 |
| 68. | West Islip | 3.1% | 0.64%(+2.46)#68 | 0.84%(+2.26)#2,835 |
| 69. | Ransomville | 3.0% | 0.64%(+2.40)#69 | 0.84%(+2.20)#2,900 |
| 70. | West Hurley | 3.0% | 0.64%(+2.37)#70 | 0.84%(+2.18)#2,935 |
| 71. | Esperance | 2.9% | 0.64%(+2.30)#71 | 0.84%(+2.10)#3,017 |
| 72. | Stewart Manor | 2.9% | 0.64%(+2.28)#72 | 0.84%(+2.08)#3,040 |
| 73. | Hannibal | 2.9% | 0.64%(+2.26)#73 | 0.84%(+2.06)#3,070 |
| 74. | Elbridge | 2.8% | 0.64%(+2.19)#74 | 0.84%(+1.99)#3,166 |
| 75. | Rapids | 2.8% | 0.64%(+2.18)#75 | 0.84%(+1.98)#3,173 |
| 76. | Tully | 2.8% | 0.64%(+2.17)#76 | 0.84%(+1.98)#3,176 |
| 77. | Cherry Creek | 2.8% | 0.64%(+2.14)#77 | 0.84%(+1.94)#3,234 |
| 78. | Camden | 2.7% | 0.64%(+2.11)#78 | 0.84%(+1.91)#3,284 |
| 79. | Galway | 2.7% | 0.64%(+2.10)#79 | 0.84%(+1.90)#3,296 |
| 80. | Batavia | 2.7% | 0.64%(+2.09)#80 | 0.84%(+1.90)#3,300 |
| 81. | Almond | 2.7% | 0.64%(+2.09)#81 | 0.84%(+1.90)#3,304 |
| 82. | Fulton | 2.7% | 0.64%(+2.08)#82 | 0.84%(+1.89)#3,313 |
| 83. | Sherman | 2.7% | 0.64%(+2.02)#83 | 0.84%(+1.83)#3,399 |
| 84. | Unionville | 2.7% | 0.64%(+2.02)#84 | 0.84%(+1.82)#3,410 |
| 85. | Edwards | 2.6% | 0.64%(+1.99)#85 | 0.84%(+1.79)#3,459 |
| 86. | Farnham | 2.6% | 0.64%(+1.99)#86 | 0.84%(+1.79)#3,461 |
| 87. | Phoenix | 2.6% | 0.64%(+1.97)#87 | 0.84%(+1.78)#3,479 |
| 88. | Fairmount | 2.6% | 0.64%(+1.97)#88 | 0.84%(+1.78)#3,480 |
| 89. | Melrose Park | 2.6% | 0.64%(+1.96)#89 | 0.84%(+1.76)#3,501 |
| 90. | Dover Plains | 2.6% | 0.64%(+1.94)#90 | 0.84%(+1.75)#3,530 |
| 91. | Jamestown West | 2.6% | 0.64%(+1.94)#91 | 0.84%(+1.74)#3,533 |
| 92. | North Merrick | 2.5% | 0.64%(+1.91)#92 | 0.84%(+1.71)#3,575 |
| 93. | Lincoln Park | 2.5% | 0.64%(+1.89)#93 | 0.84%(+1.70)#3,602 |
| 94. | Congers | 2.5% | 0.64%(+1.84)#94 | 0.84%(+1.65)#3,679 |
| 95. | Speculator | 2.5% | 0.64%(+1.84)#95 | 0.84%(+1.65)#3,683 |
| 96. | Gardnertown | 2.5% | 0.64%(+1.83)#96 | 0.84%(+1.64)#3,701 |
| 97. | Massena | 2.5% | 0.64%(+1.83)#97 | 0.84%(+1.63)#3,702 |
| 98. | Nedrow | 2.5% | 0.64%(+1.82)#98 | 0.84%(+1.63)#3,714 |
| 99. | Millwood | 2.4% | 0.64%(+1.80)#99 | 0.84%(+1.61)#3,742 |
| 100. | Lakeland | 2.4% | 0.64%(+1.80)#100 | 0.84%(+1.61)#3,745 |
Common Questions
What are the Top 10 Cities with the Highest Percentage of Population Employed in Utilities in New York?
Top 10 Cities with the Highest Percentage of Population Employed in Utilities in New York are:
#1
25.0%
#2
16.9%
#3
16.3%
#4
11.4%
#5
9.0%
#6
8.0%
#7
6.5%
#8
6.5%
#9
6.3%
#10
6.2%
What city has the Highest Percentage of Population Employed in Utilities in New York?
Duane Lake has the Highest Percentage of Population Employed in Utilities in New York with 25.0%.
What is the Percentage of Population Employed in Utilities in the State of New York?
Percentage of Population Employed in Utilities in New York is 0.64%.
What is the Percentage of Population Employed in Utilities in the United States?
Percentage of Population Employed in Utilities in the United States is 0.84%.