Zip Codes with the Highest Percentage of Population Employed in Food Preparation & Serving in Liverpool, NY
RELATED REPORTS & OPTIONS
Food Preparation & Serving
Liverpool
Compare Zip Codes
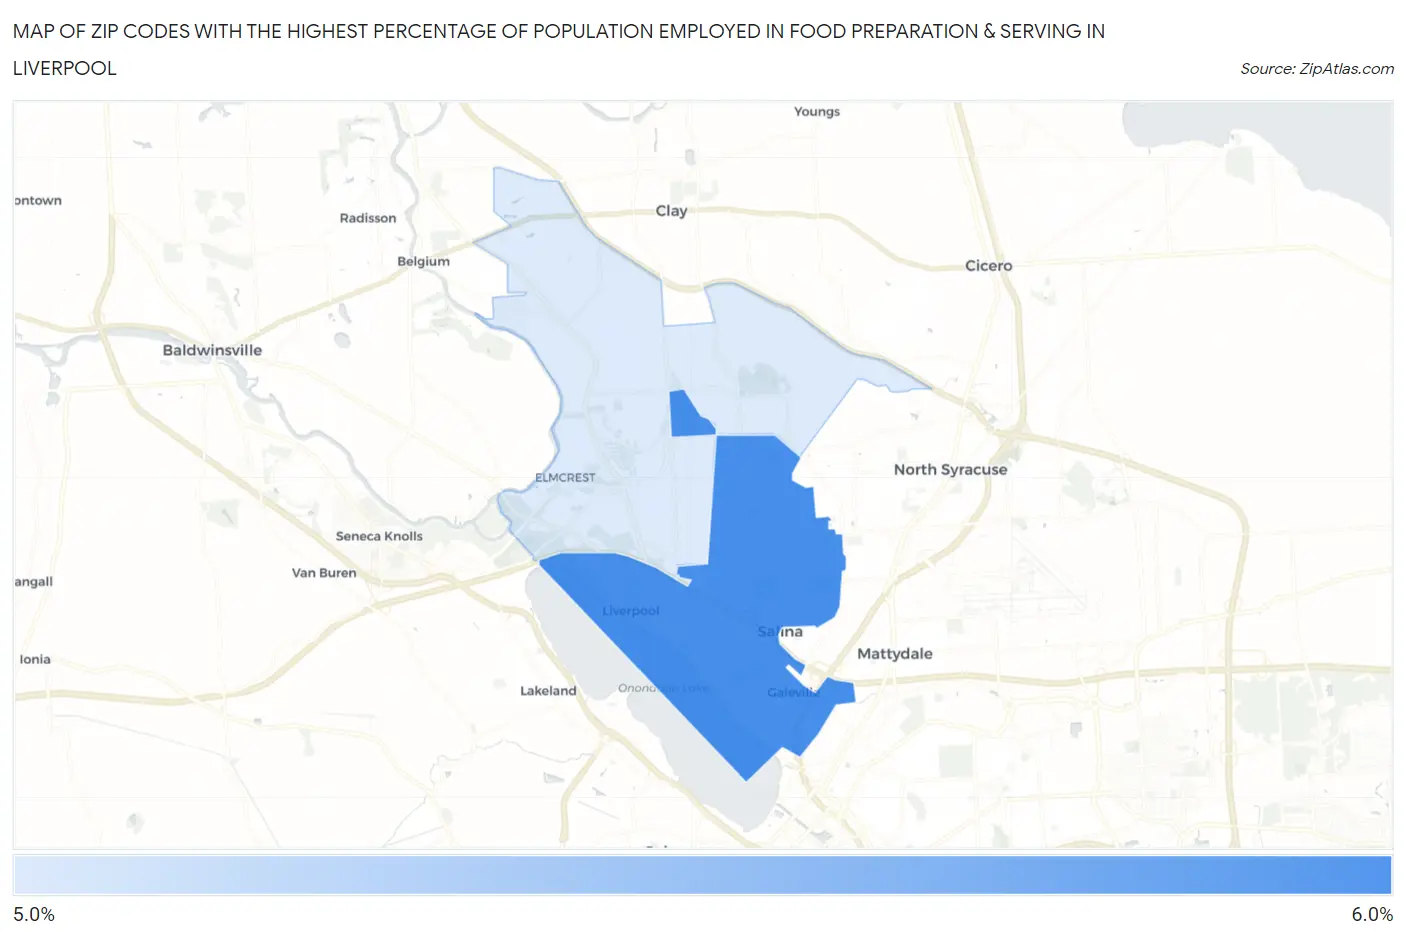
Map of Zip Codes with the Highest Percentage of Population Employed in Food Preparation & Serving in Liverpool
5.1%
5.3%
Zip Codes with the Highest Percentage of Population Employed in Food Preparation & Serving in Liverpool, NY
| Zip Code | % Employed | vs State | vs National | |
| 1. | 13088 | 5.3% | 4.8%(+0.439)#571 | 5.3%(-0.031)#11,944 |
| 2. | 13090 | 5.1% | 4.8%(+0.277)#600 | 5.3%(-0.194)#12,572 |
1
Common Questions
What are the Top Zip Codes with the Highest Percentage of Population Employed in Food Preparation & Serving in Liverpool, NY?
Top Zip Codes with the Highest Percentage of Population Employed in Food Preparation & Serving in Liverpool, NY are:
What zip code has the Highest Percentage of Population Employed in Food Preparation & Serving in Liverpool, NY?
13088 has the Highest Percentage of Population Employed in Food Preparation & Serving in Liverpool, NY with 5.3%.
What is the Percentage of Population Employed in Food Preparation & Serving in Liverpool, NY?
Percentage of Population Employed in Food Preparation & Serving in Liverpool is 6.3%.
What is the Percentage of Population Employed in Food Preparation & Serving in New York?
Percentage of Population Employed in Food Preparation & Serving in New York is 4.8%.
What is the Percentage of Population Employed in Food Preparation & Serving in the United States?
Percentage of Population Employed in Food Preparation & Serving in the United States is 5.3%.