Verona, NY Map & Demographics
Verona Map
Verona Overview
$39,631
PER CAPITA INCOME
$120,500
AVG FAMILY INCOME
$71,535
AVG HOUSEHOLD INCOME
0.35
INEQUALITY / GINI INDEX
1,363
TOTAL POPULATION
740
MALE POPULATION
623
FEMALE POPULATION
118.78
MALES / 100 FEMALES
84.19
FEMALES / 100 MALES
35.3
MEDIAN AGE
2.6
AVG FAMILY SIZE
2.2
AVG HOUSEHOLD SIZE
780
LABOR FORCE [ PEOPLE ]
67.1%
PERCENT IN LABOR FORCE
23.6%
UNEMPLOYMENT RATE
Verona Zip Codes
Verona Area Codes
Income in Verona
Income Overview in Verona
Per Capita Income in Verona is $39,631, while median incomes of families and households are $120,500 and $71,535 respectively.
| Characteristic | Number | Measure |
| Per Capita Income | 1,363 | $39,631 |
| Median Family Income | 406 | $120,500 |
| Mean Family Income | 406 | $111,907 |
| Median Household Income | 610 | $71,535 |
| Mean Household Income | 610 | $94,459 |
| Income Deficit | 406 | $0 |
| Wage / Income Gap (%) | 1,363 | 0.00% |
| Wage / Income Gap ($) | 1,363 | 100.00¢ per $1 |
| Gini / Inequality Index | 1,363 | 0.35 |
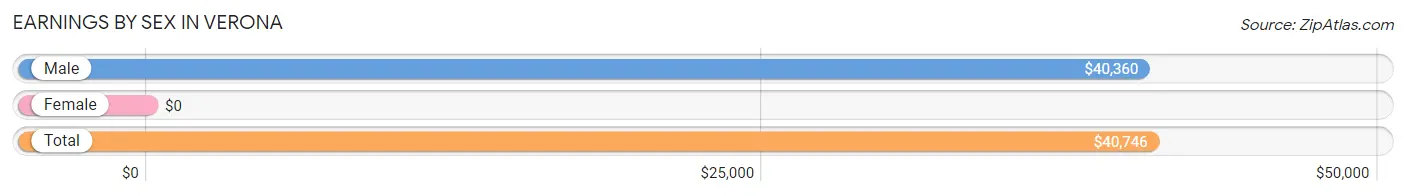
Earnings by Sex in Verona
| Sex | Number | Average Earnings |
| Male | 421 (54.0%) | $40,360 |
| Female | 359 (46.0%) | $0 |
| Total | 780 (100.0%) | $40,746 |
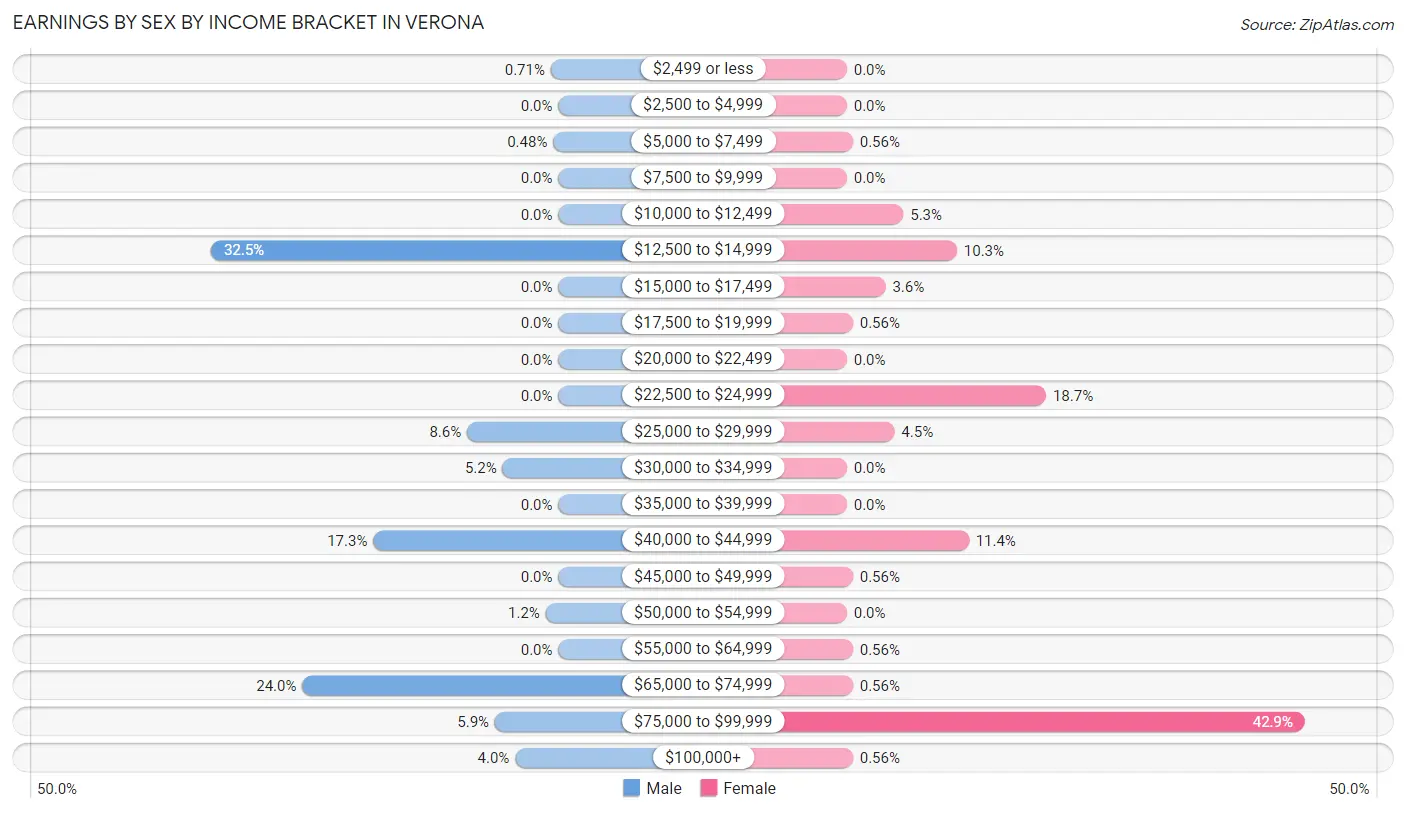
Earnings by Sex by Income Bracket in Verona
The most common earnings brackets in Verona are $12,500 to $14,999 for men (137 | 32.5%) and $75,000 to $99,999 for women (154 | 42.9%).
| Income | Male | Female |
| $2,499 or less | 3 (0.7%) | 0 (0.0%) |
| $2,500 to $4,999 | 0 (0.0%) | 0 (0.0%) |
| $5,000 to $7,499 | 2 (0.5%) | 2 (0.6%) |
| $7,500 to $9,999 | 0 (0.0%) | 0 (0.0%) |
| $10,000 to $12,499 | 0 (0.0%) | 19 (5.3%) |
| $12,500 to $14,999 | 137 (32.5%) | 37 (10.3%) |
| $15,000 to $17,499 | 0 (0.0%) | 13 (3.6%) |
| $17,500 to $19,999 | 0 (0.0%) | 2 (0.6%) |
| $20,000 to $22,499 | 0 (0.0%) | 0 (0.0%) |
| $22,500 to $24,999 | 0 (0.0%) | 67 (18.7%) |
| $25,000 to $29,999 | 36 (8.6%) | 16 (4.5%) |
| $30,000 to $34,999 | 22 (5.2%) | 0 (0.0%) |
| $35,000 to $39,999 | 0 (0.0%) | 0 (0.0%) |
| $40,000 to $44,999 | 73 (17.3%) | 41 (11.4%) |
| $45,000 to $49,999 | 0 (0.0%) | 2 (0.6%) |
| $50,000 to $54,999 | 5 (1.2%) | 0 (0.0%) |
| $55,000 to $64,999 | 0 (0.0%) | 2 (0.6%) |
| $65,000 to $74,999 | 101 (24.0%) | 2 (0.6%) |
| $75,000 to $99,999 | 25 (5.9%) | 154 (42.9%) |
| $100,000+ | 17 (4.0%) | 2 (0.6%) |
| Total | 421 (100.0%) | 359 (100.0%) |
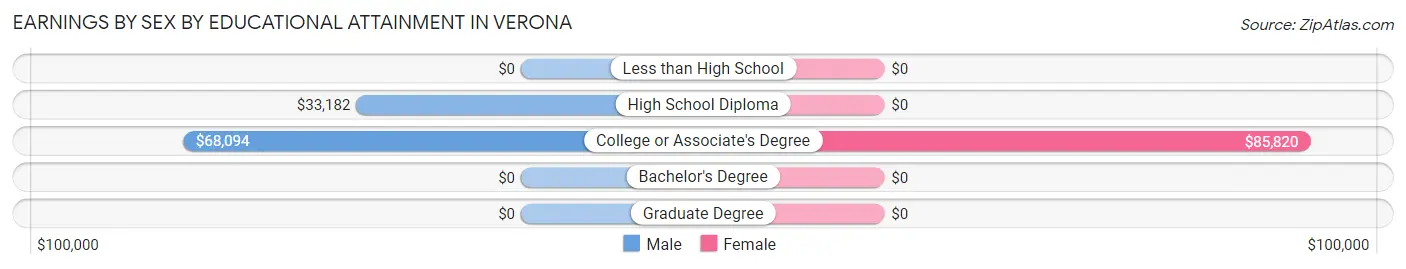
Earnings by Sex by Educational Attainment in Verona
Average earnings in Verona are $67,562 for men and $85,219 for women, a difference of 20.7%. Men with an educational attainment of college or associate's degree enjoy the highest average annual earnings of $68,094, while those with high school diploma education earn the least with $33,182. Women with an educational attainment of college or associate's degree earn the most with the average annual earnings of $85,820, while those with college or associate's degree education have the smallest earnings of $85,820.
| Educational Attainment | Male Income | Female Income |
| Less than High School | - | - |
| High School Diploma | $33,182 | $0 |
| College or Associate's Degree | $68,094 | $85,820 |
| Bachelor's Degree | - | - |
| Graduate Degree | - | - |
| Total | $67,562 | $85,219 |
Family Income in Verona
Family Income Brackets in Verona
According to the Verona family income data, there are 165 families falling into the $150,000 to $199,999 income range, which is the most common income bracket and makes up 40.6% of all families.
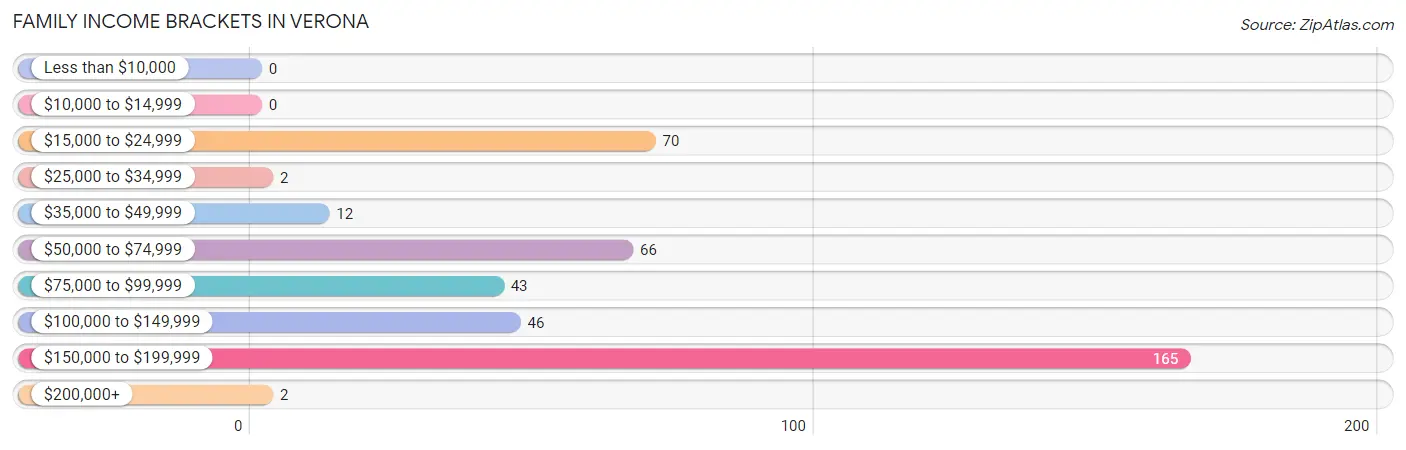
| Income Bracket | # Families | % Families |
| Less than $10,000 | 0 | 0.0% |
| $10,000 to $14,999 | 0 | 0.0% |
| $15,000 to $24,999 | 70 | 17.2% |
| $25,000 to $34,999 | 2 | 0.5% |
| $35,000 to $49,999 | 12 | 3.0% |
| $50,000 to $74,999 | 66 | 16.3% |
| $75,000 to $99,999 | 43 | 10.6% |
| $100,000 to $149,999 | 46 | 11.3% |
| $150,000 to $199,999 | 165 | 40.6% |
| $200,000+ | 2 | 0.5% |
Family Income by Famaliy Size in Verona
4-person families (162 | 39.9%) account for the highest median family income in Verona with $181,159 per family, while 4-person families (162 | 39.9%) have the highest median income of $45,290 per family member.
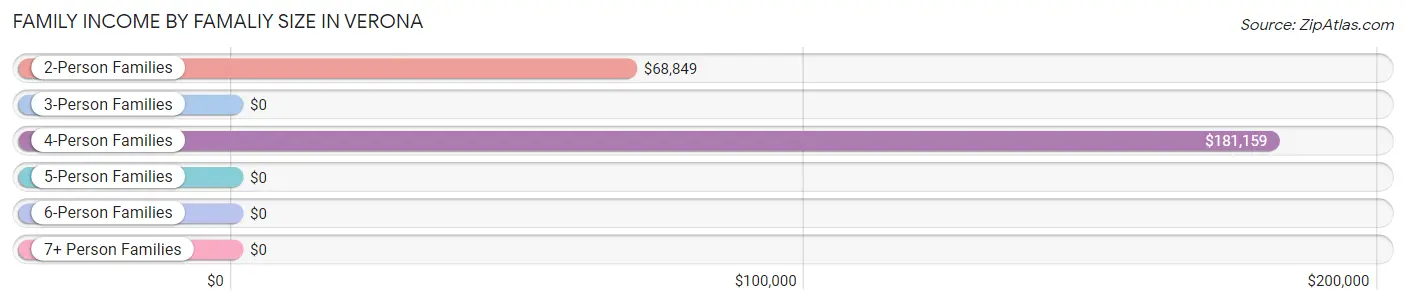
| Income Bracket | # Families | Median Income |
| 2-Person Families | 219 (53.9%) | $68,849 |
| 3-Person Families | 23 (5.7%) | $0 |
| 4-Person Families | 162 (39.9%) | $181,159 |
| 5-Person Families | 0 (0.0%) | $0 |
| 6-Person Families | 0 (0.0%) | $0 |
| 7+ Person Families | 2 (0.5%) | $0 |
| Total | 406 (100.0%) | $120,500 |
Family Income by Number of Earners in Verona
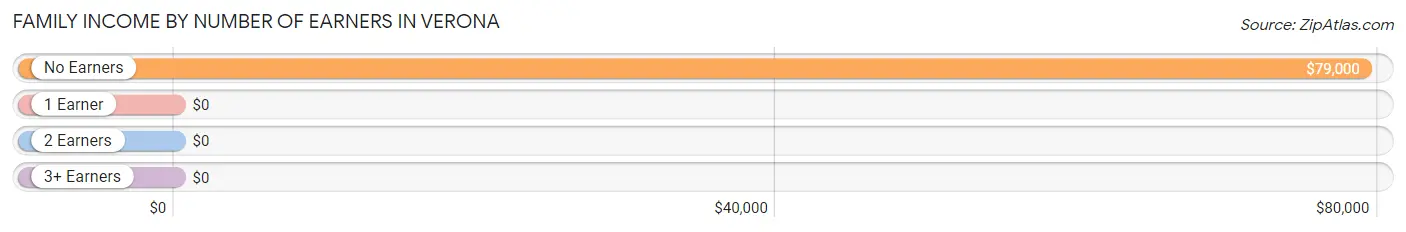
| Number of Earners | # Families | Median Income |
| No Earners | 96 (23.6%) | $79,000 |
| 1 Earner | 108 (26.6%) | $0 |
| 2 Earners | 49 (12.1%) | $0 |
| 3+ Earners | 153 (37.7%) | $0 |
| Total | 406 (100.0%) | $120,500 |
Household Income in Verona
Household Income Brackets in Verona
With 193 households falling in the category, the $50,000 to $74,999 income range is the most frequent in Verona, accounting for 31.6% of all households. In contrast, only 4 households (0.7%) fall into the less than $10,000 income bracket, making it the least populous group.
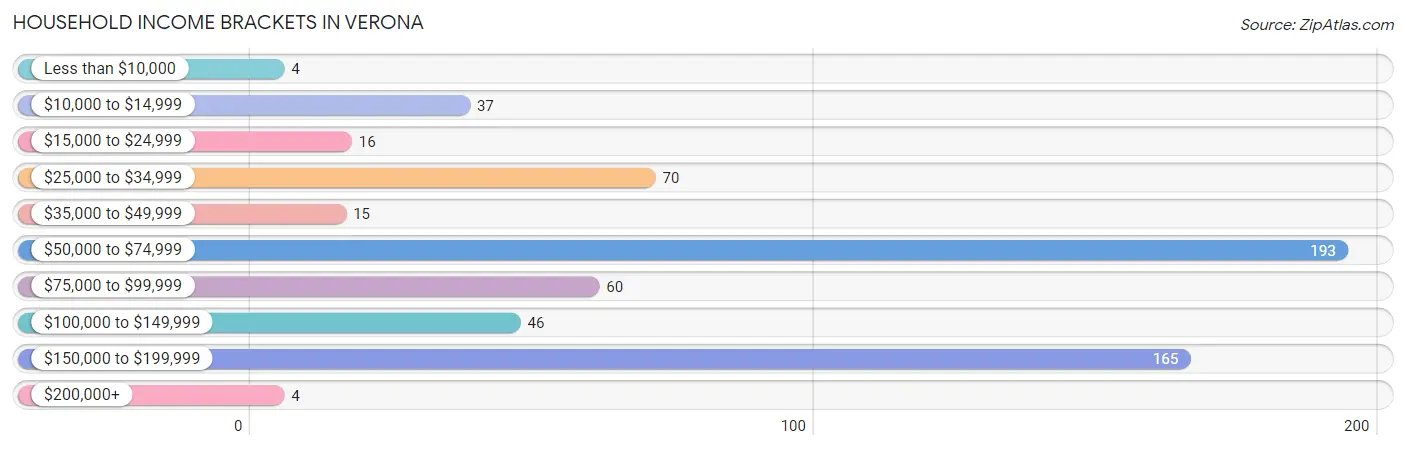
| Income Bracket | # Households | % Households |
| Less than $10,000 | 4 | 0.7% |
| $10,000 to $14,999 | 37 | 6.1% |
| $15,000 to $24,999 | 16 | 2.6% |
| $25,000 to $34,999 | 70 | 11.5% |
| $35,000 to $49,999 | 15 | 2.5% |
| $50,000 to $74,999 | 193 | 31.6% |
| $75,000 to $99,999 | 60 | 9.8% |
| $100,000 to $149,999 | 46 | 7.5% |
| $150,000 to $199,999 | 165 | 27.0% |
| $200,000+ | 4 | 0.7% |
Household Income by Householder Age in Verona
The median household income in Verona is $71,535, with the highest median household income of $180,654 found in the 45 to 64 years age bracket for the primary householder. A total of 223 households (36.6%) fall into this category. Meanwhile, the 15 to 24 years age bracket for the primary householder has the lowest median household income of $0, with 67 households (11.0%) in this group.
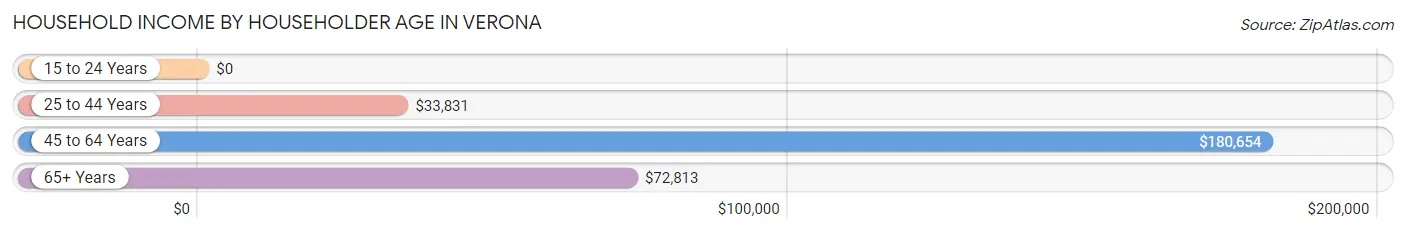
| Income Bracket | # Households | Median Income |
| 15 to 24 Years | 67 (11.0%) | $0 |
| 25 to 44 Years | 146 (23.9%) | $33,831 |
| 45 to 64 Years | 223 (36.6%) | $180,654 |
| 65+ Years | 174 (28.5%) | $72,813 |
| Total | 610 (100.0%) | $71,535 |
Poverty in Verona
Income Below Poverty by Sex and Age in Verona
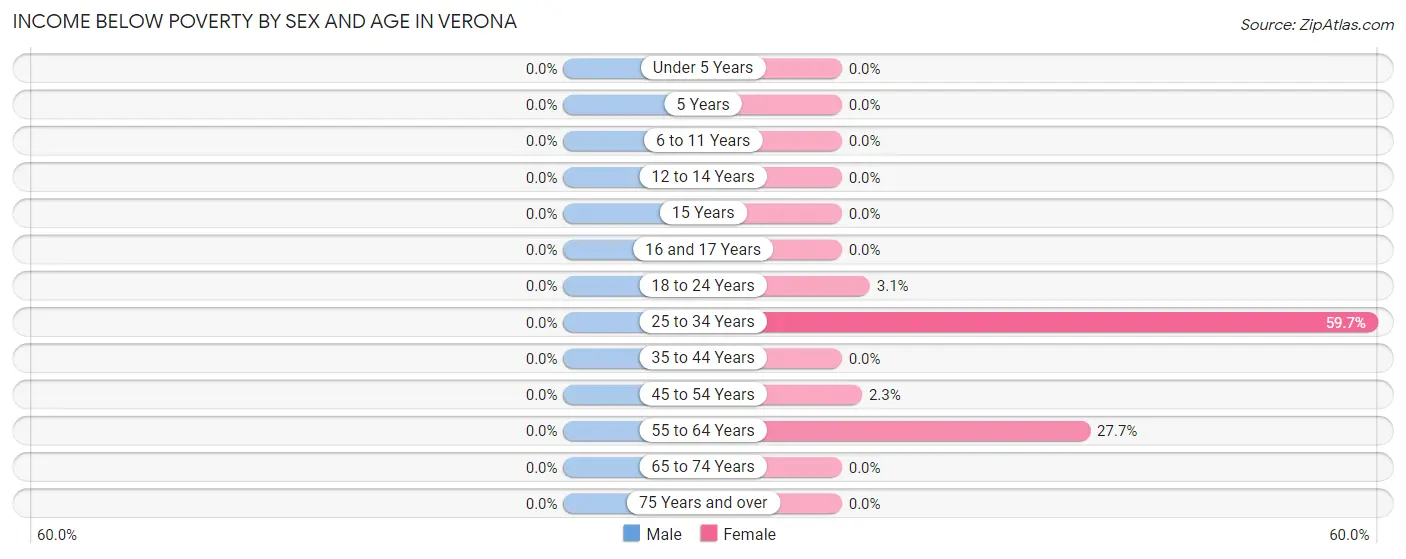
| Age Bracket | Male | Female |
| Under 5 Years | 0 (0.0%) | 0 (0.0%) |
| 5 Years | 0 (0.0%) | 0 (0.0%) |
| 6 to 11 Years | 0 (0.0%) | 0 (0.0%) |
| 12 to 14 Years | 0 (0.0%) | 0 (0.0%) |
| 15 Years | 0 (0.0%) | 0 (0.0%) |
| 16 and 17 Years | 0 (0.0%) | 0 (0.0%) |
| 18 to 24 Years | 0 (0.0%) | 3 (3.1%) |
| 25 to 34 Years | 0 (0.0%) | 37 (59.7%) |
| 35 to 44 Years | 0 (0.0%) | 0 (0.0%) |
| 45 to 54 Years | 0 (0.0%) | 4 (2.2%) |
| 55 to 64 Years | 0 (0.0%) | 13 (27.7%) |
| 65 to 74 Years | 0 (0.0%) | 0 (0.0%) |
| 75 Years and over | 0 (0.0%) | 0 (0.0%) |
| Total | 0 (0.0%) | 57 (9.1%) |
Income Above Poverty by Sex and Age in Verona
According to the poverty statistics in Verona, males aged under 5 years and females aged under 5 years are the age groups that are most secure financially, with 100.0% of males and 100.0% of females in these age groups living above the poverty line.
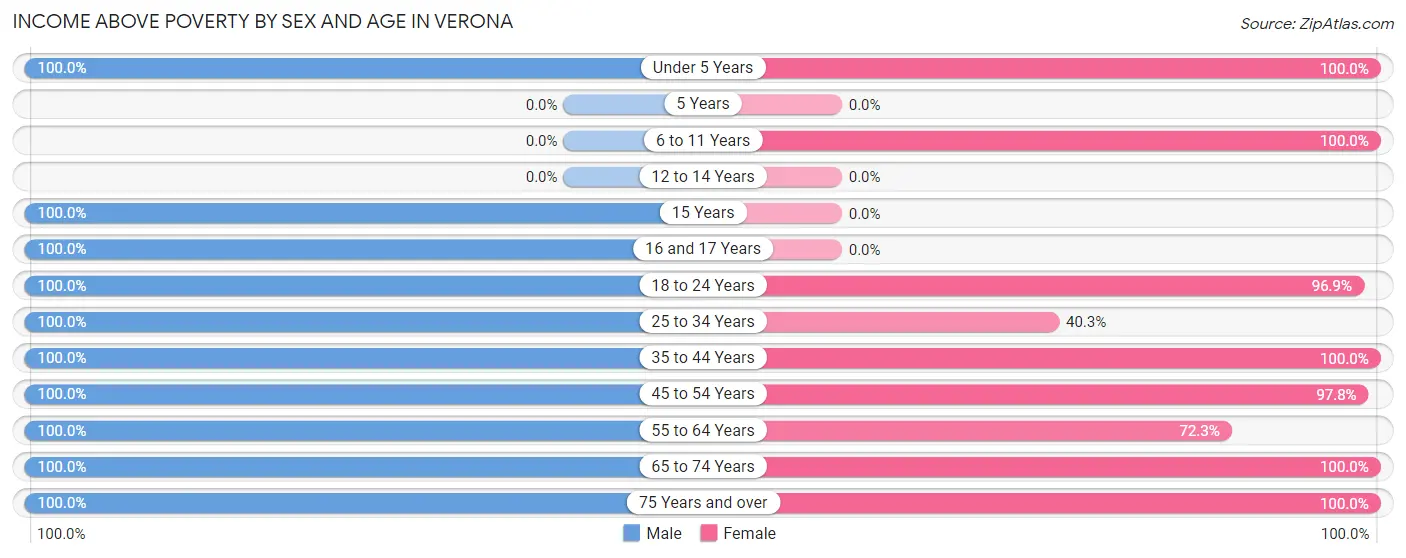
| Age Bracket | Male | Female |
| Under 5 Years | 6 (100.0%) | 62 (100.0%) |
| 5 Years | 0 (0.0%) | 0 (0.0%) |
| 6 to 11 Years | 0 (0.0%) | 2 (100.0%) |
| 12 to 14 Years | 0 (0.0%) | 0 (0.0%) |
| 15 Years | 131 (100.0%) | 0 (0.0%) |
| 16 and 17 Years | 3 (100.0%) | 0 (0.0%) |
| 18 to 24 Years | 154 (100.0%) | 93 (96.9%) |
| 25 to 34 Years | 165 (100.0%) | 25 (40.3%) |
| 35 to 44 Years | 26 (100.0%) | 2 (100.0%) |
| 45 to 54 Years | 114 (100.0%) | 174 (97.8%) |
| 55 to 64 Years | 29 (100.0%) | 34 (72.3%) |
| 65 to 74 Years | 29 (100.0%) | 66 (100.0%) |
| 75 Years and over | 83 (100.0%) | 108 (100.0%) |
| Total | 740 (100.0%) | 566 (90.8%) |
Income Below Poverty Among Married-Couple Families in Verona
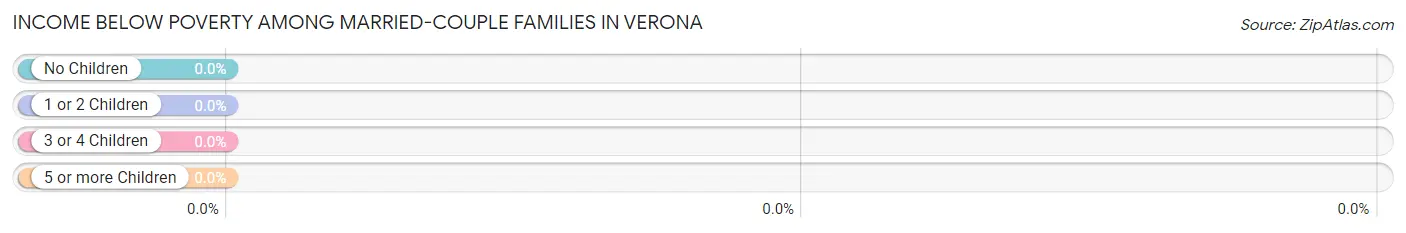
| Children | Above Poverty | Below Poverty |
| No Children | 171 (100.0%) | 0 (0.0%) |
| 1 or 2 Children | 151 (100.0%) | 0 (0.0%) |
| 3 or 4 Children | 0 (0.0%) | 0 (0.0%) |
| 5 or more Children | 0 (0.0%) | 0 (0.0%) |
| Total | 322 (100.0%) | 0 (0.0%) |
Income Below Poverty Among Single-Parent Households in Verona
| Children | Single Father | Single Mother |
| No Children | 0 (0.0%) | 0 (0.0%) |
| 1 or 2 Children | 0 (0.0%) | 0 (0.0%) |
| 3 or 4 Children | 0 (0.0%) | 0 (0.0%) |
| 5 or more Children | 0 (0.0%) | 0 (0.0%) |
| Total | 0 (0.0%) | 0 (0.0%) |
Income Below Poverty Among Married-Couple vs Single-Parent Households in Verona
| Children | Married-Couple Families | Single-Parent Households |
| No Children | 0 (0.0%) | 0 (0.0%) |
| 1 or 2 Children | 0 (0.0%) | 0 (0.0%) |
| 3 or 4 Children | 0 (0.0%) | 0 (0.0%) |
| 5 or more Children | 0 (0.0%) | 0 (0.0%) |
| Total | 0 (0.0%) | 0 (0.0%) |
Race in Verona
The most populous races in Verona are White / Caucasian (1,345 | 98.7%), Hispanic or Latino (25 | 1.8%), and Two or more Races (16 | 1.2%).
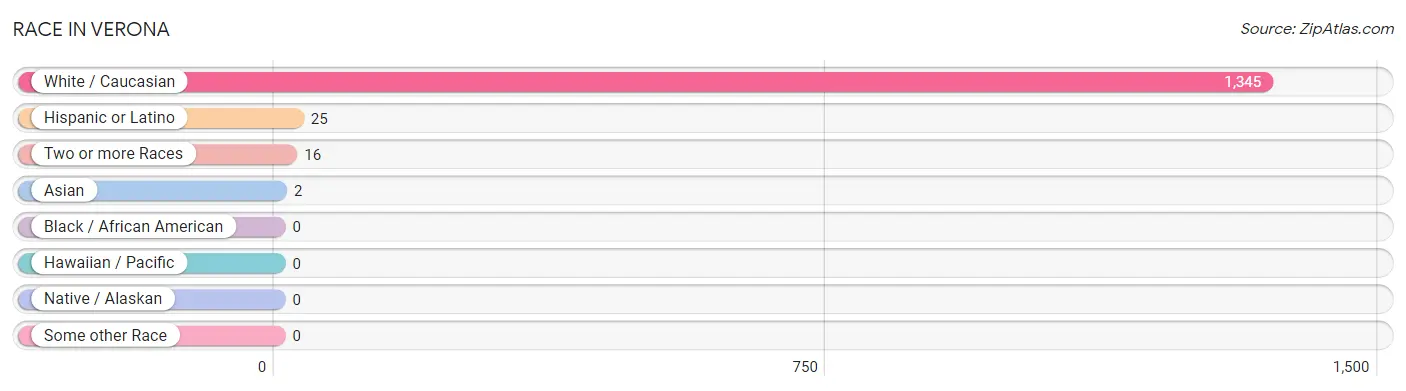
| Race | # Population | % Population |
| Asian | 2 | 0.2% |
| Black / African American | 0 | 0.0% |
| Hawaiian / Pacific | 0 | 0.0% |
| Hispanic or Latino | 25 | 1.8% |
| Native / Alaskan | 0 | 0.0% |
| White / Caucasian | 1,345 | 98.7% |
| Two or more Races | 16 | 1.2% |
| Some other Race | 0 | 0.0% |
| Total | 1,363 | 100.0% |
Ancestry in Verona
The most populous ancestries reported in Verona are German (204 | 15.0%), Irish (86 | 6.3%), Italian (84 | 6.2%), English (80 | 5.9%), and Welsh (49 | 3.6%), together accounting for 36.9% of all Verona residents.
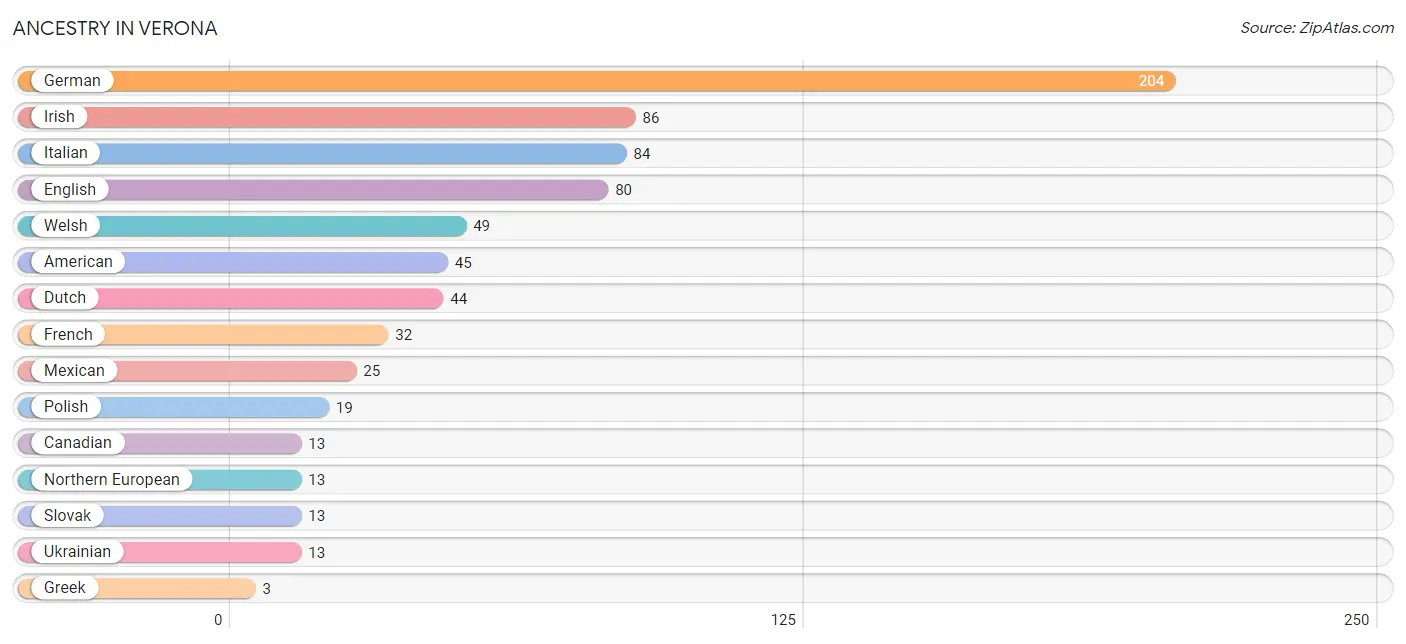
| Ancestry | # Population | % Population |
| American | 45 | 3.3% |
| Canadian | 13 | 0.9% |
| Dutch | 44 | 3.2% |
| English | 80 | 5.9% |
| French | 32 | 2.4% |
| German | 204 | 15.0% |
| Greek | 3 | 0.2% |
| Irish | 86 | 6.3% |
| Italian | 84 | 6.2% |
| Korean | 2 | 0.2% |
| Mexican | 25 | 1.8% |
| Northern European | 13 | 0.9% |
| Polish | 19 | 1.4% |
| Slovak | 13 | 0.9% |
| Ukrainian | 13 | 0.9% |
| Welsh | 49 | 3.6% | View All 16 Rows |
Immigrants in Verona

| Immigration Origin | # Population | % Population | View All 0 Rows |
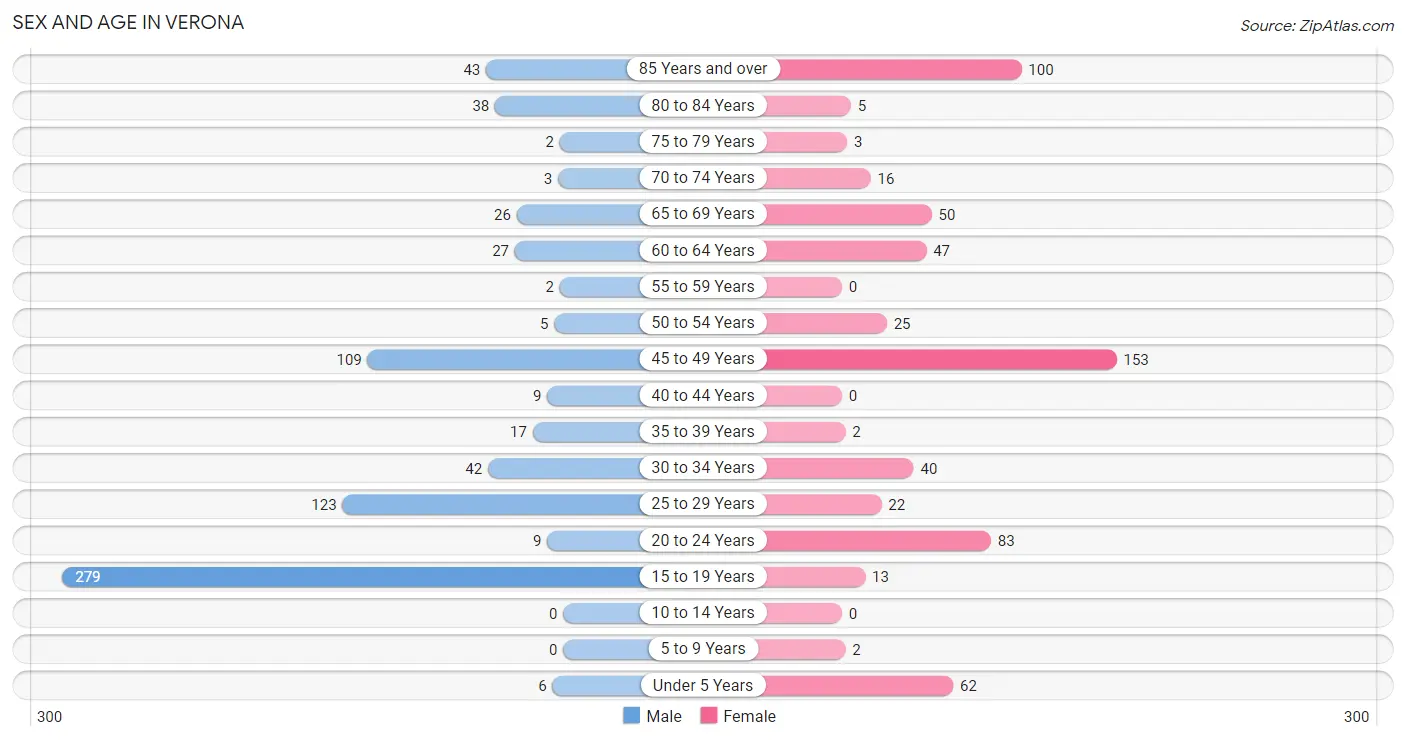
Sex and Age in Verona
Sex and Age in Verona
The most populous age groups in Verona are 15 to 19 Years (279 | 37.7%) for men and 45 to 49 Years (153 | 24.6%) for women.
| Age Bracket | Male | Female |
| Under 5 Years | 6 (0.8%) | 62 (10.0%) |
| 5 to 9 Years | 0 (0.0%) | 2 (0.3%) |
| 10 to 14 Years | 0 (0.0%) | 0 (0.0%) |
| 15 to 19 Years | 279 (37.7%) | 13 (2.1%) |
| 20 to 24 Years | 9 (1.2%) | 83 (13.3%) |
| 25 to 29 Years | 123 (16.6%) | 22 (3.5%) |
| 30 to 34 Years | 42 (5.7%) | 40 (6.4%) |
| 35 to 39 Years | 17 (2.3%) | 2 (0.3%) |
| 40 to 44 Years | 9 (1.2%) | 0 (0.0%) |
| 45 to 49 Years | 109 (14.7%) | 153 (24.6%) |
| 50 to 54 Years | 5 (0.7%) | 25 (4.0%) |
| 55 to 59 Years | 2 (0.3%) | 0 (0.0%) |
| 60 to 64 Years | 27 (3.6%) | 47 (7.5%) |
| 65 to 69 Years | 26 (3.5%) | 50 (8.0%) |
| 70 to 74 Years | 3 (0.4%) | 16 (2.6%) |
| 75 to 79 Years | 2 (0.3%) | 3 (0.5%) |
| 80 to 84 Years | 38 (5.1%) | 5 (0.8%) |
| 85 Years and over | 43 (5.8%) | 100 (16.1%) |
| Total | 740 (100.0%) | 623 (100.0%) |
Families and Households in Verona
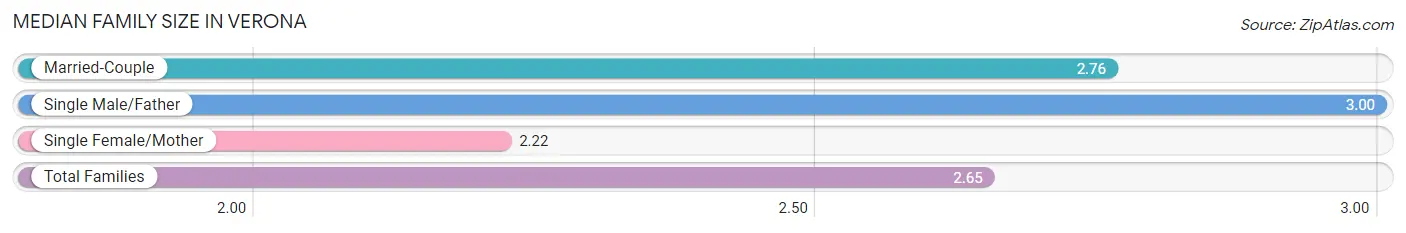
Median Family Size in Verona
The median family size in Verona is 2.65 persons per family, with single male/father families (3 | 0.7%) accounting for the largest median family size of 3 persons per family. On the other hand, single female/mother families (81 | 20.0%) represent the smallest median family size with 2.22 persons per family.
| Family Type | # Families | Family Size |
| Married-Couple | 322 (79.3%) | 2.76 |
| Single Male/Father | 3 (0.7%) | 3.00 |
| Single Female/Mother | 81 (20.0%) | 2.22 |
| Total Families | 406 (100.0%) | 2.65 |
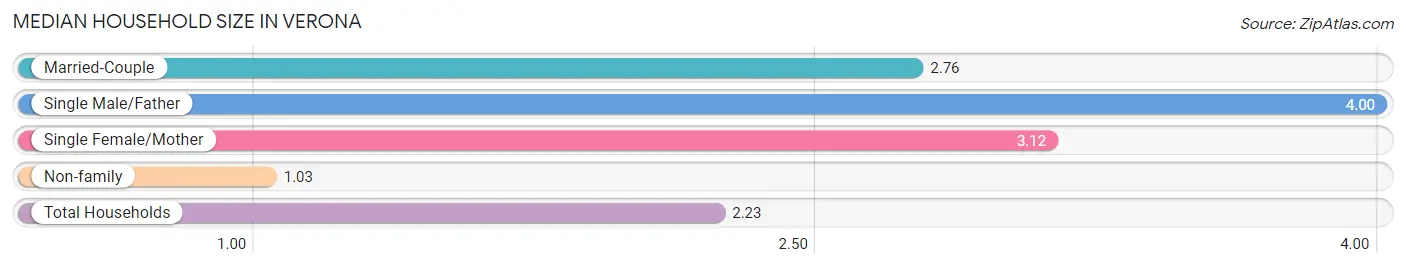
Median Household Size in Verona
The median household size in Verona is 2.23 persons per household, with single male/father households (3 | 0.5%) accounting for the largest median household size of 4 persons per household. non-family households (204 | 33.4%) represent the smallest median household size with 1.03 persons per household.
| Household Type | # Households | Household Size |
| Married-Couple | 322 (52.8%) | 2.76 |
| Single Male/Father | 3 (0.5%) | 4.00 |
| Single Female/Mother | 81 (13.3%) | 3.12 |
| Non-family | 204 (33.4%) | 1.03 |
| Total Households | 610 (100.0%) | 2.23 |
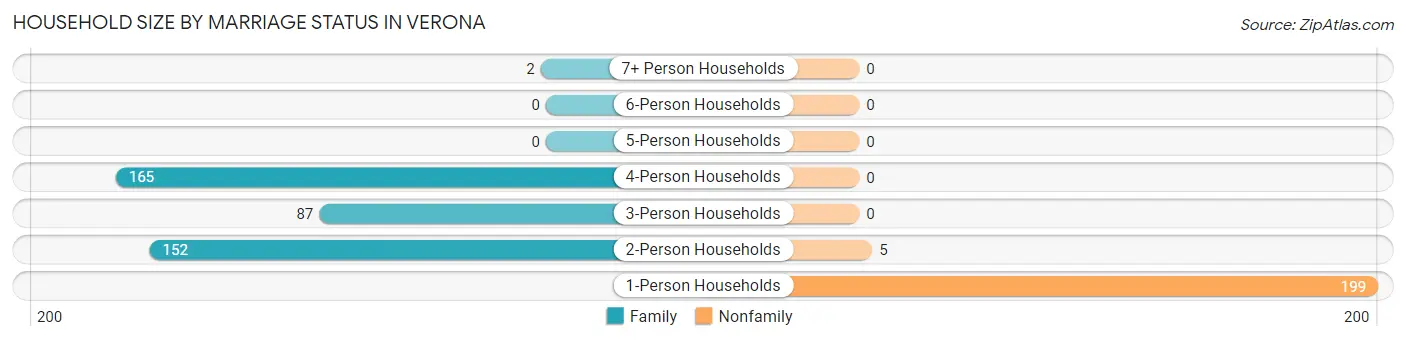
Household Size by Marriage Status in Verona
Out of a total of 610 households in Verona, 406 (66.6%) are family households, while 204 (33.4%) are nonfamily households. The most numerous type of family households are 4-person households, comprising 165, and the most common type of nonfamily households are 1-person households, comprising 199.
| Household Size | Family Households | Nonfamily Households |
| 1-Person Households | - | 199 (32.6%) |
| 2-Person Households | 152 (24.9%) | 5 (0.8%) |
| 3-Person Households | 87 (14.3%) | 0 (0.0%) |
| 4-Person Households | 165 (27.1%) | 0 (0.0%) |
| 5-Person Households | 0 (0.0%) | 0 (0.0%) |
| 6-Person Households | 0 (0.0%) | 0 (0.0%) |
| 7+ Person Households | 2 (0.3%) | 0 (0.0%) |
| Total | 406 (66.6%) | 204 (33.4%) |
Female Fertility in Verona
Fertility by Age in Verona
| Age Bracket | Women with Births | Births / 1,000 Women |
| 15 to 19 years | 0 (0.0%) | 0.0 |
| 20 to 34 years | 0 (0.0%) | 0.0 |
| 35 to 50 years | 0 (0.0%) | 0.0 |
| Total | 0 (0.0%) | 0.0 |
Fertility by Age by Marriage Status in Verona
| Age Bracket | Married | Unmarried |
| 15 to 19 years | 0 (0.0%) | 0 (0.0%) |
| 20 to 34 years | 0 (0.0%) | 0 (0.0%) |
| 35 to 50 years | 0 (0.0%) | 0 (0.0%) |
| Total | 0 (0.0%) | 0 (0.0%) |
Fertility by Education in Verona
| Educational Attainment | Women with Births | Births / 1,000 Women |
| Less than High School | 0 (0.0%) | 0.0 |
| High School Diploma | 0 (0.0%) | 0.0 |
| College or Associate's Degree | 0 (0.0%) | 0.0 |
| Bachelor's Degree | 0 (0.0%) | 0.0 |
| Graduate Degree | 0 (0.0%) | 0.0 |
| Total | 0 (0.0%) | 0.0 |
Fertility by Education by Marriage Status in Verona
| Educational Attainment | Married | Unmarried |
| Less than High School | 0 (0.0%) | 0 (0.0%) |
| High School Diploma | 0 (0.0%) | 0 (0.0%) |
| College or Associate's Degree | 0 (0.0%) | 0 (0.0%) |
| Bachelor's Degree | 0 (0.0%) | 0 (0.0%) |
| Graduate Degree | 0 (0.0%) | 0 (0.0%) |
| Total | 0 (0.0%) | 0 (0.0%) |
Employment Characteristics in Verona
Employment by Class of Employer in Verona
Among the 596 employed individuals in Verona, private company employees (303 | 50.8%), state government employees (255 | 42.8%), and local government employees (22 | 3.7%) make up the most common classes of employment.
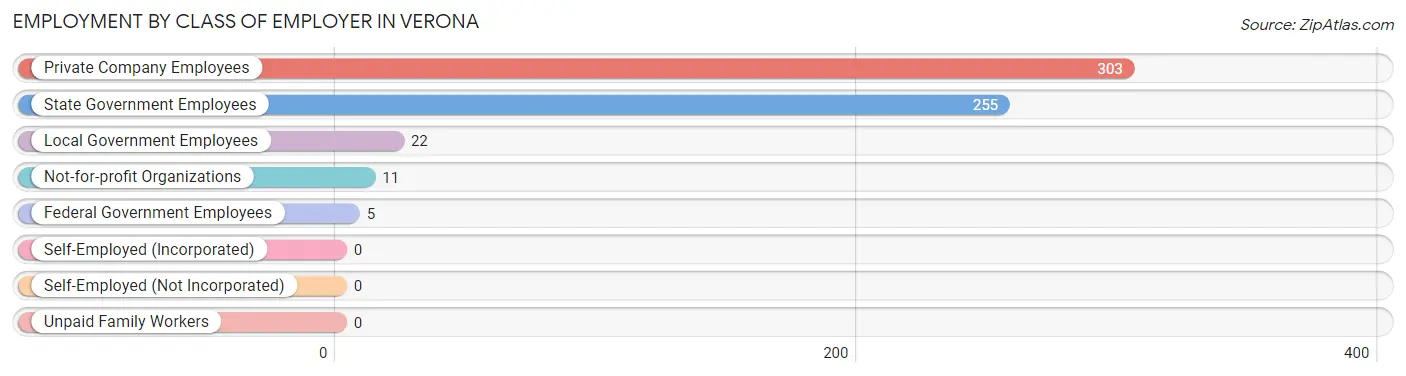
| Employer Class | # Employees | % Employees |
| Private Company Employees | 303 | 50.8% |
| Self-Employed (Incorporated) | 0 | 0.0% |
| Self-Employed (Not Incorporated) | 0 | 0.0% |
| Not-for-profit Organizations | 11 | 1.8% |
| Local Government Employees | 22 | 3.7% |
| State Government Employees | 255 | 42.8% |
| Federal Government Employees | 5 | 0.8% |
| Unpaid Family Workers | 0 | 0.0% |
| Total | 596 | 100.0% |
Employment Status by Age in Verona
According to the labor force statistics for Verona, out of the total population over 16 years of age (1,162), 67.1% or 780 individuals are in the labor force, with 23.6% or 184 of them unemployed. The age group with the highest labor force participation rate is 55 to 59 years, with 100.0% or 2 individuals in the labor force. Within the labor force, the 16 to 19 years age range has the highest percentage of unemployed individuals, with 95.8% or 137 of them being unemployed.
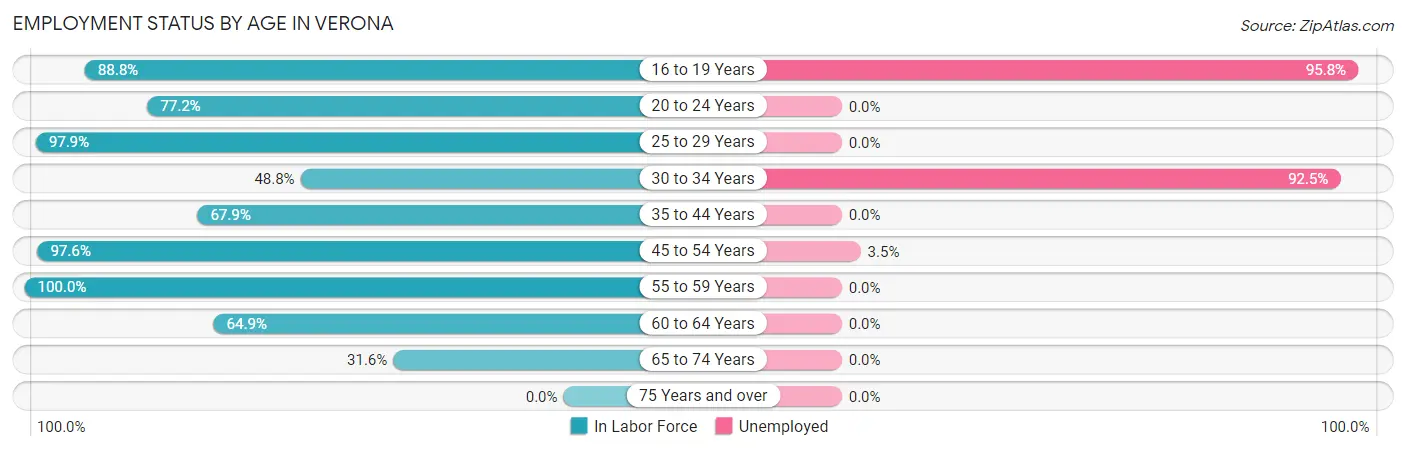
| Age Bracket | In Labor Force | Unemployed |
| 16 to 19 Years | 143 (88.8%) | 137 (95.8%) |
| 20 to 24 Years | 71 (77.2%) | 0 (0.0%) |
| 25 to 29 Years | 142 (97.9%) | 0 (0.0%) |
| 30 to 34 Years | 40 (48.8%) | 37 (92.5%) |
| 35 to 44 Years | 19 (67.9%) | 0 (0.0%) |
| 45 to 54 Years | 285 (97.6%) | 10 (3.5%) |
| 55 to 59 Years | 2 (100.0%) | 0 (0.0%) |
| 60 to 64 Years | 48 (64.9%) | 0 (0.0%) |
| 65 to 74 Years | 30 (31.6%) | 0 (0.0%) |
| 75 Years and over | 0 (0.0%) | 0 (0.0%) |
| Total | 780 (67.1%) | 184 (23.6%) |
Employment Status by Educational Attainment in Verona
According to labor force statistics for Verona, 86.0% of individuals (536) out of the total population between 25 and 64 years of age (623) are in the labor force, with 8.8% or 47 of them being unemployed. The group with the highest labor force participation rate are those with the educational attainment of bachelor's degree or higher, with 100.0% or 80 individuals in the labor force. Within the labor force, individuals with bachelor's degree or higher education have the highest percentage of unemployment, with 46.3% or 37 of them being unemployed.
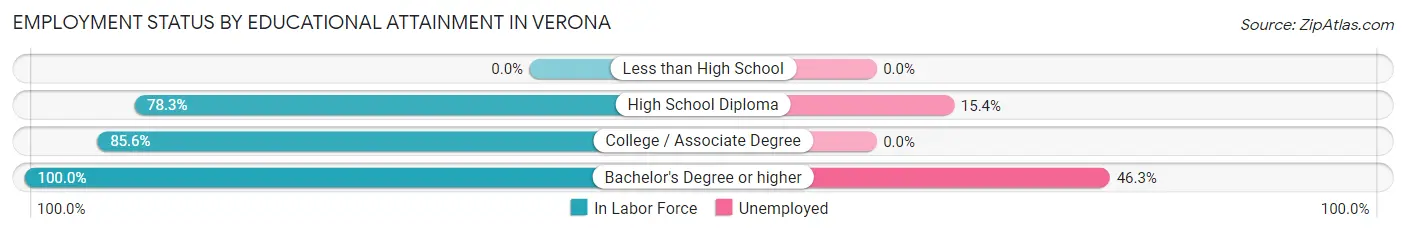
| Educational Attainment | In Labor Force | Unemployed |
| Less than High School | 0 (0.0%) | 0 (0.0%) |
| High School Diploma | 65 (78.3%) | 13 (15.4%) |
| College / Associate Degree | 391 (85.6%) | 0 (0.0%) |
| Bachelor's Degree or higher | 80 (100.0%) | 37 (46.3%) |
| Total | 536 (86.0%) | 55 (8.8%) |
Employment Occupations by Sex in Verona
Management, Business, Science and Arts Occupations
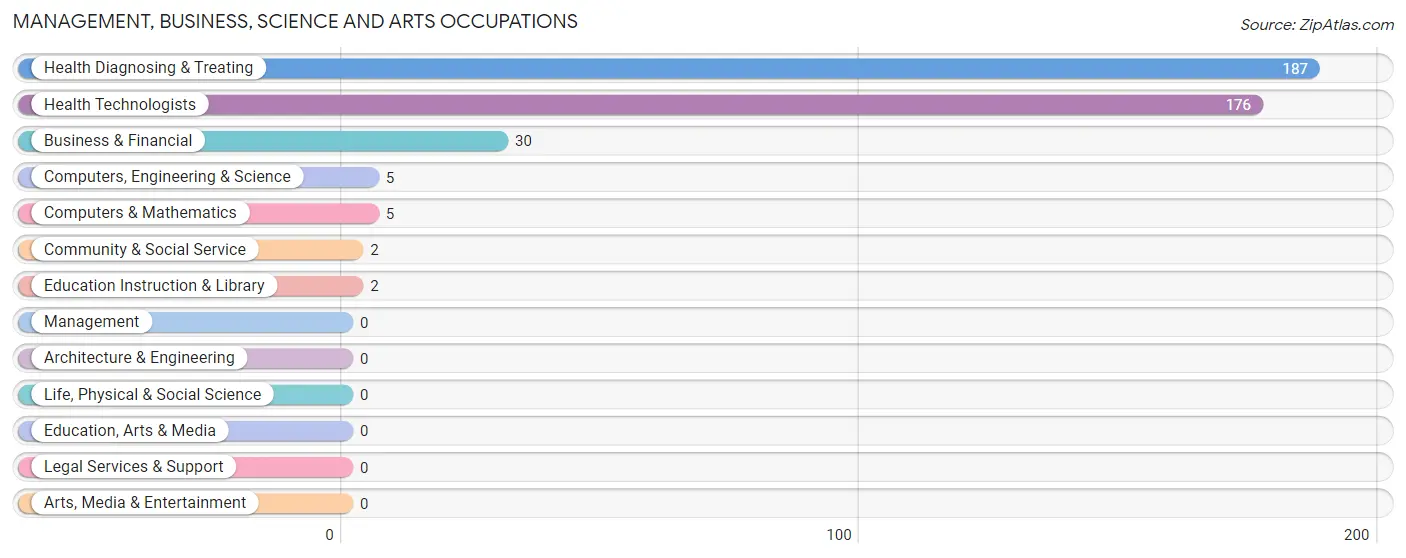
The most common Management, Business, Science and Arts occupations in Verona are Health Diagnosing & Treating (187 | 31.4%), Health Technologists (176 | 29.5%), Business & Financial (30 | 5.0%), Computers, Engineering & Science (5 | 0.8%), and Computers & Mathematics (5 | 0.8%).
Management, Business, Science and Arts Occupations by Sex
Within the Management, Business, Science and Arts occupations in Verona, the most male-oriented occupations are Computers, Engineering & Science (100.0%), Computers & Mathematics (100.0%), and Business & Financial (93.3%), while the most female-oriented occupations are Community & Social Service (100.0%), Education Instruction & Library (100.0%), and Health Diagnosing & Treating (86.6%).
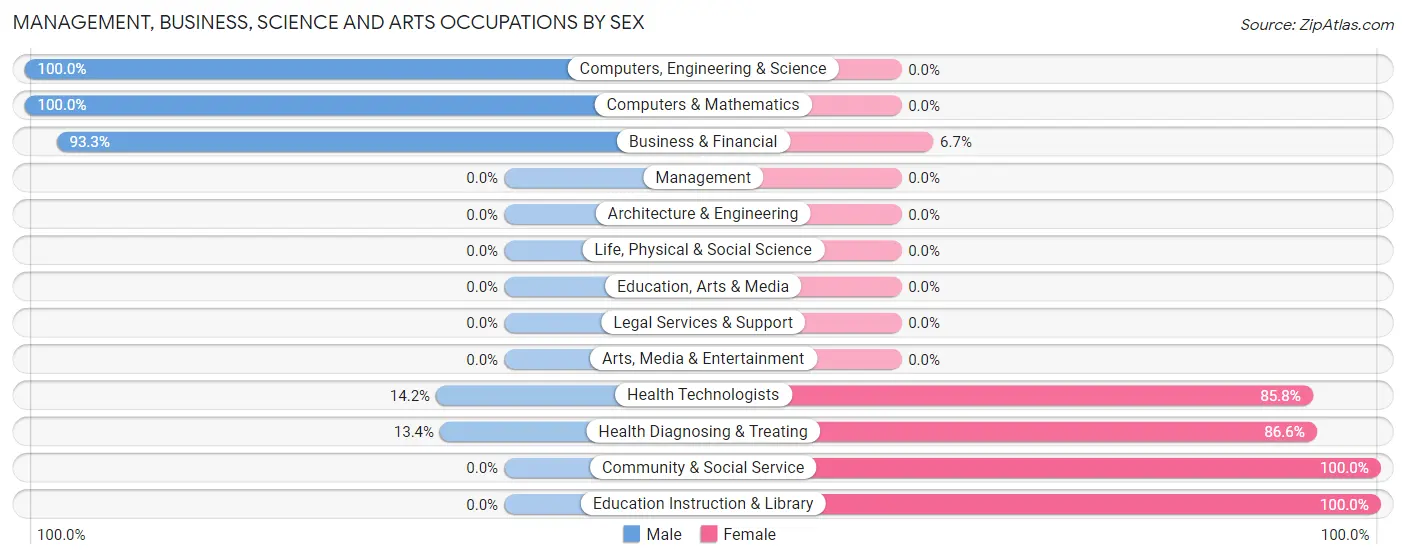
| Occupation | Male | Female |
| Management | 0 (0.0%) | 0 (0.0%) |
| Business & Financial | 28 (93.3%) | 2 (6.7%) |
| Computers, Engineering & Science | 5 (100.0%) | 0 (0.0%) |
| Computers & Mathematics | 5 (100.0%) | 0 (0.0%) |
| Architecture & Engineering | 0 (0.0%) | 0 (0.0%) |
| Life, Physical & Social Science | 0 (0.0%) | 0 (0.0%) |
| Community & Social Service | 0 (0.0%) | 2 (100.0%) |
| Education, Arts & Media | 0 (0.0%) | 0 (0.0%) |
| Legal Services & Support | 0 (0.0%) | 0 (0.0%) |
| Education Instruction & Library | 0 (0.0%) | 2 (100.0%) |
| Arts, Media & Entertainment | 0 (0.0%) | 0 (0.0%) |
| Health Diagnosing & Treating | 25 (13.4%) | 162 (86.6%) |
| Health Technologists | 25 (14.2%) | 151 (85.8%) |
| Total (Category) | 58 (25.9%) | 166 (74.1%) |
| Total (Overall) | 284 (47.6%) | 312 (52.3%) |
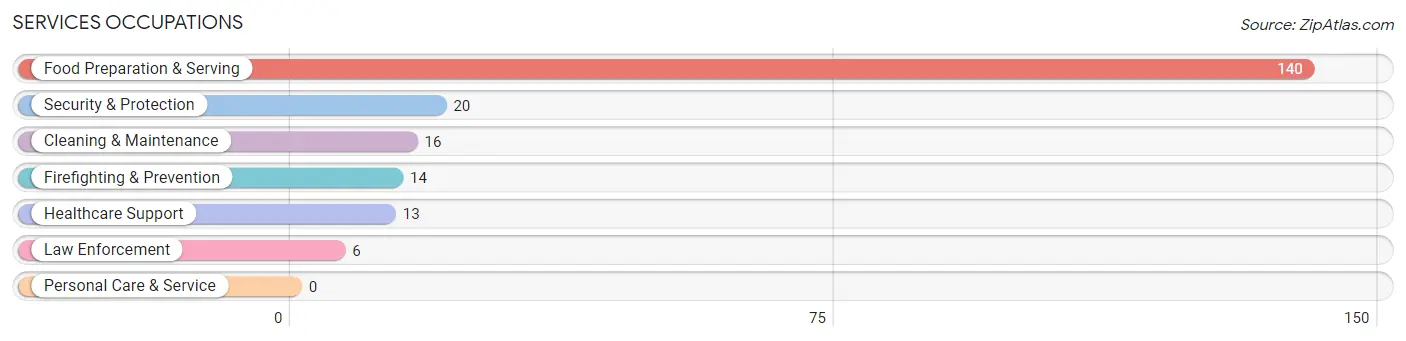
Services Occupations
The most common Services occupations in Verona are Food Preparation & Serving (140 | 23.5%), Security & Protection (20 | 3.4%), Cleaning & Maintenance (16 | 2.7%), Firefighting & Prevention (14 | 2.4%), and Healthcare Support (13 | 2.2%).
Services Occupations by Sex
Within the Services occupations in Verona, the most male-oriented occupations are Firefighting & Prevention (78.6%), Security & Protection (55.0%), and Food Preparation & Serving (52.1%), while the most female-oriented occupations are Healthcare Support (100.0%), Law Enforcement (100.0%), and Cleaning & Maintenance (100.0%).
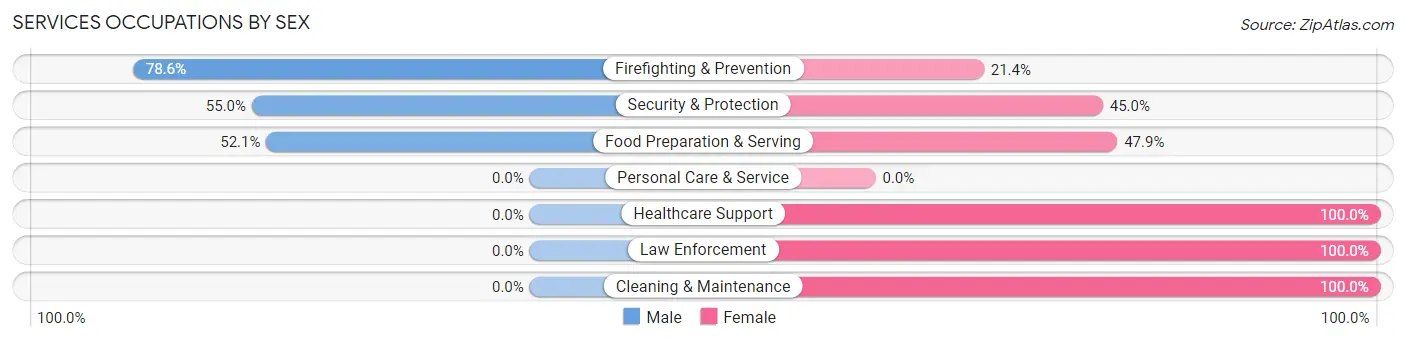
| Occupation | Male | Female |
| Healthcare Support | 0 (0.0%) | 13 (100.0%) |
| Security & Protection | 11 (55.0%) | 9 (45.0%) |
| Firefighting & Prevention | 11 (78.6%) | 3 (21.4%) |
| Law Enforcement | 0 (0.0%) | 6 (100.0%) |
| Food Preparation & Serving | 73 (52.1%) | 67 (47.9%) |
| Cleaning & Maintenance | 0 (0.0%) | 16 (100.0%) |
| Personal Care & Service | 0 (0.0%) | 0 (0.0%) |
| Total (Category) | 84 (44.4%) | 105 (55.6%) |
| Total (Overall) | 284 (47.6%) | 312 (52.3%) |
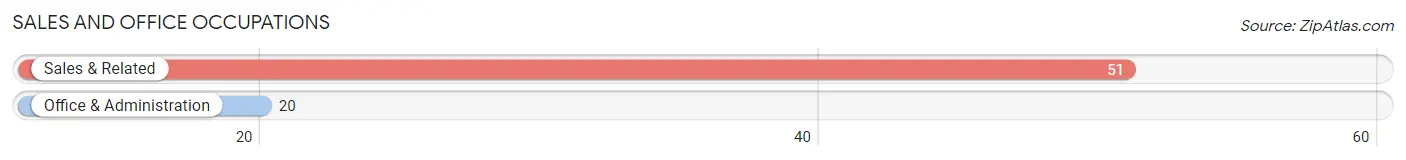
Sales and Office Occupations
The most common Sales and Office occupations in Verona are Sales & Related (51 | 8.6%), and Office & Administration (20 | 3.4%).
Sales and Office Occupations by Sex
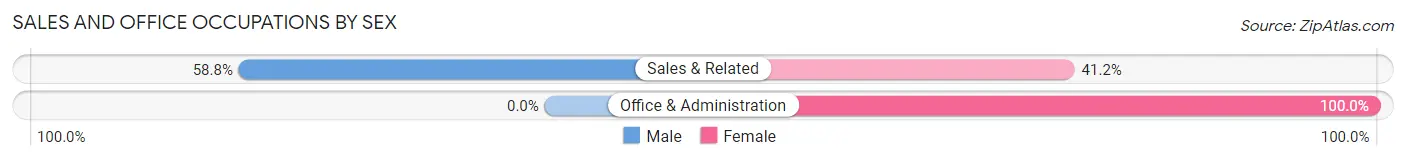
| Occupation | Male | Female |
| Sales & Related | 30 (58.8%) | 21 (41.2%) |
| Office & Administration | 0 (0.0%) | 20 (100.0%) |
| Total (Category) | 30 (42.2%) | 41 (57.8%) |
| Total (Overall) | 284 (47.6%) | 312 (52.3%) |
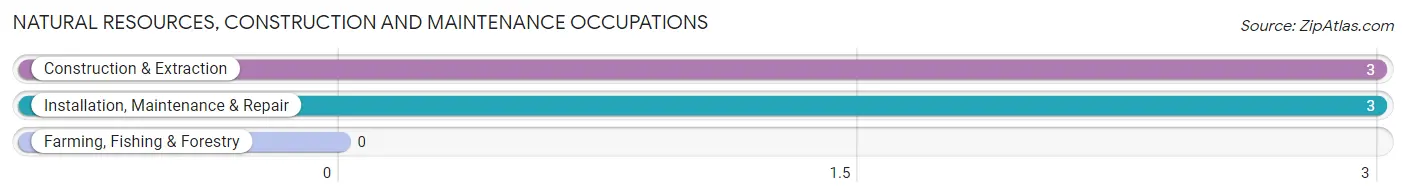
Natural Resources, Construction and Maintenance Occupations
The most common Natural Resources, Construction and Maintenance occupations in Verona are Construction & Extraction (3 | 0.5%), and Installation, Maintenance & Repair (3 | 0.5%).
Natural Resources, Construction and Maintenance Occupations by Sex
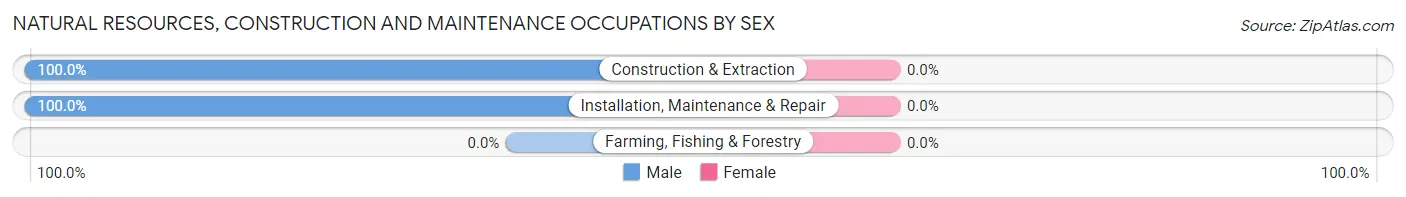
| Occupation | Male | Female |
| Farming, Fishing & Forestry | 0 (0.0%) | 0 (0.0%) |
| Construction & Extraction | 3 (100.0%) | 0 (0.0%) |
| Installation, Maintenance & Repair | 3 (100.0%) | 0 (0.0%) |
| Total (Category) | 6 (100.0%) | 0 (0.0%) |
| Total (Overall) | 284 (47.6%) | 312 (52.3%) |
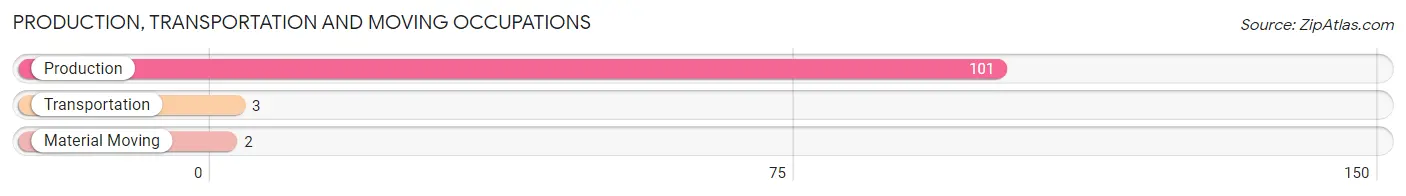
Production, Transportation and Moving Occupations
The most common Production, Transportation and Moving occupations in Verona are Production (101 | 17.0%), Transportation (3 | 0.5%), and Material Moving (2 | 0.3%).
Production, Transportation and Moving Occupations by Sex
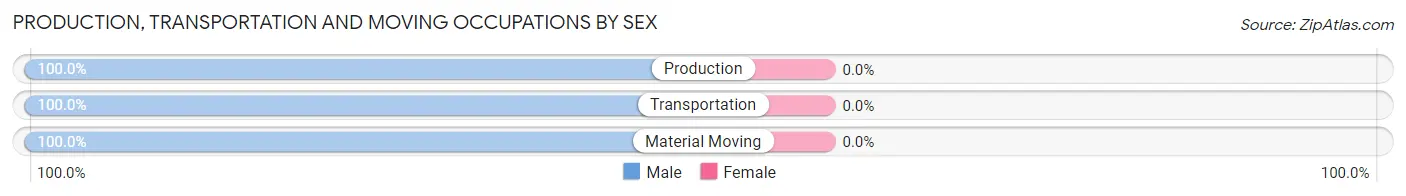
| Occupation | Male | Female |
| Production | 101 (100.0%) | 0 (0.0%) |
| Transportation | 3 (100.0%) | 0 (0.0%) |
| Material Moving | 2 (100.0%) | 0 (0.0%) |
| Total (Category) | 106 (100.0%) | 0 (0.0%) |
| Total (Overall) | 284 (47.6%) | 312 (52.3%) |
Employment Industries by Sex in Verona
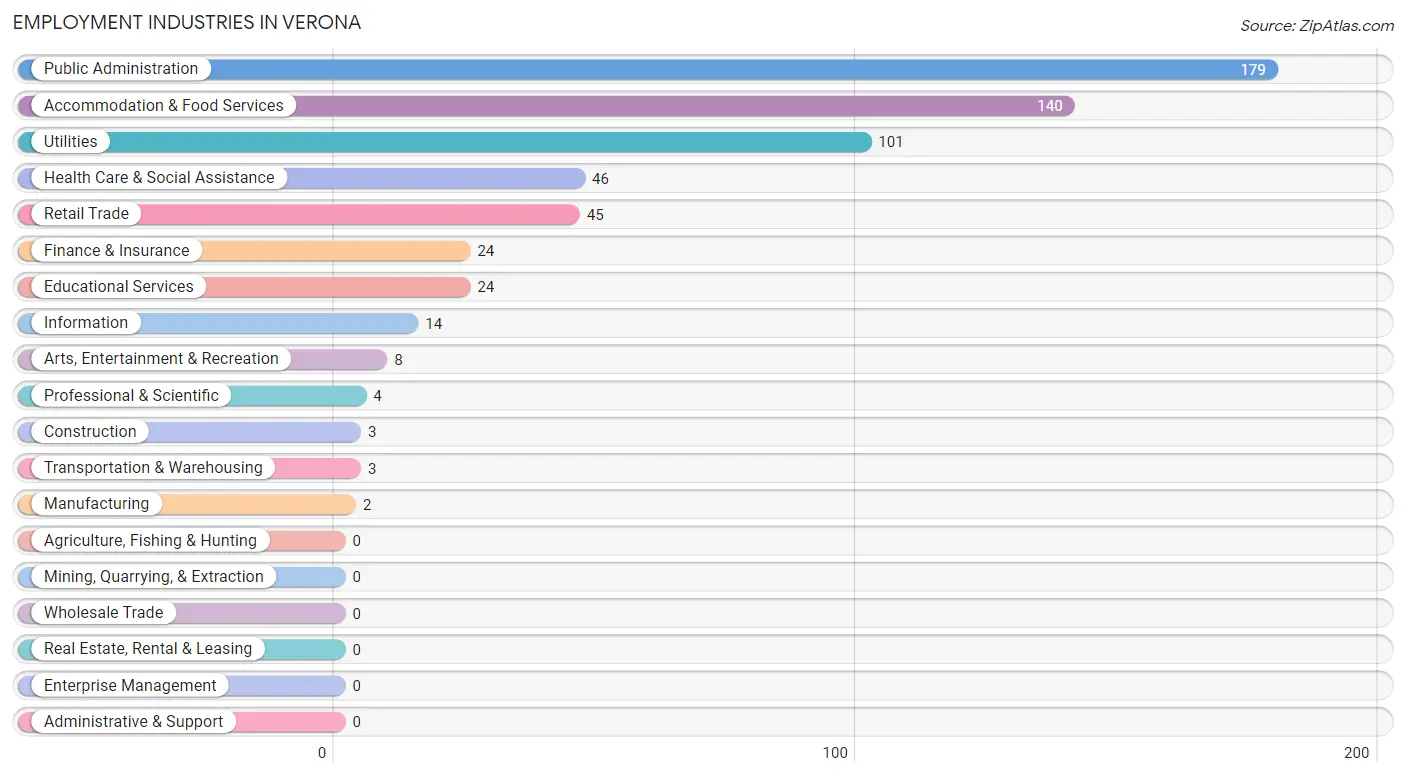
Employment Industries in Verona
The major employment industries in Verona include Public Administration (179 | 30.0%), Accommodation & Food Services (140 | 23.5%), Utilities (101 | 17.0%), Health Care & Social Assistance (46 | 7.7%), and Retail Trade (45 | 7.5%).
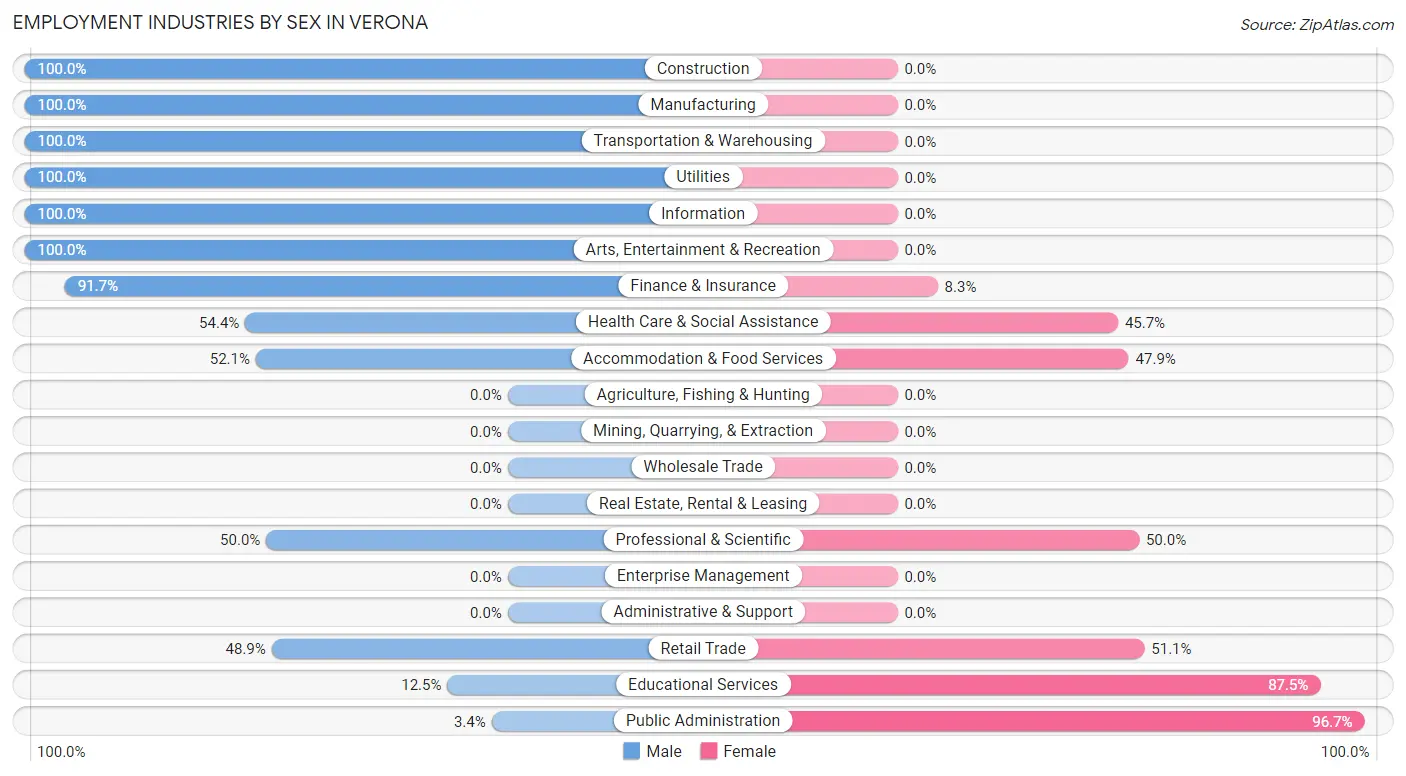
Employment Industries by Sex in Verona
The Verona industries that see more men than women are Construction (100.0%), Manufacturing (100.0%), and Transportation & Warehousing (100.0%), whereas the industries that tend to have a higher number of women are Public Administration (96.7%), Educational Services (87.5%), and Retail Trade (51.1%).
| Industry | Male | Female |
| Agriculture, Fishing & Hunting | 0 (0.0%) | 0 (0.0%) |
| Mining, Quarrying, & Extraction | 0 (0.0%) | 0 (0.0%) |
| Construction | 3 (100.0%) | 0 (0.0%) |
| Manufacturing | 2 (100.0%) | 0 (0.0%) |
| Wholesale Trade | 0 (0.0%) | 0 (0.0%) |
| Retail Trade | 22 (48.9%) | 23 (51.1%) |
| Transportation & Warehousing | 3 (100.0%) | 0 (0.0%) |
| Utilities | 101 (100.0%) | 0 (0.0%) |
| Information | 14 (100.0%) | 0 (0.0%) |
| Finance & Insurance | 22 (91.7%) | 2 (8.3%) |
| Real Estate, Rental & Leasing | 0 (0.0%) | 0 (0.0%) |
| Professional & Scientific | 2 (50.0%) | 2 (50.0%) |
| Enterprise Management | 0 (0.0%) | 0 (0.0%) |
| Administrative & Support | 0 (0.0%) | 0 (0.0%) |
| Educational Services | 3 (12.5%) | 21 (87.5%) |
| Health Care & Social Assistance | 25 (54.3%) | 21 (45.7%) |
| Arts, Entertainment & Recreation | 8 (100.0%) | 0 (0.0%) |
| Accommodation & Food Services | 73 (52.1%) | 67 (47.9%) |
| Public Administration | 6 (3.4%) | 173 (96.7%) |
| Total | 284 (47.6%) | 312 (52.3%) |
Education in Verona
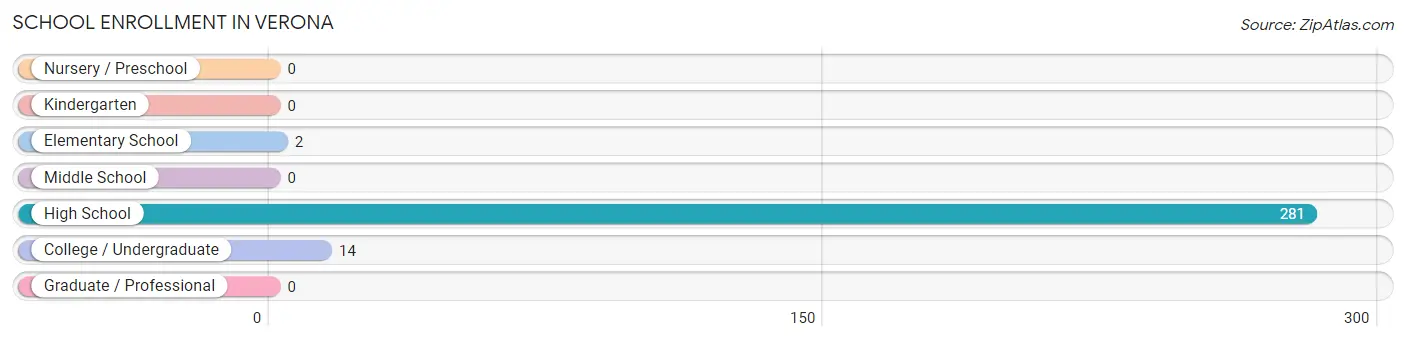
School Enrollment in Verona
The most common levels of schooling among the 297 students in Verona are high school (281 | 94.6%), college / undergraduate (14 | 4.7%), and elementary school (2 | 0.7%).
| School Level | # Students | % Students |
| Nursery / Preschool | 0 | 0.0% |
| Kindergarten | 0 | 0.0% |
| Elementary School | 2 | 0.7% |
| Middle School | 0 | 0.0% |
| High School | 281 | 94.6% |
| College / Undergraduate | 14 | 4.7% |
| Graduate / Professional | 0 | 0.0% |
| Total | 297 | 100.0% |
School Enrollment by Age by Funding Source in Verona
Out of a total of 297 students who are enrolled in schools in Verona, 3 (1.0%) attend a private institution, while the remaining 294 (99.0%) are enrolled in public schools. The age group of 15 to 17 year olds has the highest likelihood of being enrolled in private schools, with 3 (2.2% in the age bracket) enrolled. Conversely, the age group of 5 to 9 year old has the lowest likelihood of being enrolled in a private school, with 2 (100.0% in the age bracket) attending a public institution.
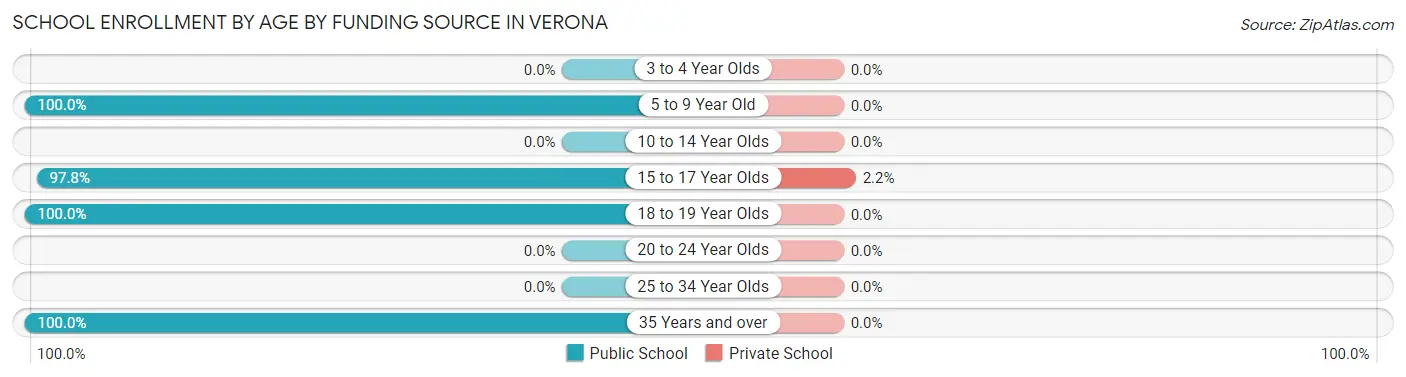
| Age Bracket | Public School | Private School |
| 3 to 4 Year Olds | 0 (0.0%) | 0 (0.0%) |
| 5 to 9 Year Old | 2 (100.0%) | 0 (0.0%) |
| 10 to 14 Year Olds | 0 (0.0%) | 0 (0.0%) |
| 15 to 17 Year Olds | 131 (97.8%) | 3 (2.2%) |
| 18 to 19 Year Olds | 158 (100.0%) | 0 (0.0%) |
| 20 to 24 Year Olds | 0 (0.0%) | 0 (0.0%) |
| 25 to 34 Year Olds | 0 (0.0%) | 0 (0.0%) |
| 35 Years and over | 3 (100.0%) | 0 (0.0%) |
| Total | 294 (99.0%) | 3 (1.0%) |
Educational Attainment by Field of Study in Verona
Education (43 | 25.0%), bio, nature & agricultural (42 | 24.4%), psychology (37 | 21.5%), engineering (35 | 20.3%), and business (15 | 8.7%) are the most common fields of study among 172 individuals in Verona who have obtained a bachelor's degree or higher.
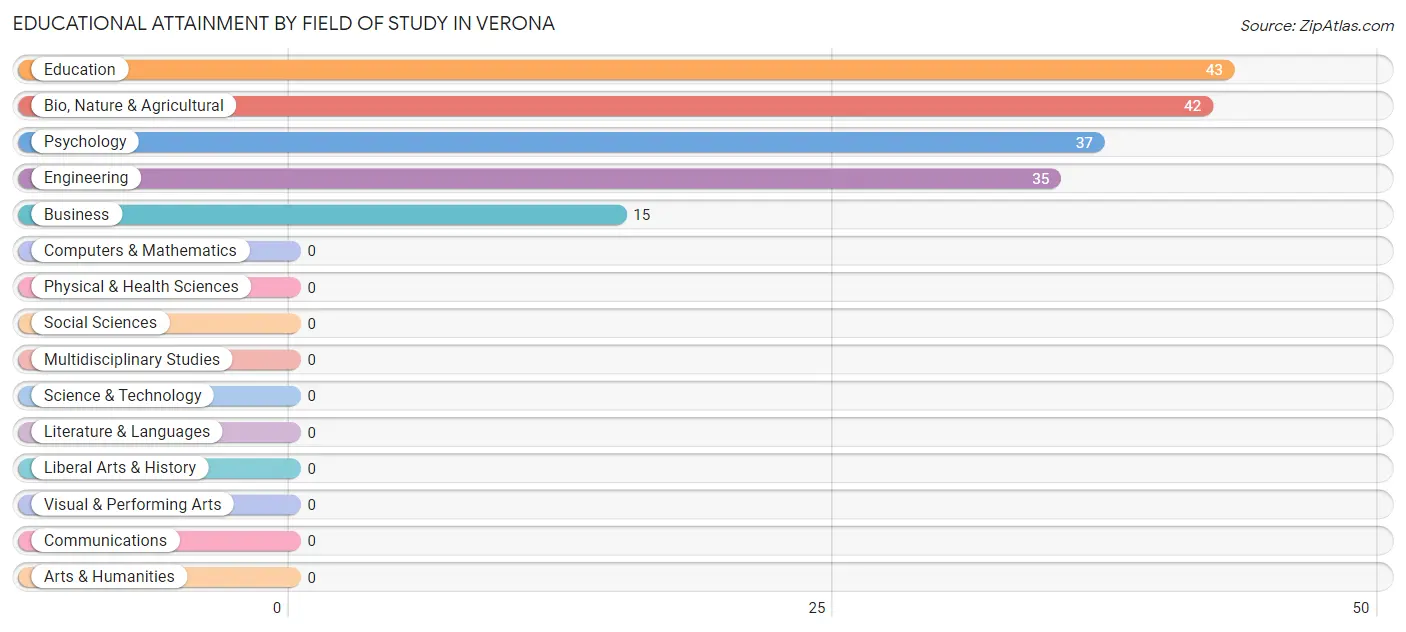
| Field of Study | # Graduates | % Graduates |
| Computers & Mathematics | 0 | 0.0% |
| Bio, Nature & Agricultural | 42 | 24.4% |
| Physical & Health Sciences | 0 | 0.0% |
| Psychology | 37 | 21.5% |
| Social Sciences | 0 | 0.0% |
| Engineering | 35 | 20.3% |
| Multidisciplinary Studies | 0 | 0.0% |
| Science & Technology | 0 | 0.0% |
| Business | 15 | 8.7% |
| Education | 43 | 25.0% |
| Literature & Languages | 0 | 0.0% |
| Liberal Arts & History | 0 | 0.0% |
| Visual & Performing Arts | 0 | 0.0% |
| Communications | 0 | 0.0% |
| Arts & Humanities | 0 | 0.0% |
| Total | 172 | 100.0% |
Transportation & Commute in Verona
Vehicle Availability by Sex in Verona
The most prevalent vehicle ownership categories in Verona are males with 2 vehicles (164, accounting for 57.8%) and females with 2 vehicles (134, making up 52.6%).
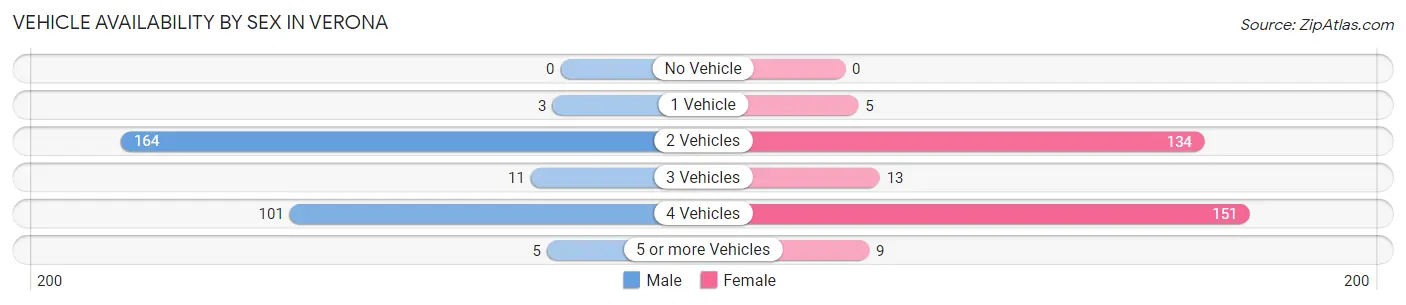
| Vehicles Available | Male | Female |
| No Vehicle | 0 (0.0%) | 0 (0.0%) |
| 1 Vehicle | 3 (1.1%) | 5 (1.6%) |
| 2 Vehicles | 164 (57.8%) | 134 (42.9%) |
| 3 Vehicles | 11 (3.9%) | 13 (4.2%) |
| 4 Vehicles | 101 (35.6%) | 151 (48.4%) |
| 5 or more Vehicles | 5 (1.8%) | 9 (2.9%) |
| Total | 284 (100.0%) | 312 (100.0%) |
Commute Time in Verona
The most frequently occuring commute durations in Verona are 10 to 14 minutes (255 commuters, 43.2%), 15 to 19 minutes (189 commuters, 32.0%), and 20 to 24 minutes (83 commuters, 14.1%).
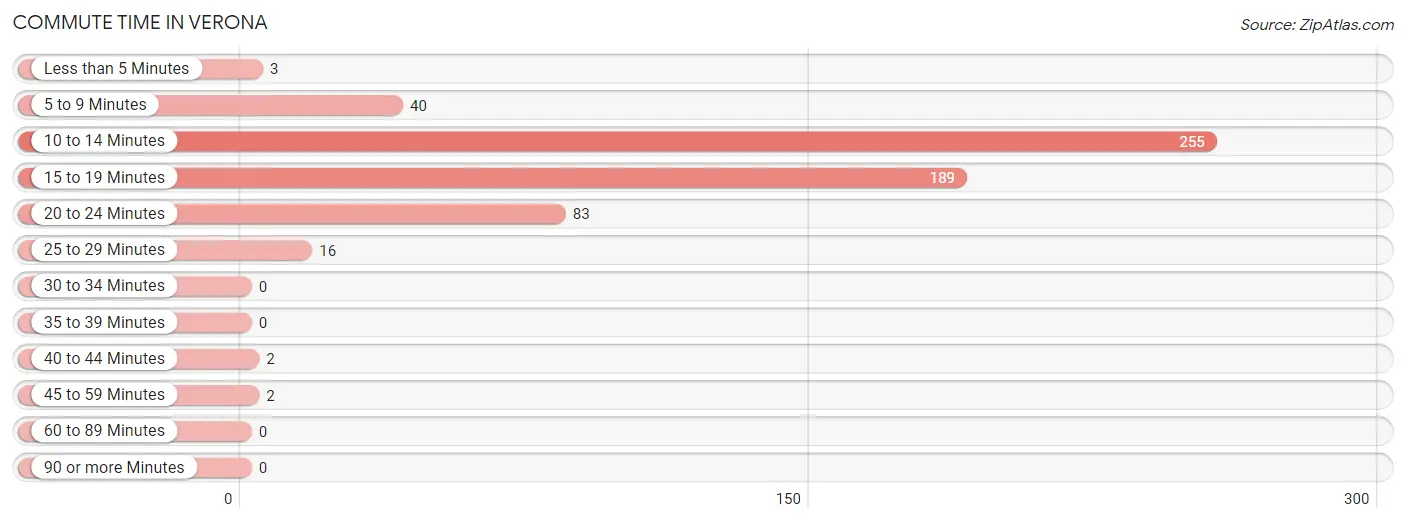
| Commute Time | # Commuters | % Commuters |
| Less than 5 Minutes | 3 | 0.5% |
| 5 to 9 Minutes | 40 | 6.8% |
| 10 to 14 Minutes | 255 | 43.2% |
| 15 to 19 Minutes | 189 | 32.0% |
| 20 to 24 Minutes | 83 | 14.1% |
| 25 to 29 Minutes | 16 | 2.7% |
| 30 to 34 Minutes | 0 | 0.0% |
| 35 to 39 Minutes | 0 | 0.0% |
| 40 to 44 Minutes | 2 | 0.3% |
| 45 to 59 Minutes | 2 | 0.3% |
| 60 to 89 Minutes | 0 | 0.0% |
| 90 or more Minutes | 0 | 0.0% |
Commute Time by Sex in Verona
The most common commute times in Verona are 15 to 19 minutes (142 commuters, 50.5%) for males and 10 to 14 minutes (151 commuters, 48.9%) for females.
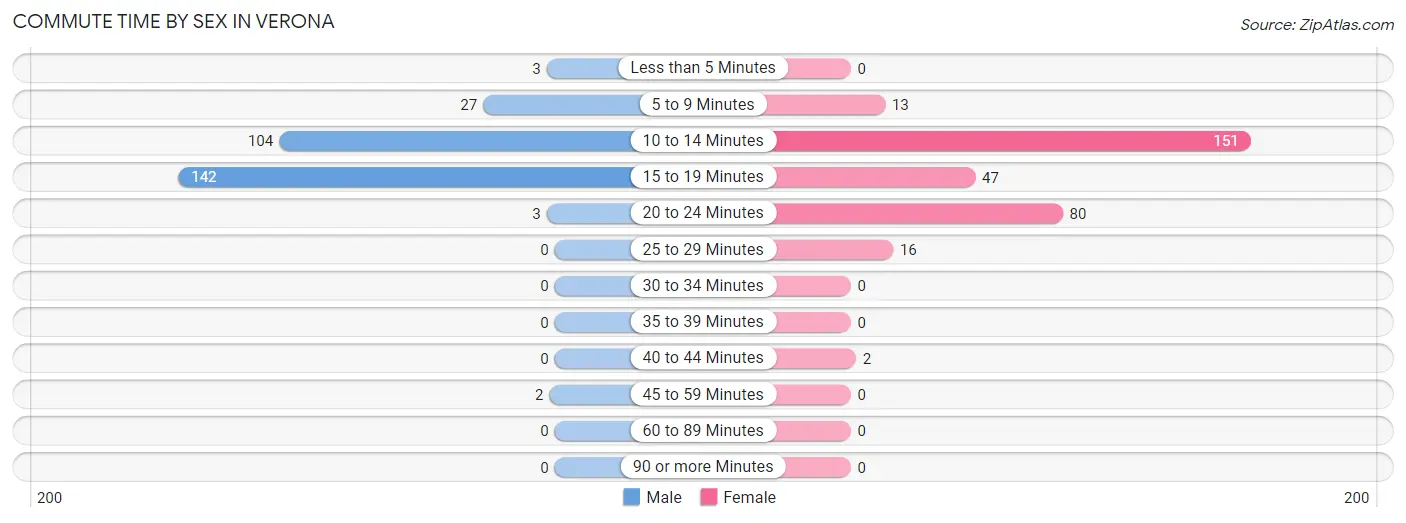
| Commute Time | Male | Female |
| Less than 5 Minutes | 3 (1.1%) | 0 (0.0%) |
| 5 to 9 Minutes | 27 (9.6%) | 13 (4.2%) |
| 10 to 14 Minutes | 104 (37.0%) | 151 (48.9%) |
| 15 to 19 Minutes | 142 (50.5%) | 47 (15.2%) |
| 20 to 24 Minutes | 3 (1.1%) | 80 (25.9%) |
| 25 to 29 Minutes | 0 (0.0%) | 16 (5.2%) |
| 30 to 34 Minutes | 0 (0.0%) | 0 (0.0%) |
| 35 to 39 Minutes | 0 (0.0%) | 0 (0.0%) |
| 40 to 44 Minutes | 0 (0.0%) | 2 (0.6%) |
| 45 to 59 Minutes | 2 (0.7%) | 0 (0.0%) |
| 60 to 89 Minutes | 0 (0.0%) | 0 (0.0%) |
| 90 or more Minutes | 0 (0.0%) | 0 (0.0%) |
Time of Departure to Work by Sex in Verona
The most frequent times of departure to work in Verona are 7:30 AM to 7:59 AM (126, 44.8%) for males and 8:00 AM to 8:29 AM (170, 55.0%) for females.
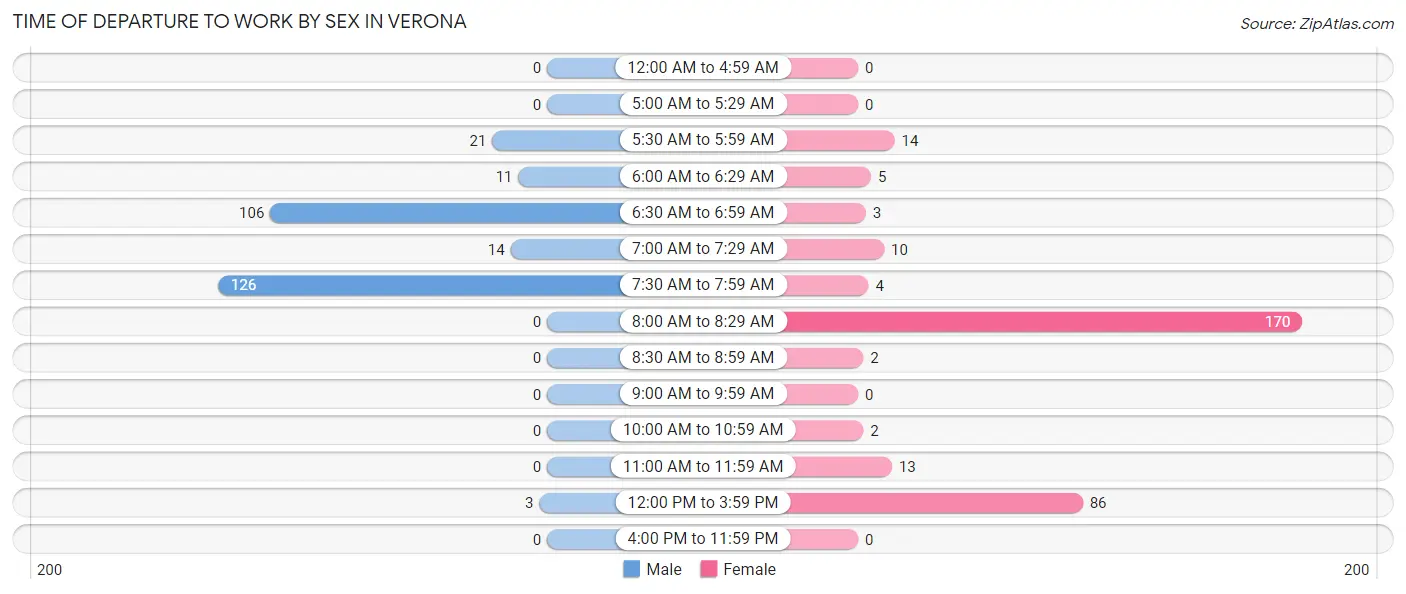
| Time of Departure | Male | Female |
| 12:00 AM to 4:59 AM | 0 (0.0%) | 0 (0.0%) |
| 5:00 AM to 5:29 AM | 0 (0.0%) | 0 (0.0%) |
| 5:30 AM to 5:59 AM | 21 (7.5%) | 14 (4.5%) |
| 6:00 AM to 6:29 AM | 11 (3.9%) | 5 (1.6%) |
| 6:30 AM to 6:59 AM | 106 (37.7%) | 3 (1.0%) |
| 7:00 AM to 7:29 AM | 14 (5.0%) | 10 (3.2%) |
| 7:30 AM to 7:59 AM | 126 (44.8%) | 4 (1.3%) |
| 8:00 AM to 8:29 AM | 0 (0.0%) | 170 (55.0%) |
| 8:30 AM to 8:59 AM | 0 (0.0%) | 2 (0.6%) |
| 9:00 AM to 9:59 AM | 0 (0.0%) | 0 (0.0%) |
| 10:00 AM to 10:59 AM | 0 (0.0%) | 2 (0.6%) |
| 11:00 AM to 11:59 AM | 0 (0.0%) | 13 (4.2%) |
| 12:00 PM to 3:59 PM | 3 (1.1%) | 86 (27.8%) |
| 4:00 PM to 11:59 PM | 0 (0.0%) | 0 (0.0%) |
| Total | 281 (100.0%) | 309 (100.0%) |
Housing Occupancy in Verona
Occupancy by Ownership in Verona
Of the total 610 dwellings in Verona, owner-occupied units account for 493 (80.8%), while renter-occupied units make up 117 (19.2%).
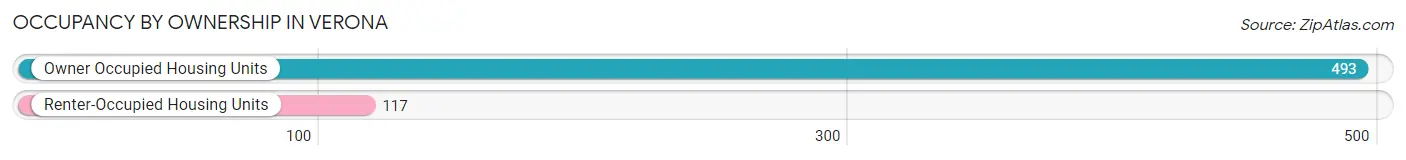
| Occupancy | # Housing Units | % Housing Units |
| Owner Occupied Housing Units | 493 | 80.8% |
| Renter-Occupied Housing Units | 117 | 19.2% |
| Total Occupied Housing Units | 610 | 100.0% |
Occupancy by Household Size in Verona
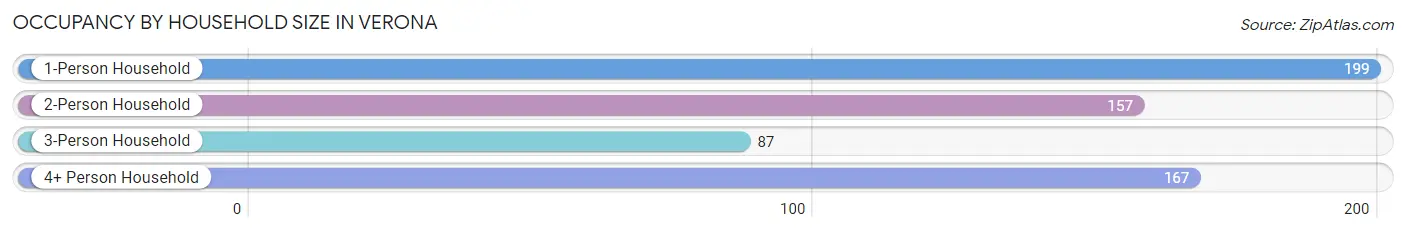
| Household Size | # Housing Units | % Housing Units |
| 1-Person Household | 199 | 32.6% |
| 2-Person Household | 157 | 25.7% |
| 3-Person Household | 87 | 14.3% |
| 4+ Person Household | 167 | 27.4% |
| Total Housing Units | 610 | 100.0% |
Occupancy by Ownership by Household Size in Verona
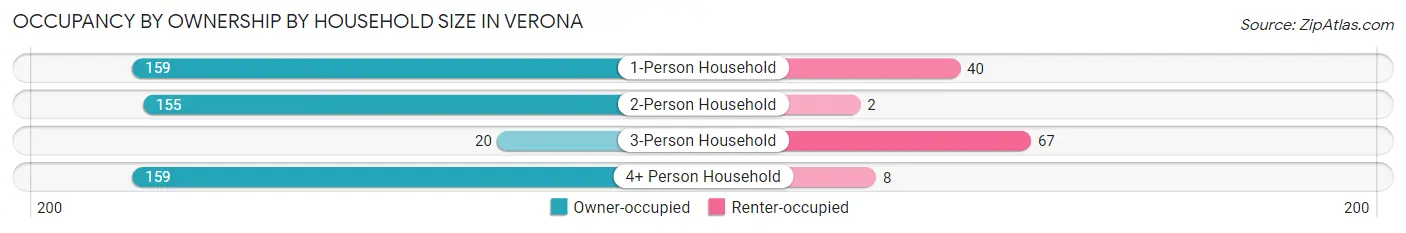
| Household Size | Owner-occupied | Renter-occupied |
| 1-Person Household | 159 (79.9%) | 40 (20.1%) |
| 2-Person Household | 155 (98.7%) | 2 (1.3%) |
| 3-Person Household | 20 (23.0%) | 67 (77.0%) |
| 4+ Person Household | 159 (95.2%) | 8 (4.8%) |
| Total Housing Units | 493 (80.8%) | 117 (19.2%) |
Occupancy by Educational Attainment in Verona
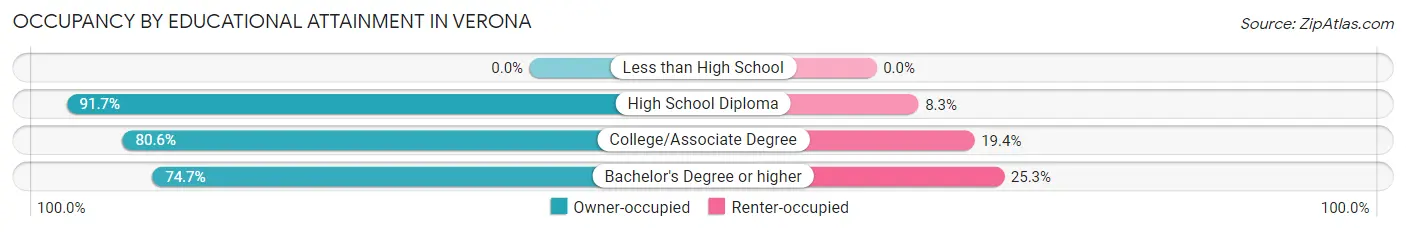
| Household Size | Owner-occupied | Renter-occupied |
| Less than High School | 0 (0.0%) | 0 (0.0%) |
| High School Diploma | 88 (91.7%) | 8 (8.3%) |
| College/Associate Degree | 290 (80.6%) | 70 (19.4%) |
| Bachelor's Degree or higher | 115 (74.7%) | 39 (25.3%) |
Occupancy by Age of Householder in Verona
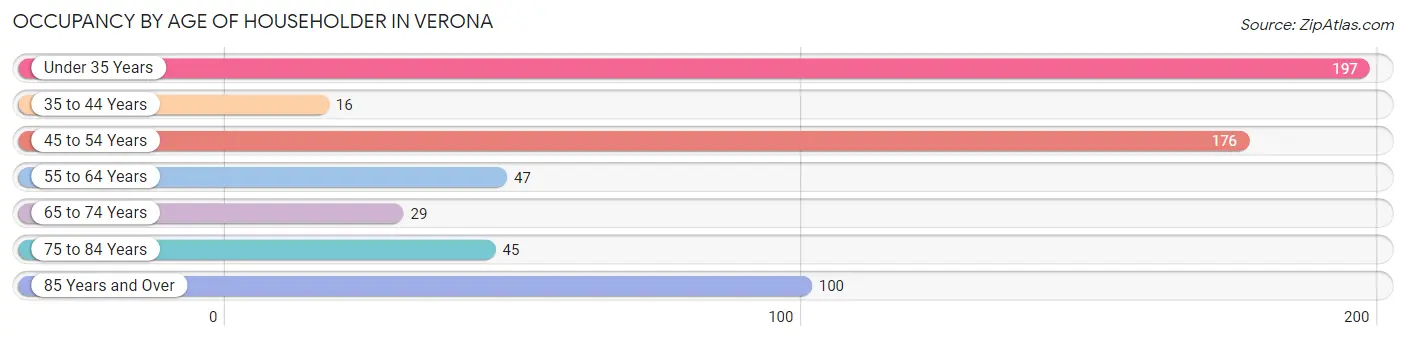
| Age Bracket | # Households | % Households |
| Under 35 Years | 197 | 32.3% |
| 35 to 44 Years | 16 | 2.6% |
| 45 to 54 Years | 176 | 28.8% |
| 55 to 64 Years | 47 | 7.7% |
| 65 to 74 Years | 29 | 4.8% |
| 75 to 84 Years | 45 | 7.4% |
| 85 Years and Over | 100 | 16.4% |
| Total | 610 | 100.0% |
Housing Finances in Verona
Median Income by Occupancy in Verona
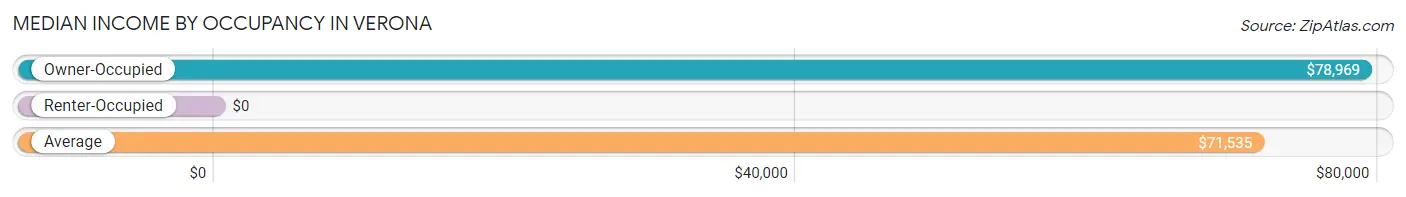
| Occupancy Type | # Households | Median Income |
| Owner-Occupied | 493 (80.8%) | $78,969 |
| Renter-Occupied | 117 (19.2%) | $0 |
| Average | 610 (100.0%) | $71,535 |
Occupancy by Householder Income Bracket in Verona
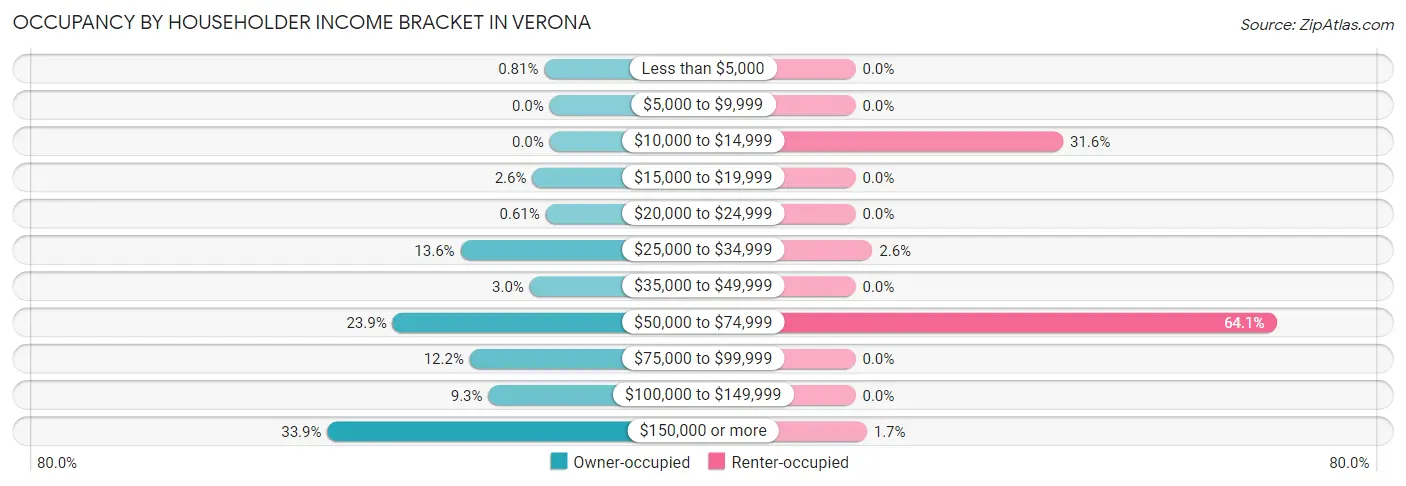
| Income Bracket | Owner-occupied | Renter-occupied |
| Less than $5,000 | 4 (0.8%) | 0 (0.0%) |
| $5,000 to $9,999 | 0 (0.0%) | 0 (0.0%) |
| $10,000 to $14,999 | 0 (0.0%) | 37 (31.6%) |
| $15,000 to $19,999 | 13 (2.6%) | 0 (0.0%) |
| $20,000 to $24,999 | 3 (0.6%) | 0 (0.0%) |
| $25,000 to $34,999 | 67 (13.6%) | 3 (2.6%) |
| $35,000 to $49,999 | 15 (3.0%) | 0 (0.0%) |
| $50,000 to $74,999 | 118 (23.9%) | 75 (64.1%) |
| $75,000 to $99,999 | 60 (12.2%) | 0 (0.0%) |
| $100,000 to $149,999 | 46 (9.3%) | 0 (0.0%) |
| $150,000 or more | 167 (33.9%) | 2 (1.7%) |
| Total | 493 (100.0%) | 117 (100.0%) |
Monthly Housing Cost Tiers in Verona
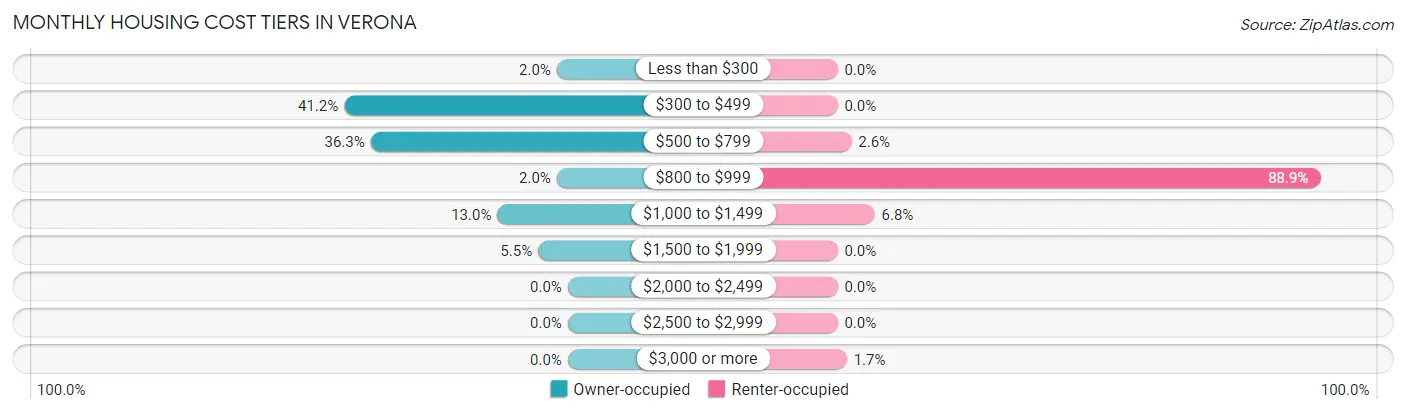
| Monthly Cost | Owner-occupied | Renter-occupied |
| Less than $300 | 10 (2.0%) | 0 (0.0%) |
| $300 to $499 | 203 (41.2%) | 0 (0.0%) |
| $500 to $799 | 179 (36.3%) | 3 (2.6%) |
| $800 to $999 | 10 (2.0%) | 104 (88.9%) |
| $1,000 to $1,499 | 64 (13.0%) | 8 (6.8%) |
| $1,500 to $1,999 | 27 (5.5%) | 0 (0.0%) |
| $2,000 to $2,499 | 0 (0.0%) | 0 (0.0%) |
| $2,500 to $2,999 | 0 (0.0%) | 0 (0.0%) |
| $3,000 or more | 0 (0.0%) | 2 (1.7%) |
| Total | 493 (100.0%) | 117 (100.0%) |
Physical Housing Characteristics in Verona
Housing Structures in Verona
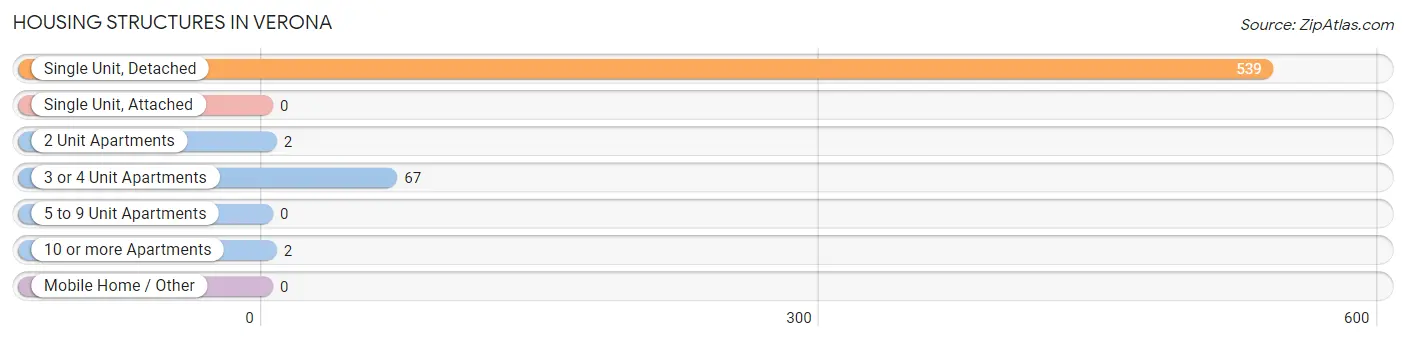
| Structure Type | # Housing Units | % Housing Units |
| Single Unit, Detached | 539 | 88.4% |
| Single Unit, Attached | 0 | 0.0% |
| 2 Unit Apartments | 2 | 0.3% |
| 3 or 4 Unit Apartments | 67 | 11.0% |
| 5 to 9 Unit Apartments | 0 | 0.0% |
| 10 or more Apartments | 2 | 0.3% |
| Mobile Home / Other | 0 | 0.0% |
| Total | 610 | 100.0% |
Housing Structures by Occupancy in Verona
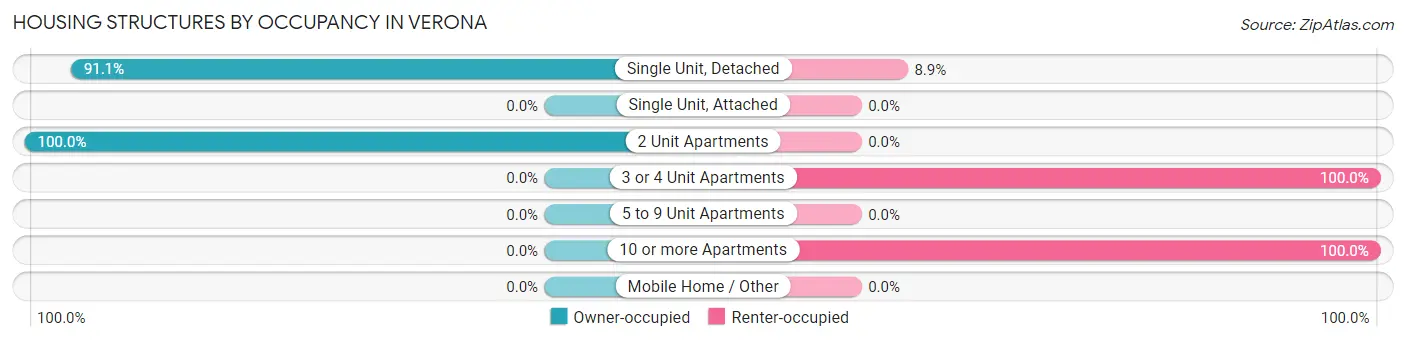
| Structure Type | Owner-occupied | Renter-occupied |
| Single Unit, Detached | 491 (91.1%) | 48 (8.9%) |
| Single Unit, Attached | 0 (0.0%) | 0 (0.0%) |
| 2 Unit Apartments | 2 (100.0%) | 0 (0.0%) |
| 3 or 4 Unit Apartments | 0 (0.0%) | 67 (100.0%) |
| 5 to 9 Unit Apartments | 0 (0.0%) | 0 (0.0%) |
| 10 or more Apartments | 0 (0.0%) | 2 (100.0%) |
| Mobile Home / Other | 0 (0.0%) | 0 (0.0%) |
| Total | 493 (80.8%) | 117 (19.2%) |
Housing Structures by Number of Rooms in Verona
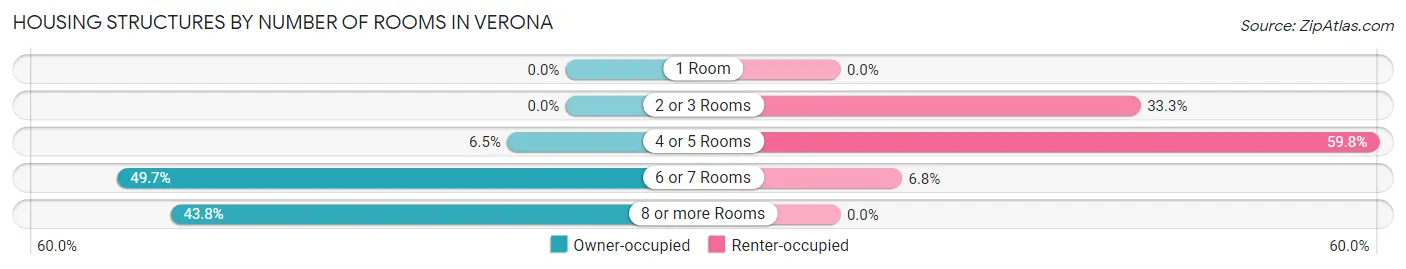
| Number of Rooms | Owner-occupied | Renter-occupied |
| 1 Room | 0 (0.0%) | 0 (0.0%) |
| 2 or 3 Rooms | 0 (0.0%) | 39 (33.3%) |
| 4 or 5 Rooms | 32 (6.5%) | 70 (59.8%) |
| 6 or 7 Rooms | 245 (49.7%) | 8 (6.8%) |
| 8 or more Rooms | 216 (43.8%) | 0 (0.0%) |
| Total | 493 (100.0%) | 117 (100.0%) |
Housing Structure by Heating Type in Verona
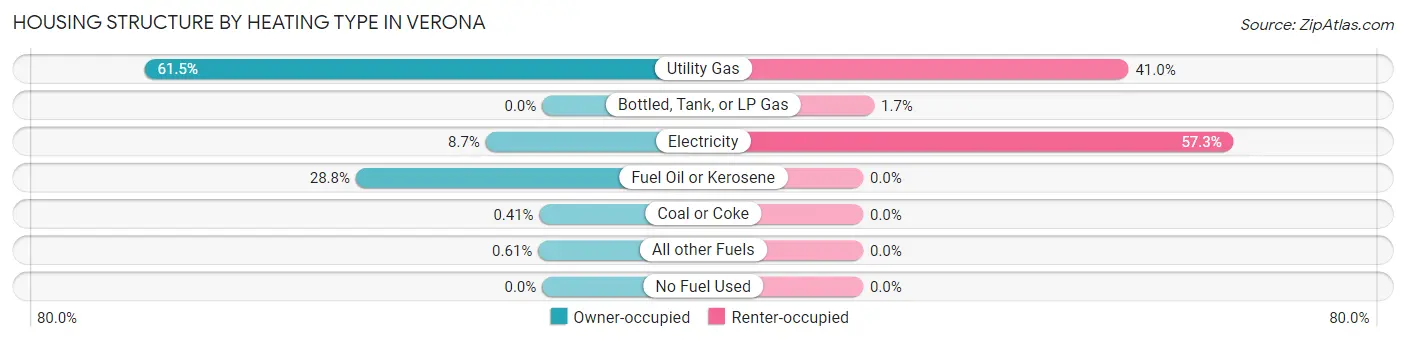
| Heating Type | Owner-occupied | Renter-occupied |
| Utility Gas | 303 (61.5%) | 48 (41.0%) |
| Bottled, Tank, or LP Gas | 0 (0.0%) | 2 (1.7%) |
| Electricity | 43 (8.7%) | 67 (57.3%) |
| Fuel Oil or Kerosene | 142 (28.8%) | 0 (0.0%) |
| Coal or Coke | 2 (0.4%) | 0 (0.0%) |
| All other Fuels | 3 (0.6%) | 0 (0.0%) |
| No Fuel Used | 0 (0.0%) | 0 (0.0%) |
| Total | 493 (100.0%) | 117 (100.0%) |
Household Vehicle Usage in Verona
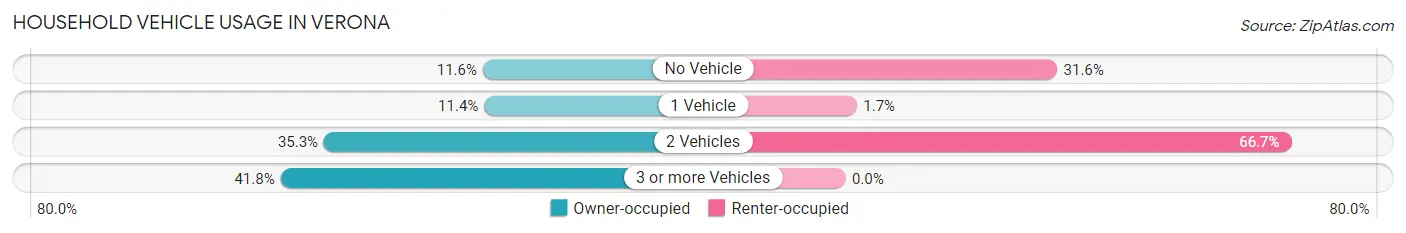
| Vehicles per Household | Owner-occupied | Renter-occupied |
| No Vehicle | 57 (11.6%) | 37 (31.6%) |
| 1 Vehicle | 56 (11.4%) | 2 (1.7%) |
| 2 Vehicles | 174 (35.3%) | 78 (66.7%) |
| 3 or more Vehicles | 206 (41.8%) | 0 (0.0%) |
| Total | 493 (100.0%) | 117 (100.0%) |
Real Estate & Mortgages in Verona
Real Estate and Mortgage Overview in Verona
| Characteristic | Without Mortgage | With Mortgage |
| Housing Units | 392 | 101 |
| Median Property Value | $209,800 | $151,400 |
| Median Household Income | - | - |
| Monthly Housing Costs | $460 | $0 |
| Real Estate Taxes | $2,743 | $0 |
Property Value by Mortgage Status in Verona
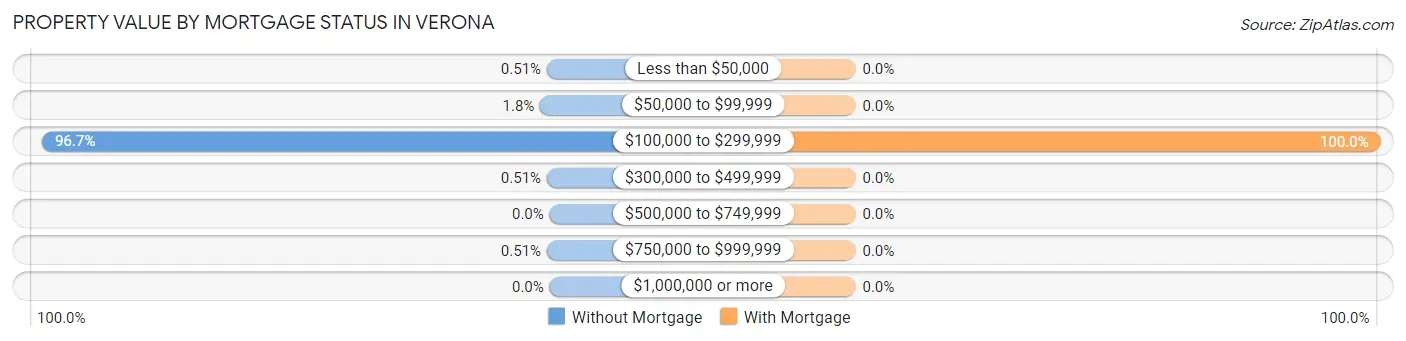
| Property Value | Without Mortgage | With Mortgage |
| Less than $50,000 | 2 (0.5%) | 0 (0.0%) |
| $50,000 to $99,999 | 7 (1.8%) | 0 (0.0%) |
| $100,000 to $299,999 | 379 (96.7%) | 101 (100.0%) |
| $300,000 to $499,999 | 2 (0.5%) | 0 (0.0%) |
| $500,000 to $749,999 | 0 (0.0%) | 0 (0.0%) |
| $750,000 to $999,999 | 2 (0.5%) | 0 (0.0%) |
| $1,000,000 or more | 0 (0.0%) | 0 (0.0%) |
| Total | 392 (100.0%) | 101 (100.0%) |
Household Income by Mortgage Status in Verona
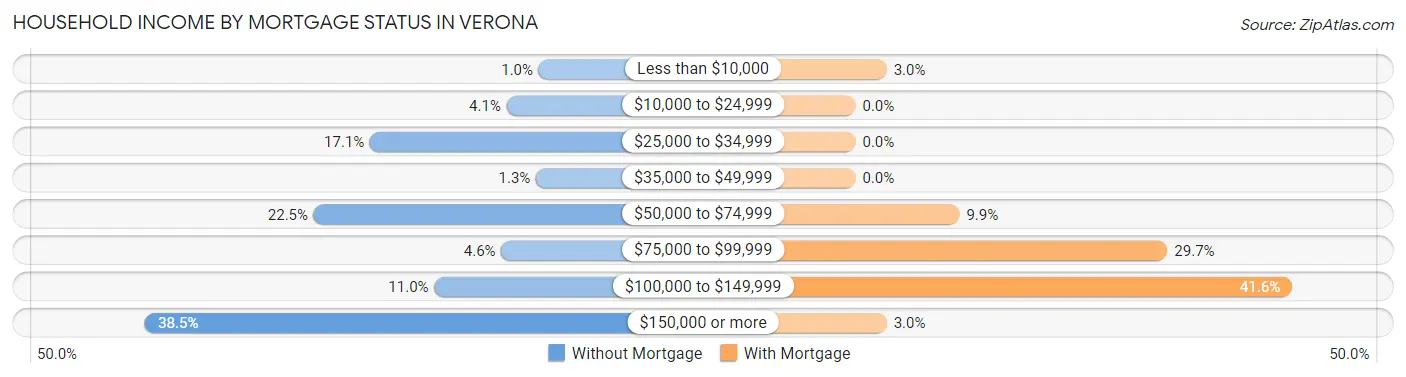
| Household Income | Without Mortgage | With Mortgage |
| Less than $10,000 | 4 (1.0%) | 3 (3.0%) |
| $10,000 to $24,999 | 16 (4.1%) | 0 (0.0%) |
| $25,000 to $34,999 | 67 (17.1%) | 0 (0.0%) |
| $35,000 to $49,999 | 5 (1.3%) | 0 (0.0%) |
| $50,000 to $74,999 | 88 (22.5%) | 10 (9.9%) |
| $75,000 to $99,999 | 18 (4.6%) | 30 (29.7%) |
| $100,000 to $149,999 | 43 (11.0%) | 42 (41.6%) |
| $150,000 or more | 151 (38.5%) | 3 (3.0%) |
| Total | 392 (100.0%) | 101 (100.0%) |
Property Value to Household Income Ratio in Verona
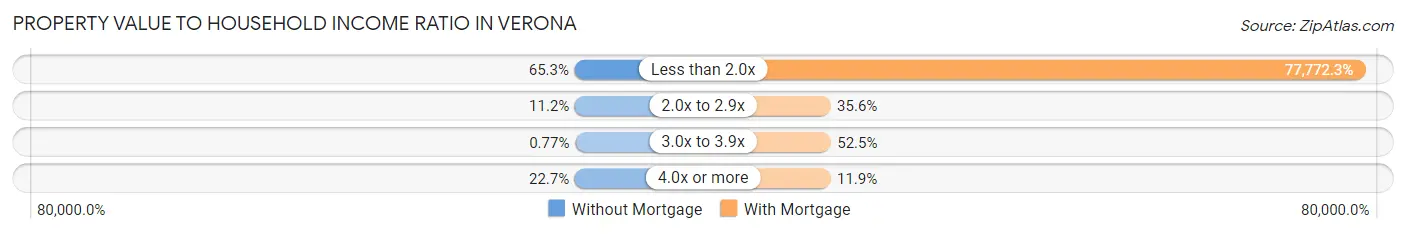
| Value-to-Income Ratio | Without Mortgage | With Mortgage |
| Less than 2.0x | 256 (65.3%) | 78,550 (77,772.3%) |
| 2.0x to 2.9x | 44 (11.2%) | 36 (35.6%) |
| 3.0x to 3.9x | 3 (0.8%) | 53 (52.5%) |
| 4.0x or more | 89 (22.7%) | 12 (11.9%) |
| Total | 392 (100.0%) | 101 (100.0%) |
Real Estate Taxes by Mortgage Status in Verona
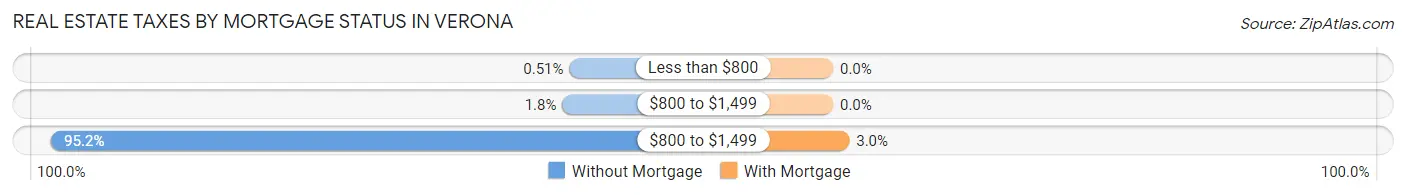
| Property Taxes | Without Mortgage | With Mortgage |
| Less than $800 | 2 (0.5%) | 0 (0.0%) |
| $800 to $1,499 | 7 (1.8%) | 0 (0.0%) |
| $800 to $1,499 | 373 (95.2%) | 3 (3.0%) |
| Total | 392 (100.0%) | 101 (100.0%) |
Health & Disability in Verona
Health Insurance Coverage by Age in Verona
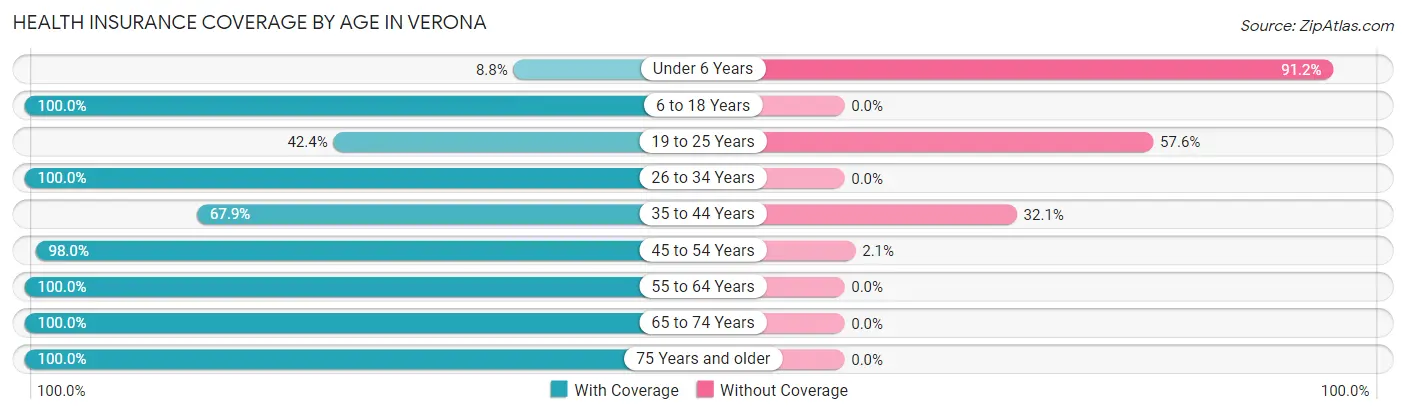
| Age Bracket | With Coverage | Without Coverage |
| Under 6 Years | 6 (8.8%) | 62 (91.2%) |
| 6 to 18 Years | 283 (100.0%) | 0 (0.0%) |
| 19 to 25 Years | 53 (42.4%) | 72 (57.6%) |
| 26 to 34 Years | 205 (100.0%) | 0 (0.0%) |
| 35 to 44 Years | 19 (67.9%) | 9 (32.1%) |
| 45 to 54 Years | 286 (98.0%) | 6 (2.1%) |
| 55 to 64 Years | 76 (100.0%) | 0 (0.0%) |
| 65 to 74 Years | 95 (100.0%) | 0 (0.0%) |
| 75 Years and older | 191 (100.0%) | 0 (0.0%) |
| Total | 1,214 (89.1%) | 149 (10.9%) |
Health Insurance Coverage by Citizenship Status in Verona
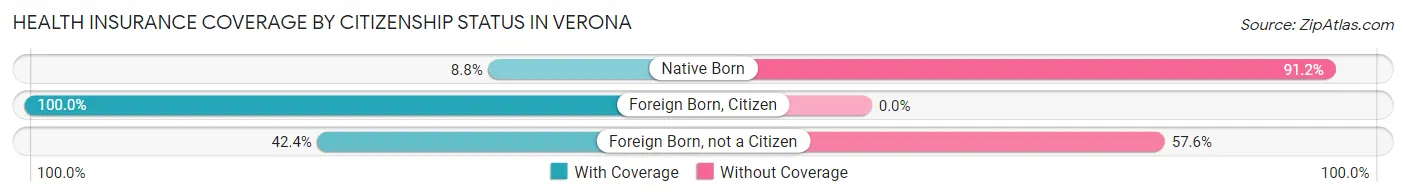
| Citizenship Status | With Coverage | Without Coverage |
| Native Born | 6 (8.8%) | 62 (91.2%) |
| Foreign Born, Citizen | 283 (100.0%) | 0 (0.0%) |
| Foreign Born, not a Citizen | 53 (42.4%) | 72 (57.6%) |
Health Insurance Coverage by Household Income in Verona
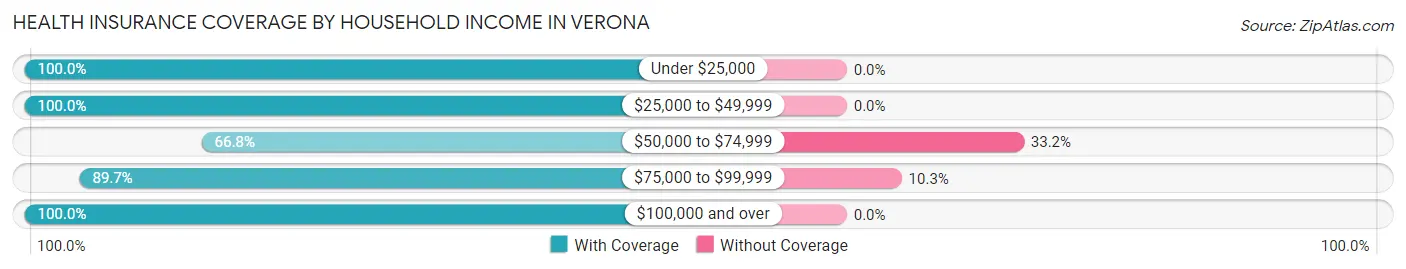
| Household Income | With Coverage | Without Coverage |
| Under $25,000 | 60 (100.0%) | 0 (0.0%) |
| $25,000 to $49,999 | 110 (100.0%) | 0 (0.0%) |
| $50,000 to $74,999 | 278 (66.8%) | 138 (33.2%) |
| $75,000 to $99,999 | 96 (89.7%) | 11 (10.3%) |
| $100,000 and over | 670 (100.0%) | 0 (0.0%) |
Public vs Private Health Insurance Coverage by Age in Verona
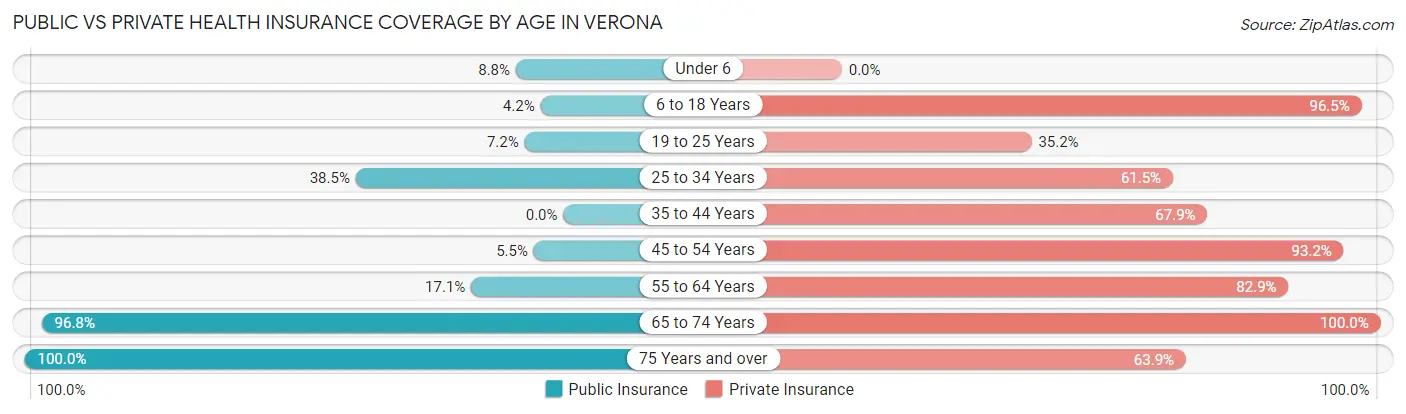
| Age Bracket | Public Insurance | Private Insurance |
| Under 6 | 6 (8.8%) | 0 (0.0%) |
| 6 to 18 Years | 12 (4.2%) | 273 (96.5%) |
| 19 to 25 Years | 9 (7.2%) | 44 (35.2%) |
| 25 to 34 Years | 79 (38.5%) | 126 (61.5%) |
| 35 to 44 Years | 0 (0.0%) | 19 (67.9%) |
| 45 to 54 Years | 16 (5.5%) | 272 (93.1%) |
| 55 to 64 Years | 13 (17.1%) | 63 (82.9%) |
| 65 to 74 Years | 92 (96.8%) | 95 (100.0%) |
| 75 Years and over | 191 (100.0%) | 122 (63.9%) |
| Total | 418 (30.7%) | 1,014 (74.4%) |
Disability Status by Sex by Age in Verona
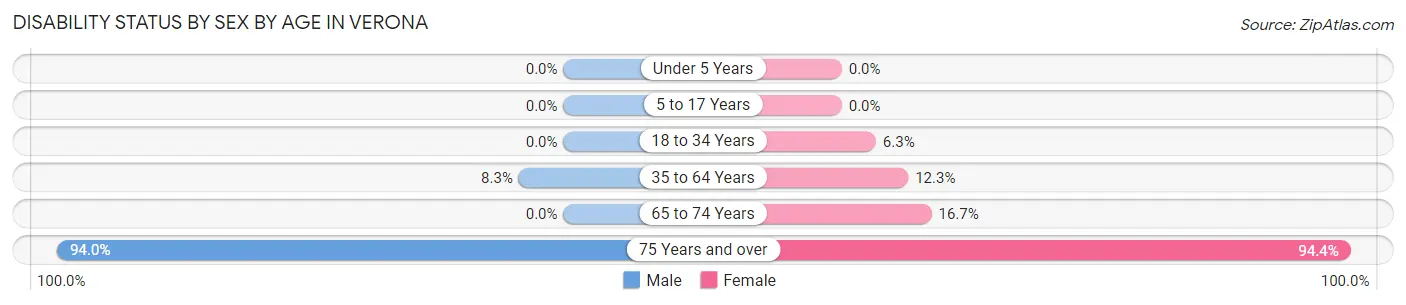
| Age Bracket | Male | Female |
| Under 5 Years | 0 (0.0%) | 0 (0.0%) |
| 5 to 17 Years | 0 (0.0%) | 0 (0.0%) |
| 18 to 34 Years | 0 (0.0%) | 10 (6.3%) |
| 35 to 64 Years | 14 (8.3%) | 28 (12.3%) |
| 65 to 74 Years | 0 (0.0%) | 11 (16.7%) |
| 75 Years and over | 78 (94.0%) | 102 (94.4%) |
Disability Class by Sex by Age in Verona
Disability Class: Hearing Difficulty
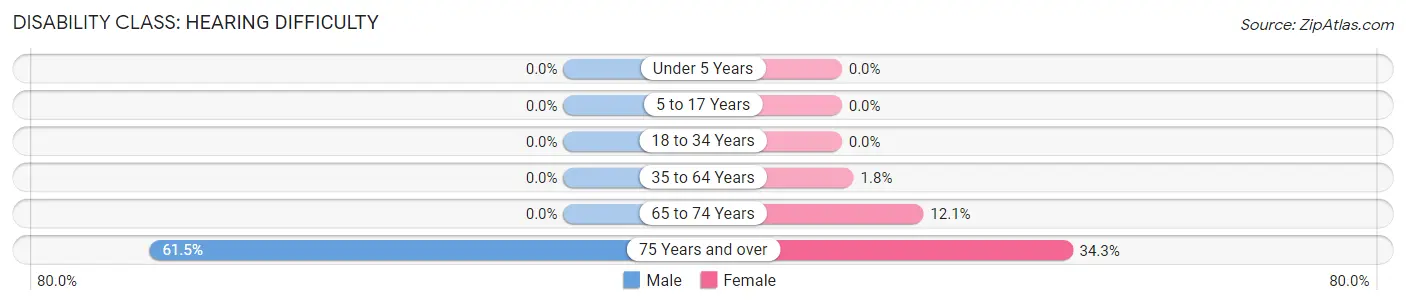
| Age Bracket | Male | Female |
| Under 5 Years | 0 (0.0%) | 0 (0.0%) |
| 5 to 17 Years | 0 (0.0%) | 0 (0.0%) |
| 18 to 34 Years | 0 (0.0%) | 0 (0.0%) |
| 35 to 64 Years | 0 (0.0%) | 4 (1.8%) |
| 65 to 74 Years | 0 (0.0%) | 8 (12.1%) |
| 75 Years and over | 51 (61.5%) | 37 (34.3%) |
Disability Class: Vision Difficulty
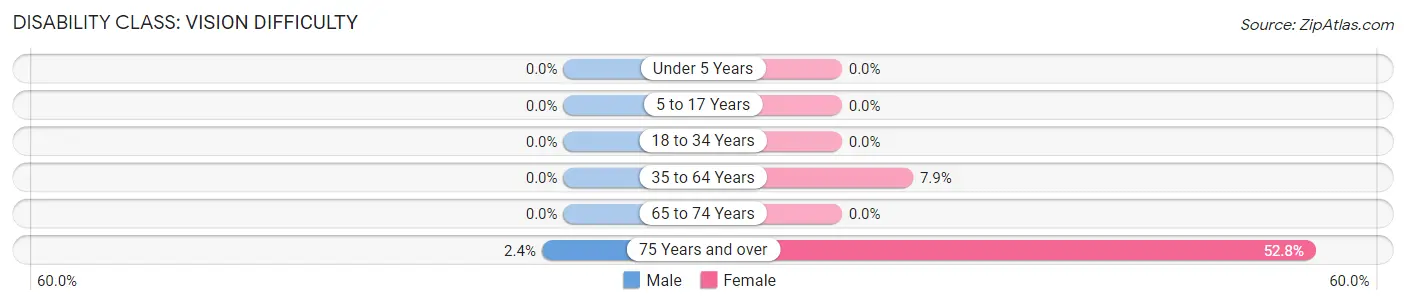
| Age Bracket | Male | Female |
| Under 5 Years | 0 (0.0%) | 0 (0.0%) |
| 5 to 17 Years | 0 (0.0%) | 0 (0.0%) |
| 18 to 34 Years | 0 (0.0%) | 0 (0.0%) |
| 35 to 64 Years | 0 (0.0%) | 18 (7.9%) |
| 65 to 74 Years | 0 (0.0%) | 0 (0.0%) |
| 75 Years and over | 2 (2.4%) | 57 (52.8%) |
Disability Class: Cognitive Difficulty
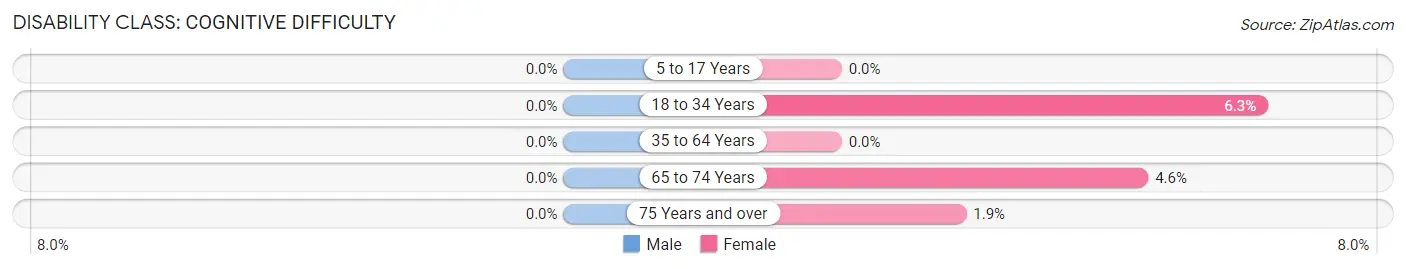
| Age Bracket | Male | Female |
| 5 to 17 Years | 0 (0.0%) | 0 (0.0%) |
| 18 to 34 Years | 0 (0.0%) | 10 (6.3%) |
| 35 to 64 Years | 0 (0.0%) | 0 (0.0%) |
| 65 to 74 Years | 0 (0.0%) | 3 (4.5%) |
| 75 Years and over | 0 (0.0%) | 2 (1.8%) |
Disability Class: Ambulatory Difficulty
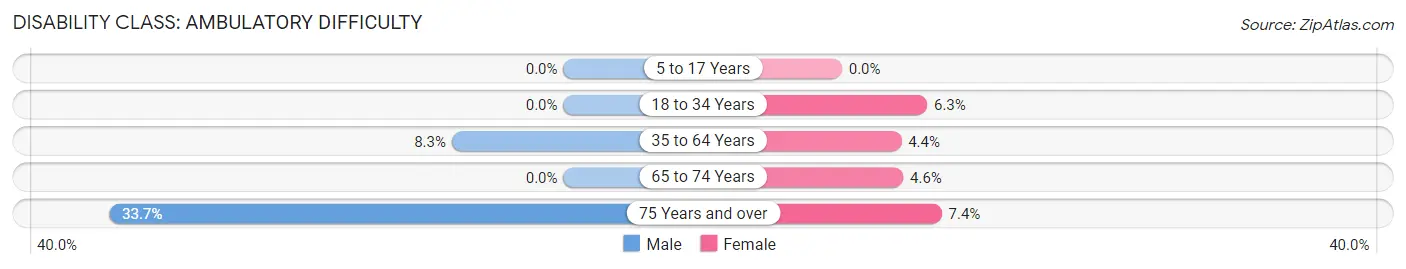
| Age Bracket | Male | Female |
| 5 to 17 Years | 0 (0.0%) | 0 (0.0%) |
| 18 to 34 Years | 0 (0.0%) | 10 (6.3%) |
| 35 to 64 Years | 14 (8.3%) | 10 (4.4%) |
| 65 to 74 Years | 0 (0.0%) | 3 (4.5%) |
| 75 Years and over | 28 (33.7%) | 8 (7.4%) |
Disability Class: Self-Care Difficulty
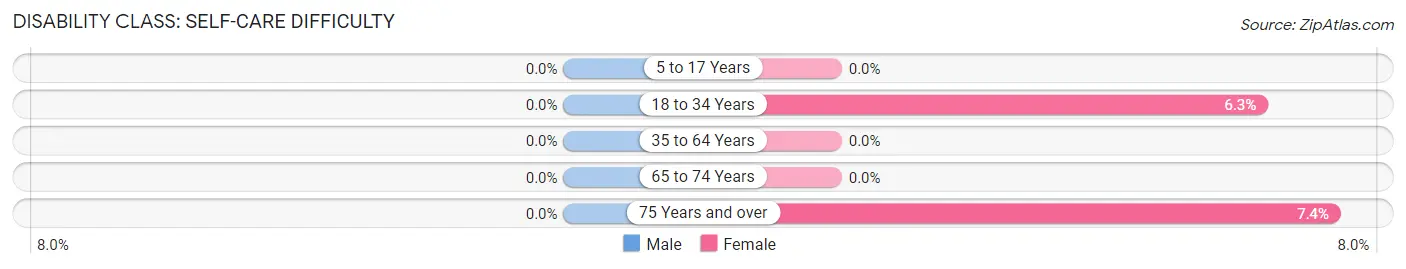
| Age Bracket | Male | Female |
| 5 to 17 Years | 0 (0.0%) | 0 (0.0%) |
| 18 to 34 Years | 0 (0.0%) | 10 (6.3%) |
| 35 to 64 Years | 0 (0.0%) | 0 (0.0%) |
| 65 to 74 Years | 0 (0.0%) | 0 (0.0%) |
| 75 Years and over | 0 (0.0%) | 8 (7.4%) |
Technology Access in Verona
Computing Device Access in Verona
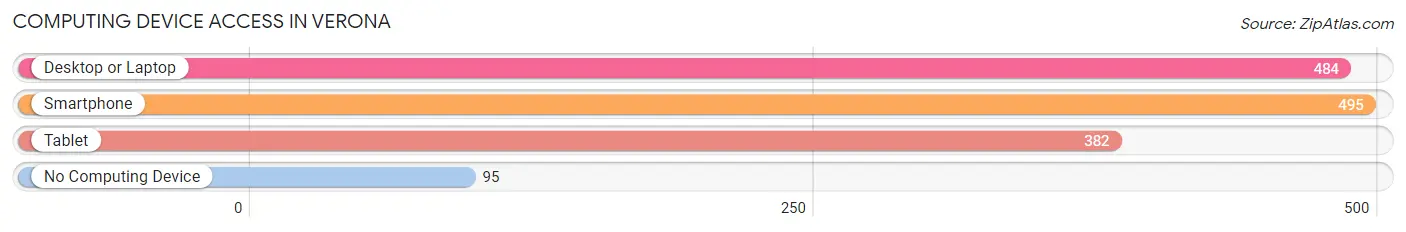
| Device Type | # Households | % Households |
| Desktop or Laptop | 484 | 79.3% |
| Smartphone | 495 | 81.1% |
| Tablet | 382 | 62.6% |
| No Computing Device | 95 | 15.6% |
| Total | 610 | 100.0% |
Internet Access in Verona
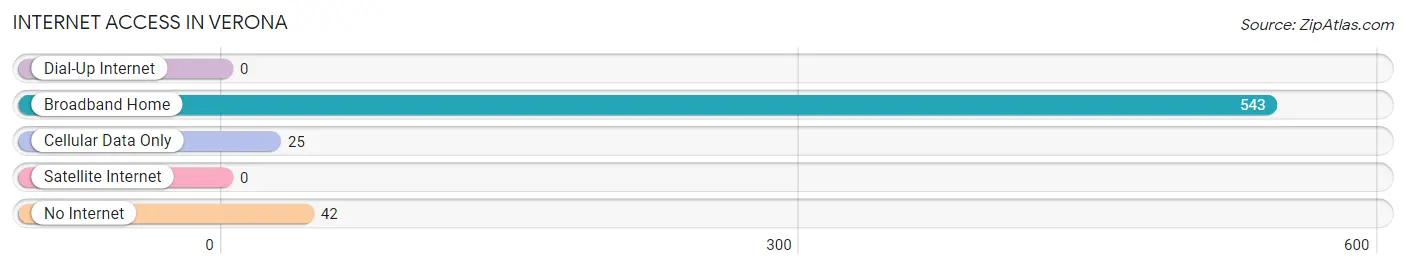
| Internet Type | # Households | % Households |
| Dial-Up Internet | 0 | 0.0% |
| Broadband Home | 543 | 89.0% |
| Cellular Data Only | 25 | 4.1% |
| Satellite Internet | 0 | 0.0% |
| No Internet | 42 | 6.9% |
| Total | 610 | 100.0% |
Verona Summary
Verona, NY is a small town located in Oneida County, New York. It is situated on the eastern shore of Oneida Lake, and is part of the Utica-Rome Metropolitan Statistical Area. The town was founded in 1792 and has a population of approximately 4,500 people.
Geography
Verona is located in the foothills of the Adirondack Mountains, and is bordered by the towns of Augusta, Marshall, and Vernon. The town is situated on the eastern shore of Oneida Lake, and is part of the Mohawk Valley region. The town is approximately 10 miles from the city of Utica, and is accessible by the New York State Thruway.
The terrain of Verona is mostly flat, with some rolling hills. The town is home to several small lakes, including Oneida Lake, which is the largest lake in the area. The town is also home to several parks, including the Verona Beach State Park, which offers camping, swimming, and fishing.
Climate
Verona has a humid continental climate, with cold winters and warm summers. The average annual temperature is around 48°F, with an average high of around 70°F in the summer and an average low of around 25°F in the winter. The town receives an average of around 40 inches of precipitation per year, with most of it falling in the form of snow.
Demographics
As of the 2010 census, Verona had a population of 4,541 people. The racial makeup of the town was 97.2% White, 0.7% African American, 0.3% Native American, 0.3% Asian, 0.1% Pacific Islander, 0.3% from other races, and 1.1% from two or more races. Hispanic or Latino of any race were 1.3% of the population.
The median household income in Verona was $45,938, and the median family income was $51,938. The per capita income for the town was $20,945. About 8.2% of families and 10.2% of the population were below the poverty line, including 14.2% of those under age 18 and 5.2% of those age 65 or over.
Economy
Verona’s economy is largely based on agriculture and tourism. The town is home to several farms, which produce a variety of crops, including corn, soybeans, and hay. The town is also home to several wineries, which produce a variety of wines.
The town is also home to several small businesses, including restaurants, retail stores, and service providers. The town is also home to several manufacturing companies, which produce a variety of products, including furniture, clothing, and electronics.
Verona is also home to several tourist attractions, including the Verona Beach State Park, which offers camping, swimming, and fishing. The town is also home to several historic sites, including the Verona Historical Society Museum, which offers a variety of exhibits and artifacts.
Conclusion
Verona, NY is a small town located in Oneida County, New York. It is situated on the eastern shore of Oneida Lake, and is part of the Utica-Rome Metropolitan Statistical Area. The town was founded in 1792 and has a population of approximately 4,500 people. The town’s economy is largely based on agriculture and tourism, and it is home to several small businesses, farms, wineries, and tourist attractions. The town has a humid continental climate, with cold winters and warm summers. The racial makeup of the town is mostly White, with a small percentage of African American, Native American, Asian, and Pacific Islander residents. The median household income in Verona is $45,938, and the per capita income is $20,945.
Common Questions
What is Per Capita Income in Verona?
Per Capita income in Verona is $39,631.
What is the Median Family Income in Verona?
Median Family Income in Verona is $120,500.
What is the Median Household income in Verona?
Median Household Income in Verona is $71,535.
What is Inequality or Gini Index in Verona?
Inequality or Gini Index in Verona is 0.35.
What is the Total Population of Verona?
Total Population of Verona is 1,363.
What is the Total Male Population of Verona?
Total Male Population of Verona is 740.
What is the Total Female Population of Verona?
Total Female Population of Verona is 623.
What is the Ratio of Males per 100 Females in Verona?
There are 118.78 Males per 100 Females in Verona.
What is the Ratio of Females per 100 Males in Verona?
There are 84.19 Females per 100 Males in Verona.
What is the Median Population Age in Verona?
Median Population Age in Verona is 35.3 Years.
What is the Average Family Size in Verona
Average Family Size in Verona is 2.6 People.
What is the Average Household Size in Verona
Average Household Size in Verona is 2.2 People.
How Large is the Labor Force in Verona?
There are 780 People in the Labor Forcein in Verona.
What is the Percentage of People in the Labor Force in Verona?
67.1% of People are in the Labor Force in Verona.
What is the Unemployment Rate in Verona?
Unemployment Rate in Verona is 23.6%.