Cities with the Highest Percentage of White / Caucasian Population in Connecticut
RELATED REPORTS & OPTIONS
White / Caucasian
Connecticut
Compare Cities
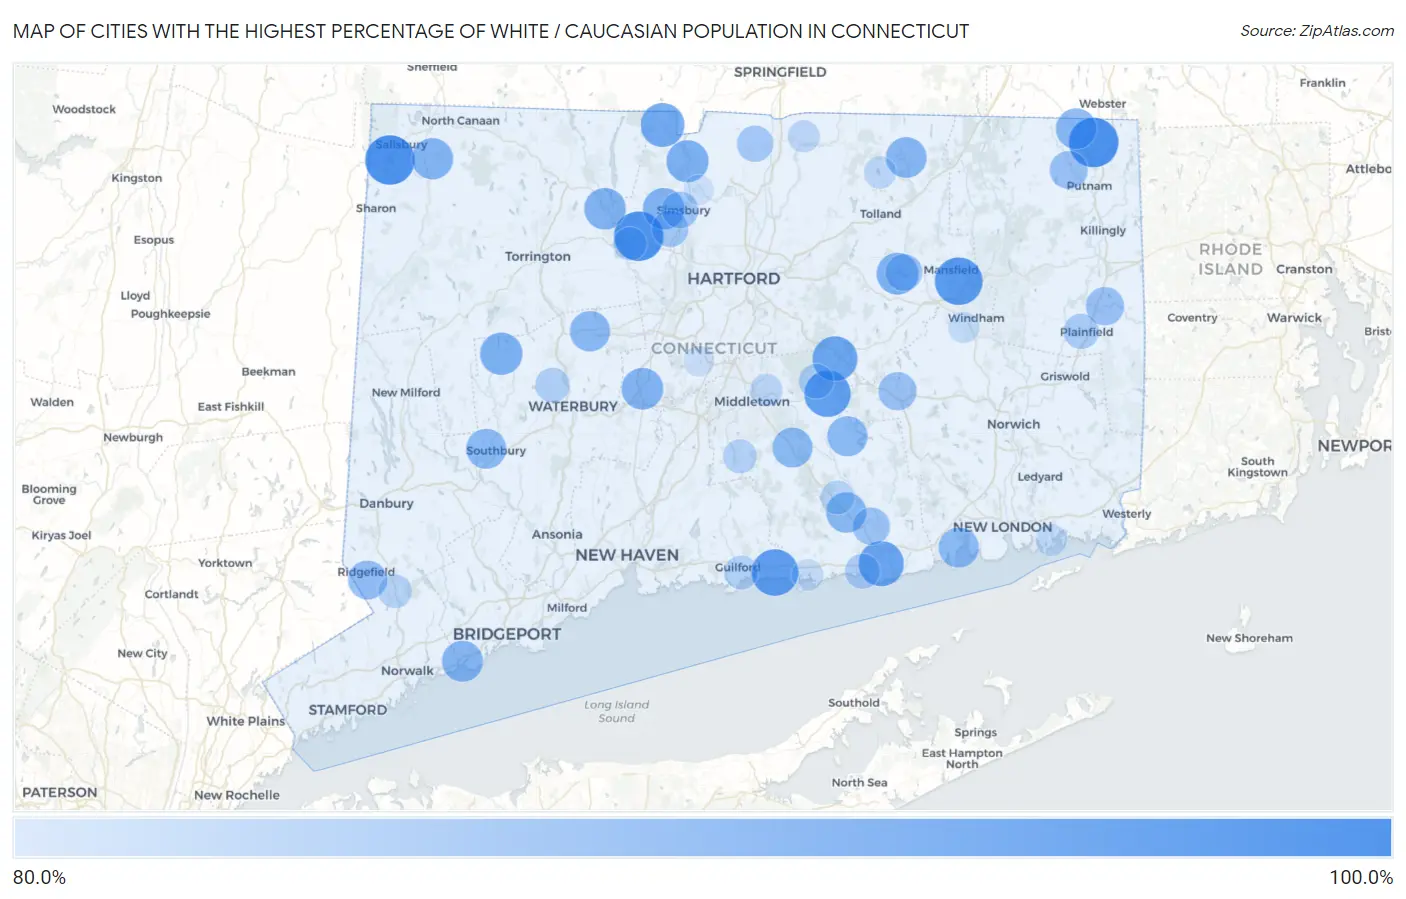
Map of Cities with the Highest Percentage of White / Caucasian Population in Connecticut
0.0%
100.0%
Cities with the Highest Percentage of White / Caucasian Population in Connecticut
| City | White / Caucasian | vs State | vs National | |
| 1. | Canton Valley | 100.0% | 69.8%(+30.2)#1 | 65.9%(+34.1)#16 |
| 2. | North Grosvenor Dale | 100.0% | 69.8%(+30.2)#2 | 65.9%(+34.1)#28 |
| 3. | Lakeville | 100.0% | 69.8%(+30.2)#3 | 65.9%(+34.1)#91 |
| 4. | Lake Bungee | 100.0% | 69.8%(+30.2)#4 | 65.9%(+34.1)#283 |
| 5. | West Mountain | 100.0% | 69.8%(+30.2)#5 | 65.9%(+34.1)#384 |
| 6. | Lake Chaffee | 100.0% | 69.8%(+30.2)#6 | 65.9%(+34.1)#633 |
| 7. | Quasset Lake | 100.0% | 69.8%(+30.2)#7 | 65.9%(+34.1)#830 |
| 8. | Topstone | 100.0% | 69.8%(+30.2)#8 | 65.9%(+34.1)#1,170 |
| 9. | Candlewood Knolls | 100.0% | 69.8%(+30.2)#9 | 65.9%(+34.1)#1,221 |
| 10. | Candlewood Lake Club | 100.0% | 69.8%(+30.2)#10 | 65.9%(+34.1)#1,408 |
| 11. | Chimney Point | 100.0% | 69.8%(+30.2)#11 | 65.9%(+34.1)#1,801 |
| 12. | Dodgingtown | 100.0% | 69.8%(+30.2)#12 | 65.9%(+34.1)#1,983 |
| 13. | Branchville | 100.0% | 69.8%(+30.2)#13 | 65.9%(+34.1)#2,128 |
| 14. | West Cornwall | 100.0% | 69.8%(+30.2)#14 | 65.9%(+34.1)#2,540 |
| 15. | Fenwick Borough | 100.0% | 69.8%(+30.2)#15 | 65.9%(+34.1)#2,784 |
| 16. | Sherman | 100.0% | 69.8%(+30.2)#16 | 65.9%(+34.1)#2,922 |
| 17. | Dayville | 99.7% | 69.8%(+29.8)#17 | 65.9%(+33.8)#3,646 |
| 18. | Hawleyville | 99.3% | 69.8%(+29.5)#18 | 65.9%(+33.5)#3,854 |
| 19. | Mansfield Center | 98.7% | 69.8%(+28.8)#19 | 65.9%(+32.8)#4,470 |
| 20. | Bantam Borough | 98.3% | 69.8%(+28.4)#20 | 65.9%(+32.4)#4,866 |
| 21. | Madison Center | 98.0% | 69.8%(+28.2)#21 | 65.9%(+32.2)#5,113 |
| 22. | Bogus Hill | 98.0% | 69.8%(+28.1)#22 | 65.9%(+32.1)#5,175 |
| 23. | Mill Plain | 97.9% | 69.8%(+28.1)#23 | 65.9%(+32.1)#5,237 |
| 24. | Mamanasco Lake | 97.9% | 69.8%(+28.0)#24 | 65.9%(+32.0)#5,294 |
| 25. | East Hampton | 97.7% | 69.8%(+27.9)#25 | 65.9%(+31.8)#5,457 |
| 26. | Groton Long Point Borough | 97.3% | 69.8%(+27.5)#26 | 65.9%(+31.4)#5,973 |
| 27. | Old Saybrook Center | 96.9% | 69.8%(+27.1)#27 | 65.9%(+31.0)#6,402 |
| 28. | Terramuggus | 96.8% | 69.8%(+26.9)#28 | 65.9%(+30.9)#6,567 |
| 29. | Pleasant Valley | 96.4% | 69.8%(+26.6)#29 | 65.9%(+30.5)#7,029 |
| 30. | North Granby | 96.1% | 69.8%(+26.2)#30 | 65.9%(+30.2)#7,430 |
| 31. | Indian Field | 96.0% | 69.8%(+26.2)#31 | 65.9%(+30.1)#7,501 |
| 32. | Mechanicsville | 95.4% | 69.8%(+25.5)#32 | 65.9%(+29.5)#8,283 |
| 33. | Stepney | 95.2% | 69.8%(+25.3)#33 | 65.9%(+29.3)#8,546 |
| 34. | Bethlehem Village | 95.0% | 69.8%(+25.1)#34 | 65.9%(+29.1)#8,775 |
| 35. | Salmon Brook | 94.8% | 69.8%(+25.0)#35 | 65.9%(+28.9)#8,960 |
| 36. | Coventry Lake | 94.7% | 69.8%(+24.8)#36 | 65.9%(+28.8)#9,167 |
| 37. | Candlewood Isle | 94.6% | 69.8%(+24.8)#37 | 65.9%(+28.8)#9,181 |
| 38. | Plantsville | 94.5% | 69.8%(+24.6)#38 | 65.9%(+28.6)#9,373 |
| 39. | West Simsbury | 94.5% | 69.8%(+24.6)#39 | 65.9%(+28.6)#9,401 |
| 40. | New Hartford Center | 94.4% | 69.8%(+24.6)#40 | 65.9%(+28.5)#9,443 |
| 41. | Falls Village | 94.3% | 69.8%(+24.5)#41 | 65.9%(+28.4)#9,614 |
| 42. | Lakeside Woods | 94.3% | 69.8%(+24.4)#42 | 65.9%(+28.4)#9,631 |
| 43. | Witches Woods | 94.2% | 69.8%(+24.4)#43 | 65.9%(+28.3)#9,727 |
| 44. | Woodmont Borough | 94.1% | 69.8%(+24.2)#44 | 65.9%(+28.2)#9,905 |
| 45. | Southport | 94.1% | 69.8%(+24.2)#45 | 65.9%(+28.2)#9,914 |
| 46. | Quinebaug | 93.9% | 69.8%(+24.0)#46 | 65.9%(+28.0)#10,132 |
| 47. | Stafford Springs | 93.9% | 69.8%(+24.0)#47 | 65.9%(+28.0)#10,135 |
| 48. | Terryville | 93.6% | 69.8%(+23.7)#48 | 65.9%(+27.7)#10,466 |
| 49. | Deep River Center | 93.6% | 69.8%(+23.7)#49 | 65.9%(+27.7)#10,488 |
| 50. | Niantic | 93.5% | 69.8%(+23.6)#50 | 65.9%(+27.6)#10,612 |
| 51. | Heritage Village | 93.4% | 69.8%(+23.6)#51 | 65.9%(+27.5)#10,672 |
| 52. | Moodus | 93.4% | 69.8%(+23.6)#52 | 65.9%(+27.5)#10,676 |
| 53. | Higganum | 93.4% | 69.8%(+23.5)#53 | 65.9%(+27.5)#10,686 |
| 54. | Lordship | 93.2% | 69.8%(+23.4)#54 | 65.9%(+27.4)#10,831 |
| 55. | Ridgefield | 92.5% | 69.8%(+22.6)#55 | 65.9%(+26.6)#11,670 |
| 56. | Brookfield Center | 92.4% | 69.8%(+22.5)#56 | 65.9%(+26.5)#11,818 |
| 57. | Weston | 92.3% | 69.8%(+22.5)#57 | 65.9%(+26.5)#11,824 |
| 58. | Colchester | 92.1% | 69.8%(+22.3)#58 | 65.9%(+26.3)#12,062 |
| 59. | Moosup | 92.1% | 69.8%(+22.3)#59 | 65.9%(+26.2)#12,101 |
| 60. | South Woodstock | 92.0% | 69.8%(+22.1)#60 | 65.9%(+26.1)#12,270 |
| 61. | Redding Center | 91.9% | 69.8%(+22.0)#61 | 65.9%(+26.0)#12,358 |
| 62. | Oronoque | 91.7% | 69.8%(+21.8)#62 | 65.9%(+25.8)#12,526 |
| 63. | Essex Village | 91.6% | 69.8%(+21.8)#63 | 65.9%(+25.7)#12,583 |
| 64. | Stonington Borough | 91.4% | 69.8%(+21.6)#64 | 65.9%(+25.5)#12,766 |
| 65. | South Coventry | 91.2% | 69.8%(+21.4)#65 | 65.9%(+25.3)#12,962 |
| 66. | Weatogue | 91.1% | 69.8%(+21.2)#66 | 65.9%(+25.2)#13,080 |
| 67. | Simsbury Center | 91.0% | 69.8%(+21.1)#67 | 65.9%(+25.1)#13,206 |
| 68. | Jewett City Borough | 91.0% | 69.8%(+21.1)#68 | 65.9%(+25.1)#13,208 |
| 69. | Suffield Depot | 90.8% | 69.8%(+20.9)#69 | 65.9%(+24.9)#13,399 |
| 70. | Northford | 90.6% | 69.8%(+20.7)#70 | 65.9%(+24.7)#13,583 |
| 71. | Coleytown | 90.2% | 69.8%(+20.4)#71 | 65.9%(+24.4)#13,900 |
| 72. | Candlewood Shores | 90.2% | 69.8%(+20.3)#72 | 65.9%(+24.3)#13,981 |
| 73. | Plainfield Village | 90.1% | 69.8%(+20.2)#73 | 65.9%(+24.2)#14,055 |
| 74. | Fairfield University | 89.9% | 69.8%(+20.1)#74 | 65.9%(+24.1)#14,189 |
| 75. | Saybrook Manor | 89.9% | 69.8%(+20.1)#75 | 65.9%(+24.0)#14,194 |
| 76. | Lake Pocotopaug | 89.9% | 69.8%(+20.0)#76 | 65.9%(+24.0)#14,228 |
| 77. | Oakville | 89.6% | 69.8%(+19.8)#77 | 65.9%(+23.7)#14,418 |
| 78. | Sacred Heart University | 89.3% | 69.8%(+19.4)#78 | 65.9%(+23.4)#14,675 |
| 79. | Guilford Center | 89.2% | 69.8%(+19.4)#79 | 65.9%(+23.3)#14,714 |
| 80. | Chester Center | 89.2% | 69.8%(+19.3)#80 | 65.9%(+23.3)#14,733 |
| 81. | Durham | 89.1% | 69.8%(+19.3)#81 | 65.9%(+23.3)#14,778 |
| 82. | Georgetown | 88.9% | 69.8%(+19.1)#82 | 65.9%(+23.1)#14,909 |
| 83. | Collinsville | 88.9% | 69.8%(+19.0)#83 | 65.9%(+23.0)#14,968 |
| 84. | Old Hill | 88.6% | 69.8%(+18.7)#84 | 65.9%(+22.7)#15,188 |
| 85. | Riverton | 88.6% | 69.8%(+18.7)#85 | 65.9%(+22.7)#15,214 |
| 86. | Portland | 88.3% | 69.8%(+18.5)#86 | 65.9%(+22.4)#15,381 |
| 87. | Crystal Lake | 88.2% | 69.8%(+18.3)#87 | 65.9%(+22.3)#15,495 |
| 88. | Hazardville | 88.0% | 69.8%(+18.2)#88 | 65.9%(+22.2)#15,585 |
| 89. | Tokeneke | 87.9% | 69.8%(+18.0)#89 | 65.9%(+22.0)#15,679 |
| 90. | Knollcrest | 87.7% | 69.8%(+17.9)#90 | 65.9%(+21.9)#15,791 |
| 91. | Noank | 87.7% | 69.8%(+17.9)#91 | 65.9%(+21.8)#15,822 |
| 92. | Clinton | 87.7% | 69.8%(+17.8)#92 | 65.9%(+21.8)#15,845 |
| 93. | Murray | 87.6% | 69.8%(+17.7)#93 | 65.9%(+21.7)#15,939 |
| 94. | South Windham | 87.5% | 69.8%(+17.6)#94 | 65.9%(+21.6)#16,001 |
| 95. | Kensington | 87.1% | 69.8%(+17.2)#95 | 65.9%(+21.2)#16,287 |
| 96. | Newtown Borough | 87.0% | 69.8%(+17.2)#96 | 65.9%(+21.2)#16,311 |
| 97. | Taylor Corners | 86.9% | 69.8%(+17.1)#97 | 65.9%(+21.0)#16,399 |
| 98. | Gaylordsville | 86.8% | 69.8%(+17.0)#98 | 65.9%(+20.9)#16,475 |
| 99. | Lakes West | 86.7% | 69.8%(+16.9)#99 | 65.9%(+20.9)#16,511 |
| 100. | Tariffville | 86.7% | 69.8%(+16.9)#100 | 65.9%(+20.9)#16,512 |
Common Questions
What are the Top 10 Cities with the Highest Percentage of White / Caucasian Population in Connecticut?
Top 10 Cities with the Highest Percentage of White / Caucasian Population in Connecticut are:
#1
100.0%
#2
100.0%
#3
100.0%
#4
98.7%
#5
98.0%
#6
97.7%
#7
96.9%
#8
96.8%
#9
96.1%
#10
95.0%
What city has the Highest Percentage of White / Caucasian Population in Connecticut?
Canton Valley has the Highest Percentage of White / Caucasian Population in Connecticut with 100.0%.
What is the Percentage of White / Caucasian Population in the State of Connecticut?
Percentage of White / Caucasian Population in Connecticut is 69.8%.
What is the Percentage of White / Caucasian Population in the United States?
Percentage of White / Caucasian Population in the United States is 65.9%.