Cities with the Highest Percentage of Scottish Population in Connecticut
RELATED REPORTS & OPTIONS
Scottish
Connecticut
Compare Cities
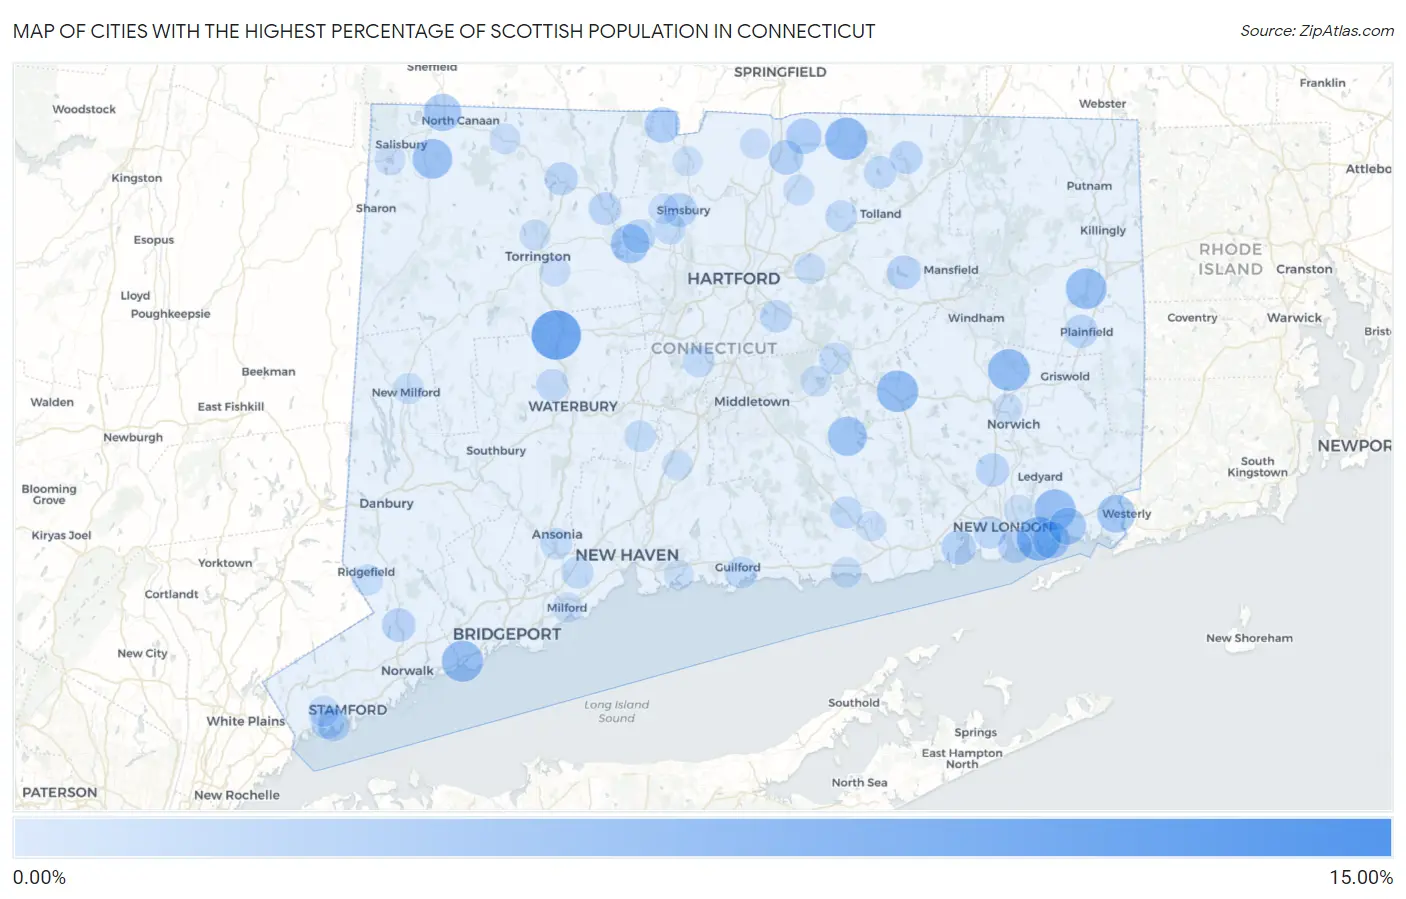
Map of Cities with the Highest Percentage of Scottish Population in Connecticut
0.00%
15.00%
Cities with the Highest Percentage of Scottish Population in Connecticut
| City | Scottish | vs State | vs National | |
| 1. | Cornwall Bridge | 13.54% | 1.49%(+12.0)#1 | 1.58%(+12.0)#318 |
| 2. | Plattsville | 12.90% | 1.49%(+11.4)#2 | 1.58%(+11.3)#357 |
| 3. | Redding Center | 11.24% | 1.49%(+9.75)#3 | 1.58%(+9.66)#483 |
| 4. | Thomaston | 10.06% | 1.49%(+8.57)#4 | 1.58%(+8.49)#598 |
| 5. | Lakeside Woods | 8.46% | 1.49%(+6.97)#5 | 1.58%(+6.88)#819 |
| 6. | Dodgingtown | 7.87% | 1.49%(+6.38)#6 | 1.58%(+6.29)#942 |
| 7. | Litchfield Borough | 7.75% | 1.49%(+6.26)#7 | 1.58%(+6.17)#980 |
| 8. | Poquonock Bridge | 7.55% | 1.49%(+6.07)#8 | 1.58%(+5.98)#1,017 |
| 9. | Lakes West | 7.07% | 1.49%(+5.58)#9 | 1.58%(+5.49)#1,144 |
| 10. | Pleasant Valley | 6.84% | 1.49%(+5.35)#10 | 1.58%(+5.26)#1,207 |
| 11. | Somers | 6.81% | 1.49%(+5.33)#11 | 1.58%(+5.24)#1,211 |
| 12. | Baltic | 6.61% | 1.49%(+5.12)#12 | 1.58%(+5.03)#1,285 |
| 13. | Colchester | 6.49% | 1.49%(+5.00)#13 | 1.58%(+4.92)#1,329 |
| 14. | Old Mystic | 6.41% | 1.49%(+4.92)#14 | 1.58%(+4.83)#1,363 |
| 15. | Southport | 6.40% | 1.49%(+4.91)#15 | 1.58%(+4.83)#1,369 |
| 16. | Wauregan | 6.16% | 1.49%(+4.67)#16 | 1.58%(+4.58)#1,478 |
| 17. | West Mountain | 6.15% | 1.49%(+4.66)#17 | 1.58%(+4.57)#1,484 |
| 18. | Stonington Borough | 6.05% | 1.49%(+4.56)#18 | 1.58%(+4.48)#1,535 |
| 19. | Groton Long Point Borough | 6.00% | 1.49%(+4.51)#19 | 1.58%(+4.42)#1,567 |
| 20. | Falls Village | 5.71% | 1.49%(+4.22)#20 | 1.58%(+4.13)#1,713 |
| 21. | Moodus | 5.40% | 1.49%(+3.91)#21 | 1.58%(+3.83)#1,907 |
| 22. | Collinsville | 5.20% | 1.49%(+3.71)#22 | 1.58%(+3.62)#2,049 |
| 23. | Bridgewater | 4.93% | 1.49%(+3.44)#23 | 1.58%(+3.35)#2,271 |
| 24. | Pawcatuck | 4.87% | 1.49%(+3.38)#24 | 1.58%(+3.29)#2,329 |
| 25. | Canaan | 4.66% | 1.49%(+3.17)#25 | 1.58%(+3.08)#2,530 |
| 26. | Oronoque | 4.55% | 1.49%(+3.06)#26 | 1.58%(+2.98)#2,648 |
| 27. | Noank | 4.51% | 1.49%(+3.02)#27 | 1.58%(+2.93)#2,701 |
| 28. | Mystic | 4.51% | 1.49%(+3.02)#28 | 1.58%(+2.93)#2,704 |
| 29. | North Granby | 3.98% | 1.49%(+2.50)#29 | 1.58%(+2.41)#3,343 |
| 30. | Hazardville | 3.92% | 1.49%(+2.43)#30 | 1.58%(+2.34)#3,453 |
| 31. | Candlewood Shores | 3.91% | 1.49%(+2.43)#31 | 1.58%(+2.34)#3,464 |
| 32. | Darien Downtown | 3.82% | 1.49%(+2.34)#32 | 1.58%(+2.25)#3,612 |
| 33. | New Canaan | 3.82% | 1.49%(+2.33)#33 | 1.58%(+2.24)#3,622 |
| 34. | Gaylordsville | 3.53% | 1.49%(+2.04)#34 | 1.58%(+1.96)#4,104 |
| 35. | Southwood Acres | 3.47% | 1.49%(+1.98)#35 | 1.58%(+1.89)#4,218 |
| 36. | Niantic | 3.43% | 1.49%(+1.94)#36 | 1.58%(+1.86)#4,294 |
| 37. | Tokeneke | 3.38% | 1.49%(+1.89)#37 | 1.58%(+1.80)#4,408 |
| 38. | Rock Ridge | 3.35% | 1.49%(+1.86)#38 | 1.58%(+1.77)#4,469 |
| 39. | Simsbury Center | 3.24% | 1.49%(+1.75)#39 | 1.58%(+1.66)#4,684 |
| 40. | Groton | 3.24% | 1.49%(+1.75)#40 | 1.58%(+1.66)#4,698 |
| 41. | South Coventry | 3.20% | 1.49%(+1.71)#41 | 1.58%(+1.63)#4,779 |
| 42. | Wilton Center | 3.11% | 1.49%(+1.62)#42 | 1.58%(+1.53)#5,026 |
| 43. | Canton Valley | 3.03% | 1.49%(+1.54)#43 | 1.58%(+1.46)#5,206 |
| 44. | Riverside | 3.01% | 1.49%(+1.53)#44 | 1.58%(+1.44)#5,258 |
| 45. | Oxoboxo River | 2.96% | 1.49%(+1.48)#45 | 1.58%(+1.39)#5,385 |
| 46. | Plainfield Village | 2.95% | 1.49%(+1.46)#46 | 1.58%(+1.37)#5,429 |
| 47. | Candlewood Orchards | 2.90% | 1.49%(+1.41)#47 | 1.58%(+1.32)#5,540 |
| 48. | Winsted | 2.89% | 1.49%(+1.40)#48 | 1.58%(+1.32)#5,562 |
| 49. | Bigelow Corners | 2.88% | 1.49%(+1.40)#49 | 1.58%(+1.31)#5,582 |
| 50. | Route 7 Gateway | 2.87% | 1.49%(+1.39)#50 | 1.58%(+1.30)#5,615 |
| 51. | Noroton Heights | 2.86% | 1.49%(+1.37)#51 | 1.58%(+1.29)#5,645 |
| 52. | New Hartford Center | 2.79% | 1.49%(+1.30)#52 | 1.58%(+1.21)#5,879 |
| 53. | Stafford Springs | 2.72% | 1.49%(+1.23)#53 | 1.58%(+1.14)#6,090 |
| 54. | Old Greenwich | 2.66% | 1.49%(+1.18)#54 | 1.58%(+1.09)#6,285 |
| 55. | Crystal Lake | 2.64% | 1.49%(+1.16)#55 | 1.58%(+1.07)#6,340 |
| 56. | Glastonbury Center | 2.60% | 1.49%(+1.11)#56 | 1.58%(+1.03)#6,496 |
| 57. | Waterford | 2.59% | 1.49%(+1.11)#57 | 1.58%(+1.02)#6,517 |
| 58. | Westport | 2.59% | 1.49%(+1.10)#58 | 1.58%(+1.01)#6,542 |
| 59. | Mamanasco Lake | 2.55% | 1.49%(+1.07)#59 | 1.58%(+0.977)#6,668 |
| 60. | Saugatuck | 2.53% | 1.49%(+1.05)#60 | 1.58%(+0.958)#6,746 |
| 61. | Oakville | 2.49% | 1.49%(+1.00)#61 | 1.58%(+0.917)#6,892 |
| 62. | Poplar Plains | 2.45% | 1.49%(+0.958)#62 | 1.58%(+0.870)#7,070 |
| 63. | Deep River Center | 2.44% | 1.49%(+0.957)#63 | 1.58%(+0.869)#7,076 |
| 64. | Terramuggus | 2.44% | 1.49%(+0.954)#64 | 1.58%(+0.866)#7,086 |
| 65. | Orange | 2.42% | 1.49%(+0.936)#65 | 1.58%(+0.849)#7,153 |
| 66. | Murray | 2.40% | 1.49%(+0.917)#66 | 1.58%(+0.829)#7,254 |
| 67. | Kensington | 2.37% | 1.49%(+0.882)#67 | 1.58%(+0.794)#7,397 |
| 68. | Rockville | 2.34% | 1.49%(+0.857)#68 | 1.58%(+0.769)#7,491 |
| 69. | Guilford Center | 2.32% | 1.49%(+0.834)#69 | 1.58%(+0.746)#7,598 |
| 70. | Tashua | 2.32% | 1.49%(+0.833)#70 | 1.58%(+0.745)#7,602 |
| 71. | Mechanicsville | 2.21% | 1.49%(+0.726)#71 | 1.58%(+0.638)#8,026 |
| 72. | Weatogue | 2.21% | 1.49%(+0.721)#72 | 1.58%(+0.633)#8,053 |
| 73. | Bantam Borough | 2.15% | 1.49%(+0.664)#73 | 1.58%(+0.576)#8,306 |
| 74. | Derby | 2.13% | 1.49%(+0.646)#74 | 1.58%(+0.558)#8,397 |
| 75. | Cheshire Village | 2.11% | 1.49%(+0.621)#75 | 1.58%(+0.533)#8,511 |
| 76. | Lordship | 2.05% | 1.49%(+0.564)#76 | 1.58%(+0.476)#8,770 |
| 77. | New Milford | 2.00% | 1.49%(+0.514)#77 | 1.58%(+0.426)#9,019 |
| 78. | Torrington | 1.99% | 1.49%(+0.500)#78 | 1.58%(+0.412)#9,087 |
| 79. | Cos Cob | 1.97% | 1.49%(+0.486)#79 | 1.58%(+0.399)#9,155 |
| 80. | Ridgefield | 1.97% | 1.49%(+0.485)#80 | 1.58%(+0.397)#9,163 |
| 81. | Lake Pocotopaug | 1.95% | 1.49%(+0.466)#81 | 1.58%(+0.378)#9,268 |
| 82. | Stepney | 1.88% | 1.49%(+0.390)#82 | 1.58%(+0.302)#9,634 |
| 83. | Broad Brook | 1.87% | 1.49%(+0.384)#83 | 1.58%(+0.296)#9,666 |
| 84. | Manchester | 1.86% | 1.49%(+0.374)#84 | 1.58%(+0.286)#9,742 |
| 85. | Westbrook Center | 1.86% | 1.49%(+0.368)#85 | 1.58%(+0.280)#9,771 |
| 86. | Norfolk | 1.84% | 1.49%(+0.353)#86 | 1.58%(+0.265)#9,848 |
| 87. | Wallingford Center | 1.81% | 1.49%(+0.321)#87 | 1.58%(+0.233)#10,021 |
| 88. | Lakeville | 1.81% | 1.49%(+0.318)#88 | 1.58%(+0.230)#10,045 |
| 89. | Suffield Depot | 1.80% | 1.49%(+0.315)#89 | 1.58%(+0.227)#10,062 |
| 90. | Indian Field | 1.77% | 1.49%(+0.286)#90 | 1.58%(+0.198)#10,227 |
| 91. | Northwest Harwinton | 1.72% | 1.49%(+0.230)#91 | 1.58%(+0.142)#10,518 |
| 92. | Milford City Balance | 1.71% | 1.49%(+0.221)#92 | 1.58%(+0.134)#10,583 |
| 93. | Norwich | 1.69% | 1.49%(+0.200)#93 | 1.58%(+0.112)#10,711 |
| 94. | West Simsbury | 1.68% | 1.49%(+0.193)#94 | 1.58%(+0.105)#10,745 |
| 95. | Essex Village | 1.65% | 1.49%(+0.164)#95 | 1.58%(+0.076)#10,908 |
| 96. | Conning Towers Nautilus Park | 1.61% | 1.49%(+0.121)#96 | 1.58%(+0.033)#11,189 |
| 97. | Greens Farms | 1.57% | 1.49%(+0.086)#97 | 1.58%(-0.002)#11,383 |
| 98. | Staples | 1.57% | 1.49%(+0.082)#98 | 1.58%(-0.006)#11,411 |
| 99. | Branford Center | 1.56% | 1.49%(+0.076)#99 | 1.58%(-0.012)#11,427 |
| 100. | Salmon Brook | 1.56% | 1.49%(+0.069)#100 | 1.58%(-0.019)#11,479 |
Common Questions
What are the Top 10 Cities with the Highest Percentage of Scottish Population in Connecticut?
Top 10 Cities with the Highest Percentage of Scottish Population in Connecticut are:
#1
10.06%
#2
7.55%
#3
6.81%
#4
6.61%
#5
6.49%
#6
6.41%
#7
6.40%
#8
6.16%
#9
5.71%
#10
5.40%
What city has the Highest Percentage of Scottish Population in Connecticut?
Thomaston has the Highest Percentage of Scottish Population in Connecticut with 10.06%.
What is the Percentage of Scottish Population in the State of Connecticut?
Percentage of Scottish Population in Connecticut is 1.49%.
What is the Percentage of Scottish Population in the United States?
Percentage of Scottish Population in the United States is 1.58%.