Cities with the Highest Percentage of German Population in Indiana
RELATED REPORTS & OPTIONS
German
Indiana
Compare Cities
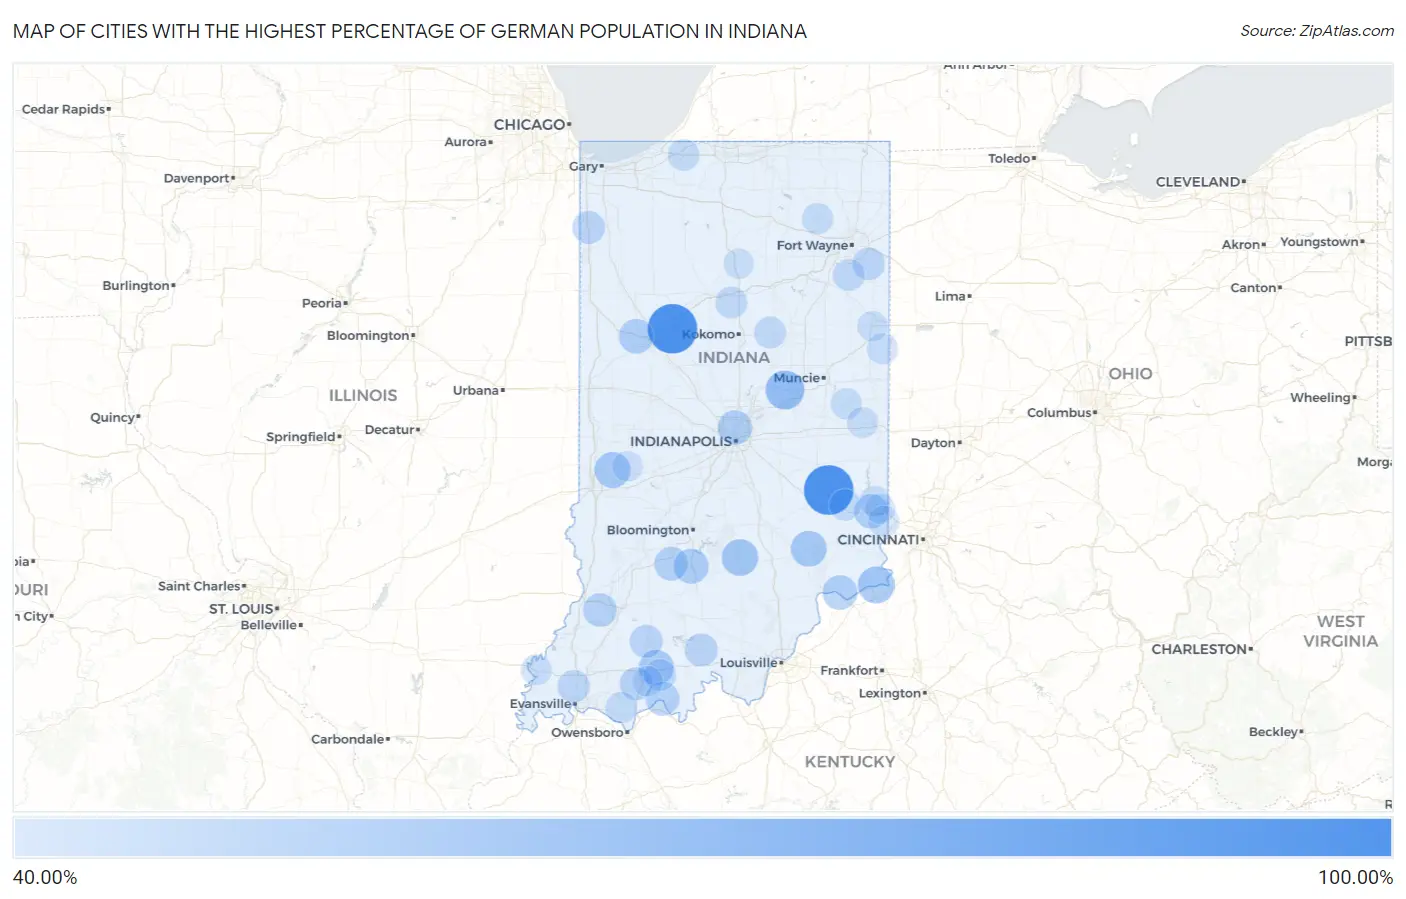
Map of Cities with the Highest Percentage of German Population in Indiana
0.00%
100.00%
Cities with the Highest Percentage of German Population in Indiana
| City | German | vs State | vs National | |
| 1. | St. Anthony | 100.00% | 19.85%(+80.2)#1 | 12.66%(+87.3)#1 |
| 2. | Boxley | 100.00% | 19.85%(+80.2)#2 | 12.66%(+87.3)#2 |
| 3. | Burrows | 100.00% | 19.85%(+80.2)#3 | 12.66%(+87.3)#4 |
| 4. | Colburn | 100.00% | 19.85%(+80.2)#4 | 12.66%(+87.3)#15 |
| 5. | Buckskin | 100.00% | 19.85%(+80.2)#5 | 12.66%(+87.3)#17 |
| 6. | Spartanburg | 100.00% | 19.85%(+80.2)#6 | 12.66%(+87.3)#24 |
| 7. | Peppertown | 100.00% | 19.85%(+80.2)#7 | 12.66%(+87.3)#28 |
| 8. | Lawrenceport | 100.00% | 19.85%(+80.2)#8 | 12.66%(+87.3)#43 |
| 9. | Hamburg | 100.00% | 19.85%(+80.2)#9 | 12.66%(+87.3)#48 |
| 10. | Leopold | 100.00% | 19.85%(+80.2)#10 | 12.66%(+87.3)#49 |
| 11. | Clarksburg | 100.00% | 19.85%(+80.2)#11 | 12.66%(+87.3)#55 |
| 12. | Stillwell | 100.00% | 19.85%(+80.2)#12 | 12.66%(+87.3)#67 |
| 13. | Lamb | 82.67% | 19.85%(+62.8)#13 | 12.66%(+70.0)#138 |
| 14. | Wellsboro | 82.19% | 19.85%(+62.3)#14 | 12.66%(+69.5)#143 |
| 15. | Preble | 81.54% | 19.85%(+61.7)#15 | 12.66%(+68.9)#149 |
| 16. | Stroh | 81.30% | 19.85%(+61.5)#16 | 12.66%(+68.6)#150 |
| 17. | Mariah Hill | 80.49% | 19.85%(+60.6)#17 | 12.66%(+67.8)#158 |
| 18. | Celestine | 78.06% | 19.85%(+58.2)#18 | 12.66%(+65.4)#177 |
| 19. | Bretzville | 70.23% | 19.85%(+50.4)#19 | 12.66%(+57.6)#268 |
| 20. | River Forest | 66.67% | 19.85%(+46.8)#20 | 12.66%(+54.0)#357 |
| 21. | Azalia | 66.43% | 19.85%(+46.6)#21 | 12.66%(+53.8)#366 |
| 22. | Boone Grove | 65.52% | 19.85%(+45.7)#22 | 12.66%(+52.9)#397 |
| 23. | Pleasant Lake | 63.83% | 19.85%(+44.0)#23 | 12.66%(+51.2)#449 |
| 24. | Solsberry | 62.16% | 19.85%(+42.3)#24 | 12.66%(+49.5)#517 |
| 25. | Sardinia | 61.00% | 19.85%(+41.2)#25 | 12.66%(+48.3)#576 |
| 26. | Florence | 60.49% | 19.85%(+40.6)#26 | 12.66%(+47.8)#592 |
| 27. | Freetown | 60.08% | 19.85%(+40.2)#27 | 12.66%(+47.4)#606 |
| 28. | Cates | 60.00% | 19.85%(+40.2)#28 | 12.66%(+47.3)#609 |
| 29. | Fontanet | 58.11% | 19.85%(+38.3)#29 | 12.66%(+45.4)#699 |
| 30. | Butlerville | 57.78% | 19.85%(+37.9)#30 | 12.66%(+45.1)#712 |
| 31. | Benton | 56.53% | 19.85%(+36.7)#31 | 12.66%(+43.9)#769 |
| 32. | Needham | 56.25% | 19.85%(+36.4)#32 | 12.66%(+43.6)#787 |
| 33. | Ferdinand | 55.77% | 19.85%(+35.9)#33 | 12.66%(+43.1)#816 |
| 34. | Avoca | 55.42% | 19.85%(+35.6)#34 | 12.66%(+42.8)#845 |
| 35. | Adams Lake | 54.44% | 19.85%(+34.6)#35 | 12.66%(+41.8)#898 |
| 36. | Arcola | 54.43% | 19.85%(+34.6)#36 | 12.66%(+41.8)#900 |
| 37. | Montmorenci | 54.36% | 19.85%(+34.5)#37 | 12.66%(+41.7)#904 |
| 38. | Brooksburg | 54.24% | 19.85%(+34.4)#38 | 12.66%(+41.6)#908 |
| 39. | St Leon | 53.94% | 19.85%(+34.1)#39 | 12.66%(+41.3)#927 |
| 40. | Big Lake | 53.85% | 19.85%(+34.0)#40 | 12.66%(+41.2)#934 |
| 41. | Crows Nest | 53.76% | 19.85%(+33.9)#41 | 12.66%(+41.1)#946 |
| 42. | Pleasant Mills | 53.24% | 19.85%(+33.4)#42 | 12.66%(+40.6)#981 |
| 43. | Vicksburg | 52.99% | 19.85%(+33.1)#43 | 12.66%(+40.3)#1,000 |
| 44. | Troy | 52.16% | 19.85%(+32.3)#44 | 12.66%(+39.5)#1,077 |
| 45. | Owensburg | 52.16% | 19.85%(+32.3)#45 | 12.66%(+39.5)#1,078 |
| 46. | Keystone | 52.00% | 19.85%(+32.2)#46 | 12.66%(+39.3)#1,088 |
| 47. | Hoffman Lake | 51.57% | 19.85%(+31.7)#47 | 12.66%(+38.9)#1,131 |
| 48. | Monroe City | 51.56% | 19.85%(+31.7)#48 | 12.66%(+38.9)#1,135 |
| 49. | Bridgeton | 50.00% | 19.85%(+30.2)#49 | 12.66%(+37.3)#1,297 |
| 50. | Elizaville | 50.00% | 19.85%(+30.2)#50 | 12.66%(+37.3)#1,300 |
| 51. | Gentryville | 49.84% | 19.85%(+30.0)#51 | 12.66%(+37.2)#1,329 |
| 52. | Jasper | 49.73% | 19.85%(+29.9)#52 | 12.66%(+37.1)#1,338 |
| 53. | English | 49.59% | 19.85%(+29.7)#53 | 12.66%(+36.9)#1,356 |
| 54. | Schneider | 49.20% | 19.85%(+29.4)#54 | 12.66%(+36.5)#1,397 |
| 55. | Laotto | 49.06% | 19.85%(+29.2)#55 | 12.66%(+36.4)#1,417 |
| 56. | Wyatt | 48.59% | 19.85%(+28.7)#56 | 12.66%(+35.9)#1,477 |
| 57. | Sumava Resorts | 48.54% | 19.85%(+28.7)#57 | 12.66%(+35.9)#1,485 |
| 58. | Charlottesville | 48.41% | 19.85%(+28.6)#58 | 12.66%(+35.8)#1,495 |
| 59. | Hortonville | 48.40% | 19.85%(+28.6)#59 | 12.66%(+35.7)#1,498 |
| 60. | London | 48.08% | 19.85%(+28.2)#60 | 12.66%(+35.4)#1,540 |
| 61. | Spencerville | 47.97% | 19.85%(+28.1)#61 | 12.66%(+35.3)#1,553 |
| 62. | Hoagland | 47.95% | 19.85%(+28.1)#62 | 12.66%(+35.3)#1,558 |
| 63. | Darmstadt | 47.82% | 19.85%(+28.0)#63 | 12.66%(+35.2)#1,576 |
| 64. | Rockford | 47.37% | 19.85%(+27.5)#64 | 12.66%(+34.7)#1,656 |
| 65. | Wall Lake | 47.14% | 19.85%(+27.3)#65 | 12.66%(+34.5)#1,688 |
| 66. | Perkinsville | 47.06% | 19.85%(+27.2)#66 | 12.66%(+34.4)#1,708 |
| 67. | St Meinrad | 46.69% | 19.85%(+26.8)#67 | 12.66%(+34.0)#1,751 |
| 68. | Onward | 46.67% | 19.85%(+26.8)#68 | 12.66%(+34.0)#1,755 |
| 69. | Ossian | 46.63% | 19.85%(+26.8)#69 | 12.66%(+34.0)#1,766 |
| 70. | Sims | 46.59% | 19.85%(+26.7)#70 | 12.66%(+33.9)#1,774 |
| 71. | Mongo | 46.57% | 19.85%(+26.7)#71 | 12.66%(+33.9)#1,778 |
| 72. | Stanford | 46.55% | 19.85%(+26.7)#72 | 12.66%(+33.9)#1,782 |
| 73. | Cortland | 46.39% | 19.85%(+26.5)#73 | 12.66%(+33.7)#1,810 |
| 74. | Snow Lake | 45.75% | 19.85%(+25.9)#74 | 12.66%(+33.1)#1,909 |
| 75. | Harrison Lake | 45.67% | 19.85%(+25.8)#75 | 12.66%(+33.0)#1,920 |
| 76. | Oldenburg | 45.64% | 19.85%(+25.8)#76 | 12.66%(+33.0)#1,925 |
| 77. | Rolling Prairie | 45.62% | 19.85%(+25.8)#77 | 12.66%(+33.0)#1,931 |
| 78. | Midland | 45.26% | 19.85%(+25.4)#78 | 12.66%(+32.6)#1,994 |
| 79. | Richland | 45.02% | 19.85%(+25.2)#79 | 12.66%(+32.4)#2,036 |
| 80. | Tri Lakes | 44.83% | 19.85%(+25.0)#80 | 12.66%(+32.2)#2,064 |
| 81. | Thayer | 44.67% | 19.85%(+24.8)#81 | 12.66%(+32.0)#2,092 |
| 82. | Losantville | 44.44% | 19.85%(+24.6)#82 | 12.66%(+31.8)#2,121 |
| 83. | Cutler | 44.07% | 19.85%(+24.2)#83 | 12.66%(+31.4)#2,190 |
| 84. | Salamonia | 43.86% | 19.85%(+24.0)#84 | 12.66%(+31.2)#2,227 |
| 85. | Greens Fork | 43.82% | 19.85%(+24.0)#85 | 12.66%(+31.2)#2,233 |
| 86. | Cedar Grove | 43.69% | 19.85%(+23.8)#86 | 12.66%(+31.0)#2,266 |
| 87. | Bright | 43.46% | 19.85%(+23.6)#87 | 12.66%(+30.8)#2,310 |
| 88. | Griffin | 43.36% | 19.85%(+23.5)#88 | 12.66%(+30.7)#2,333 |
| 89. | Groveland | 43.15% | 19.85%(+23.3)#89 | 12.66%(+30.5)#2,388 |
| 90. | Bryant | 43.02% | 19.85%(+23.2)#90 | 12.66%(+30.4)#2,405 |
| 91. | Bippus | 42.86% | 19.85%(+23.0)#91 | 12.66%(+30.2)#2,428 |
| 92. | Eckerty | 42.86% | 19.85%(+23.0)#92 | 12.66%(+30.2)#2,432 |
| 93. | Santa Claus | 42.72% | 19.85%(+22.9)#93 | 12.66%(+30.1)#2,467 |
| 94. | St. Wendel | 42.67% | 19.85%(+22.8)#94 | 12.66%(+30.0)#2,480 |
| 95. | Carbon | 42.38% | 19.85%(+22.5)#95 | 12.66%(+29.7)#2,537 |
| 96. | Macy | 42.00% | 19.85%(+22.2)#96 | 12.66%(+29.3)#2,602 |
| 97. | Lucerne | 41.67% | 19.85%(+21.8)#97 | 12.66%(+29.0)#2,668 |
| 98. | Metz | 41.67% | 19.85%(+21.8)#98 | 12.66%(+29.0)#2,671 |
| 99. | Oswego | 41.54% | 19.85%(+21.7)#99 | 12.66%(+28.9)#2,695 |
| 100. | New Trenton | 41.47% | 19.85%(+21.6)#100 | 12.66%(+28.8)#2,705 |
Common Questions
What are the Top 10 Cities with the Highest Percentage of German Population in Indiana?
Top 10 Cities with the Highest Percentage of German Population in Indiana are:
#1
100.00%
#2
100.00%
#3
66.67%
#4
60.49%
#5
60.08%
#6
58.11%
#7
57.78%
#8
55.77%
#9
55.42%
#10
54.36%
What city has the Highest Percentage of German Population in Indiana?
Colburn has the Highest Percentage of German Population in Indiana with 100.00%.
What is the Percentage of German Population in the State of Indiana?
Percentage of German Population in Indiana is 19.85%.
What is the Percentage of German Population in the United States?
Percentage of German Population in the United States is 12.66%.