Cities with the Highest Percentage of German Population in Massachusetts
RELATED REPORTS & OPTIONS
German
Massachusetts
Compare Cities
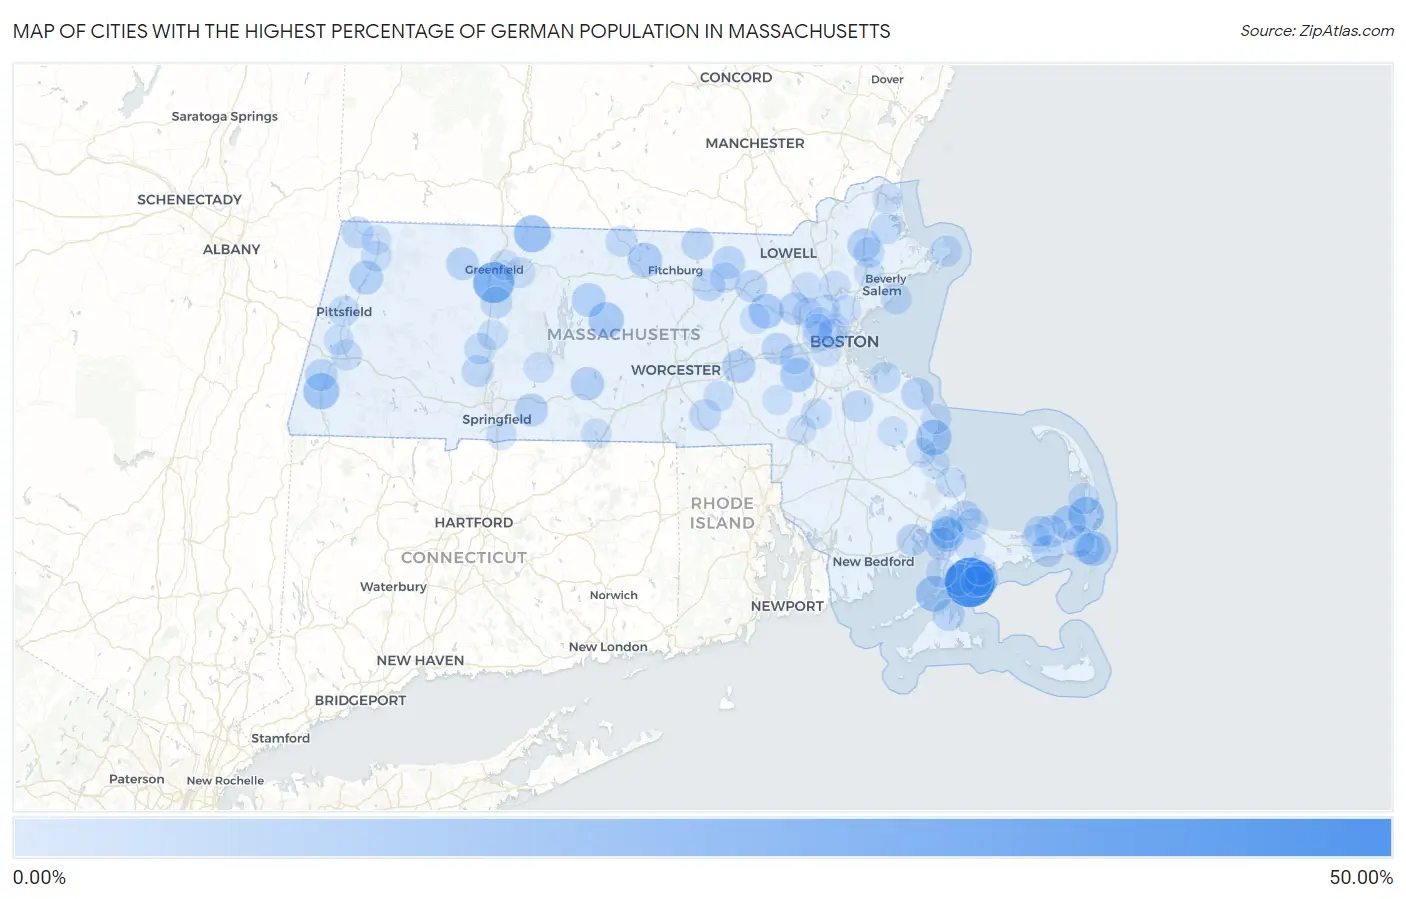
Map of Cities with the Highest Percentage of German Population in Massachusetts
0.00%
50.00%
Cities with the Highest Percentage of German Population in Massachusetts
| City | German | vs State | vs National | |
| 1. | Seconsett Island | 43.07% | 5.52%(+37.5)#1 | 12.66%(+30.4)#2,398 |
| 2. | Deerfield | 27.16% | 5.52%(+21.6)#2 | 12.66%(+14.5)#7,274 |
| 3. | Northfield | 19.71% | 5.52%(+14.2)#3 | 12.66%(+7.05)#11,510 |
| 4. | Great Barrington | 18.15% | 5.52%(+12.6)#4 | 12.66%(+5.49)#12,691 |
| 5. | Woods Hole | 17.74% | 5.52%(+12.2)#5 | 12.66%(+5.08)#13,023 |
| 6. | Orleans | 17.72% | 5.52%(+12.2)#6 | 12.66%(+5.06)#13,046 |
| 7. | Duxbury | 17.21% | 5.52%(+11.7)#7 | 12.66%(+4.55)#13,430 |
| 8. | Barre | 17.00% | 5.52%(+11.5)#8 | 12.66%(+4.34)#13,577 |
| 9. | Chatham | 15.76% | 5.52%(+10.2)#9 | 12.66%(+3.10)#14,540 |
| 10. | West Concord | 15.63% | 5.52%(+10.1)#10 | 12.66%(+2.97)#14,661 |
| 11. | South Ashburnham | 15.35% | 5.52%(+9.83)#11 | 12.66%(+2.69)#14,891 |
| 12. | Dover | 15.29% | 5.52%(+9.77)#12 | 12.66%(+2.63)#14,953 |
| 13. | Brewster | 15.18% | 5.52%(+9.66)#13 | 12.66%(+2.52)#15,053 |
| 14. | Popponesset | 15.03% | 5.52%(+9.51)#14 | 12.66%(+2.37)#15,170 |
| 15. | Petersham | 14.18% | 5.52%(+8.66)#15 | 12.66%(+1.52)#15,946 |
| 16. | Cheshire | 14.08% | 5.52%(+8.56)#16 | 12.66%(+1.42)#16,031 |
| 17. | Monument Beach | 13.46% | 5.52%(+7.94)#17 | 12.66%(+0.798)#16,616 |
| 18. | Cordaville | 13.28% | 5.52%(+7.76)#18 | 12.66%(+0.619)#16,775 |
| 19. | Warren | 13.23% | 5.52%(+7.71)#19 | 12.66%(+0.567)#16,824 |
| 20. | Wilbraham | 12.95% | 5.52%(+7.43)#20 | 12.66%(+0.285)#17,103 |
| 21. | Boxford | 12.60% | 5.52%(+7.08)#21 | 12.66%(-0.059)#17,409 |
| 22. | Pocasset | 12.41% | 5.52%(+6.89)#22 | 12.66%(-0.251)#17,600 |
| 23. | Hanscom Afb | 12.39% | 5.52%(+6.87)#23 | 12.66%(-0.273)#17,616 |
| 24. | Shelburne Falls | 12.18% | 5.52%(+6.66)#24 | 12.66%(-0.477)#17,800 |
| 25. | East Dennis | 12.02% | 5.52%(+6.50)#25 | 12.66%(-0.642)#17,935 |
| 26. | Scituate | 11.80% | 5.52%(+6.28)#26 | 12.66%(-0.864)#18,150 |
| 27. | Groton | 11.75% | 5.52%(+6.23)#27 | 12.66%(-0.908)#18,201 |
| 28. | Shirley | 11.48% | 5.52%(+5.96)#28 | 12.66%(-1.18)#18,453 |
| 29. | Housatonic | 11.47% | 5.52%(+5.95)#29 | 12.66%(-1.19)#18,463 |
| 30. | Bourne | 11.34% | 5.52%(+5.82)#30 | 12.66%(-1.33)#18,576 |
| 31. | East Harwich | 11.24% | 5.52%(+5.72)#31 | 12.66%(-1.42)#18,673 |
| 32. | Littleton Common | 11.01% | 5.52%(+5.49)#32 | 12.66%(-1.65)#18,895 |
| 33. | West Dennis | 10.91% | 5.52%(+5.39)#33 | 12.66%(-1.75)#18,998 |
| 34. | Vineyard Haven | 10.90% | 5.52%(+5.38)#34 | 12.66%(-1.76)#19,005 |
| 35. | Marion Center | 10.82% | 5.52%(+5.30)#35 | 12.66%(-1.84)#19,082 |
| 36. | Cochituate | 10.77% | 5.52%(+5.25)#36 | 12.66%(-1.89)#19,127 |
| 37. | East Falmouth | 10.72% | 5.52%(+5.20)#37 | 12.66%(-1.94)#19,177 |
| 38. | Townsend | 10.70% | 5.52%(+5.18)#38 | 12.66%(-1.96)#19,196 |
| 39. | Whitinsville | 10.61% | 5.52%(+5.10)#39 | 12.66%(-2.05)#19,281 |
| 40. | Easthampton Town | 10.42% | 5.52%(+4.91)#40 | 12.66%(-2.24)#19,452 |
| 41. | Sagamore | 10.41% | 5.52%(+4.89)#41 | 12.66%(-2.25)#19,458 |
| 42. | South Deerfield | 10.39% | 5.52%(+4.88)#42 | 12.66%(-2.27)#19,477 |
| 43. | Holbrook | 10.29% | 5.52%(+4.77)#43 | 12.66%(-2.37)#19,561 |
| 44. | West Chatham | 10.23% | 5.52%(+4.71)#44 | 12.66%(-2.43)#19,614 |
| 45. | Williamstown | 10.12% | 5.52%(+4.60)#45 | 12.66%(-2.55)#19,719 |
| 46. | Buzzards Bay | 9.99% | 5.52%(+4.47)#46 | 12.66%(-2.67)#19,855 |
| 47. | Northampton | 9.95% | 5.52%(+4.43)#47 | 12.66%(-2.71)#19,881 |
| 48. | Winchendon | 9.77% | 5.52%(+4.25)#48 | 12.66%(-2.89)#20,056 |
| 49. | Hingham | 9.67% | 5.52%(+4.15)#49 | 12.66%(-2.99)#20,166 |
| 50. | Rockport | 9.59% | 5.52%(+4.07)#50 | 12.66%(-3.07)#20,242 |
| 51. | Dennis | 9.59% | 5.52%(+4.07)#51 | 12.66%(-3.07)#20,243 |
| 52. | Topsfield | 9.57% | 5.52%(+4.06)#52 | 12.66%(-3.09)#20,255 |
| 53. | Sandwich | 9.53% | 5.52%(+4.01)#53 | 12.66%(-3.13)#20,291 |
| 54. | Marblehead | 9.47% | 5.52%(+3.95)#54 | 12.66%(-3.19)#20,361 |
| 55. | West Warren | 9.44% | 5.52%(+3.92)#55 | 12.66%(-3.22)#20,390 |
| 56. | North Eastham | 9.44% | 5.52%(+3.92)#56 | 12.66%(-3.22)#20,396 |
| 57. | Lee | 9.42% | 5.52%(+3.90)#57 | 12.66%(-3.24)#20,412 |
| 58. | Wellesley | 9.36% | 5.52%(+3.84)#58 | 12.66%(-3.30)#20,484 |
| 59. | Pittsfield | 9.17% | 5.52%(+3.65)#59 | 12.66%(-3.50)#20,649 |
| 60. | Rowley | 9.14% | 5.52%(+3.62)#60 | 12.66%(-3.53)#20,675 |
| 61. | Amherst | 9.09% | 5.52%(+3.57)#61 | 12.66%(-3.57)#20,717 |
| 62. | New Seabury | 9.08% | 5.52%(+3.56)#62 | 12.66%(-3.58)#20,741 |
| 63. | Sharon | 9.08% | 5.52%(+3.56)#63 | 12.66%(-3.59)#20,742 |
| 64. | Winchester | 9.05% | 5.52%(+3.53)#64 | 12.66%(-3.61)#20,765 |
| 65. | Adams | 8.84% | 5.52%(+3.32)#65 | 12.66%(-3.82)#20,999 |
| 66. | Turners Falls | 8.78% | 5.52%(+3.26)#66 | 12.66%(-3.88)#21,054 |
| 67. | The Pinehills | 8.76% | 5.52%(+3.24)#67 | 12.66%(-3.90)#21,080 |
| 68. | Reading | 8.73% | 5.52%(+3.21)#68 | 12.66%(-3.93)#21,102 |
| 69. | Millers Falls | 8.67% | 5.52%(+3.15)#69 | 12.66%(-3.99)#21,152 |
| 70. | Upton | 8.47% | 5.52%(+2.96)#70 | 12.66%(-4.19)#21,341 |
| 71. | Brookline | 8.42% | 5.52%(+2.90)#71 | 12.66%(-4.24)#21,402 |
| 72. | West Falmouth | 8.42% | 5.52%(+2.90)#72 | 12.66%(-4.24)#21,405 |
| 73. | Ayer | 8.39% | 5.52%(+2.87)#73 | 12.66%(-4.27)#21,435 |
| 74. | Greenfield | 8.36% | 5.52%(+2.84)#74 | 12.66%(-4.30)#21,453 |
| 75. | Ocean Bluff Brant Rock | 8.35% | 5.52%(+2.83)#75 | 12.66%(-4.31)#21,465 |
| 76. | Holland | 8.26% | 5.52%(+2.75)#76 | 12.66%(-4.40)#21,553 |
| 77. | Newburyport | 8.17% | 5.52%(+2.65)#77 | 12.66%(-4.49)#21,624 |
| 78. | Somerville | 8.12% | 5.52%(+2.61)#78 | 12.66%(-4.54)#21,666 |
| 79. | Mashpee Neck | 8.11% | 5.52%(+2.59)#79 | 12.66%(-4.55)#21,676 |
| 80. | Pinehurst | 8.11% | 5.52%(+2.59)#80 | 12.66%(-4.55)#21,681 |
| 81. | Longmeadow | 8.11% | 5.52%(+2.59)#81 | 12.66%(-4.55)#21,682 |
| 82. | Cambridge | 8.08% | 5.52%(+2.56)#82 | 12.66%(-4.58)#21,706 |
| 83. | Watertown Town | 8.01% | 5.52%(+2.49)#83 | 12.66%(-4.65)#21,766 |
| 84. | Lexington | 7.98% | 5.52%(+2.46)#84 | 12.66%(-4.68)#21,801 |
| 85. | Hatfield | 7.96% | 5.52%(+2.45)#85 | 12.66%(-4.70)#21,814 |
| 86. | Arlington | 7.94% | 5.52%(+2.43)#86 | 12.66%(-4.72)#21,834 |
| 87. | Maynard | 7.94% | 5.52%(+2.42)#87 | 12.66%(-4.72)#21,841 |
| 88. | Belchertown | 7.93% | 5.52%(+2.41)#88 | 12.66%(-4.73)#21,853 |
| 89. | Belmont | 7.89% | 5.52%(+2.37)#89 | 12.66%(-4.77)#21,894 |
| 90. | Forestdale | 7.87% | 5.52%(+2.35)#90 | 12.66%(-4.79)#21,912 |
| 91. | Millis Clicquot | 7.86% | 5.52%(+2.34)#91 | 12.66%(-4.80)#21,922 |
| 92. | Lenox | 7.80% | 5.52%(+2.29)#92 | 12.66%(-4.86)#21,990 |
| 93. | Hanson | 7.71% | 5.52%(+2.20)#93 | 12.66%(-4.95)#22,056 |
| 94. | Plymouth | 7.66% | 5.52%(+2.14)#94 | 12.66%(-5.00)#22,111 |
| 95. | Kingston | 7.57% | 5.52%(+2.05)#95 | 12.66%(-5.09)#22,189 |
| 96. | Danvers | 7.55% | 5.52%(+2.03)#96 | 12.66%(-5.11)#22,204 |
| 97. | North Adams | 7.45% | 5.52%(+1.93)#97 | 12.66%(-5.21)#22,306 |
| 98. | Yarmouth Port | 7.44% | 5.52%(+1.92)#98 | 12.66%(-5.22)#22,326 |
| 99. | Melrose | 7.40% | 5.52%(+1.88)#99 | 12.66%(-5.26)#22,365 |
| 100. | Foxborough | 7.38% | 5.52%(+1.86)#100 | 12.66%(-5.28)#22,387 |
Common Questions
What are the Top 10 Cities with the Highest Percentage of German Population in Massachusetts?
Top 10 Cities with the Highest Percentage of German Population in Massachusetts are:
#1
43.07%
#2
27.16%
#3
19.71%
#4
18.15%
#5
17.74%
#6
17.72%
#7
17.21%
#8
17.00%
#9
15.76%
#10
15.63%
What city has the Highest Percentage of German Population in Massachusetts?
Seconsett Island has the Highest Percentage of German Population in Massachusetts with 43.07%.
What is the Percentage of German Population in the State of Massachusetts?
Percentage of German Population in Massachusetts is 5.52%.
What is the Percentage of German Population in the United States?
Percentage of German Population in the United States is 12.66%.