Cities with the Highest Percentage of German Population in Louisiana
RELATED REPORTS & OPTIONS
German
Louisiana
Compare Cities
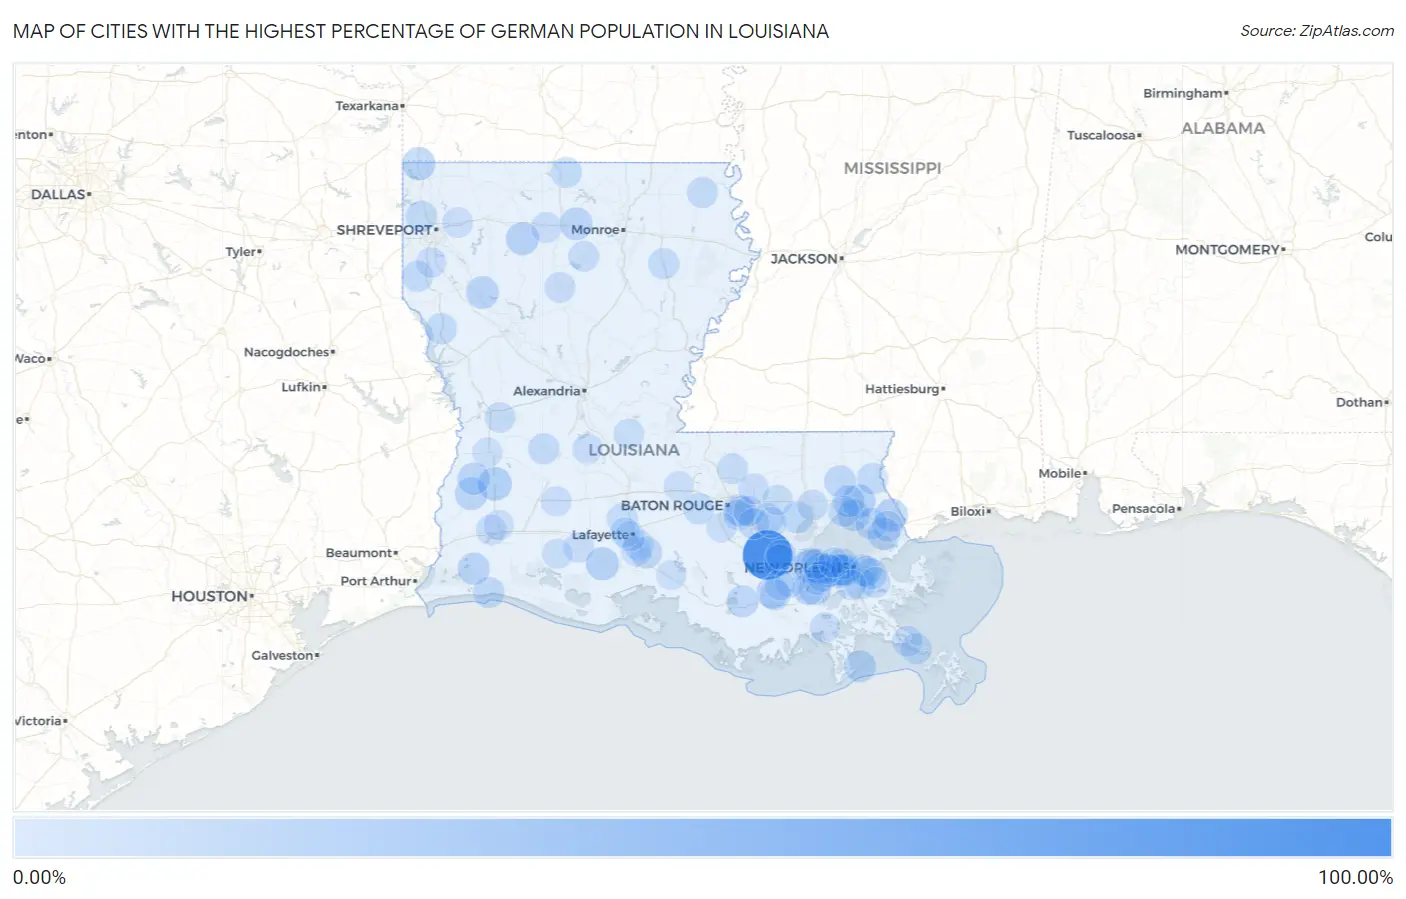
Map of Cities with the Highest Percentage of German Population in Louisiana
0.00%
100.00%
Cities with the Highest Percentage of German Population in Louisiana
| City | German | vs State | vs National | |
| 1. | Romeville | 100.00% | 6.67%(+93.3)#1 | 12.66%(+87.3)#41 |
| 2. | Delacroix | 26.72% | 6.67%(+20.0)#2 | 12.66%(+14.1)#7,465 |
| 3. | Taft | 26.44% | 6.67%(+19.8)#3 | 12.66%(+13.8)#7,592 |
| 4. | Longville | 24.76% | 6.67%(+18.1)#4 | 12.66%(+12.1)#8,436 |
| 5. | Abita Springs | 23.15% | 6.67%(+16.5)#5 | 12.66%(+10.5)#9,291 |
| 6. | Ida | 21.66% | 6.67%(+15.0)#6 | 12.66%(+9.00)#10,198 |
| 7. | Kaplan | 21.45% | 6.67%(+14.8)#7 | 12.66%(+8.79)#10,327 |
| 8. | Bryceland | 21.26% | 6.67%(+14.6)#8 | 12.66%(+8.60)#10,446 |
| 9. | Rio | 20.97% | 6.67%(+14.3)#9 | 12.66%(+8.31)#10,639 |
| 10. | Pearl River | 20.94% | 6.67%(+14.3)#10 | 12.66%(+8.28)#10,663 |
| 11. | Harahan | 19.81% | 6.67%(+13.1)#11 | 12.66%(+7.14)#11,443 |
| 12. | Edgefield | 19.46% | 6.67%(+12.8)#12 | 12.66%(+6.80)#11,728 |
| 13. | Choudrant | 19.43% | 6.67%(+12.8)#13 | 12.66%(+6.77)#11,747 |
| 14. | Eden Isle | 19.21% | 6.67%(+12.5)#14 | 12.66%(+6.55)#11,895 |
| 15. | Bayou Gauche | 18.58% | 6.67%(+11.9)#15 | 12.66%(+5.92)#12,337 |
| 16. | Oretta | 18.53% | 6.67%(+11.9)#16 | 12.66%(+5.87)#12,380 |
| 17. | Singer | 18.36% | 6.67%(+11.7)#17 | 12.66%(+5.70)#12,529 |
| 18. | River Ridge | 17.68% | 6.67%(+11.0)#18 | 12.66%(+5.02)#13,070 |
| 19. | Mandeville | 17.67% | 6.67%(+11.0)#19 | 12.66%(+5.01)#13,081 |
| 20. | Hackberry | 17.61% | 6.67%(+10.9)#20 | 12.66%(+4.95)#13,132 |
| 21. | Bayou Country Club | 17.23% | 6.67%(+10.6)#21 | 12.66%(+4.57)#13,419 |
| 22. | Des Allemands | 17.09% | 6.67%(+10.4)#22 | 12.66%(+4.43)#13,513 |
| 23. | Ama | 17.03% | 6.67%(+10.4)#23 | 12.66%(+4.37)#13,559 |
| 24. | Grand Isle | 16.61% | 6.67%(+9.94)#24 | 12.66%(+3.95)#13,880 |
| 25. | Cade | 16.12% | 6.67%(+9.45)#25 | 12.66%(+3.46)#14,259 |
| 26. | Destrehan | 16.12% | 6.67%(+9.44)#26 | 12.66%(+3.45)#14,264 |
| 27. | Bayou L Ourse | 15.94% | 6.67%(+9.26)#27 | 12.66%(+3.28)#14,394 |
| 28. | Lacombe | 15.75% | 6.67%(+9.08)#28 | 12.66%(+3.09)#14,546 |
| 29. | Covington | 15.61% | 6.67%(+8.93)#29 | 12.66%(+2.95)#14,679 |
| 30. | Elmwood | 15.56% | 6.67%(+8.88)#30 | 12.66%(+2.90)#14,725 |
| 31. | Folsom | 15.32% | 6.67%(+8.64)#31 | 12.66%(+2.66)#14,921 |
| 32. | Killian | 14.94% | 6.67%(+8.27)#32 | 12.66%(+2.28)#15,254 |
| 33. | New Orleans Station | 14.41% | 6.67%(+7.74)#33 | 12.66%(+1.75)#15,747 |
| 34. | Arabi | 14.22% | 6.67%(+7.55)#34 | 12.66%(+1.56)#15,913 |
| 35. | Cameron | 14.14% | 6.67%(+7.46)#35 | 12.66%(+1.48)#15,993 |
| 36. | Belle Chasse | 13.81% | 6.67%(+7.14)#36 | 12.66%(+1.15)#16,259 |
| 37. | Jefferson | 13.59% | 6.67%(+6.91)#37 | 12.66%(+0.928)#16,483 |
| 38. | Converse | 13.48% | 6.67%(+6.81)#38 | 12.66%(+0.822)#16,593 |
| 39. | Blanchard | 13.43% | 6.67%(+6.75)#39 | 12.66%(+0.765)#16,638 |
| 40. | Metairie | 13.42% | 6.67%(+6.75)#40 | 12.66%(+0.761)#16,648 |
| 41. | Port Vincent | 13.21% | 6.67%(+6.54)#41 | 12.66%(+0.553)#16,837 |
| 42. | Sun | 13.20% | 6.67%(+6.52)#42 | 12.66%(+0.536)#16,855 |
| 43. | Grosse Tete | 13.11% | 6.67%(+6.44)#43 | 12.66%(+0.450)#16,927 |
| 44. | Cankton | 13.02% | 6.67%(+6.35)#44 | 12.66%(+0.360)#17,028 |
| 45. | Paulina | 12.92% | 6.67%(+6.25)#45 | 12.66%(+0.260)#17,122 |
| 46. | Elizabeth | 12.91% | 6.67%(+6.24)#46 | 12.66%(+0.249)#17,134 |
| 47. | Madisonville | 12.74% | 6.67%(+6.07)#47 | 12.66%(+0.081)#17,280 |
| 48. | Meraux | 12.69% | 6.67%(+6.02)#48 | 12.66%(+0.029)#17,333 |
| 49. | Westminster | 12.38% | 6.67%(+5.71)#49 | 12.66%(-0.277)#17,622 |
| 50. | Buras | 12.38% | 6.67%(+5.70)#50 | 12.66%(-0.283)#17,628 |
| 51. | Baskin | 12.35% | 6.67%(+5.68)#51 | 12.66%(-0.308)#17,644 |
| 52. | Chalmette | 12.12% | 6.67%(+5.44)#52 | 12.66%(-0.544)#17,862 |
| 53. | Forest | 12.11% | 6.67%(+5.43)#53 | 12.66%(-0.551)#17,873 |
| 54. | Keachi | 12.11% | 6.67%(+5.43)#54 | 12.66%(-0.556)#17,876 |
| 55. | Poydras | 12.02% | 6.67%(+5.34)#55 | 12.66%(-0.643)#17,936 |
| 56. | Spearsville | 11.98% | 6.67%(+5.30)#56 | 12.66%(-0.685)#17,973 |
| 57. | Inniswold | 11.67% | 6.67%(+5.00)#57 | 12.66%(-0.987)#18,268 |
| 58. | Slidell | 11.55% | 6.67%(+4.88)#58 | 12.66%(-1.11)#18,372 |
| 59. | Oak Hills Place | 11.17% | 6.67%(+4.49)#59 | 12.66%(-1.50)#18,735 |
| 60. | Montz | 11.14% | 6.67%(+4.46)#60 | 12.66%(-1.52)#18,761 |
| 61. | Empire | 11.11% | 6.67%(+4.44)#61 | 12.66%(-1.55)#18,777 |
| 62. | Ponchatoula | 11.01% | 6.67%(+4.33)#62 | 12.66%(-1.66)#18,903 |
| 63. | Prairieville | 11.00% | 6.67%(+4.33)#63 | 12.66%(-1.66)#18,907 |
| 64. | Slaughter | 11.00% | 6.67%(+4.32)#64 | 12.66%(-1.67)#18,916 |
| 65. | Lafourche Crossing | 10.91% | 6.67%(+4.23)#65 | 12.66%(-1.75)#18,999 |
| 66. | Dodson | 10.90% | 6.67%(+4.22)#66 | 12.66%(-1.76)#19,007 |
| 67. | Luling | 10.74% | 6.67%(+4.07)#67 | 12.66%(-1.92)#19,153 |
| 68. | Chatham | 10.47% | 6.67%(+3.80)#68 | 12.66%(-2.19)#19,410 |
| 69. | Shenandoah | 10.38% | 6.67%(+3.70)#69 | 12.66%(-2.28)#19,487 |
| 70. | Fort Polk North | 10.36% | 6.67%(+3.69)#70 | 12.66%(-2.30)#19,492 |
| 71. | Westlake | 10.32% | 6.67%(+3.64)#71 | 12.66%(-2.35)#19,541 |
| 72. | Broussard | 10.25% | 6.67%(+3.58)#72 | 12.66%(-2.41)#19,590 |
| 73. | Eastwood | 10.12% | 6.67%(+3.45)#73 | 12.66%(-2.54)#19,714 |
| 74. | Kraemer | 10.11% | 6.67%(+3.43)#74 | 12.66%(-2.55)#19,729 |
| 75. | French Settlement | 10.09% | 6.67%(+3.42)#75 | 12.66%(-2.57)#19,736 |
| 76. | Watson | 10.03% | 6.67%(+3.36)#76 | 12.66%(-2.63)#19,794 |
| 77. | St Rose | 9.88% | 6.67%(+3.21)#77 | 12.66%(-2.78)#19,948 |
| 78. | Simsboro | 9.87% | 6.67%(+3.20)#78 | 12.66%(-2.79)#19,953 |
| 79. | Livingston | 9.71% | 6.67%(+3.04)#79 | 12.66%(-2.95)#20,123 |
| 80. | Cut Off | 9.56% | 6.67%(+2.88)#80 | 12.66%(-3.10)#20,270 |
| 81. | Stonewall | 9.38% | 6.67%(+2.71)#81 | 12.66%(-3.28)#20,452 |
| 82. | Turkey Creek | 9.36% | 6.67%(+2.68)#82 | 12.66%(-3.30)#20,481 |
| 83. | Elton | 9.27% | 6.67%(+2.59)#83 | 12.66%(-3.39)#20,556 |
| 84. | Morse | 9.18% | 6.67%(+2.51)#84 | 12.66%(-3.48)#20,624 |
| 85. | Choctaw | 9.12% | 6.67%(+2.44)#85 | 12.66%(-3.54)#20,687 |
| 86. | Norco | 9.02% | 6.67%(+2.35)#86 | 12.66%(-3.64)#20,793 |
| 87. | Lutcher | 8.90% | 6.67%(+2.22)#87 | 12.66%(-3.77)#20,943 |
| 88. | Youngsville | 8.89% | 6.67%(+2.22)#88 | 12.66%(-3.77)#20,944 |
| 89. | Cottonport | 8.88% | 6.67%(+2.21)#89 | 12.66%(-3.78)#20,957 |
| 90. | Lake Arthur | 8.83% | 6.67%(+2.15)#90 | 12.66%(-3.83)#21,009 |
| 91. | Moss Bluff | 8.75% | 6.67%(+2.08)#91 | 12.66%(-3.91)#21,084 |
| 92. | Estelle | 8.71% | 6.67%(+2.04)#92 | 12.66%(-3.95)#21,118 |
| 93. | Fordoche | 8.58% | 6.67%(+1.91)#93 | 12.66%(-4.08)#21,241 |
| 94. | Boutte | 8.58% | 6.67%(+1.90)#94 | 12.66%(-4.09)#21,252 |
| 95. | Lafayette | 8.53% | 6.67%(+1.86)#95 | 12.66%(-4.13)#21,289 |
| 96. | Kenner | 8.49% | 6.67%(+1.82)#96 | 12.66%(-4.17)#21,327 |
| 97. | Scott | 8.43% | 6.67%(+1.75)#97 | 12.66%(-4.23)#21,397 |
| 98. | Deridder | 8.31% | 6.67%(+1.64)#98 | 12.66%(-4.35)#21,504 |
| 99. | Plaquemine | 8.27% | 6.67%(+1.59)#99 | 12.66%(-4.39)#21,550 |
| 100. | Jeanerette | 8.03% | 6.67%(+1.36)#100 | 12.66%(-4.63)#21,747 |
Common Questions
What are the Top 10 Cities with the Highest Percentage of German Population in Louisiana?
Top 10 Cities with the Highest Percentage of German Population in Louisiana are:
#1
100.00%
#2
26.44%
#3
24.76%
#4
23.15%
#5
21.66%
#6
21.45%
#7
21.26%
#8
20.94%
#9
19.81%
#10
19.46%
What city has the Highest Percentage of German Population in Louisiana?
Romeville has the Highest Percentage of German Population in Louisiana with 100.00%.
What is the Percentage of German Population in the State of Louisiana?
Percentage of German Population in Louisiana is 6.67%.
What is the Percentage of German Population in the United States?
Percentage of German Population in the United States is 12.66%.