Cities with the Highest Percentage of Argentinean Population in the United States
RELATED REPORTS & OPTIONS
Argentinean
United States
Compare Cities
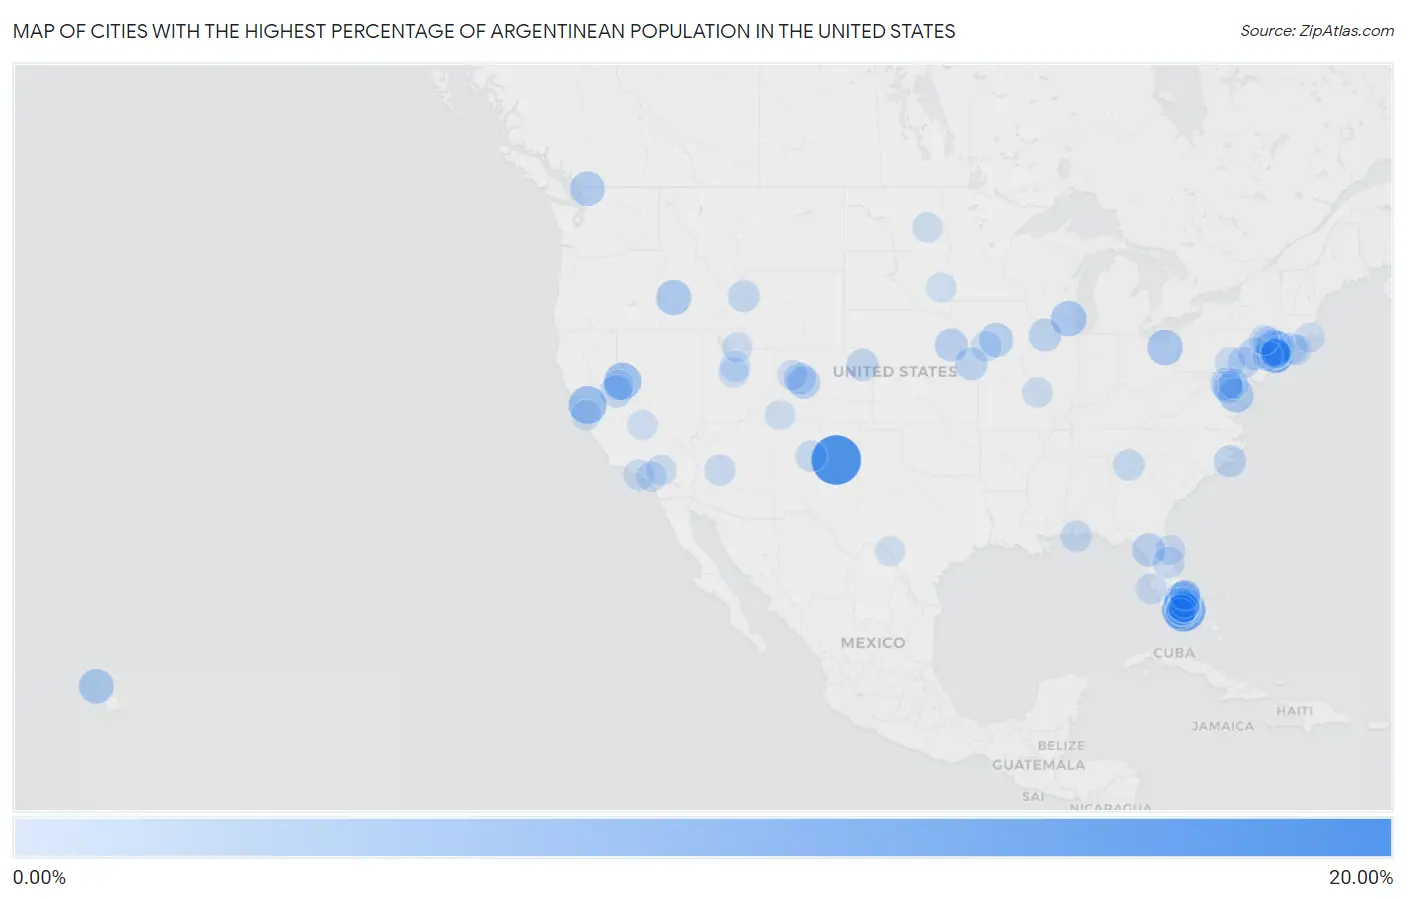
Map of Cities with the Highest Percentage of Argentinean Population in the United States
0.00%
20.00%
Cities with the Highest Percentage of Argentinean Population in the United States
| City | Argentinean | vs State | vs National | |
| 1. | Puerto De Luna | 17.90% | 0.029%(+17.9)#1 | 0.092%(+17.8)#1 |
| 2. | Key Biscayne | 12.63% | 0.34%(+12.3)#1 | 0.092%(+12.5)#2 |
| 3. | Shell Ridge | 8.17% | 0.14%(+8.03)#1 | 0.092%(+8.07)#3 |
| 4. | Biscayne Park | 7.94% | 0.34%(+7.60)#2 | 0.092%(+7.85)#4 |
| 5. | Silver City | 7.62% | 0.13%(+7.49)#1 | 0.092%(+7.53)#5 |
| 6. | Woodsburgh | 7.33% | 0.16%(+7.17)#1 | 0.092%(+7.24)#6 |
| 7. | Silver Lake Cdp Essex County | 7.15% | 0.20%(+6.94)#1 | 0.092%(+7.06)#7 |
| 8. | Hi Nella Borough | 7.13% | 0.20%(+6.93)#2 | 0.092%(+7.04)#8 |
| 9. | Watergate | 6.85% | 0.34%(+6.51)#3 | 0.092%(+6.76)#9 |
| 10. | El Macero | 6.71% | 0.14%(+6.57)#2 | 0.092%(+6.62)#10 |
| 11. | Sawyerwood | 6.37% | 0.022%(+6.35)#1 | 0.092%(+6.28)#11 |
| 12. | Lily Lake | 6.24% | 0.040%(+6.20)#1 | 0.092%(+6.15)#12 |
| 13. | Irvington | 6.18% | 0.16%(+6.02)#2 | 0.092%(+6.08)#13 |
| 14. | Robie Creek | 6.06% | 0.037%(+6.03)#1 | 0.092%(+5.97)#14 |
| 15. | St Leonard | 5.95% | 0.12%(+5.83)#1 | 0.092%(+5.86)#15 |
| 16. | Olowalu | 5.68% | 0.055%(+5.63)#1 | 0.092%(+5.59)#16 |
| 17. | Maple Falls | 5.63% | 0.049%(+5.58)#1 | 0.092%(+5.54)#17 |
| 18. | Miami Shores | 5.43% | 0.34%(+5.09)#4 | 0.092%(+5.34)#18 |
| 19. | Miami Beach | 5.24% | 0.34%(+4.90)#5 | 0.092%(+5.15)#19 |
| 20. | Ojus | 5.22% | 0.34%(+4.88)#6 | 0.092%(+5.12)#20 |
| 21. | Swan | 5.08% | 0.0093%(+5.08)#1 | 0.092%(+4.99)#21 |
| 22. | New Hope Borough | 5.07% | 0.055%(+5.01)#1 | 0.092%(+4.98)#22 |
| 23. | Glen Head | 4.52% | 0.16%(+4.36)#3 | 0.092%(+4.43)#23 |
| 24. | Bronson | 4.49% | 0.34%(+4.15)#7 | 0.092%(+4.40)#24 |
| 25. | Danielson Borough | 4.47% | 0.17%(+4.30)#1 | 0.092%(+4.38)#25 |
| 26. | Riverside | 4.45% | 0.17%(+4.28)#2 | 0.092%(+4.36)#26 |
| 27. | Ithaca | 4.38% | 0.020%(+4.36)#1 | 0.092%(+4.29)#27 |
| 28. | Upper Stewartsville | 4.36% | 0.20%(+4.16)#3 | 0.092%(+4.27)#28 |
| 29. | Ball Pond | 4.35% | 0.17%(+4.17)#3 | 0.092%(+4.25)#29 |
| 30. | Aspen | 4.34% | 0.097%(+4.25)#1 | 0.092%(+4.25)#30 |
| 31. | Pine Ridge Cdp Collier County | 4.33% | 0.34%(+3.99)#8 | 0.092%(+4.24)#31 |
| 32. | Lyndon | 4.28% | 0.049%(+4.23)#1 | 0.092%(+4.19)#32 |
| 33. | Sunny Isles Beach | 4.26% | 0.34%(+3.92)#9 | 0.092%(+4.16)#33 |
| 34. | Maitland | 4.15% | 0.015%(+4.14)#1 | 0.092%(+4.06)#34 |
| 35. | Harbor Isle | 4.04% | 0.16%(+3.89)#4 | 0.092%(+3.95)#35 |
| 36. | Kirkwood | 4.02% | 0.14%(+3.88)#3 | 0.092%(+3.92)#36 |
| 37. | Ave Maria | 3.95% | 0.34%(+3.61)#10 | 0.092%(+3.86)#37 |
| 38. | Moonachie Borough | 3.94% | 0.20%(+3.74)#4 | 0.092%(+3.85)#38 |
| 39. | Catherine | 3.73% | 0.097%(+3.63)#2 | 0.092%(+3.64)#39 |
| 40. | Derwood | 3.73% | 0.12%(+3.61)#2 | 0.092%(+3.64)#40 |
| 41. | Yuma | 3.72% | 0.097%(+3.62)#3 | 0.092%(+3.63)#41 |
| 42. | Newport | 3.68% | 0.048%(+3.63)#1 | 0.092%(+3.58)#42 |
| 43. | Aventura | 3.63% | 0.34%(+3.29)#11 | 0.092%(+3.53)#43 |
| 44. | Harriman | 3.45% | 0.16%(+3.29)#5 | 0.092%(+3.36)#44 |
| 45. | South Palm Beach | 3.40% | 0.34%(+3.06)#12 | 0.092%(+3.31)#45 |
| 46. | Flying Hills | 3.38% | 0.055%(+3.32)#2 | 0.092%(+3.29)#46 |
| 47. | Weston | 3.38% | 0.34%(+3.04)#13 | 0.092%(+3.28)#47 |
| 48. | Driggs | 3.34% | 0.037%(+3.30)#2 | 0.092%(+3.24)#48 |
| 49. | Black Hammock | 3.25% | 0.34%(+2.91)#14 | 0.092%(+3.15)#49 |
| 50. | Bon Secour | 3.19% | 0.019%(+3.17)#1 | 0.092%(+3.10)#50 |
| 51. | Jamesport | 3.18% | 0.16%(+3.02)#6 | 0.092%(+3.09)#51 |
| 52. | Dahlonega | 3.16% | 0.053%(+3.11)#1 | 0.092%(+3.07)#52 |
| 53. | Cedro | 3.12% | 0.029%(+3.09)#2 | 0.092%(+3.03)#53 |
| 54. | Yarnell | 2.94% | 0.054%(+2.88)#1 | 0.092%(+2.84)#54 |
| 55. | Gilman | 2.80% | 0.045%(+2.76)#1 | 0.092%(+2.71)#55 |
| 56. | Pitcairn Borough | 2.79% | 0.055%(+2.73)#3 | 0.092%(+2.70)#56 |
| 57. | Tamaqua Borough | 2.78% | 0.055%(+2.72)#4 | 0.092%(+2.69)#57 |
| 58. | Ives Estates | 2.77% | 0.34%(+2.43)#15 | 0.092%(+2.68)#58 |
| 59. | Marina Del Rey | 2.74% | 0.14%(+2.60)#4 | 0.092%(+2.64)#59 |
| 60. | Olympia Heights | 2.73% | 0.34%(+2.39)#16 | 0.092%(+2.64)#60 |
| 61. | Friendship Heights Village | 2.71% | 0.12%(+2.59)#3 | 0.092%(+2.62)#61 |
| 62. | Lower Allen | 2.68% | 0.055%(+2.62)#5 | 0.092%(+2.59)#62 |
| 63. | Venice Gardens | 2.67% | 0.34%(+2.33)#17 | 0.092%(+2.57)#63 |
| 64. | Sagaponack | 2.62% | 0.16%(+2.46)#7 | 0.092%(+2.52)#64 |
| 65. | Big Bear Lake | 2.61% | 0.14%(+2.47)#5 | 0.092%(+2.52)#65 |
| 66. | Carolina Meadows | 2.60% | 0.048%(+2.56)#2 | 0.092%(+2.51)#66 |
| 67. | Coronita | 2.60% | 0.14%(+2.46)#6 | 0.092%(+2.50)#67 |
| 68. | Westwood | 2.59% | 0.015%(+2.57)#2 | 0.092%(+2.50)#68 |
| 69. | Lorimor | 2.51% | 0.0093%(+2.50)#2 | 0.092%(+2.41)#69 |
| 70. | Salem | 2.47% | 0.20%(+2.28)#1 | 0.092%(+2.38)#70 |
| 71. | Round Hill Village | 2.46% | 0.13%(+2.33)#2 | 0.092%(+2.37)#71 |
| 72. | Glenvar Heights | 2.44% | 0.34%(+2.10)#18 | 0.092%(+2.35)#72 |
| 73. | Rogers | 2.44% | 0.0077%(+2.43)#1 | 0.092%(+2.35)#73 |
| 74. | Nephi | 2.41% | 0.20%(+2.22)#2 | 0.092%(+2.32)#74 |
| 75. | Silt | 2.41% | 0.097%(+2.31)#4 | 0.092%(+2.32)#75 |
| 76. | Spring Lake Heights Borough | 2.41% | 0.20%(+2.20)#5 | 0.092%(+2.31)#76 |
| 77. | Los Altos Hills | 2.40% | 0.14%(+2.27)#7 | 0.092%(+2.31)#77 |
| 78. | Forest Heights | 2.35% | 0.12%(+2.23)#4 | 0.092%(+2.26)#78 |
| 79. | East Norwich | 2.33% | 0.16%(+2.18)#8 | 0.092%(+2.24)#79 |
| 80. | Naranja | 2.32% | 0.34%(+1.97)#19 | 0.092%(+2.22)#80 |
| 81. | Flagler Beach | 2.29% | 0.34%(+1.95)#20 | 0.092%(+2.20)#81 |
| 82. | Cortez | 2.29% | 0.097%(+2.19)#5 | 0.092%(+2.20)#82 |
| 83. | Gambrills | 2.28% | 0.12%(+2.17)#5 | 0.092%(+2.19)#83 |
| 84. | Henefer | 2.26% | 0.20%(+2.06)#3 | 0.092%(+2.17)#84 |
| 85. | Sea Ranch Lakes | 2.26% | 0.34%(+1.92)#21 | 0.092%(+2.17)#85 |
| 86. | Port Washington North | 2.21% | 0.16%(+2.05)#9 | 0.092%(+2.12)#86 |
| 87. | Laughlin Afb | 2.20% | 0.067%(+2.13)#1 | 0.092%(+2.11)#87 |
| 88. | New Hyde Park | 2.20% | 0.16%(+2.04)#10 | 0.092%(+2.11)#88 |
| 89. | Surfside | 2.19% | 0.34%(+1.85)#22 | 0.092%(+2.09)#89 |
| 90. | North Hills | 2.18% | 0.16%(+2.02)#11 | 0.092%(+2.08)#90 |
| 91. | Franklin Lakes Borough | 2.17% | 0.20%(+1.97)#6 | 0.092%(+2.08)#91 |
| 92. | Lake Clarke Shores | 2.17% | 0.34%(+1.83)#23 | 0.092%(+2.08)#92 |
| 93. | Peapack And Gladstone Borough | 2.15% | 0.20%(+1.94)#7 | 0.092%(+2.06)#93 |
| 94. | Independence | 2.12% | 0.14%(+1.98)#8 | 0.092%(+2.03)#94 |
| 95. | Ramona | 2.11% | 0.0071%(+2.11)#1 | 0.092%(+2.02)#95 |
| 96. | Bellerose Terrace | 2.11% | 0.16%(+1.95)#12 | 0.092%(+2.02)#96 |
| 97. | Port Reading | 2.10% | 0.20%(+1.90)#8 | 0.092%(+2.01)#97 |
| 98. | Otisville | 2.10% | 0.16%(+1.94)#13 | 0.092%(+2.00)#98 |
| 99. | Melville | 2.09% | 0.058%(+2.03)#1 | 0.092%(+1.99)#99 |
| 100. | Saddle River Borough | 2.08% | 0.20%(+1.88)#9 | 0.092%(+1.99)#100 |
Common Questions
What are the Top 10 Cities with the Highest Percentage of Argentinean Population in the United States?
Top 10 Cities with the Highest Percentage of Argentinean Population in the United States are:
#1
17.90%
#2
12.63%
#3
8.17%
#4
7.94%
#5
7.62%
#6
7.33%
#7
6.85%
#8
6.37%
#9
6.24%
#10
6.18%
What city has the Highest Percentage of Argentinean Population in the United States?
Puerto de Luna has the Highest Percentage of Argentinean Population in the United States with 17.90%.
What is the Percentage of Argentinean Population in the United States?
Percentage of Argentinean Population in the United States is 0.092%.