Cities with the Most Immigrants from Central America in Pennsylvania
RELATED REPORTS & OPTIONS
Central America
Pennsylvania
Compare Cities
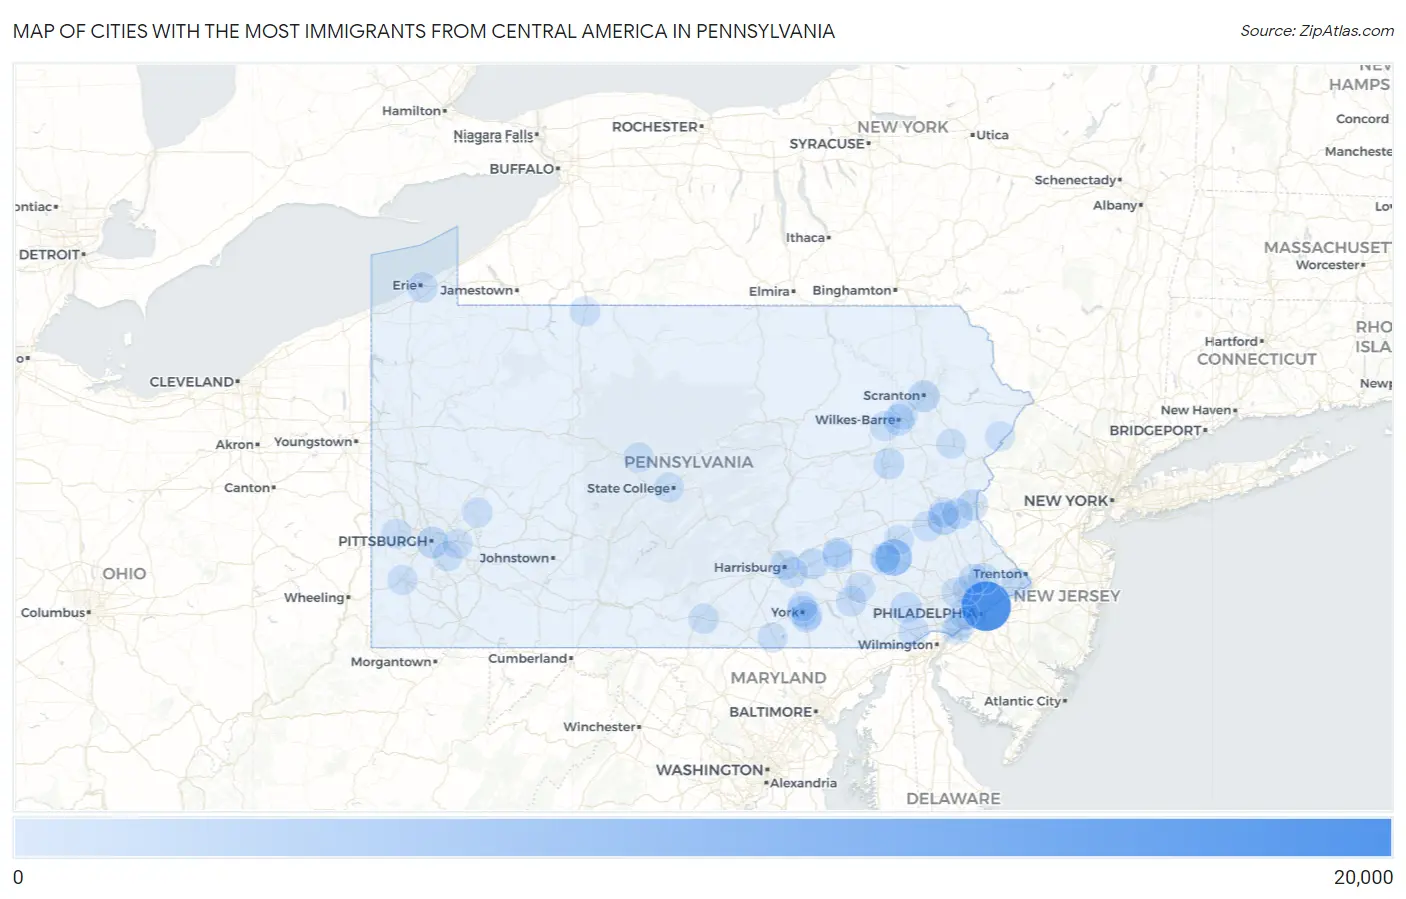
Map of Cities with the Most Immigrants from Central America in Pennsylvania
0
20,000
Cities with the Most Immigrants from Central America in Pennsylvania
| City | Central America | vs State | vs National | |
| 1. | Philadelphia | 18,312 | 91,013(20.12%)#1 | 14,469,050(0.13%)#96 |
| 2. | Reading | 5,917 | 91,013(6.50%)#2 | 14,469,050(0.04%)#358 |
| 3. | Norristown Borough | 3,042 | 91,013(3.34%)#3 | 14,469,050(0.02%)#689 |
| 4. | Allentown | 2,287 | 91,013(2.51%)#4 | 14,469,050(0.02%)#865 |
| 5. | Pittsburgh | 1,602 | 91,013(1.76%)#5 | 14,469,050(0.01%)#1,127 |
| 6. | Scranton | 1,595 | 91,013(1.75%)#6 | 14,469,050(0.01%)#1,133 |
| 7. | Chambersburg Borough | 1,303 | 91,013(1.43%)#7 | 14,469,050(0.01%)#1,300 |
| 8. | Kennett Square Borough | 1,214 | 91,013(1.33%)#8 | 14,469,050(0.01%)#1,369 |
| 9. | Wilkes Barre | 1,072 | 91,013(1.18%)#9 | 14,469,050(0.01%)#1,504 |
| 10. | Easton | 979 | 91,013(1.08%)#10 | 14,469,050(0.01%)#1,605 |
| 11. | Hazleton | 936 | 91,013(1.03%)#11 | 14,469,050(0.01%)#1,666 |
| 12. | Coatesville | 920 | 91,013(1.01%)#12 | 14,469,050(0.01%)#1,688 |
| 13. | Levittown | 866 | 91,013(0.95%)#13 | 14,469,050(0.01%)#1,753 |
| 14. | Hershey | 853 | 91,013(0.94%)#14 | 14,469,050(0.01%)#1,773 |
| 15. | Horsham | 840 | 91,013(0.92%)#15 | 14,469,050(0.01%)#1,788 |
| 16. | Oxford Borough | 779 | 91,013(0.86%)#16 | 14,469,050(0.01%)#1,875 |
| 17. | Bethlehem | 778 | 91,013(0.85%)#17 | 14,469,050(0.01%)#1,876 |
| 18. | Avondale Borough | 582 | 91,013(0.64%)#18 | 14,469,050(0.00%)#2,278 |
| 19. | York | 535 | 91,013(0.59%)#19 | 14,469,050(0.00%)#2,403 |
| 20. | Erie | 461 | 91,013(0.51%)#20 | 14,469,050(0.00%)#2,626 |
| 21. | Hanover Borough | 448 | 91,013(0.49%)#21 | 14,469,050(0.00%)#2,673 |
| 22. | Lancaster | 447 | 91,013(0.49%)#22 | 14,469,050(0.00%)#2,677 |
| 23. | Toughkenamon | 433 | 91,013(0.48%)#23 | 14,469,050(0.00%)#2,726 |
| 24. | Souderton Borough | 425 | 91,013(0.47%)#24 | 14,469,050(0.00%)#2,752 |
| 25. | Quakertown Borough | 422 | 91,013(0.46%)#25 | 14,469,050(0.00%)#2,765 |
| 26. | Pottstown Borough | 397 | 91,013(0.44%)#26 | 14,469,050(0.00%)#2,866 |
| 27. | Lansdale Borough | 376 | 91,013(0.41%)#27 | 14,469,050(0.00%)#2,964 |
| 28. | Bressler | 358 | 91,013(0.39%)#28 | 14,469,050(0.00%)#3,042 |
| 29. | Breinigsville | 320 | 91,013(0.35%)#29 | 14,469,050(0.00%)#3,234 |
| 30. | West Hazleton Borough | 292 | 91,013(0.32%)#30 | 14,469,050(0.00%)#3,398 |
| 31. | West Chester Borough | 278 | 91,013(0.31%)#31 | 14,469,050(0.00%)#3,495 |
| 32. | West Grove Borough | 273 | 91,013(0.30%)#32 | 14,469,050(0.00%)#3,537 |
| 33. | Queens Gate | 263 | 91,013(0.29%)#33 | 14,469,050(0.00%)#3,618 |
| 34. | Collingdale Borough | 254 | 91,013(0.28%)#34 | 14,469,050(0.00%)#3,674 |
| 35. | Moosic Borough | 240 | 91,013(0.26%)#35 | 14,469,050(0.00%)#3,783 |
| 36. | Fullerton | 232 | 91,013(0.25%)#36 | 14,469,050(0.00%)#3,841 |
| 37. | York Springs Borough | 222 | 91,013(0.24%)#37 | 14,469,050(0.00%)#3,916 |
| 38. | Fountain Hill Borough | 211 | 91,013(0.23%)#38 | 14,469,050(0.00%)#4,012 |
| 39. | Guilford | 202 | 91,013(0.22%)#39 | 14,469,050(0.00%)#4,108 |
| 40. | Mont Clare | 200 | 91,013(0.22%)#40 | 14,469,050(0.00%)#4,130 |
| 41. | Lebanon | 199 | 91,013(0.22%)#41 | 14,469,050(0.00%)#4,136 |
| 42. | Nottingham | 189 | 91,013(0.21%)#42 | 14,469,050(0.00%)#4,277 |
| 43. | Gettysburg Borough | 188 | 91,013(0.21%)#43 | 14,469,050(0.00%)#4,286 |
| 44. | Tamaqua Borough | 184 | 91,013(0.20%)#44 | 14,469,050(0.00%)#4,333 |
| 45. | Wayne | 182 | 91,013(0.20%)#45 | 14,469,050(0.00%)#4,361 |
| 46. | Harrisburg | 179 | 91,013(0.20%)#46 | 14,469,050(0.00%)#4,395 |
| 47. | Sand Hill | 177 | 91,013(0.19%)#47 | 14,469,050(0.00%)#4,443 |
| 48. | Parkesburg Borough | 173 | 91,013(0.19%)#48 | 14,469,050(0.00%)#4,504 |
| 49. | Berwick Borough | 167 | 91,013(0.18%)#49 | 14,469,050(0.00%)#4,572 |
| 50. | Woodlyn | 161 | 91,013(0.18%)#50 | 14,469,050(0.00%)#4,664 |
| 51. | Shenandoah Borough | 157 | 91,013(0.17%)#51 | 14,469,050(0.00%)#4,711 |
| 52. | Mckeesport | 151 | 91,013(0.17%)#52 | 14,469,050(0.00%)#4,797 |
| 53. | King Of Prussia | 149 | 91,013(0.16%)#53 | 14,469,050(0.00%)#4,823 |
| 54. | Chester | 143 | 91,013(0.16%)#54 | 14,469,050(0.00%)#4,912 |
| 55. | Park Forest Village | 142 | 91,013(0.16%)#55 | 14,469,050(0.00%)#4,923 |
| 56. | Blandon | 138 | 91,013(0.15%)#56 | 14,469,050(0.00%)#4,990 |
| 57. | Lehighton Borough | 138 | 91,013(0.15%)#57 | 14,469,050(0.00%)#4,991 |
| 58. | Troy Borough | 134 | 91,013(0.15%)#58 | 14,469,050(0.00%)#5,041 |
| 59. | New Oxford Borough | 132 | 91,013(0.15%)#59 | 14,469,050(0.00%)#5,074 |
| 60. | Valley View Cdp York County | 122 | 91,013(0.13%)#60 | 14,469,050(0.00%)#5,245 |
| 61. | East Stroudsburg Borough | 121 | 91,013(0.13%)#61 | 14,469,050(0.00%)#5,261 |
| 62. | Tyler Run | 121 | 91,013(0.13%)#62 | 14,469,050(0.00%)#5,272 |
| 63. | Wilson Borough | 117 | 91,013(0.13%)#63 | 14,469,050(0.00%)#5,349 |
| 64. | Gratz Borough | 116 | 91,013(0.13%)#64 | 14,469,050(0.00%)#5,380 |
| 65. | Kylertown | 116 | 91,013(0.13%)#65 | 14,469,050(0.00%)#5,382 |
| 66. | Mifflintown Borough | 115 | 91,013(0.13%)#66 | 14,469,050(0.00%)#5,398 |
| 67. | Eagleville Cdp Montgomery County | 112 | 91,013(0.12%)#67 | 14,469,050(0.00%)#5,456 |
| 68. | Bridgeport Borough | 112 | 91,013(0.12%)#68 | 14,469,050(0.00%)#5,457 |
| 69. | Drexel Hill | 111 | 91,013(0.12%)#69 | 14,469,050(0.00%)#5,471 |
| 70. | Dunmore Borough | 104 | 91,013(0.11%)#70 | 14,469,050(0.00%)#5,619 |
| 71. | Castle Shannon Borough | 103 | 91,013(0.11%)#71 | 14,469,050(0.00%)#5,648 |
| 72. | Lincoln Park | 103 | 91,013(0.11%)#72 | 14,469,050(0.00%)#5,659 |
| 73. | Springmont | 103 | 91,013(0.11%)#73 | 14,469,050(0.00%)#5,660 |
| 74. | Emigsville | 101 | 91,013(0.11%)#74 | 14,469,050(0.00%)#5,709 |
| 75. | Swissvale Borough | 100 | 91,013(0.11%)#75 | 14,469,050(0.00%)#5,724 |
| 76. | Sharon Hill Borough | 100 | 91,013(0.11%)#76 | 14,469,050(0.00%)#5,730 |
| 77. | Waynesboro Borough | 98 | 91,013(0.11%)#77 | 14,469,050(0.00%)#5,775 |
| 78. | Clinton | 97 | 91,013(0.11%)#78 | 14,469,050(0.00%)#5,812 |
| 79. | Bradford | 96 | 91,013(0.11%)#79 | 14,469,050(0.00%)#5,821 |
| 80. | Hellertown Borough | 96 | 91,013(0.11%)#80 | 14,469,050(0.00%)#5,823 |
| 81. | Shillington Borough | 95 | 91,013(0.10%)#81 | 14,469,050(0.00%)#5,845 |
| 82. | Frazer | 95 | 91,013(0.10%)#82 | 14,469,050(0.00%)#5,848 |
| 83. | Washington | 94 | 91,013(0.10%)#83 | 14,469,050(0.00%)#5,858 |
| 84. | Plymouth Meeting | 93 | 91,013(0.10%)#84 | 14,469,050(0.00%)#5,892 |
| 85. | Hyde Park | 93 | 91,013(0.10%)#85 | 14,469,050(0.00%)#5,900 |
| 86. | Pennville | 93 | 91,013(0.10%)#86 | 14,469,050(0.00%)#5,901 |
| 87. | Spring House | 91 | 91,013(0.10%)#87 | 14,469,050(0.00%)#5,954 |
| 88. | Pine Ridge | 91 | 91,013(0.10%)#88 | 14,469,050(0.00%)#5,959 |
| 89. | Monroeville | 90 | 91,013(0.10%)#89 | 14,469,050(0.00%)#5,976 |
| 90. | Lansdowne Borough | 89 | 91,013(0.10%)#90 | 14,469,050(0.00%)#6,005 |
| 91. | Bendersville Borough | 89 | 91,013(0.10%)#91 | 14,469,050(0.00%)#6,028 |
| 92. | Hatboro Borough | 87 | 91,013(0.10%)#92 | 14,469,050(0.00%)#6,068 |
| 93. | Ambler Borough | 87 | 91,013(0.10%)#93 | 14,469,050(0.00%)#6,069 |
| 94. | Emerald Lakes | 87 | 91,013(0.10%)#94 | 14,469,050(0.00%)#6,073 |
| 95. | Ephrata Borough | 86 | 91,013(0.09%)#95 | 14,469,050(0.00%)#6,084 |
| 96. | State College Borough | 84 | 91,013(0.09%)#96 | 14,469,050(0.00%)#6,128 |
| 97. | Wyomissing Borough | 84 | 91,013(0.09%)#97 | 14,469,050(0.00%)#6,134 |
| 98. | Nanticoke | 83 | 91,013(0.09%)#98 | 14,469,050(0.00%)#6,173 |
| 99. | Plains | 82 | 91,013(0.09%)#99 | 14,469,050(0.00%)#6,209 |
| 100. | Brownstown | 79 | 91,013(0.09%)#100 | 14,469,050(0.00%)#6,305 |
Common Questions
What are the Top 10 Cities with the Most Immigrants from Central America in Pennsylvania?
Top 10 Cities with the Most Immigrants from Central America in Pennsylvania are:
#1
18,312
#2
5,917
#3
2,287
#4
1,602
#5
1,595
#6
1,072
#7
979
#8
936
#9
920
#10
866
What city has the Most Immigrants from Central America in Pennsylvania?
Philadelphia has the Most Immigrants from Central America in Pennsylvania with 18,312.
What is the Total Immigrants from Central America in the State of Pennsylvania?
Total Immigrants from Central America in Pennsylvania is 91,013.
What is the Total Immigrants from Central America in the United States?
Total Immigrants from Central America in the United States is 14,469,050.