Cities with the Most Immigrants from Ireland in Pennsylvania
RELATED REPORTS & OPTIONS
Ireland
Pennsylvania
Compare Cities
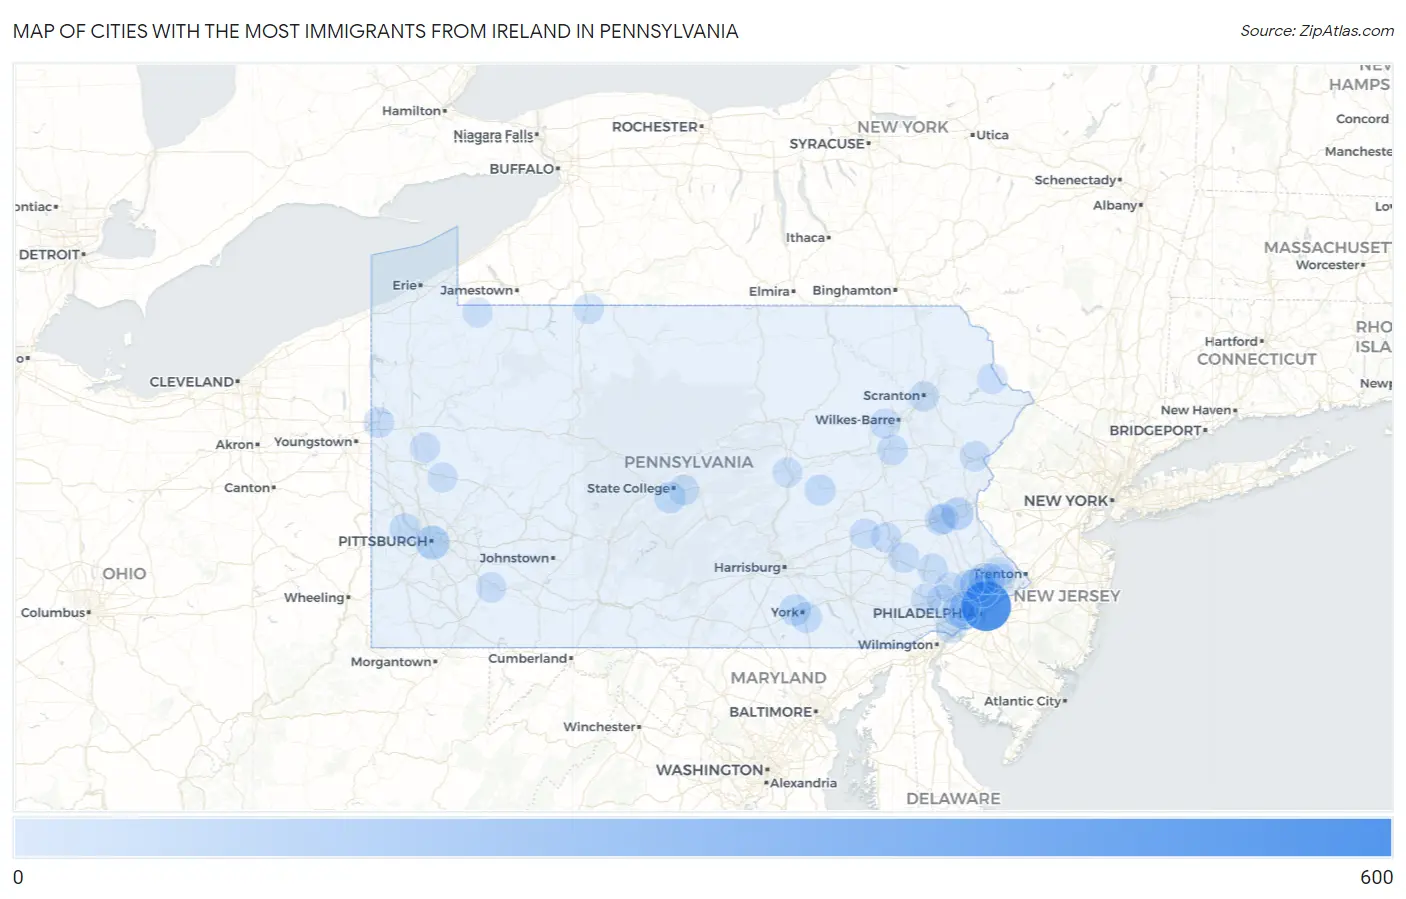
Map of Cities with the Most Immigrants from Ireland in Pennsylvania
0
600
Cities with the Most Immigrants from Ireland in Pennsylvania
| City | Ireland | vs State | vs National | |
| 1. | Philadelphia | 590 | 4,198(14.05%)#1 | 119,836(0.49%)#9 |
| 2. | Fort Washington | 131 | 4,198(3.12%)#2 | 119,836(0.11%)#101 |
| 3. | Pittsburgh | 112 | 4,198(2.67%)#3 | 119,836(0.09%)#127 |
| 4. | Bethlehem | 66 | 4,198(1.57%)#4 | 119,836(0.06%)#274 |
| 5. | Broomall | 61 | 4,198(1.45%)#5 | 119,836(0.05%)#303 |
| 6. | Glenside | 60 | 4,198(1.43%)#6 | 119,836(0.05%)#310 |
| 7. | Olyphant Borough | 50 | 4,198(1.19%)#7 | 119,836(0.04%)#383 |
| 8. | Kenhorst Borough | 50 | 4,198(1.19%)#8 | 119,836(0.04%)#384 |
| 9. | Media Borough | 44 | 4,198(1.05%)#9 | 119,836(0.04%)#446 |
| 10. | Pine Grove Mills | 39 | 4,198(0.93%)#10 | 119,836(0.03%)#525 |
| 11. | Shiloh | 37 | 4,198(0.88%)#11 | 119,836(0.03%)#554 |
| 12. | Village Green Green Ridge | 37 | 4,198(0.88%)#12 | 119,836(0.03%)#555 |
| 13. | Drexel Hill | 33 | 4,198(0.79%)#13 | 119,836(0.03%)#614 |
| 14. | Dickson City Borough | 33 | 4,198(0.79%)#14 | 119,836(0.03%)#625 |
| 15. | Lititz Borough | 32 | 4,198(0.76%)#15 | 119,836(0.03%)#647 |
| 16. | Wilson Borough | 31 | 4,198(0.74%)#16 | 119,836(0.03%)#674 |
| 17. | Tyler Run | 30 | 4,198(0.71%)#17 | 119,836(0.03%)#692 |
| 18. | Narberth Borough | 28 | 4,198(0.67%)#18 | 119,836(0.02%)#739 |
| 19. | Harveys Lake Borough | 28 | 4,198(0.67%)#19 | 119,836(0.02%)#740 |
| 20. | New Freedom Borough | 27 | 4,198(0.64%)#20 | 119,836(0.02%)#759 |
| 21. | Hanover Borough | 25 | 4,198(0.60%)#21 | 119,836(0.02%)#807 |
| 22. | Carnot Moon | 25 | 4,198(0.60%)#22 | 119,836(0.02%)#809 |
| 23. | Fairview Ferndale | 25 | 4,198(0.60%)#23 | 119,836(0.02%)#821 |
| 24. | Norwood Borough | 24 | 4,198(0.57%)#24 | 119,836(0.02%)#841 |
| 25. | Horsham | 23 | 4,198(0.55%)#25 | 119,836(0.02%)#866 |
| 26. | Boalsburg | 23 | 4,198(0.55%)#26 | 119,836(0.02%)#874 |
| 27. | Churchville | 22 | 4,198(0.52%)#27 | 119,836(0.02%)#919 |
| 28. | Richboro | 21 | 4,198(0.50%)#28 | 119,836(0.02%)#950 |
| 29. | Jacksonwald | 21 | 4,198(0.50%)#29 | 119,836(0.02%)#954 |
| 30. | Franklin Park Borough | 20 | 4,198(0.48%)#30 | 119,836(0.02%)#985 |
| 31. | Lansdowne Borough | 18 | 4,198(0.43%)#31 | 119,836(0.02%)#1,066 |
| 32. | Beech Mountain Lakes | 18 | 4,198(0.43%)#32 | 119,836(0.02%)#1,074 |
| 33. | Doylestown Borough | 17 | 4,198(0.40%)#33 | 119,836(0.01%)#1,113 |
| 34. | Oakmont Borough | 17 | 4,198(0.40%)#34 | 119,836(0.01%)#1,116 |
| 35. | Hermitage | 16 | 4,198(0.38%)#35 | 119,836(0.01%)#1,144 |
| 36. | Warminster Heights | 16 | 4,198(0.38%)#36 | 119,836(0.01%)#1,162 |
| 37. | Trafford Borough | 16 | 4,198(0.38%)#37 | 119,836(0.01%)#1,164 |
| 38. | Arlington Heights | 15 | 4,198(0.36%)#38 | 119,836(0.01%)#1,213 |
| 39. | Dorneyville | 15 | 4,198(0.36%)#39 | 119,836(0.01%)#1,219 |
| 40. | West Mifflin Borough | 14 | 4,198(0.33%)#40 | 119,836(0.01%)#1,263 |
| 41. | Phoenixville Borough | 14 | 4,198(0.33%)#41 | 119,836(0.01%)#1,264 |
| 42. | Paoli | 14 | 4,198(0.33%)#42 | 119,836(0.01%)#1,283 |
| 43. | Dauberville | 14 | 4,198(0.33%)#43 | 119,836(0.01%)#1,294 |
| 44. | Scranton | 13 | 4,198(0.31%)#44 | 119,836(0.01%)#1,305 |
| 45. | Jefferson Hills Borough | 12 | 4,198(0.29%)#45 | 119,836(0.01%)#1,386 |
| 46. | Bryn Athyn Borough | 12 | 4,198(0.29%)#46 | 119,836(0.01%)#1,409 |
| 47. | Allentown | 11 | 4,198(0.26%)#47 | 119,836(0.01%)#1,415 |
| 48. | New Cumberland Borough | 11 | 4,198(0.26%)#48 | 119,836(0.01%)#1,453 |
| 49. | West Chester Borough | 10 | 4,198(0.24%)#49 | 119,836(0.01%)#1,511 |
| 50. | Wilkinsburg Borough | 10 | 4,198(0.24%)#50 | 119,836(0.01%)#1,518 |
| 51. | Audubon | 10 | 4,198(0.24%)#51 | 119,836(0.01%)#1,528 |
| 52. | Lionville | 10 | 4,198(0.24%)#52 | 119,836(0.01%)#1,538 |
| 53. | Clearfield Borough | 10 | 4,198(0.24%)#53 | 119,836(0.01%)#1,541 |
| 54. | Fox Chapel Borough | 10 | 4,198(0.24%)#54 | 119,836(0.01%)#1,545 |
| 55. | Denver Borough | 10 | 4,198(0.24%)#55 | 119,836(0.01%)#1,549 |
| 56. | Columbia Borough | 9 | 4,198(0.21%)#56 | 119,836(0.01%)#1,604 |
| 57. | Roslyn | 9 | 4,198(0.21%)#57 | 119,836(0.01%)#1,605 |
| 58. | Blue Bell | 9 | 4,198(0.21%)#58 | 119,836(0.01%)#1,613 |
| 59. | Jenkintown Borough | 9 | 4,198(0.21%)#59 | 119,836(0.01%)#1,619 |
| 60. | Bear Rocks | 9 | 4,198(0.21%)#60 | 119,836(0.01%)#1,632 |
| 61. | Rosemont | 8 | 4,198(0.19%)#61 | 119,836(0.01%)#1,725 |
| 62. | Myerstown Borough | 8 | 4,198(0.19%)#62 | 119,836(0.01%)#1,731 |
| 63. | Fawn Lake Forest | 8 | 4,198(0.19%)#63 | 119,836(0.01%)#1,743 |
| 64. | West Nanticoke | 8 | 4,198(0.19%)#64 | 119,836(0.01%)#1,745 |
| 65. | Strausstown | 8 | 4,198(0.19%)#65 | 119,836(0.01%)#1,746 |
| 66. | Sanatoga | 7 | 4,198(0.17%)#66 | 119,836(0.01%)#1,796 |
| 67. | Glenolden Borough | 7 | 4,198(0.17%)#67 | 119,836(0.01%)#1,798 |
| 68. | Slippery Rock Borough | 7 | 4,198(0.17%)#68 | 119,836(0.01%)#1,812 |
| 69. | Cove Forge | 7 | 4,198(0.17%)#69 | 119,836(0.01%)#1,832 |
| 70. | Ardmore | 6 | 4,198(0.14%)#70 | 119,836(0.01%)#1,867 |
| 71. | West Wyoming Borough | 6 | 4,198(0.14%)#71 | 119,836(0.01%)#1,890 |
| 72. | Rose Valley Borough | 6 | 4,198(0.14%)#72 | 119,836(0.01%)#1,901 |
| 73. | Foster Brook | 6 | 4,198(0.14%)#73 | 119,836(0.01%)#1,902 |
| 74. | North Braddock Borough | 5 | 4,198(0.12%)#74 | 119,836(0.00%)#1,944 |
| 75. | Edgewood Borough | 5 | 4,198(0.12%)#75 | 119,836(0.00%)#1,949 |
| 76. | Slippery Rock University | 5 | 4,198(0.12%)#76 | 119,836(0.00%)#1,953 |
| 77. | Rockledge Borough | 5 | 4,198(0.12%)#77 | 119,836(0.00%)#1,954 |
| 78. | Villanova | 4 | 4,198(0.10%)#78 | 119,836(0.00%)#2,009 |
| 79. | Kennett Square Borough | 4 | 4,198(0.10%)#79 | 119,836(0.00%)#2,012 |
| 80. | Bedford Borough | 4 | 4,198(0.10%)#80 | 119,836(0.00%)#2,020 |
| 81. | Edgeworth Borough | 4 | 4,198(0.10%)#81 | 119,836(0.00%)#2,031 |
| 82. | East Brady Borough | 4 | 4,198(0.10%)#82 | 119,836(0.00%)#2,035 |
| 83. | Ben Avon Borough | 3 | 4,198(0.07%)#83 | 119,836(0.00%)#2,083 |
| 84. | Braddock Hills Borough | 3 | 4,198(0.07%)#84 | 119,836(0.00%)#2,088 |
| 85. | Clarks Green Borough | 3 | 4,198(0.07%)#85 | 119,836(0.00%)#2,090 |
| 86. | Dalton Borough | 3 | 4,198(0.07%)#86 | 119,836(0.00%)#2,099 |
| 87. | New Salem Borough | 3 | 4,198(0.07%)#87 | 119,836(0.00%)#2,110 |
| 88. | Columbus | 3 | 4,198(0.07%)#88 | 119,836(0.00%)#2,117 |
| 89. | Winfield | 3 | 4,198(0.07%)#89 | 119,836(0.00%)#2,118 |
| 90. | Dunlevy Borough | 3 | 4,198(0.07%)#90 | 119,836(0.00%)#2,129 |
| 91. | Butler | 2 | 4,198(0.05%)#91 | 119,836(0.00%)#2,145 |
| 92. | Camp Hill Borough | 1 | 4,198(0.02%)#92 | 119,836(0.00%)#2,213 |
| 93. | Lemoyne Borough | 1 | 4,198(0.02%)#93 | 119,836(0.00%)#2,224 |
| 94. | Wormleysburg Borough | 1 | 4,198(0.02%)#94 | 119,836(0.00%)#2,230 |
| 95. | Lenhartsville Borough | 1 | 4,198(0.02%)#95 | 119,836(0.00%)#2,243 |
Common Questions
What are the Top 10 Cities with the Most Immigrants from Ireland in Pennsylvania?
Top 10 Cities with the Most Immigrants from Ireland in Pennsylvania are:
#1
590
#2
131
#3
112
#4
66
#5
61
#6
60
#7
39
#8
37
#9
37
#10
33
What city has the Most Immigrants from Ireland in Pennsylvania?
Philadelphia has the Most Immigrants from Ireland in Pennsylvania with 590.
What is the Total Immigrants from Ireland in the State of Pennsylvania?
Total Immigrants from Ireland in Pennsylvania is 4,198.
What is the Total Immigrants from Ireland in the United States?
Total Immigrants from Ireland in the United States is 119,836.