Cities with the Most Immigrants from Panama in Pennsylvania
RELATED REPORTS & OPTIONS
Panama
Pennsylvania
Compare Cities
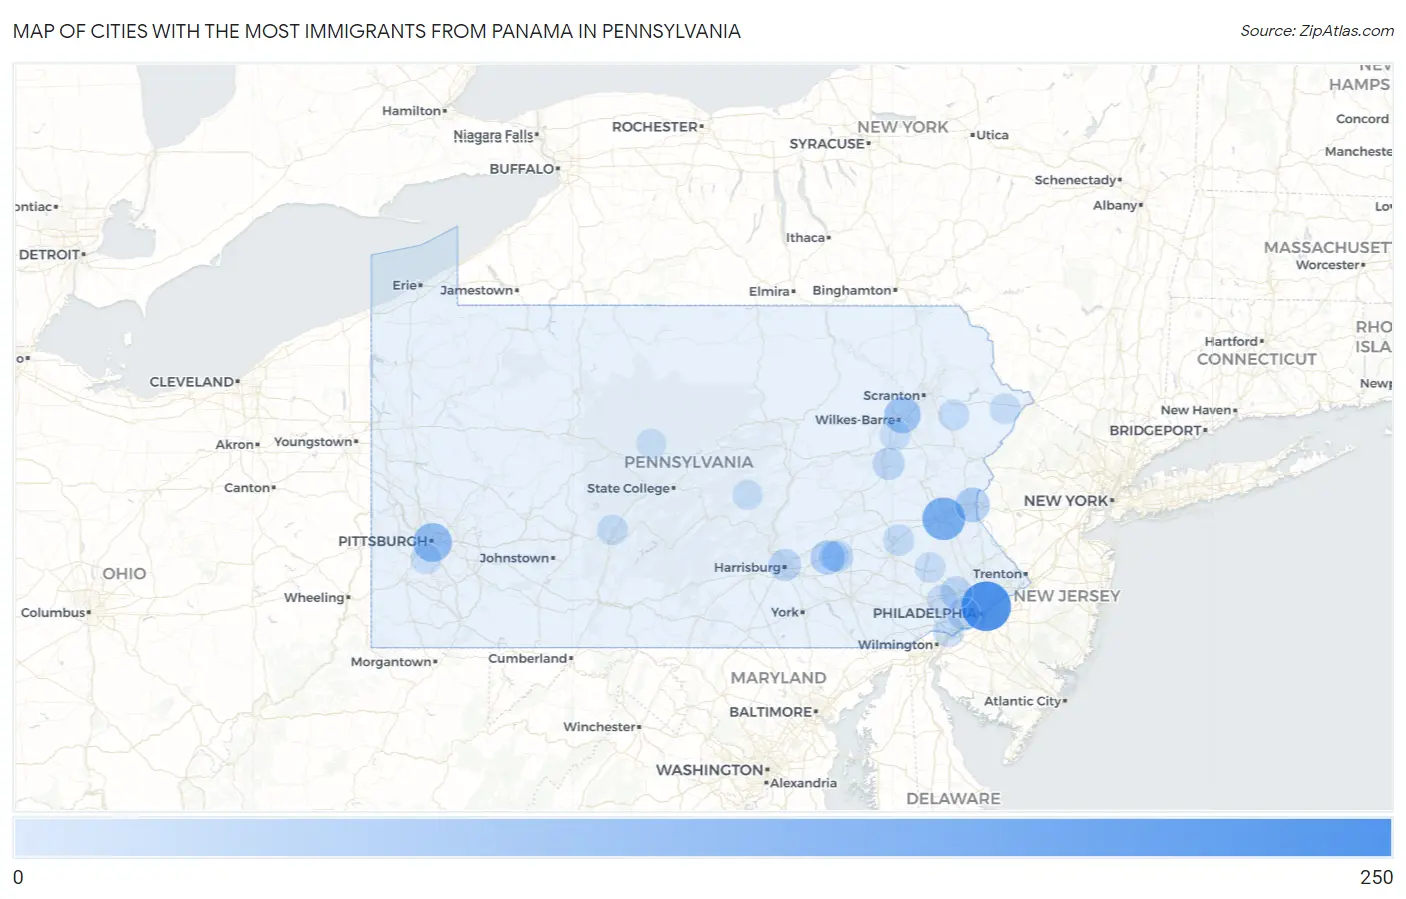
Map of Cities with the Most Immigrants from Panama in Pennsylvania
0
250
Cities with the Most Immigrants from Panama in Pennsylvania
| City | Panama | vs State | vs National | |
| 1. | Philadelphia | 236 | 1,902(12.41%)#1 | 105,274(0.22%)#49 |
| 2. | Allentown | 151 | 1,902(7.94%)#2 | 105,274(0.14%)#98 |
| 3. | Pittsburgh | 104 | 1,902(5.47%)#3 | 105,274(0.10%)#159 |
| 4. | Plains | 76 | 1,902(4.00%)#4 | 105,274(0.07%)#233 |
| 5. | Mount Pocono Borough | 64 | 1,902(3.36%)#5 | 105,274(0.06%)#293 |
| 6. | Easton | 55 | 1,902(2.89%)#6 | 105,274(0.05%)#344 |
| 7. | Annville | 48 | 1,902(2.52%)#7 | 105,274(0.05%)#398 |
| 8. | Baldwin Borough | 47 | 1,902(2.47%)#8 | 105,274(0.04%)#410 |
| 9. | Norristown Borough | 38 | 1,902(2.00%)#9 | 105,274(0.04%)#487 |
| 10. | Harrisburg | 26 | 1,902(1.37%)#10 | 105,274(0.02%)#660 |
| 11. | Drexel Hill | 25 | 1,902(1.31%)#11 | 105,274(0.02%)#688 |
| 12. | King Of Prussia | 25 | 1,902(1.31%)#12 | 105,274(0.02%)#690 |
| 13. | Hazleton | 24 | 1,902(1.26%)#13 | 105,274(0.02%)#710 |
| 14. | Sewickley Borough | 22 | 1,902(1.16%)#14 | 105,274(0.02%)#772 |
| 15. | Lebanon | 20 | 1,902(1.05%)#15 | 105,274(0.02%)#814 |
| 16. | Dunmore Borough | 19 | 1,902(1.00%)#16 | 105,274(0.02%)#847 |
| 17. | West Chester Borough | 18 | 1,902(0.95%)#17 | 105,274(0.02%)#869 |
| 18. | State College Borough | 17 | 1,902(0.89%)#18 | 105,274(0.02%)#893 |
| 19. | Boothwyn | 17 | 1,902(0.89%)#19 | 105,274(0.02%)#917 |
| 20. | Blandon | 16 | 1,902(0.84%)#20 | 105,274(0.02%)#944 |
| 21. | Pocono Springs | 12 | 1,902(0.63%)#21 | 105,274(0.01%)#1,113 |
| 22. | Harmony Borough | 11 | 1,902(0.58%)#22 | 105,274(0.01%)#1,158 |
| 23. | Wyomissing Borough | 9 | 1,902(0.47%)#23 | 105,274(0.01%)#1,232 |
| 24. | Robesonia Borough | 9 | 1,902(0.47%)#24 | 105,274(0.01%)#1,244 |
| 25. | Bethel Park | 8 | 1,902(0.42%)#25 | 105,274(0.01%)#1,269 |
| 26. | Paoli | 8 | 1,902(0.42%)#26 | 105,274(0.01%)#1,294 |
| 27. | Gold Key Lake | 8 | 1,902(0.42%)#27 | 105,274(0.01%)#1,300 |
| 28. | Dauphin Borough | 8 | 1,902(0.42%)#28 | 105,274(0.01%)#1,302 |
| 29. | Altoona | 7 | 1,902(0.37%)#29 | 105,274(0.01%)#1,318 |
| 30. | Mountain Top | 7 | 1,902(0.37%)#30 | 105,274(0.01%)#1,343 |
| 31. | Pleasant Hill | 7 | 1,902(0.37%)#31 | 105,274(0.01%)#1,353 |
| 32. | Dillsburg Borough | 7 | 1,902(0.37%)#32 | 105,274(0.01%)#1,359 |
| 33. | Pottsgrove | 6 | 1,902(0.32%)#33 | 105,274(0.01%)#1,396 |
| 34. | Mars Borough | 5 | 1,902(0.26%)#34 | 105,274(0.00%)#1,440 |
| 35. | West Reading Borough | 4 | 1,902(0.21%)#35 | 105,274(0.00%)#1,469 |
| 36. | Ferndale Borough | 3 | 1,902(0.16%)#36 | 105,274(0.00%)#1,525 |
| 37. | Beaver Springs | 2 | 1,902(0.11%)#37 | 105,274(0.00%)#1,564 |
| 38. | Pine Glen | 1 | 1,902(0.05%)#38 | 105,274(0.00%)#1,610 |
Common Questions
What are the Top 10 Cities with the Most Immigrants from Panama in Pennsylvania?
Top 10 Cities with the Most Immigrants from Panama in Pennsylvania are:
#1
236
#2
151
#3
104
#4
76
#5
55
#6
48
#7
26
#8
25
#9
25
#10
24
What city has the Most Immigrants from Panama in Pennsylvania?
Philadelphia has the Most Immigrants from Panama in Pennsylvania with 236.
What is the Total Immigrants from Panama in the State of Pennsylvania?
Total Immigrants from Panama in Pennsylvania is 1,902.
What is the Total Immigrants from Panama in the United States?
Total Immigrants from Panama in the United States is 105,274.