Caln, PA Map & Demographics
Caln Map
Caln Overview
$24,508
PER CAPITA INCOME
$54,728
AVG FAMILY INCOME
$61,908
AVG HOUSEHOLD INCOME
1.3%
WAGE / INCOME GAP [ % ]
98.7¢/ $1
WAGE / INCOME GAP [ $ ]
0.24
INEQUALITY / GINI INDEX
1,463
TOTAL POPULATION
696
MALE POPULATION
767
FEMALE POPULATION
90.74
MALES / 100 FEMALES
110.20
FEMALES / 100 MALES
31.4
MEDIAN AGE
3.4
AVG FAMILY SIZE
2.9
AVG HOUSEHOLD SIZE
725
LABOR FORCE [ PEOPLE ]
74.7%
PERCENT IN LABOR FORCE
7.0%
UNEMPLOYMENT RATE
Income in Caln
Income Overview in Caln
Per Capita Income in Caln is $24,508, while median incomes of families and households are $54,728 and $61,908 respectively.
| Characteristic | Number | Measure |
| Per Capita Income | 1,463 | $24,508 |
| Median Family Income | 386 | $54,728 |
| Mean Family Income | 386 | $72,065 |
| Median Household Income | 503 | $61,908 |
| Mean Household Income | 503 | $72,455 |
| Income Deficit | 386 | $0 |
| Wage / Income Gap (%) | 1,463 | 1.31% |
| Wage / Income Gap ($) | 1,463 | 98.69¢ per $1 |
| Gini / Inequality Index | 1,463 | 0.24 |
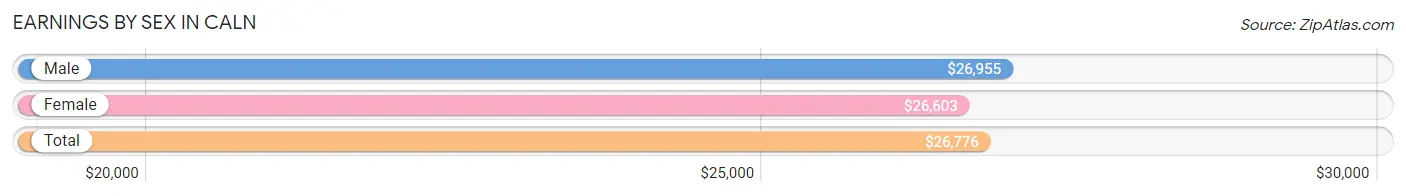
Earnings by Sex in Caln
Average Earnings in Caln are $26,776, $26,955 for men and $26,603 for women, a difference of 1.3%.
| Sex | Number | Average Earnings |
| Male | 336 (47.0%) | $26,955 |
| Female | 379 (53.0%) | $26,603 |
| Total | 715 (100.0%) | $26,776 |
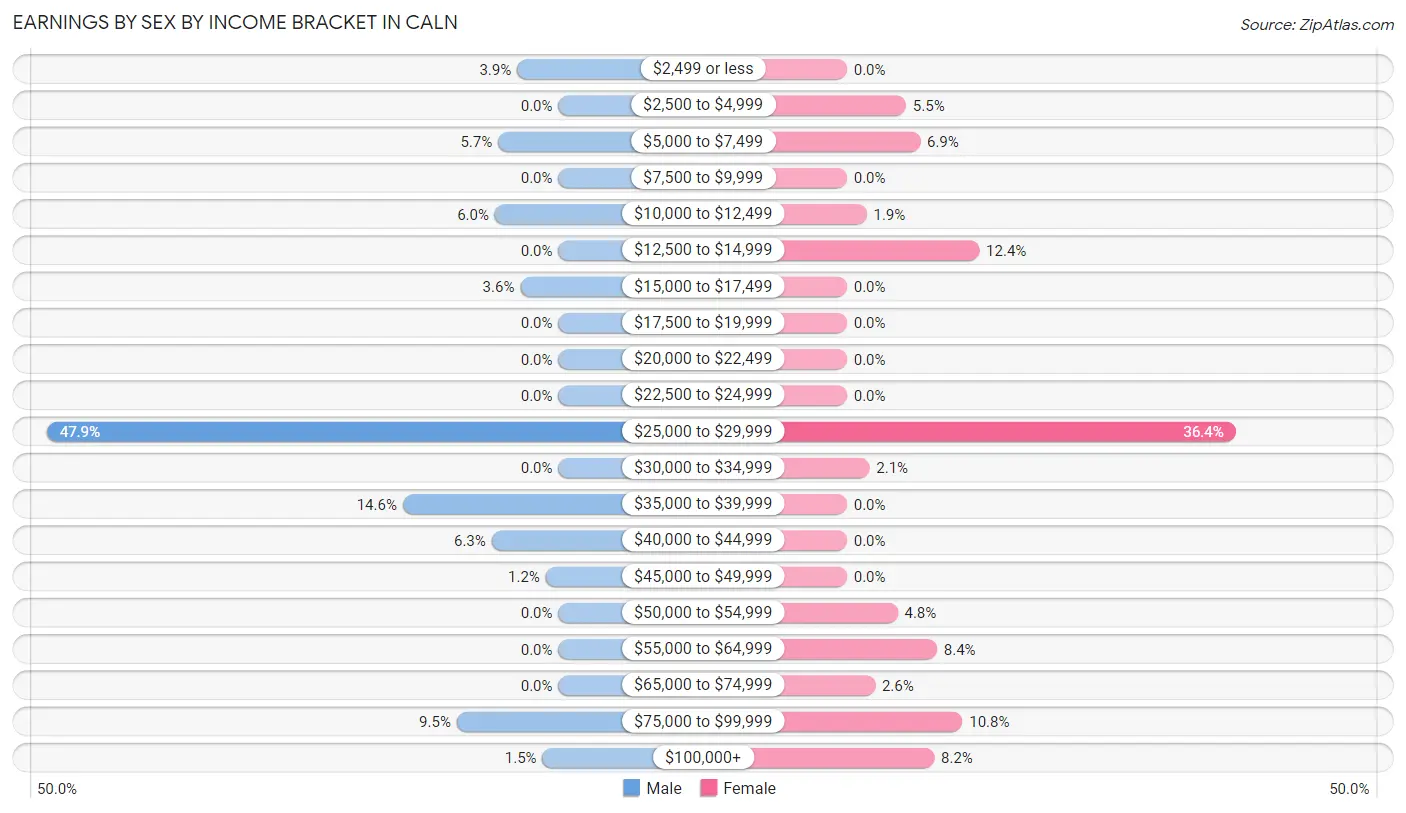
Earnings by Sex by Income Bracket in Caln
The most common earnings brackets in Caln are $25,000 to $29,999 for men (161 | 47.9%) and $25,000 to $29,999 for women (138 | 36.4%).
| Income | Male | Female |
| $2,499 or less | 13 (3.9%) | 0 (0.0%) |
| $2,500 to $4,999 | 0 (0.0%) | 21 (5.5%) |
| $5,000 to $7,499 | 19 (5.7%) | 26 (6.9%) |
| $7,500 to $9,999 | 0 (0.0%) | 0 (0.0%) |
| $10,000 to $12,499 | 20 (5.9%) | 7 (1.8%) |
| $12,500 to $14,999 | 0 (0.0%) | 47 (12.4%) |
| $15,000 to $17,499 | 12 (3.6%) | 0 (0.0%) |
| $17,500 to $19,999 | 0 (0.0%) | 0 (0.0%) |
| $20,000 to $22,499 | 0 (0.0%) | 0 (0.0%) |
| $22,500 to $24,999 | 0 (0.0%) | 0 (0.0%) |
| $25,000 to $29,999 | 161 (47.9%) | 138 (36.4%) |
| $30,000 to $34,999 | 0 (0.0%) | 8 (2.1%) |
| $35,000 to $39,999 | 49 (14.6%) | 0 (0.0%) |
| $40,000 to $44,999 | 21 (6.2%) | 0 (0.0%) |
| $45,000 to $49,999 | 4 (1.2%) | 0 (0.0%) |
| $50,000 to $54,999 | 0 (0.0%) | 18 (4.8%) |
| $55,000 to $64,999 | 0 (0.0%) | 32 (8.4%) |
| $65,000 to $74,999 | 0 (0.0%) | 10 (2.6%) |
| $75,000 to $99,999 | 32 (9.5%) | 41 (10.8%) |
| $100,000+ | 5 (1.5%) | 31 (8.2%) |
| Total | 336 (100.0%) | 379 (100.0%) |
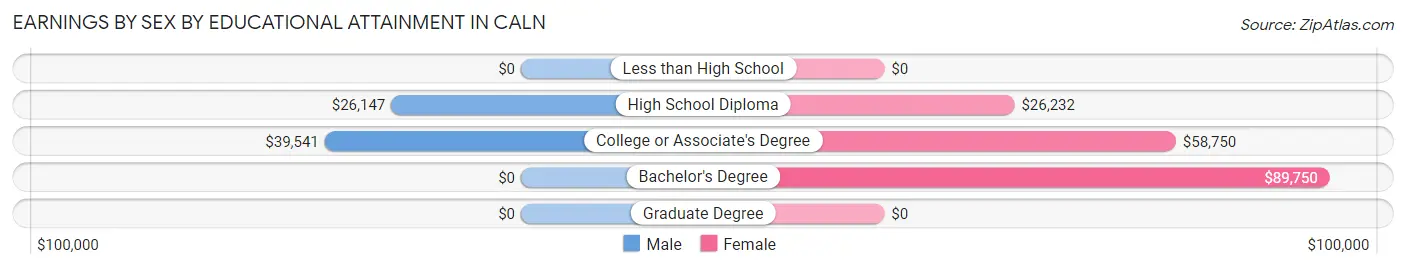
Earnings by Sex by Educational Attainment in Caln
| Educational Attainment | Male Income | Female Income |
| Less than High School | - | - |
| High School Diploma | $26,147 | $26,232 |
| College or Associate's Degree | $39,541 | $58,750 |
| Bachelor's Degree | - | - |
| Graduate Degree | - | - |
| Total | $27,256 | $0 |
Family Income in Caln
Family Income Brackets in Caln
According to the Caln family income data, there are 196 families falling into the $50,000 to $74,999 income range, which is the most common income bracket and makes up 50.8% of all families.
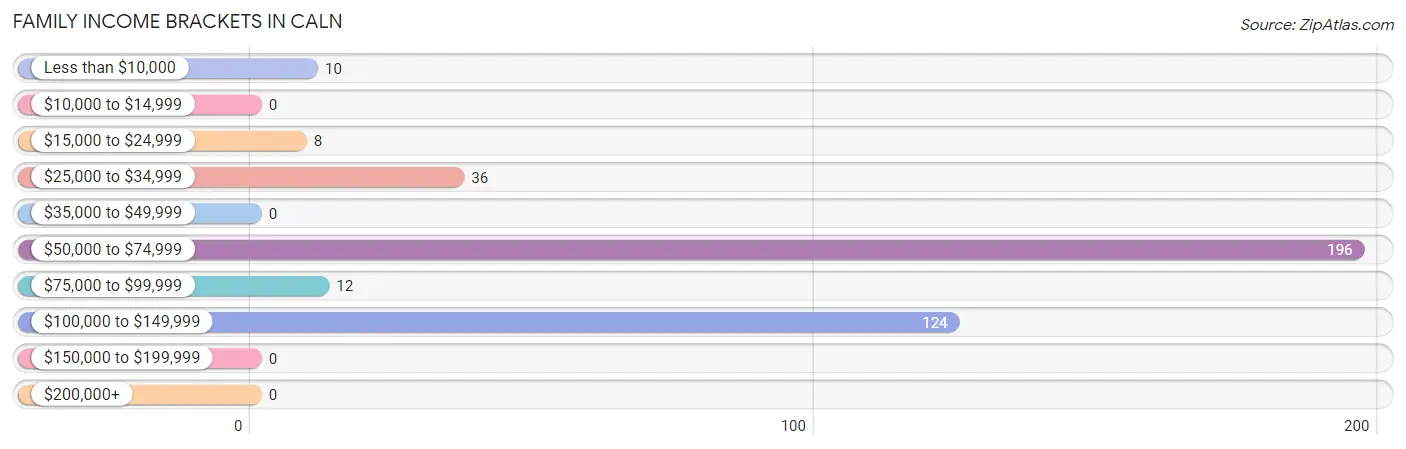
| Income Bracket | # Families | % Families |
| Less than $10,000 | 10 | 2.6% |
| $10,000 to $14,999 | 0 | 0.0% |
| $15,000 to $24,999 | 8 | 2.1% |
| $25,000 to $34,999 | 36 | 9.3% |
| $35,000 to $49,999 | 0 | 0.0% |
| $50,000 to $74,999 | 196 | 50.8% |
| $75,000 to $99,999 | 12 | 3.1% |
| $100,000 to $149,999 | 124 | 32.1% |
| $150,000 to $199,999 | 0 | 0.0% |
| $200,000+ | 0 | 0.0% |
Family Income by Famaliy Size in Caln
2-person families (93 | 24.1%) account for the highest median family income in Caln with $113,092 per family, while 2-person families (93 | 24.1%) have the highest median income of $56,546 per family member.
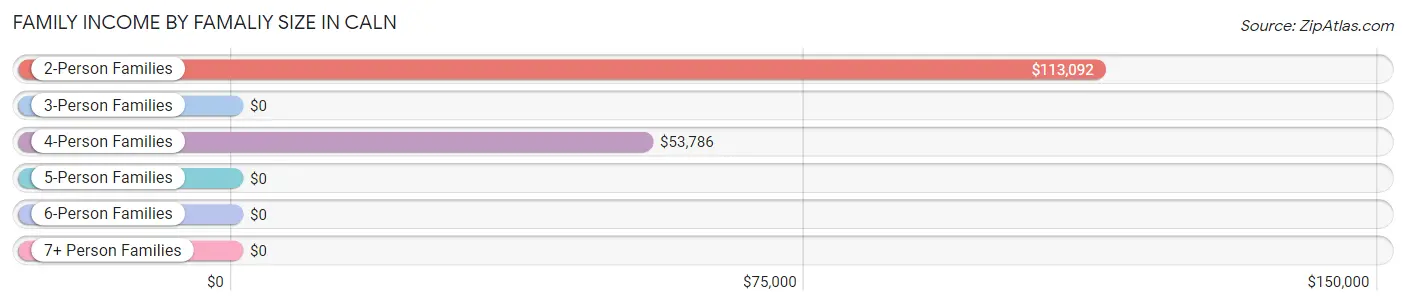
| Income Bracket | # Families | Median Income |
| 2-Person Families | 93 (24.1%) | $113,092 |
| 3-Person Families | 22 (5.7%) | $0 |
| 4-Person Families | 198 (51.3%) | $53,786 |
| 5-Person Families | 73 (18.9%) | $0 |
| 6-Person Families | 0 (0.0%) | $0 |
| 7+ Person Families | 0 (0.0%) | $0 |
| Total | 386 (100.0%) | $54,728 |
Family Income by Number of Earners in Caln
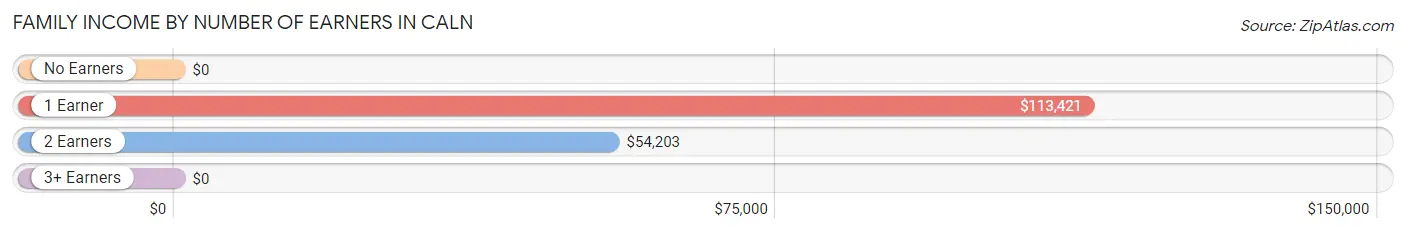
| Number of Earners | # Families | Median Income |
| No Earners | 26 (6.7%) | $0 |
| 1 Earner | 130 (33.7%) | $113,421 |
| 2 Earners | 188 (48.7%) | $54,203 |
| 3+ Earners | 42 (10.9%) | $0 |
| Total | 386 (100.0%) | $54,728 |
Household Income in Caln
Household Income Brackets in Caln
With 240 households falling in the category, the $50,000 to $74,999 income range is the most frequent in Caln, accounting for 47.7% of all households.
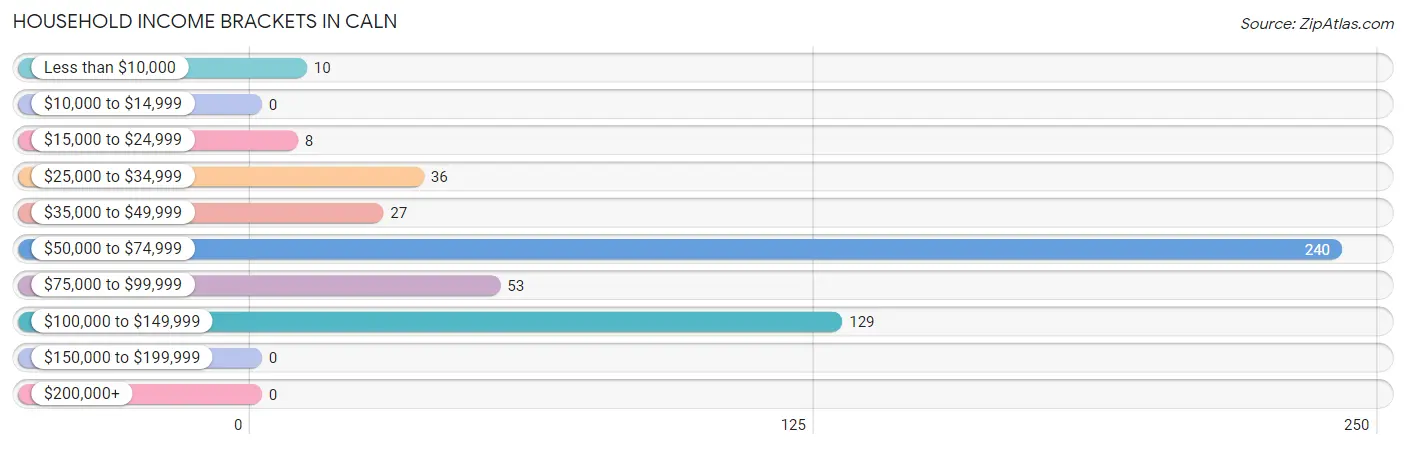
| Income Bracket | # Households | % Households |
| Less than $10,000 | 10 | 2.0% |
| $10,000 to $14,999 | 0 | 0.0% |
| $15,000 to $24,999 | 8 | 1.6% |
| $25,000 to $34,999 | 36 | 7.2% |
| $35,000 to $49,999 | 27 | 5.4% |
| $50,000 to $74,999 | 240 | 47.7% |
| $75,000 to $99,999 | 53 | 10.5% |
| $100,000 to $149,999 | 129 | 25.6% |
| $150,000 to $199,999 | 0 | 0.0% |
| $200,000+ | 0 | 0.0% |
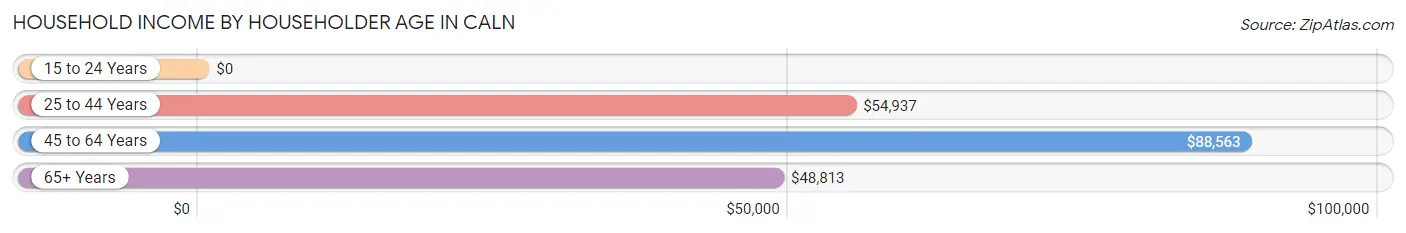
Household Income by Householder Age in Caln
The median household income in Caln is $61,908, with the highest median household income of $88,563 found in the 45 to 64 years age bracket for the primary householder. A total of 147 households (29.2%) fall into this category.
| Income Bracket | # Households | Median Income |
| 15 to 24 Years | 0 (0.0%) | $0 |
| 25 to 44 Years | 289 (57.5%) | $54,937 |
| 45 to 64 Years | 147 (29.2%) | $88,563 |
| 65+ Years | 67 (13.3%) | $48,813 |
| Total | 503 (100.0%) | $61,908 |
Poverty in Caln
Income Below Poverty by Sex and Age in Caln
With 14.2% poverty level for males and 5.7% for females among the residents of Caln, 12 to 14 year old males and 75 year old and over females are the most vulnerable to poverty, with 22 males (100.0%) and 8 females (22.2%) in their respective age groups living below the poverty level.
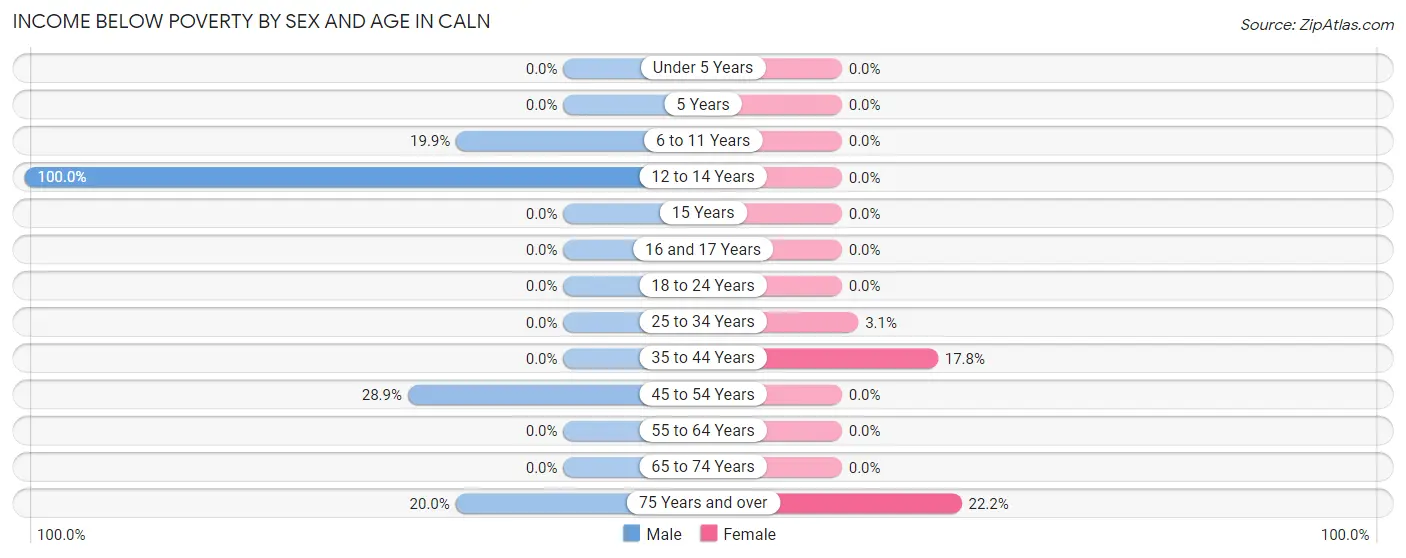
| Age Bracket | Male | Female |
| Under 5 Years | 0 (0.0%) | 0 (0.0%) |
| 5 Years | 0 (0.0%) | 0 (0.0%) |
| 6 to 11 Years | 41 (19.9%) | 0 (0.0%) |
| 12 to 14 Years | 22 (100.0%) | 0 (0.0%) |
| 15 Years | 0 (0.0%) | 0 (0.0%) |
| 16 and 17 Years | 0 (0.0%) | 0 (0.0%) |
| 18 to 24 Years | 0 (0.0%) | 0 (0.0%) |
| 25 to 34 Years | 0 (0.0%) | 5 (3.0%) |
| 35 to 44 Years | 0 (0.0%) | 31 (17.8%) |
| 45 to 54 Years | 28 (28.9%) | 0 (0.0%) |
| 55 to 64 Years | 0 (0.0%) | 0 (0.0%) |
| 65 to 74 Years | 0 (0.0%) | 0 (0.0%) |
| 75 Years and over | 8 (20.0%) | 8 (22.2%) |
| Total | 99 (14.2%) | 44 (5.7%) |
Income Above Poverty by Sex and Age in Caln
According to the poverty statistics in Caln, males aged under 5 years and females aged under 5 years are the age groups that are most secure financially, with 100.0% of males and 100.0% of females in these age groups living above the poverty line.
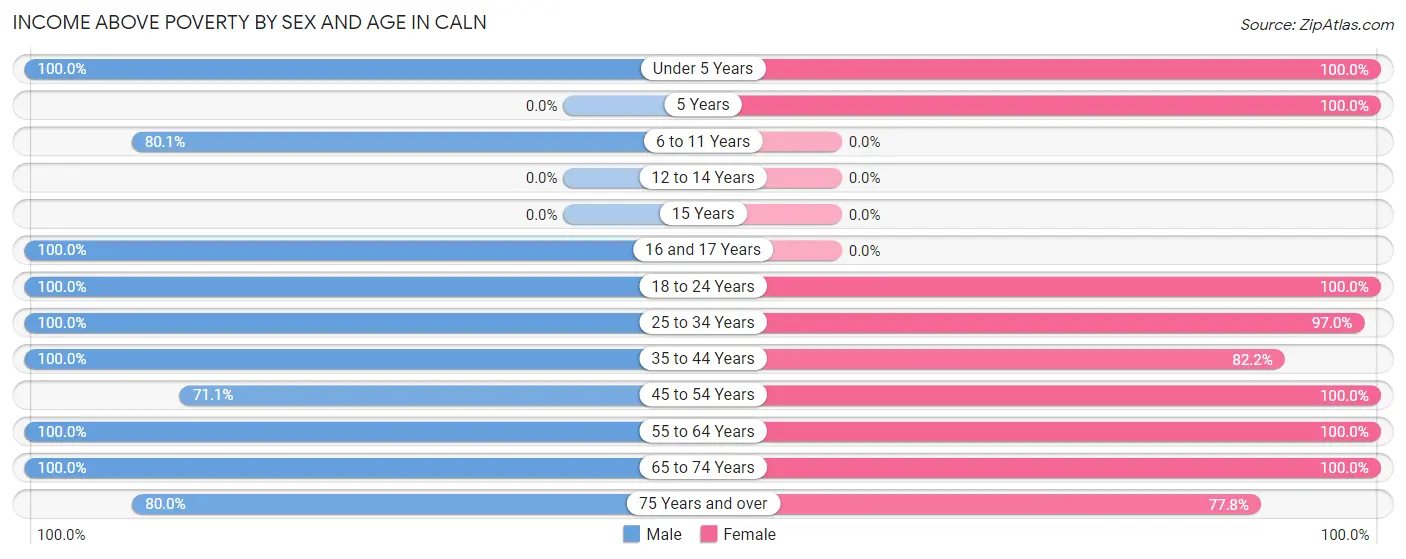
| Age Bracket | Male | Female |
| Under 5 Years | 43 (100.0%) | 190 (100.0%) |
| 5 Years | 0 (0.0%) | 32 (100.0%) |
| 6 to 11 Years | 165 (80.1%) | 0 (0.0%) |
| 12 to 14 Years | 0 (0.0%) | 0 (0.0%) |
| 15 Years | 0 (0.0%) | 0 (0.0%) |
| 16 and 17 Years | 13 (100.0%) | 0 (0.0%) |
| 18 to 24 Years | 19 (100.0%) | 40 (100.0%) |
| 25 to 34 Years | 169 (100.0%) | 159 (97.0%) |
| 35 to 44 Years | 33 (100.0%) | 143 (82.2%) |
| 45 to 54 Years | 69 (71.1%) | 18 (100.0%) |
| 55 to 64 Years | 42 (100.0%) | 79 (100.0%) |
| 65 to 74 Years | 12 (100.0%) | 34 (100.0%) |
| 75 Years and over | 32 (80.0%) | 28 (77.8%) |
| Total | 597 (85.8%) | 723 (94.3%) |
Income Below Poverty Among Married-Couple Families in Caln
The poverty statistics for married-couple families in Caln show that 9.8% or 36 of the total 368 families live below the poverty line. Families with 1 or 2 children have the highest poverty rate of 11.7%, comprising of 28 families. On the other hand, families with 3 or 4 children have the lowest poverty rate of 0.0%, which includes 0 families.
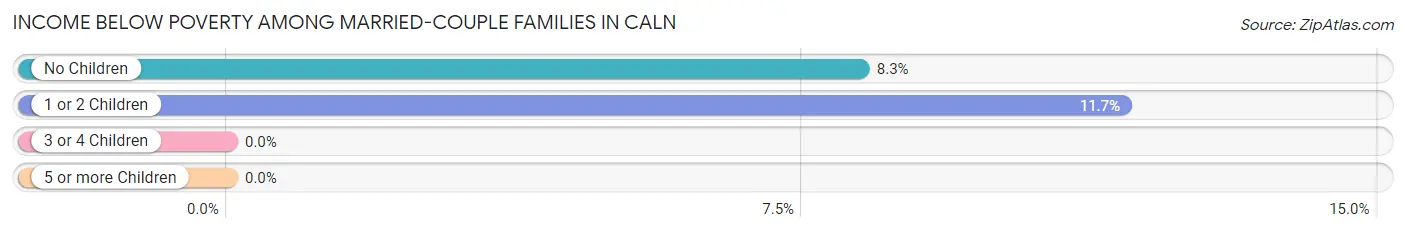
| Children | Above Poverty | Below Poverty |
| No Children | 89 (91.7%) | 8 (8.3%) |
| 1 or 2 Children | 212 (88.3%) | 28 (11.7%) |
| 3 or 4 Children | 31 (100.0%) | 0 (0.0%) |
| 5 or more Children | 0 (0.0%) | 0 (0.0%) |
| Total | 332 (90.2%) | 36 (9.8%) |
Income Below Poverty Among Single-Parent Households in Caln
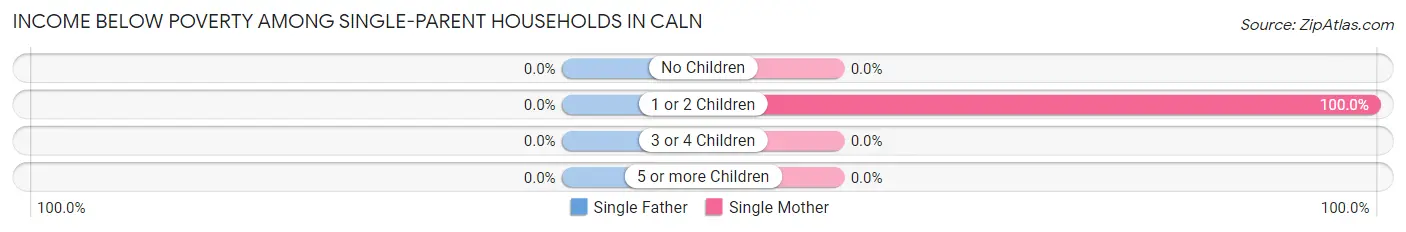
| Children | Single Father | Single Mother |
| No Children | 0 (0.0%) | 0 (0.0%) |
| 1 or 2 Children | 0 (0.0%) | 10 (100.0%) |
| 3 or 4 Children | 0 (0.0%) | 0 (0.0%) |
| 5 or more Children | 0 (0.0%) | 0 (0.0%) |
| Total | 0 (0.0%) | 10 (55.6%) |
Income Below Poverty Among Married-Couple vs Single-Parent Households in Caln
The poverty data for Caln shows that 36 of the married-couple family households (9.8%) and 10 of the single-parent households (55.6%) are living below the poverty level. Within the married-couple family households, those with 1 or 2 children have the highest poverty rate, with 28 households (11.7%) falling below the poverty line. Among the single-parent households, those with 1 or 2 children have the highest poverty rate, with 10 household (100.0%) living below poverty.
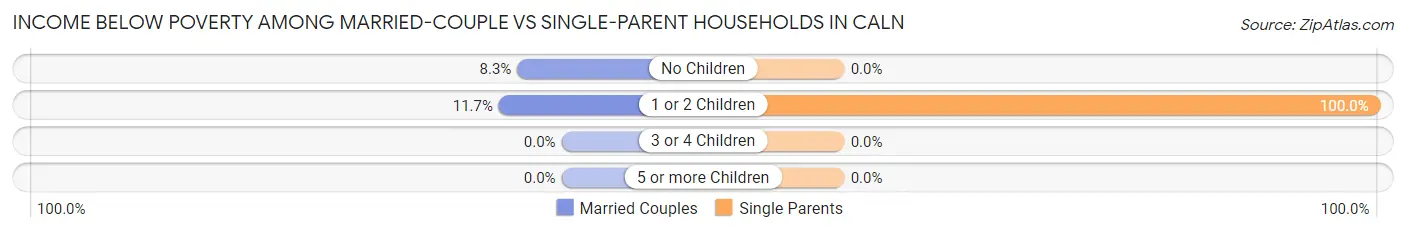
| Children | Married-Couple Families | Single-Parent Households |
| No Children | 8 (8.3%) | 0 (0.0%) |
| 1 or 2 Children | 28 (11.7%) | 10 (100.0%) |
| 3 or 4 Children | 0 (0.0%) | 0 (0.0%) |
| 5 or more Children | 0 (0.0%) | 0 (0.0%) |
| Total | 36 (9.8%) | 10 (55.6%) |
Race in Caln
The most populous races in Caln are White / Caucasian (851 | 58.2%), Black / African American (531 | 36.3%), and Hispanic or Latino (325 | 22.2%).
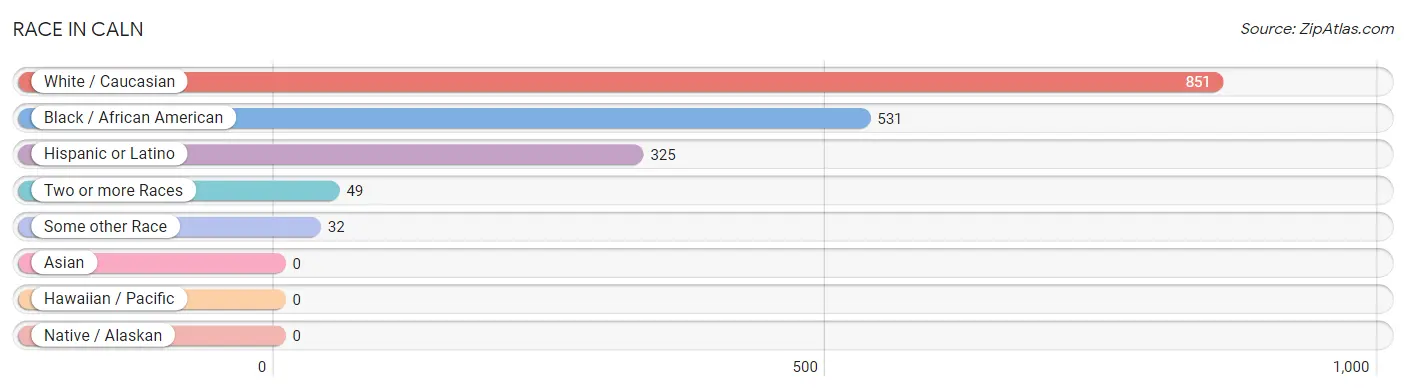
| Race | # Population | % Population |
| Asian | 0 | 0.0% |
| Black / African American | 531 | 36.3% |
| Hawaiian / Pacific | 0 | 0.0% |
| Hispanic or Latino | 325 | 22.2% |
| Native / Alaskan | 0 | 0.0% |
| White / Caucasian | 851 | 58.2% |
| Two or more Races | 49 | 3.4% |
| Some other Race | 32 | 2.2% |
| Total | 1,463 | 100.0% |
Ancestry in Caln
The most populous ancestries reported in Caln are Irish (267 | 18.2%), Ecuadorian (204 | 13.9%), South American (204 | 13.9%), German (163 | 11.1%), and English (140 | 9.6%), together accounting for 66.8% of all Caln residents.
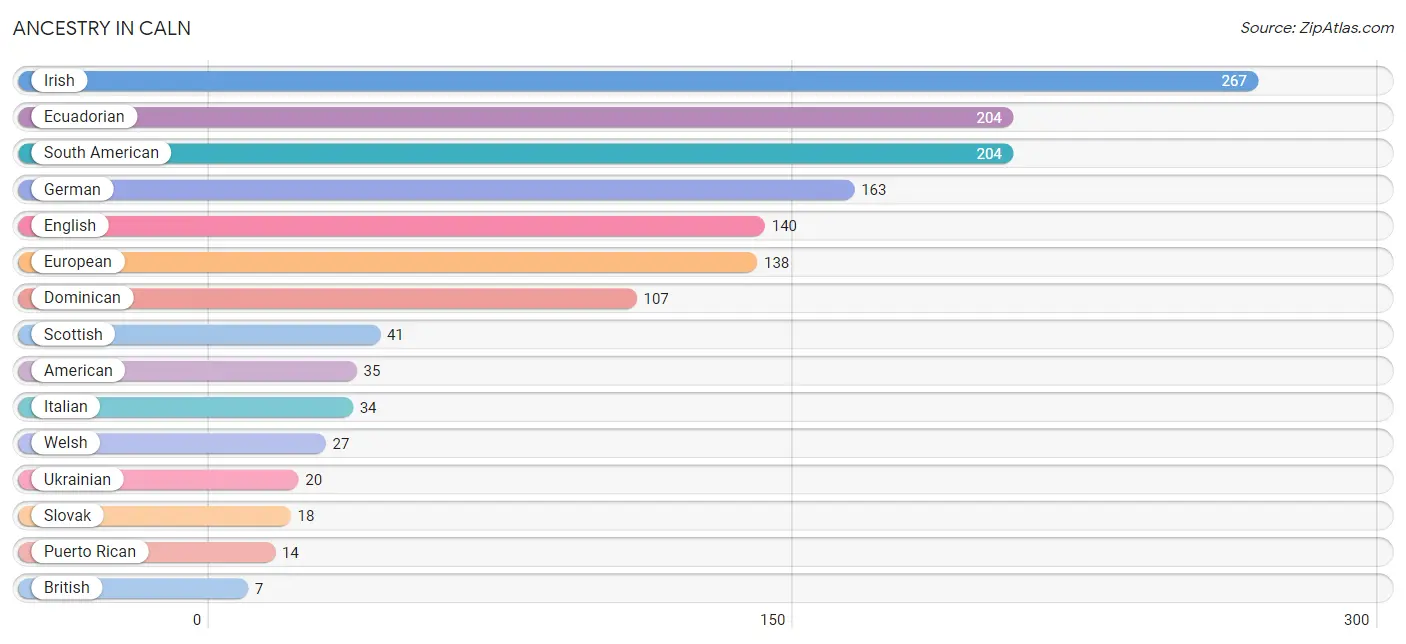
| Ancestry | # Population | % Population |
| American | 35 | 2.4% |
| British | 7 | 0.5% |
| Dominican | 107 | 7.3% |
| Ecuadorian | 204 | 13.9% |
| English | 140 | 9.6% |
| European | 138 | 9.4% |
| German | 163 | 11.1% |
| Irish | 267 | 18.2% |
| Italian | 34 | 2.3% |
| Puerto Rican | 14 | 1.0% |
| Scottish | 41 | 2.8% |
| Slovak | 18 | 1.2% |
| South American | 204 | 13.9% |
| Swedish | 7 | 0.5% |
| Ukrainian | 20 | 1.4% |
| Welsh | 27 | 1.8% | View All 16 Rows |
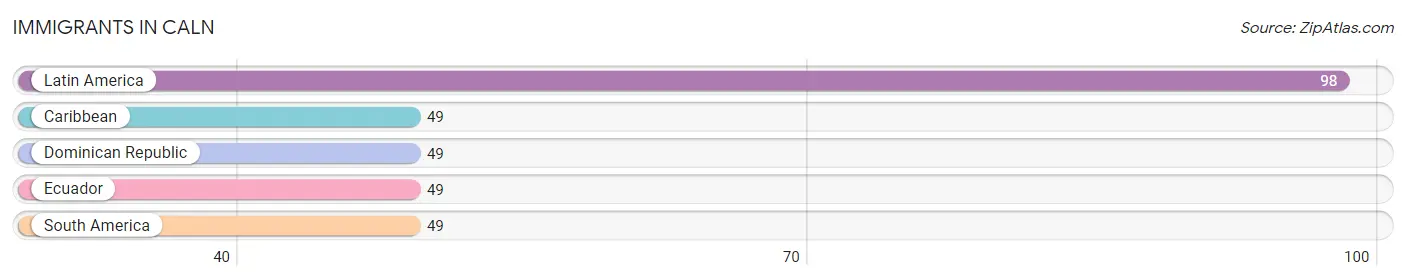
Immigrants in Caln
The most numerous immigrant groups reported in Caln came from Latin America (98 | 6.7%), Caribbean (49 | 3.4%), Dominican Republic (49 | 3.4%), Ecuador (49 | 3.4%), and South America (49 | 3.4%), together accounting for 20.1% of all Caln residents.
| Immigration Origin | # Population | % Population |
| Caribbean | 49 | 3.4% |
| Dominican Republic | 49 | 3.4% |
| Ecuador | 49 | 3.4% |
| Latin America | 98 | 6.7% |
| South America | 49 | 3.4% | View All 5 Rows |
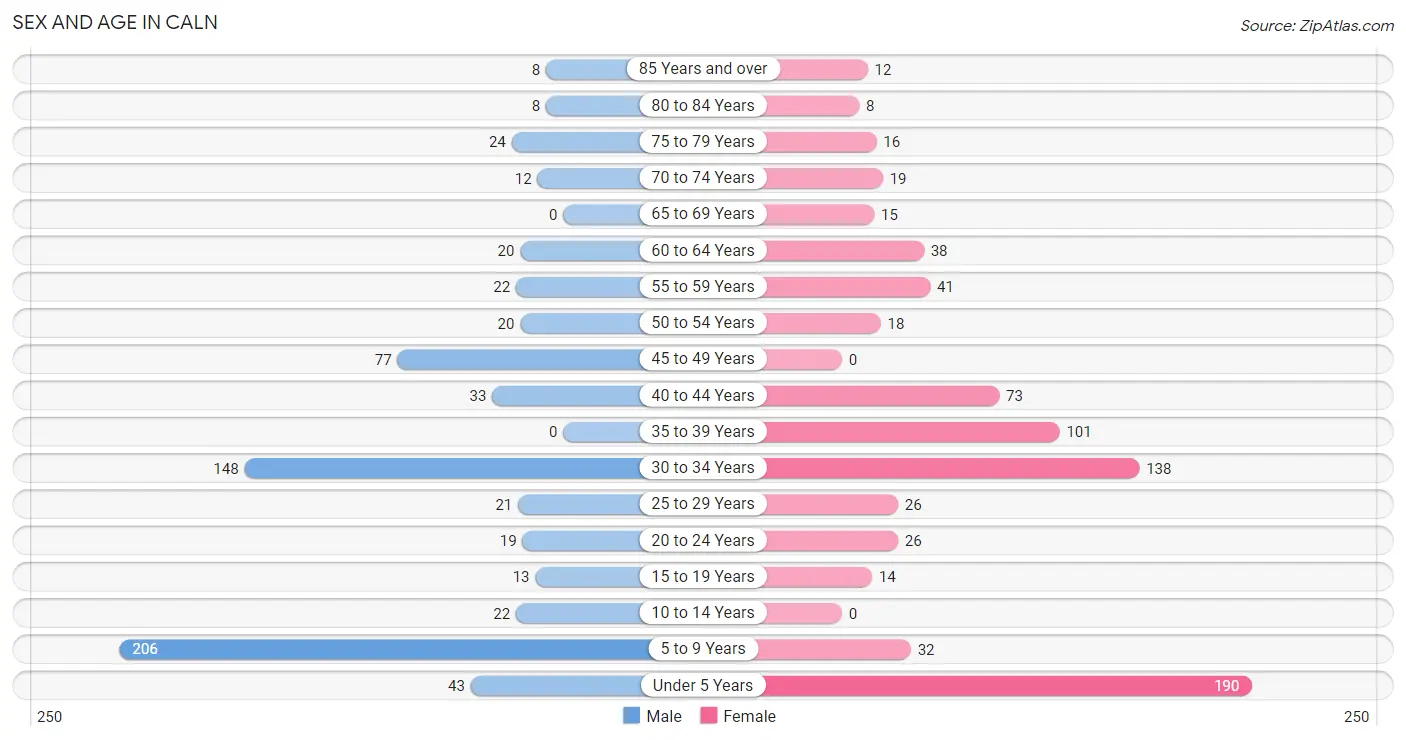
Sex and Age in Caln
Sex and Age in Caln
The most populous age groups in Caln are 5 to 9 Years (206 | 29.6%) for men and Under 5 Years (190 | 24.8%) for women.
| Age Bracket | Male | Female |
| Under 5 Years | 43 (6.2%) | 190 (24.8%) |
| 5 to 9 Years | 206 (29.6%) | 32 (4.2%) |
| 10 to 14 Years | 22 (3.2%) | 0 (0.0%) |
| 15 to 19 Years | 13 (1.9%) | 14 (1.8%) |
| 20 to 24 Years | 19 (2.7%) | 26 (3.4%) |
| 25 to 29 Years | 21 (3.0%) | 26 (3.4%) |
| 30 to 34 Years | 148 (21.3%) | 138 (18.0%) |
| 35 to 39 Years | 0 (0.0%) | 101 (13.2%) |
| 40 to 44 Years | 33 (4.7%) | 73 (9.5%) |
| 45 to 49 Years | 77 (11.1%) | 0 (0.0%) |
| 50 to 54 Years | 20 (2.9%) | 18 (2.4%) |
| 55 to 59 Years | 22 (3.2%) | 41 (5.3%) |
| 60 to 64 Years | 20 (2.9%) | 38 (5.0%) |
| 65 to 69 Years | 0 (0.0%) | 15 (2.0%) |
| 70 to 74 Years | 12 (1.7%) | 19 (2.5%) |
| 75 to 79 Years | 24 (3.5%) | 16 (2.1%) |
| 80 to 84 Years | 8 (1.1%) | 8 (1.0%) |
| 85 Years and over | 8 (1.1%) | 12 (1.6%) |
| Total | 696 (100.0%) | 767 (100.0%) |
Families and Households in Caln
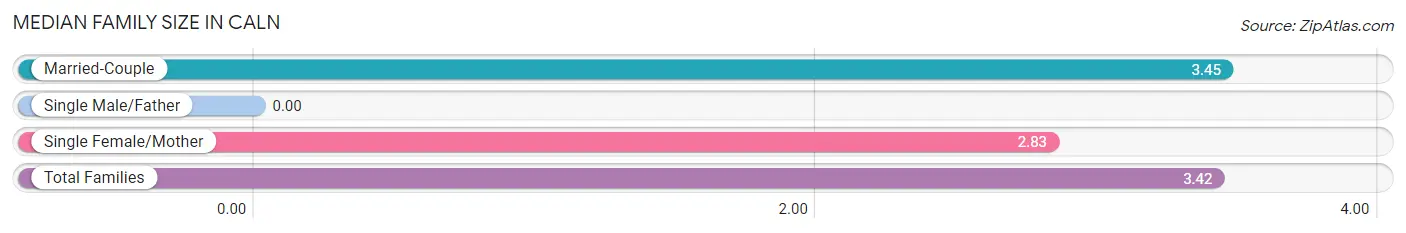
Median Family Size in Caln
| Family Type | # Families | Family Size |
| Married-Couple | 368 (95.3%) | 3.45 |
| Single Male/Father | 0 (0.0%) | - |
| Single Female/Mother | 18 (4.7%) | 2.83 |
| Total Families | 386 (100.0%) | 3.42 |
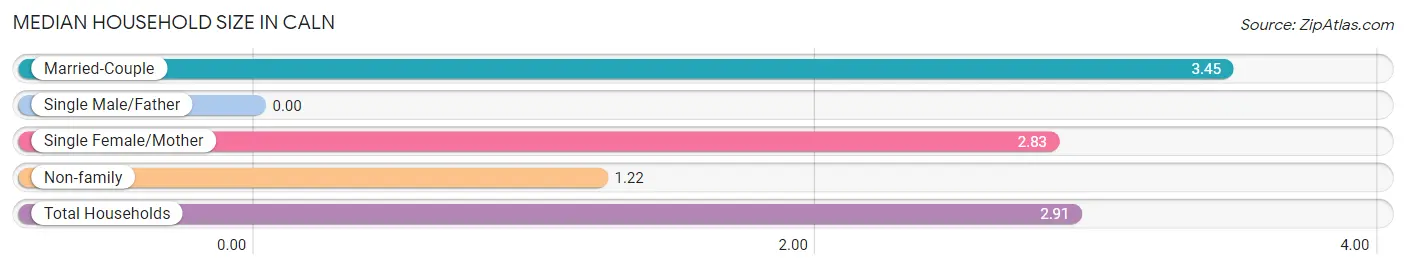
Median Household Size in Caln
| Household Type | # Households | Household Size |
| Married-Couple | 368 (73.2%) | 3.45 |
| Single Male/Father | 0 (0.0%) | - |
| Single Female/Mother | 18 (3.6%) | 2.83 |
| Non-family | 117 (23.3%) | 1.22 |
| Total Households | 503 (100.0%) | 2.91 |
Household Size by Marriage Status in Caln
Out of a total of 503 households in Caln, 386 (76.7%) are family households, while 117 (23.3%) are nonfamily households. The most numerous type of family households are 4-person households, comprising 198, and the most common type of nonfamily households are 1-person households, comprising 91.
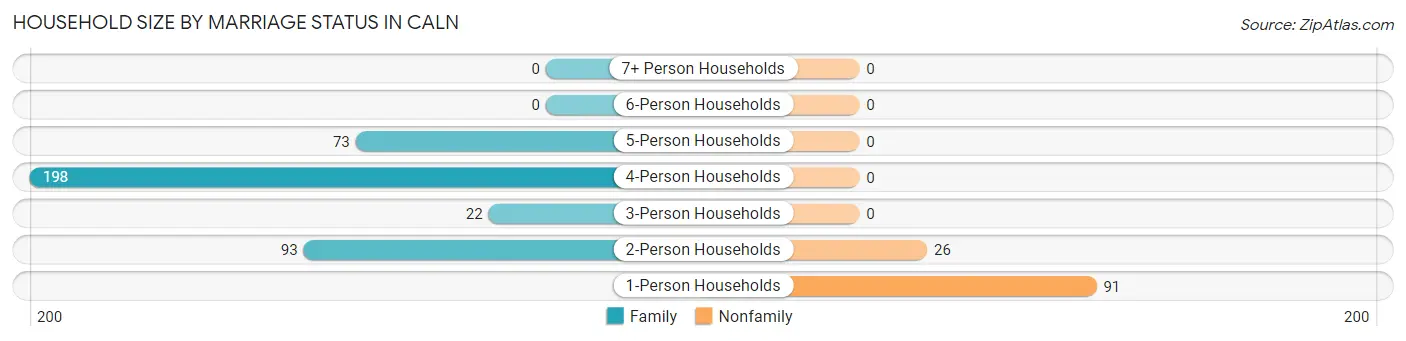
| Household Size | Family Households | Nonfamily Households |
| 1-Person Households | - | 91 (18.1%) |
| 2-Person Households | 93 (18.5%) | 26 (5.2%) |
| 3-Person Households | 22 (4.4%) | 0 (0.0%) |
| 4-Person Households | 198 (39.4%) | 0 (0.0%) |
| 5-Person Households | 73 (14.5%) | 0 (0.0%) |
| 6-Person Households | 0 (0.0%) | 0 (0.0%) |
| 7+ Person Households | 0 (0.0%) | 0 (0.0%) |
| Total | 386 (76.7%) | 117 (23.3%) |
Female Fertility in Caln
Fertility by Age in Caln
| Age Bracket | Women with Births | Births / 1,000 Women |
| 15 to 19 years | 0 (0.0%) | 0.0 |
| 20 to 34 years | 0 (0.0%) | 0.0 |
| 35 to 50 years | 0 (0.0%) | 0.0 |
| Total | 0 (0.0%) | 0.0 |
Fertility by Age by Marriage Status in Caln
| Age Bracket | Married | Unmarried |
| 15 to 19 years | 0 (0.0%) | 0 (0.0%) |
| 20 to 34 years | 0 (0.0%) | 0 (0.0%) |
| 35 to 50 years | 0 (0.0%) | 0 (0.0%) |
| Total | 0 (0.0%) | 0 (0.0%) |
Fertility by Education in Caln
| Educational Attainment | Women with Births | Births / 1,000 Women |
| Less than High School | 0 (0.0%) | 0.0 |
| High School Diploma | 0 (0.0%) | 0.0 |
| College or Associate's Degree | 0 (0.0%) | 0.0 |
| Bachelor's Degree | 0 (0.0%) | 0.0 |
| Graduate Degree | 0 (0.0%) | 0.0 |
| Total | 0 (0.0%) | 0.0 |
Fertility by Education by Marriage Status in Caln
| Educational Attainment | Married | Unmarried |
| Less than High School | 0 (0.0%) | 0 (0.0%) |
| High School Diploma | 0 (0.0%) | 0 (0.0%) |
| College or Associate's Degree | 0 (0.0%) | 0 (0.0%) |
| Bachelor's Degree | 0 (0.0%) | 0 (0.0%) |
| Graduate Degree | 0 (0.0%) | 0 (0.0%) |
| Total | 0 (0.0%) | 0 (0.0%) |
Employment Characteristics in Caln
Employment by Class of Employer in Caln
Among the 674 employed individuals in Caln, private company employees (599 | 88.9%), self-employed (not incorporated) (35 | 5.2%), and not-for-profit organizations (30 | 4.4%) make up the most common classes of employment.
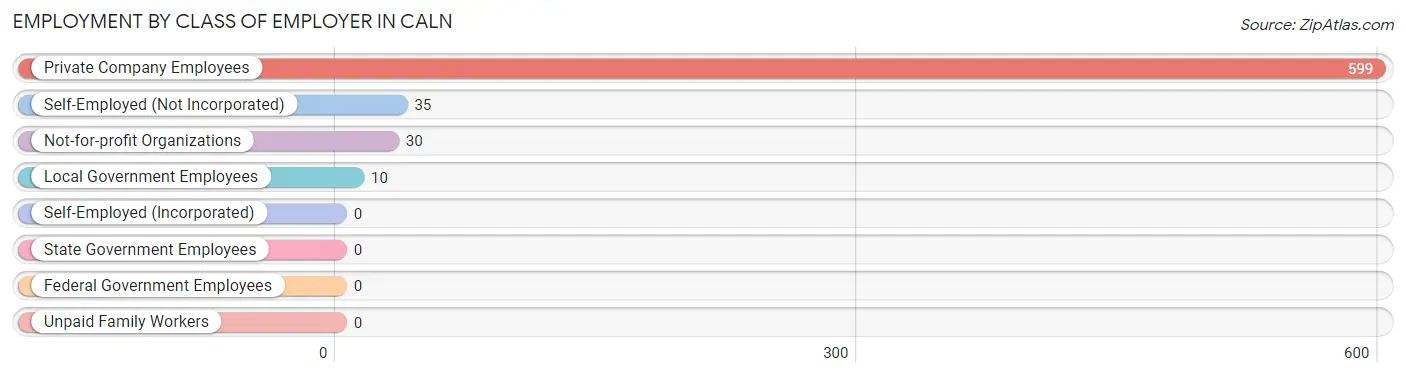
| Employer Class | # Employees | % Employees |
| Private Company Employees | 599 | 88.9% |
| Self-Employed (Incorporated) | 0 | 0.0% |
| Self-Employed (Not Incorporated) | 35 | 5.2% |
| Not-for-profit Organizations | 30 | 4.4% |
| Local Government Employees | 10 | 1.5% |
| State Government Employees | 0 | 0.0% |
| Federal Government Employees | 0 | 0.0% |
| Unpaid Family Workers | 0 | 0.0% |
| Total | 674 | 100.0% |
Employment Status by Age in Caln
According to the labor force statistics for Caln, out of the total population over 16 years of age (970), 74.7% or 725 individuals are in the labor force, with 7.0% or 51 of them unemployed. The age group with the highest labor force participation rate is 16 to 19 years, with 100.0% or 27 individuals in the labor force. Within the labor force, the 25 to 29 years age range has the highest percentage of unemployed individuals, with 44.7% or 21 of them being unemployed.
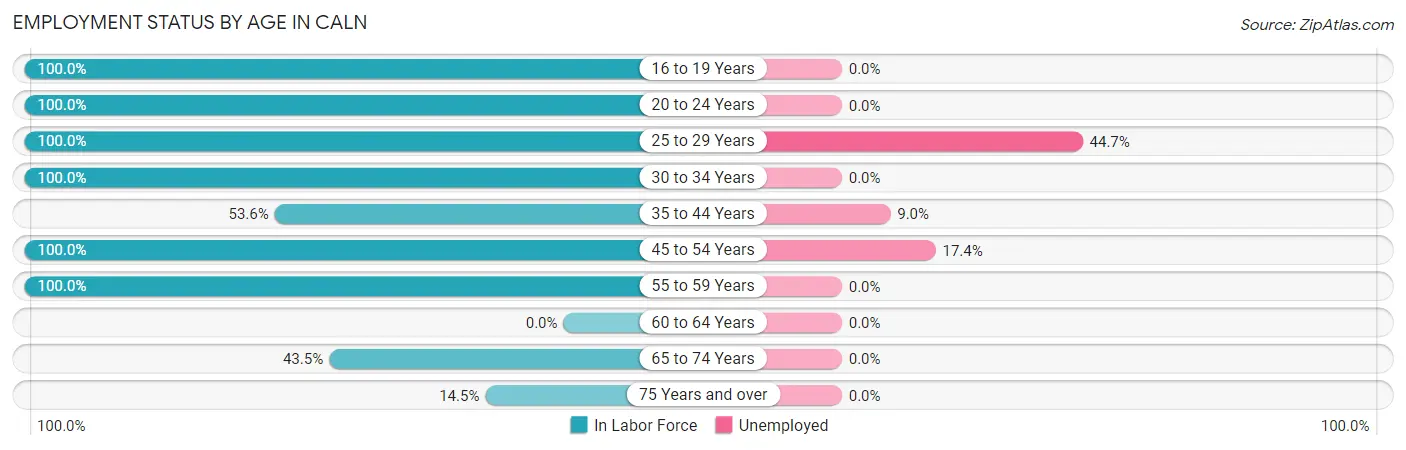
| Age Bracket | In Labor Force | Unemployed |
| 16 to 19 Years | 27 (100.0%) | 0 (0.0%) |
| 20 to 24 Years | 45 (100.0%) | 0 (0.0%) |
| 25 to 29 Years | 47 (100.0%) | 21 (44.7%) |
| 30 to 34 Years | 286 (100.0%) | 0 (0.0%) |
| 35 to 44 Years | 111 (53.6%) | 10 (9.0%) |
| 45 to 54 Years | 115 (100.0%) | 20 (17.4%) |
| 55 to 59 Years | 63 (100.0%) | 0 (0.0%) |
| 60 to 64 Years | 0 (0.0%) | 0 (0.0%) |
| 65 to 74 Years | 20 (43.5%) | 0 (0.0%) |
| 75 Years and over | 11 (14.5%) | 0 (0.0%) |
| Total | 725 (74.7%) | 51 (7.0%) |
Employment Status by Educational Attainment in Caln
According to labor force statistics for Caln, 80.2% of individuals (622) out of the total population between 25 and 64 years of age (776) are in the labor force, with 8.2% or 51 of them being unemployed. The group with the highest labor force participation rate are those with the educational attainment of high school diploma, with 86.6% or 342 individuals in the labor force. Within the labor force, individuals with college / associate degree education have the highest percentage of unemployment, with 12.7% or 21 of them being unemployed.
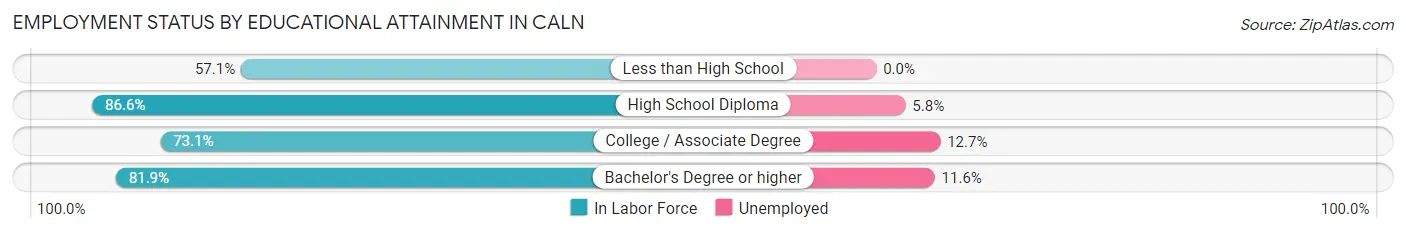
| Educational Attainment | In Labor Force | Unemployed |
| Less than High School | 28 (57.1%) | 0 (0.0%) |
| High School Diploma | 342 (86.6%) | 23 (5.8%) |
| College / Associate Degree | 166 (73.1%) | 29 (12.7%) |
| Bachelor's Degree or higher | 86 (81.9%) | 12 (11.6%) |
| Total | 622 (80.2%) | 64 (8.2%) |
Employment Occupations by Sex in Caln
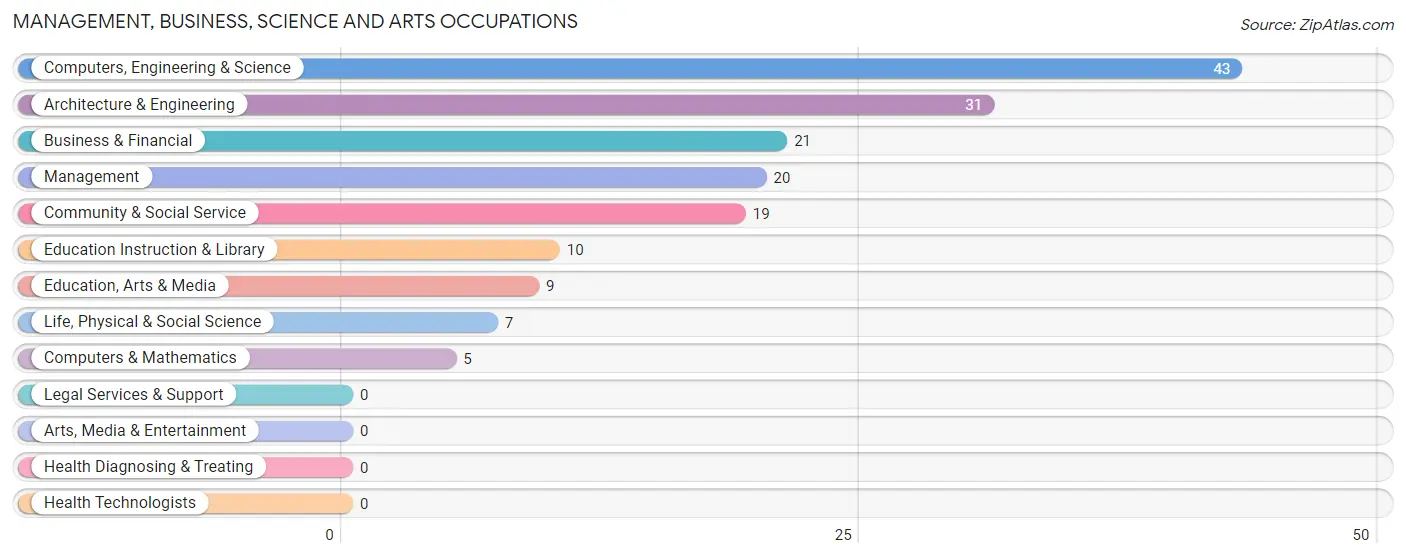
Management, Business, Science and Arts Occupations
The most common Management, Business, Science and Arts occupations in Caln are Computers, Engineering & Science (43 | 6.4%), Architecture & Engineering (31 | 4.6%), Business & Financial (21 | 3.1%), Management (20 | 3.0%), and Community & Social Service (19 | 2.8%).
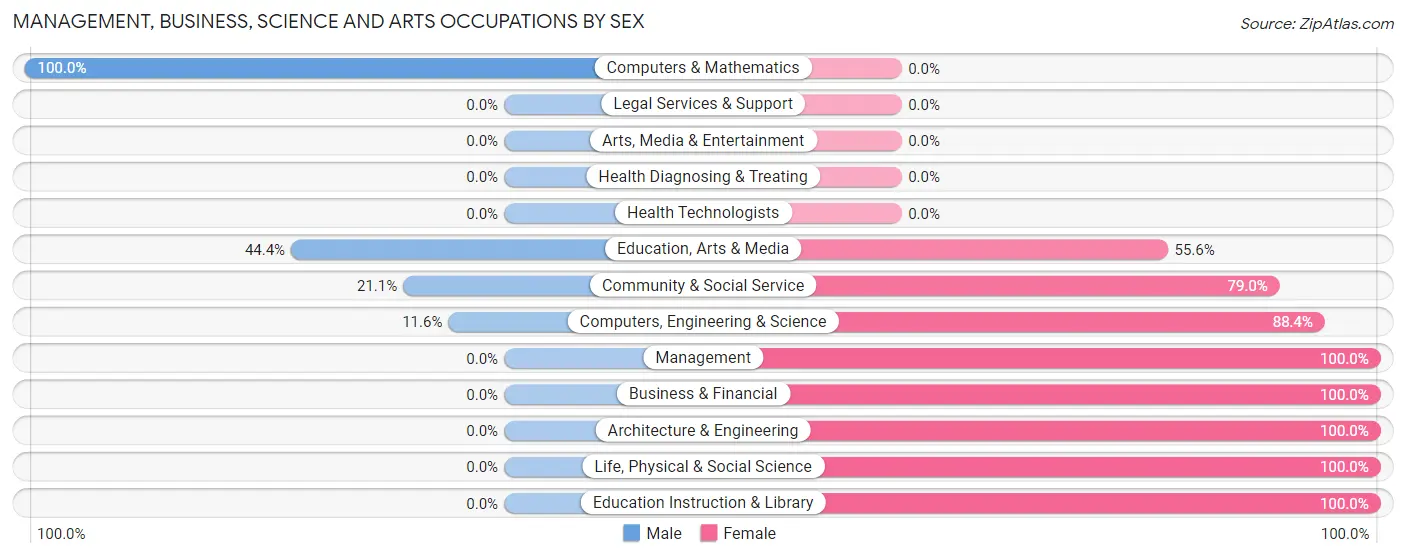
Management, Business, Science and Arts Occupations by Sex
Within the Management, Business, Science and Arts occupations in Caln, the most male-oriented occupations are Computers & Mathematics (100.0%), Education, Arts & Media (44.4%), and Community & Social Service (21.0%), while the most female-oriented occupations are Management (100.0%), Business & Financial (100.0%), and Architecture & Engineering (100.0%).
| Occupation | Male | Female |
| Management | 0 (0.0%) | 20 (100.0%) |
| Business & Financial | 0 (0.0%) | 21 (100.0%) |
| Computers, Engineering & Science | 5 (11.6%) | 38 (88.4%) |
| Computers & Mathematics | 5 (100.0%) | 0 (0.0%) |
| Architecture & Engineering | 0 (0.0%) | 31 (100.0%) |
| Life, Physical & Social Science | 0 (0.0%) | 7 (100.0%) |
| Community & Social Service | 4 (21.0%) | 15 (78.9%) |
| Education, Arts & Media | 4 (44.4%) | 5 (55.6%) |
| Legal Services & Support | 0 (0.0%) | 0 (0.0%) |
| Education Instruction & Library | 0 (0.0%) | 10 (100.0%) |
| Arts, Media & Entertainment | 0 (0.0%) | 0 (0.0%) |
| Health Diagnosing & Treating | 0 (0.0%) | 0 (0.0%) |
| Health Technologists | 0 (0.0%) | 0 (0.0%) |
| Total (Category) | 9 (8.7%) | 94 (91.3%) |
| Total (Overall) | 316 (46.9%) | 358 (53.1%) |
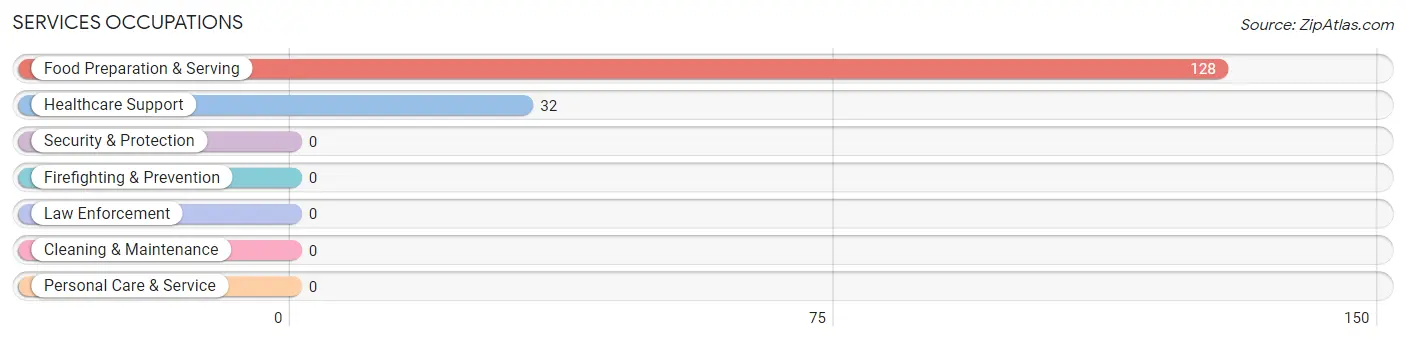
Services Occupations
The most common Services occupations in Caln are Food Preparation & Serving (128 | 19.0%), and Healthcare Support (32 | 4.8%).
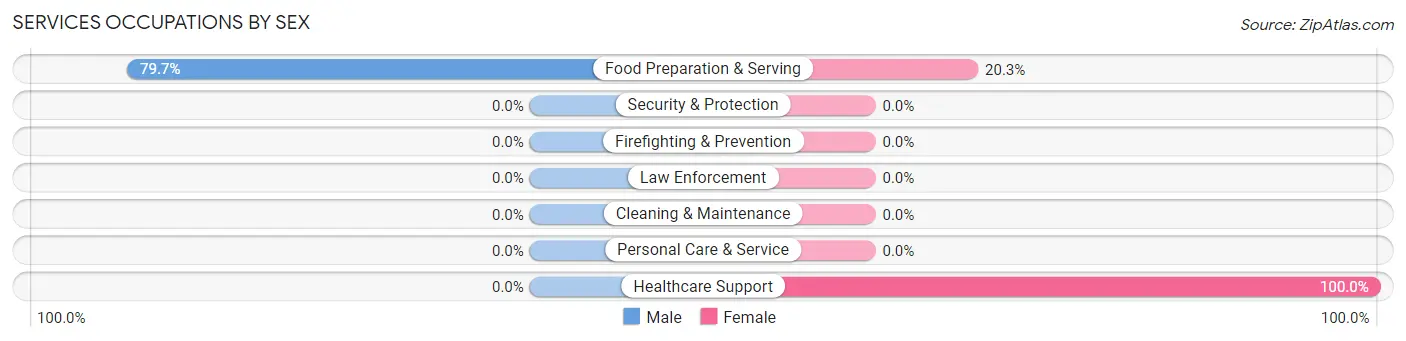
Services Occupations by Sex
| Occupation | Male | Female |
| Healthcare Support | 0 (0.0%) | 32 (100.0%) |
| Security & Protection | 0 (0.0%) | 0 (0.0%) |
| Firefighting & Prevention | 0 (0.0%) | 0 (0.0%) |
| Law Enforcement | 0 (0.0%) | 0 (0.0%) |
| Food Preparation & Serving | 102 (79.7%) | 26 (20.3%) |
| Cleaning & Maintenance | 0 (0.0%) | 0 (0.0%) |
| Personal Care & Service | 0 (0.0%) | 0 (0.0%) |
| Total (Category) | 102 (63.7%) | 58 (36.2%) |
| Total (Overall) | 316 (46.9%) | 358 (53.1%) |
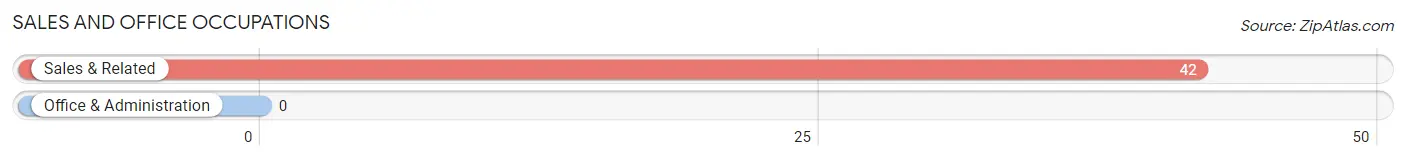
Sales and Office Occupations
The most common Sales and Office occupations in Caln are , and Sales & Related (42 | 6.2%).
Sales and Office Occupations by Sex
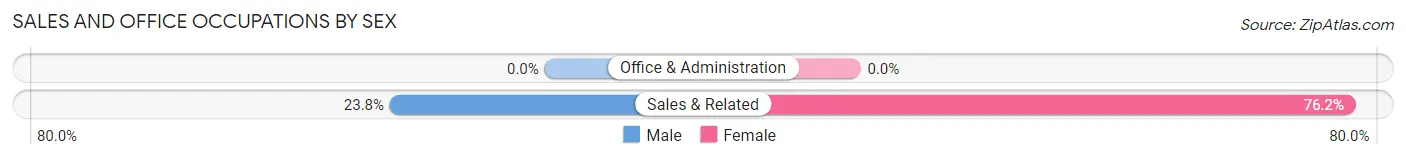
| Occupation | Male | Female |
| Sales & Related | 10 (23.8%) | 32 (76.2%) |
| Office & Administration | 0 (0.0%) | 0 (0.0%) |
| Total (Category) | 10 (23.8%) | 32 (76.2%) |
| Total (Overall) | 316 (46.9%) | 358 (53.1%) |
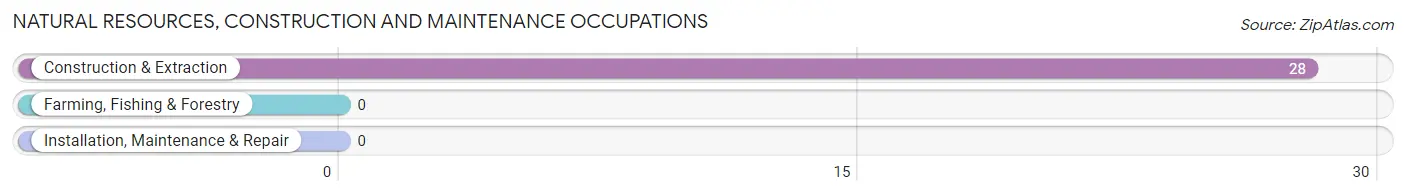
Natural Resources, Construction and Maintenance Occupations
The most common Natural Resources, Construction and Maintenance occupations in Caln are , and Construction & Extraction (28 | 4.2%).
Natural Resources, Construction and Maintenance Occupations by Sex
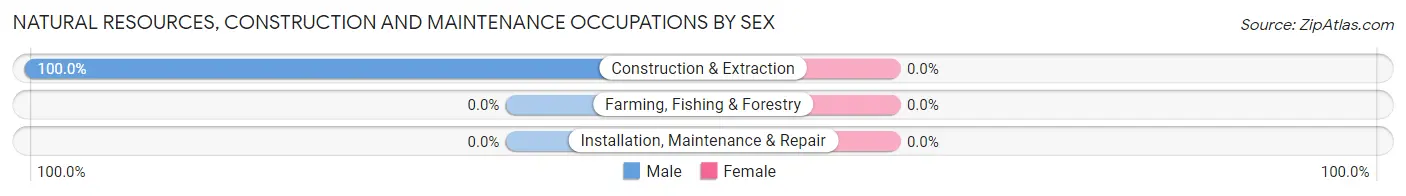
| Occupation | Male | Female |
| Farming, Fishing & Forestry | 0 (0.0%) | 0 (0.0%) |
| Construction & Extraction | 28 (100.0%) | 0 (0.0%) |
| Installation, Maintenance & Repair | 0 (0.0%) | 0 (0.0%) |
| Total (Category) | 28 (100.0%) | 0 (0.0%) |
| Total (Overall) | 316 (46.9%) | 358 (53.1%) |
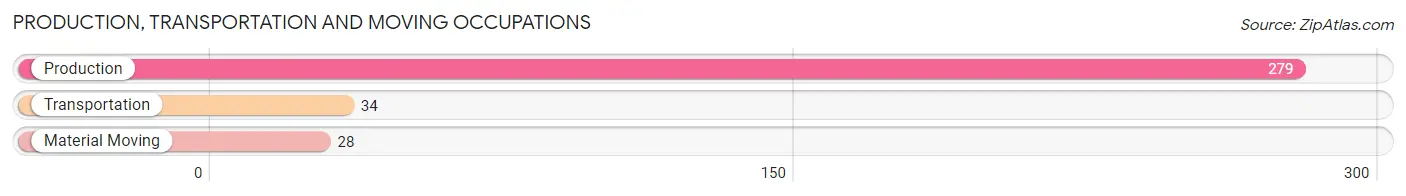
Production, Transportation and Moving Occupations
The most common Production, Transportation and Moving occupations in Caln are Production (279 | 41.4%), Transportation (34 | 5.0%), and Material Moving (28 | 4.2%).
Production, Transportation and Moving Occupations by Sex
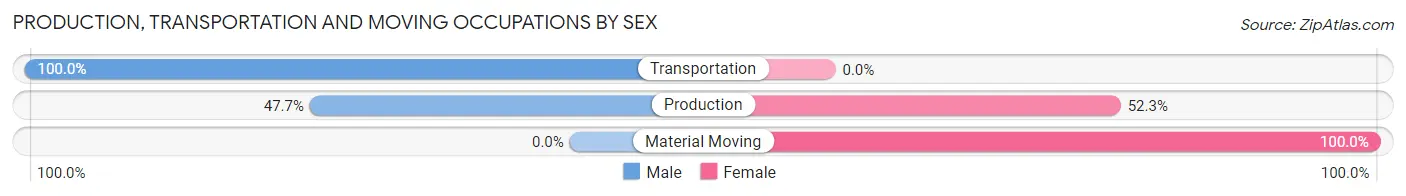
| Occupation | Male | Female |
| Production | 133 (47.7%) | 146 (52.3%) |
| Transportation | 34 (100.0%) | 0 (0.0%) |
| Material Moving | 0 (0.0%) | 28 (100.0%) |
| Total (Category) | 167 (49.0%) | 174 (51.0%) |
| Total (Overall) | 316 (46.9%) | 358 (53.1%) |
Employment Industries by Sex in Caln
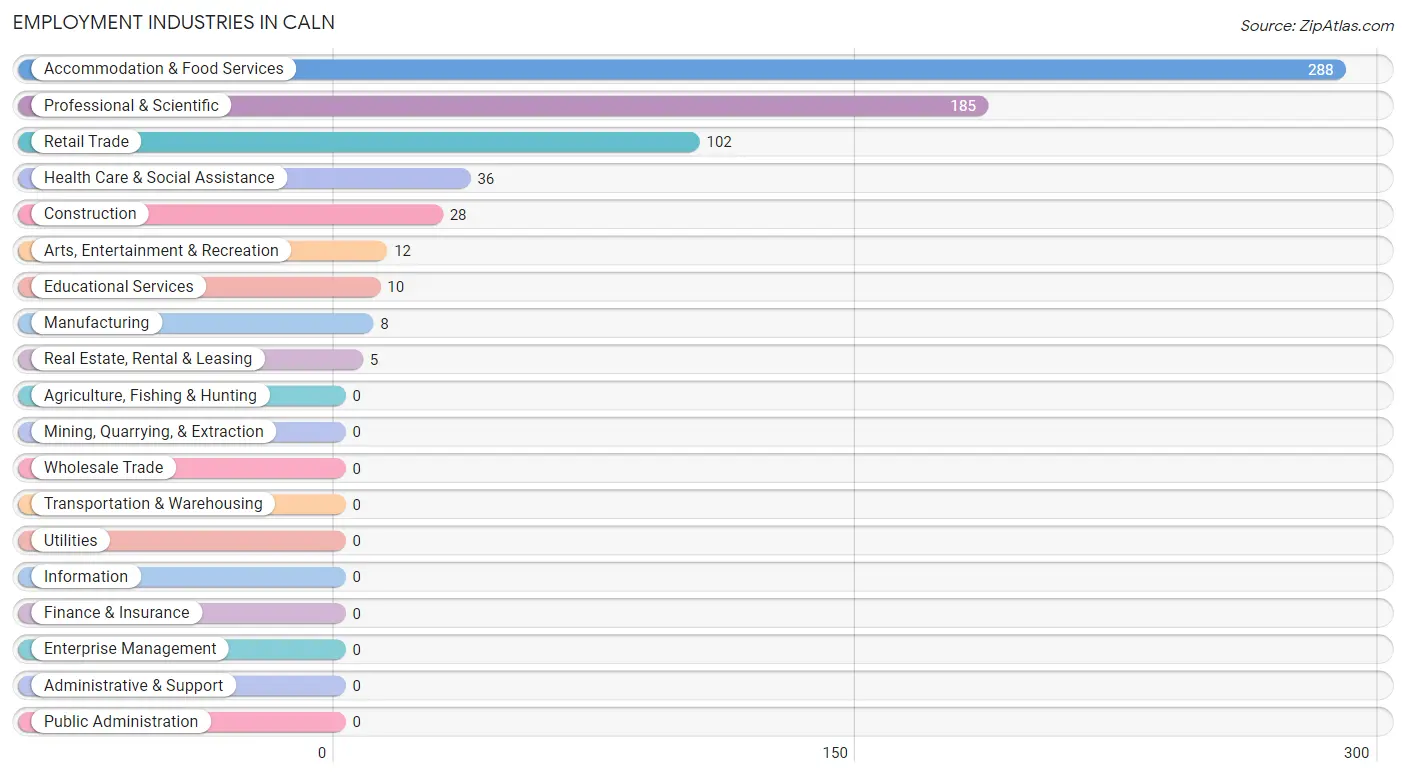
Employment Industries in Caln
The major employment industries in Caln include Accommodation & Food Services (288 | 42.7%), Professional & Scientific (185 | 27.5%), Retail Trade (102 | 15.1%), Health Care & Social Assistance (36 | 5.3%), and Construction (28 | 4.2%).
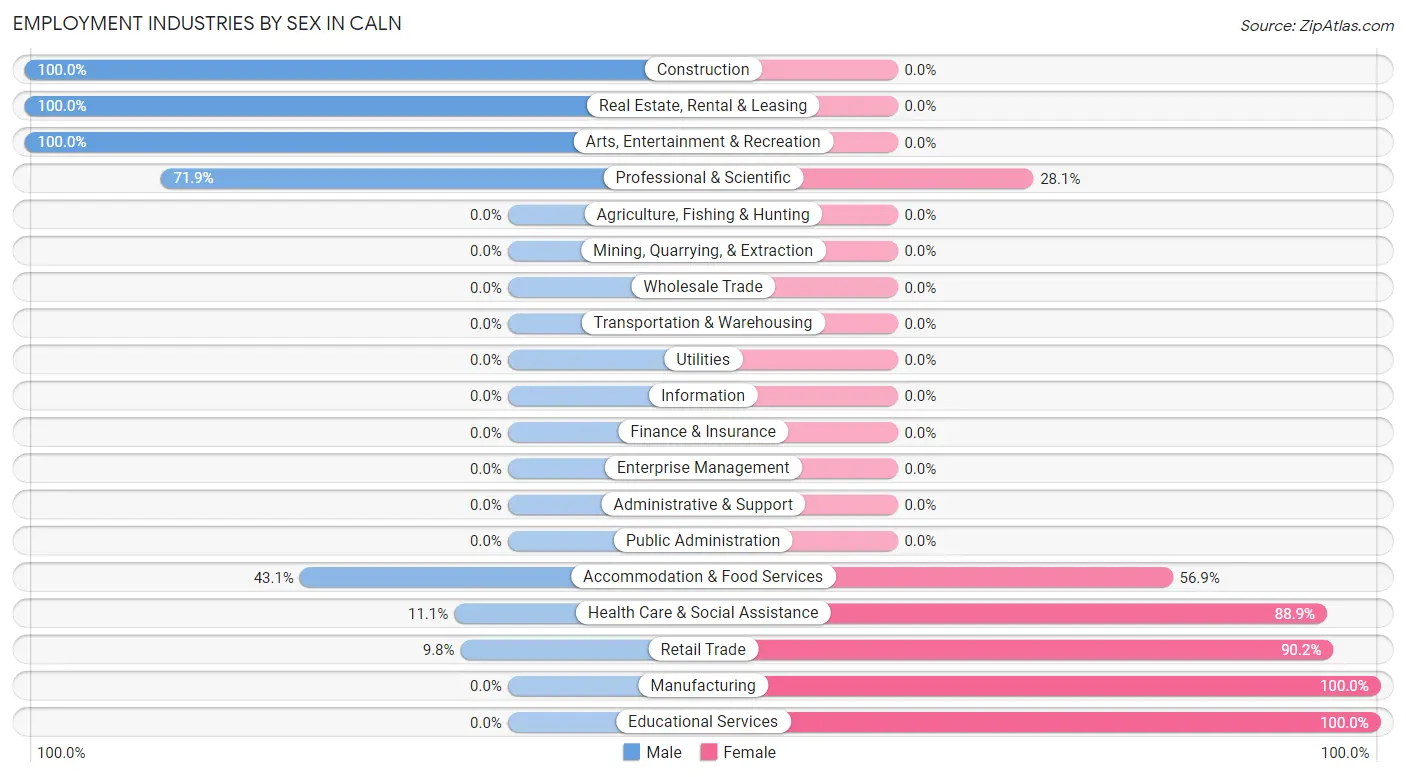
Employment Industries by Sex in Caln
The Caln industries that see more men than women are Construction (100.0%), Real Estate, Rental & Leasing (100.0%), and Arts, Entertainment & Recreation (100.0%), whereas the industries that tend to have a higher number of women are Manufacturing (100.0%), Educational Services (100.0%), and Retail Trade (90.2%).
| Industry | Male | Female |
| Agriculture, Fishing & Hunting | 0 (0.0%) | 0 (0.0%) |
| Mining, Quarrying, & Extraction | 0 (0.0%) | 0 (0.0%) |
| Construction | 28 (100.0%) | 0 (0.0%) |
| Manufacturing | 0 (0.0%) | 8 (100.0%) |
| Wholesale Trade | 0 (0.0%) | 0 (0.0%) |
| Retail Trade | 10 (9.8%) | 92 (90.2%) |
| Transportation & Warehousing | 0 (0.0%) | 0 (0.0%) |
| Utilities | 0 (0.0%) | 0 (0.0%) |
| Information | 0 (0.0%) | 0 (0.0%) |
| Finance & Insurance | 0 (0.0%) | 0 (0.0%) |
| Real Estate, Rental & Leasing | 5 (100.0%) | 0 (0.0%) |
| Professional & Scientific | 133 (71.9%) | 52 (28.1%) |
| Enterprise Management | 0 (0.0%) | 0 (0.0%) |
| Administrative & Support | 0 (0.0%) | 0 (0.0%) |
| Educational Services | 0 (0.0%) | 10 (100.0%) |
| Health Care & Social Assistance | 4 (11.1%) | 32 (88.9%) |
| Arts, Entertainment & Recreation | 12 (100.0%) | 0 (0.0%) |
| Accommodation & Food Services | 124 (43.1%) | 164 (56.9%) |
| Public Administration | 0 (0.0%) | 0 (0.0%) |
| Total | 316 (46.9%) | 358 (53.1%) |
Education in Caln
School Enrollment in Caln
The most common levels of schooling among the 521 students in Caln are college / undergraduate (212 | 40.7%), elementary school (206 | 39.5%), and kindergarten (32 | 6.1%).
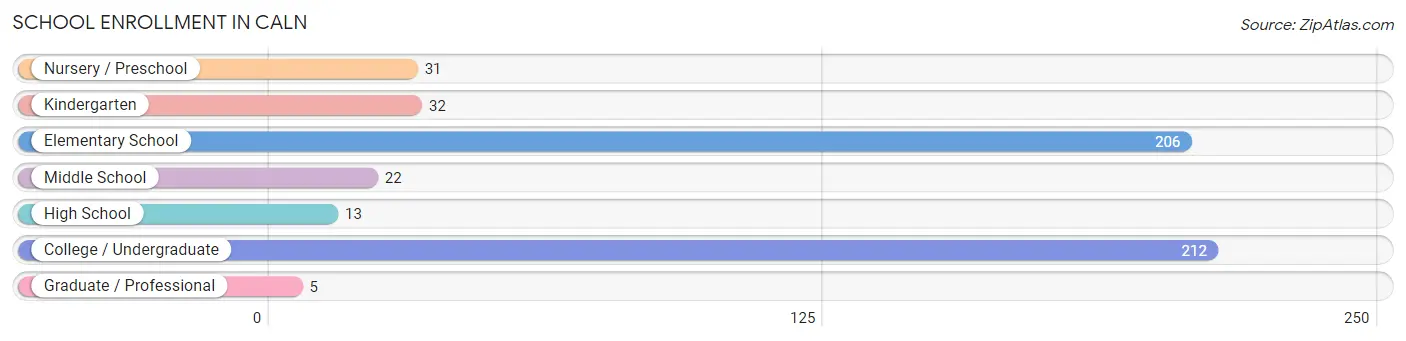
| School Level | # Students | % Students |
| Nursery / Preschool | 31 | 5.9% |
| Kindergarten | 32 | 6.1% |
| Elementary School | 206 | 39.5% |
| Middle School | 22 | 4.2% |
| High School | 13 | 2.5% |
| College / Undergraduate | 212 | 40.7% |
| Graduate / Professional | 5 | 1.0% |
| Total | 521 | 100.0% |
School Enrollment by Age by Funding Source in Caln
Out of a total of 521 students who are enrolled in schools in Caln, 31 (6.0%) attend a private institution, while the remaining 490 (94.0%) are enrolled in public schools. The age group of 3 to 4 year olds has the highest likelihood of being enrolled in private schools, with 31 (100.0% in the age bracket) enrolled. Conversely, the age group of 5 to 9 year old has the lowest likelihood of being enrolled in a private school, with 238 (100.0% in the age bracket) attending a public institution.
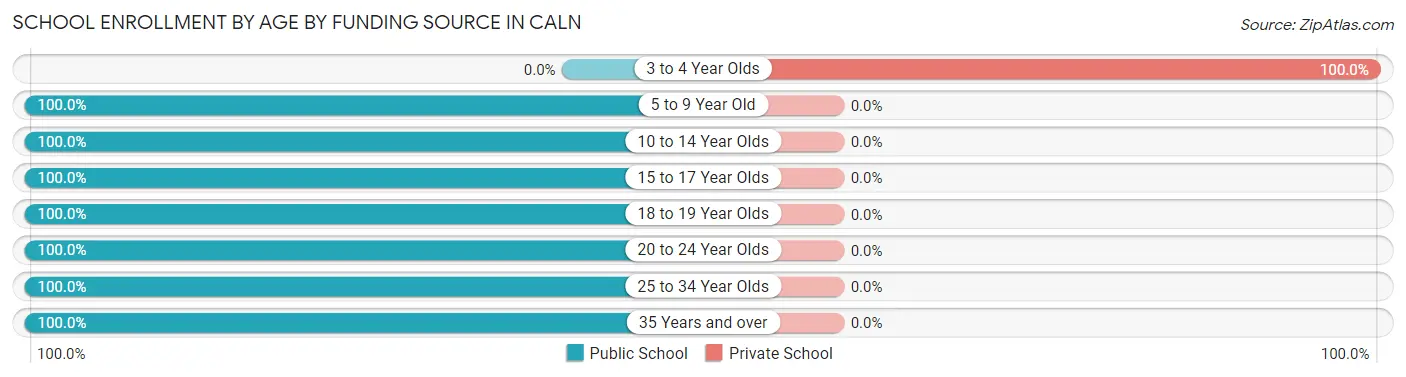
| Age Bracket | Public School | Private School |
| 3 to 4 Year Olds | 0 (0.0%) | 31 (100.0%) |
| 5 to 9 Year Old | 238 (100.0%) | 0 (0.0%) |
| 10 to 14 Year Olds | 22 (100.0%) | 0 (0.0%) |
| 15 to 17 Year Olds | 13 (100.0%) | 0 (0.0%) |
| 18 to 19 Year Olds | 14 (100.0%) | 0 (0.0%) |
| 20 to 24 Year Olds | 45 (100.0%) | 0 (0.0%) |
| 25 to 34 Year Olds | 138 (100.0%) | 0 (0.0%) |
| 35 Years and over | 20 (100.0%) | 0 (0.0%) |
| Total | 490 (94.0%) | 31 (6.0%) |
Educational Attainment by Field of Study in Caln
Psychology (34 | 24.5%), engineering (31 | 22.3%), education (30 | 21.6%), visual & performing arts (17 | 12.2%), and business (10 | 7.2%) are the most common fields of study among 139 individuals in Caln who have obtained a bachelor's degree or higher.
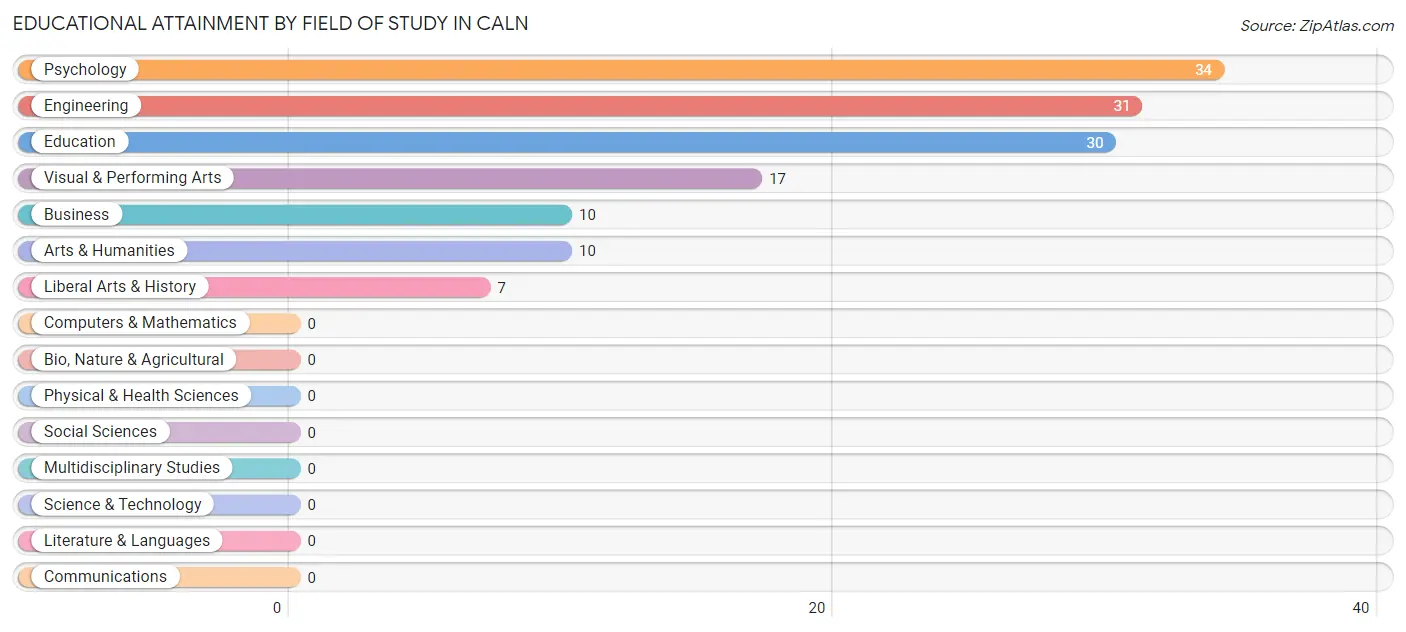
| Field of Study | # Graduates | % Graduates |
| Computers & Mathematics | 0 | 0.0% |
| Bio, Nature & Agricultural | 0 | 0.0% |
| Physical & Health Sciences | 0 | 0.0% |
| Psychology | 34 | 24.5% |
| Social Sciences | 0 | 0.0% |
| Engineering | 31 | 22.3% |
| Multidisciplinary Studies | 0 | 0.0% |
| Science & Technology | 0 | 0.0% |
| Business | 10 | 7.2% |
| Education | 30 | 21.6% |
| Literature & Languages | 0 | 0.0% |
| Liberal Arts & History | 7 | 5.0% |
| Visual & Performing Arts | 17 | 12.2% |
| Communications | 0 | 0.0% |
| Arts & Humanities | 10 | 7.2% |
| Total | 139 | 100.0% |
Transportation & Commute in Caln
Vehicle Availability by Sex in Caln
The most prevalent vehicle ownership categories in Caln are males with 1 vehicle (158, accounting for 50.0%) and females with 1 vehicle (186, making up 44.1%).
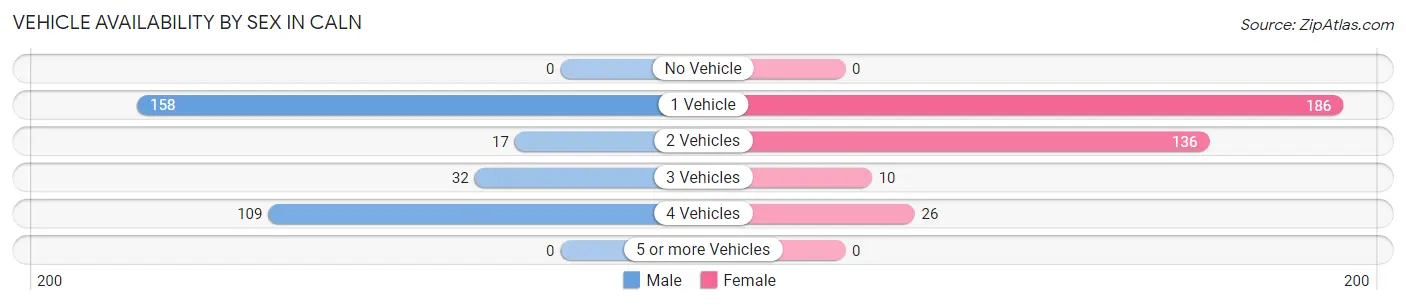
| Vehicles Available | Male | Female |
| No Vehicle | 0 (0.0%) | 0 (0.0%) |
| 1 Vehicle | 158 (50.0%) | 186 (52.0%) |
| 2 Vehicles | 17 (5.4%) | 136 (38.0%) |
| 3 Vehicles | 32 (10.1%) | 10 (2.8%) |
| 4 Vehicles | 109 (34.5%) | 26 (7.3%) |
| 5 or more Vehicles | 0 (0.0%) | 0 (0.0%) |
| Total | 316 (100.0%) | 358 (100.0%) |
Commute Time in Caln
The most frequently occuring commute durations in Caln are 20 to 24 minutes (247 commuters, 38.8%), 30 to 34 minutes (164 commuters, 25.8%), and 10 to 14 minutes (92 commuters, 14.5%).
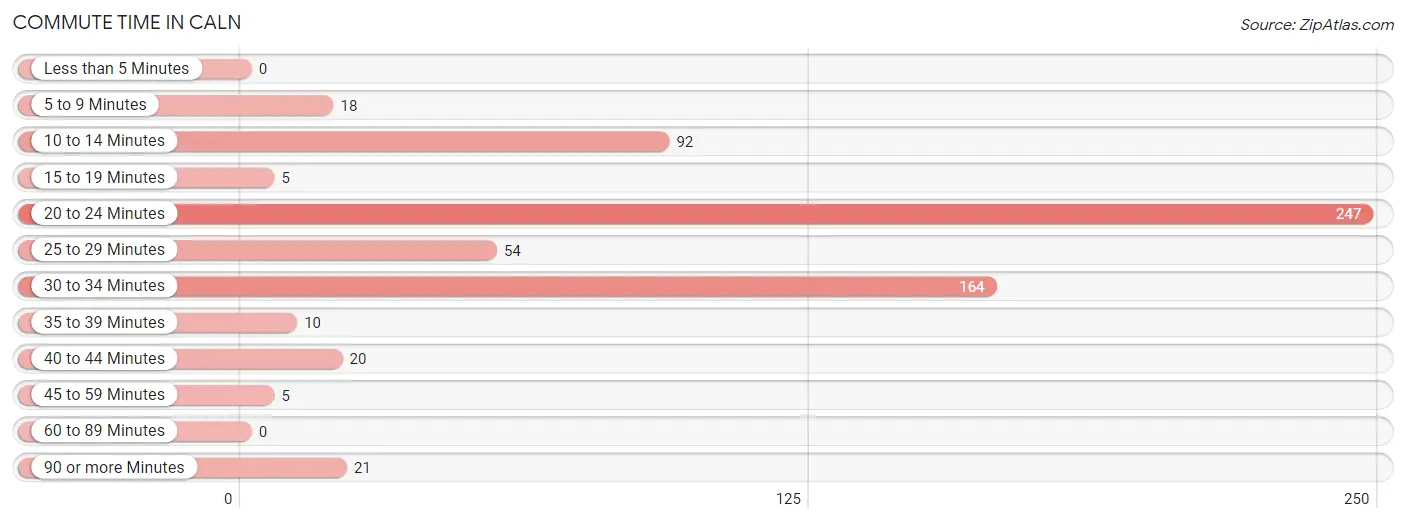
| Commute Time | # Commuters | % Commuters |
| Less than 5 Minutes | 0 | 0.0% |
| 5 to 9 Minutes | 18 | 2.8% |
| 10 to 14 Minutes | 92 | 14.5% |
| 15 to 19 Minutes | 5 | 0.8% |
| 20 to 24 Minutes | 247 | 38.8% |
| 25 to 29 Minutes | 54 | 8.5% |
| 30 to 34 Minutes | 164 | 25.8% |
| 35 to 39 Minutes | 10 | 1.6% |
| 40 to 44 Minutes | 20 | 3.1% |
| 45 to 59 Minutes | 5 | 0.8% |
| 60 to 89 Minutes | 0 | 0.0% |
| 90 or more Minutes | 21 | 3.3% |
Commute Time by Sex in Caln
The most common commute times in Caln are 30 to 34 minutes (156 commuters, 49.4%) for males and 20 to 24 minutes (164 commuters, 51.2%) for females.
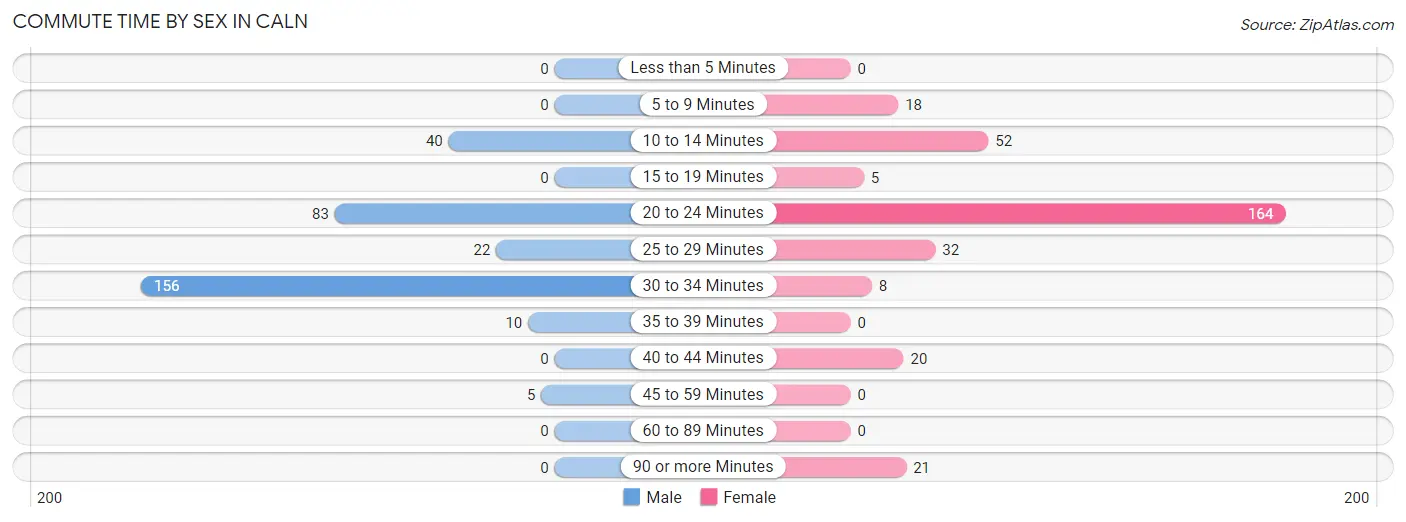
| Commute Time | Male | Female |
| Less than 5 Minutes | 0 (0.0%) | 0 (0.0%) |
| 5 to 9 Minutes | 0 (0.0%) | 18 (5.6%) |
| 10 to 14 Minutes | 40 (12.7%) | 52 (16.3%) |
| 15 to 19 Minutes | 0 (0.0%) | 5 (1.6%) |
| 20 to 24 Minutes | 83 (26.3%) | 164 (51.2%) |
| 25 to 29 Minutes | 22 (7.0%) | 32 (10.0%) |
| 30 to 34 Minutes | 156 (49.4%) | 8 (2.5%) |
| 35 to 39 Minutes | 10 (3.2%) | 0 (0.0%) |
| 40 to 44 Minutes | 0 (0.0%) | 20 (6.2%) |
| 45 to 59 Minutes | 5 (1.6%) | 0 (0.0%) |
| 60 to 89 Minutes | 0 (0.0%) | 0 (0.0%) |
| 90 or more Minutes | 0 (0.0%) | 21 (6.6%) |
Time of Departure to Work by Sex in Caln
The most frequent times of departure to work in Caln are 9:00 AM to 9:59 AM (154, 48.7%) for males and 4:00 PM to 11:59 PM (160, 50.0%) for females.
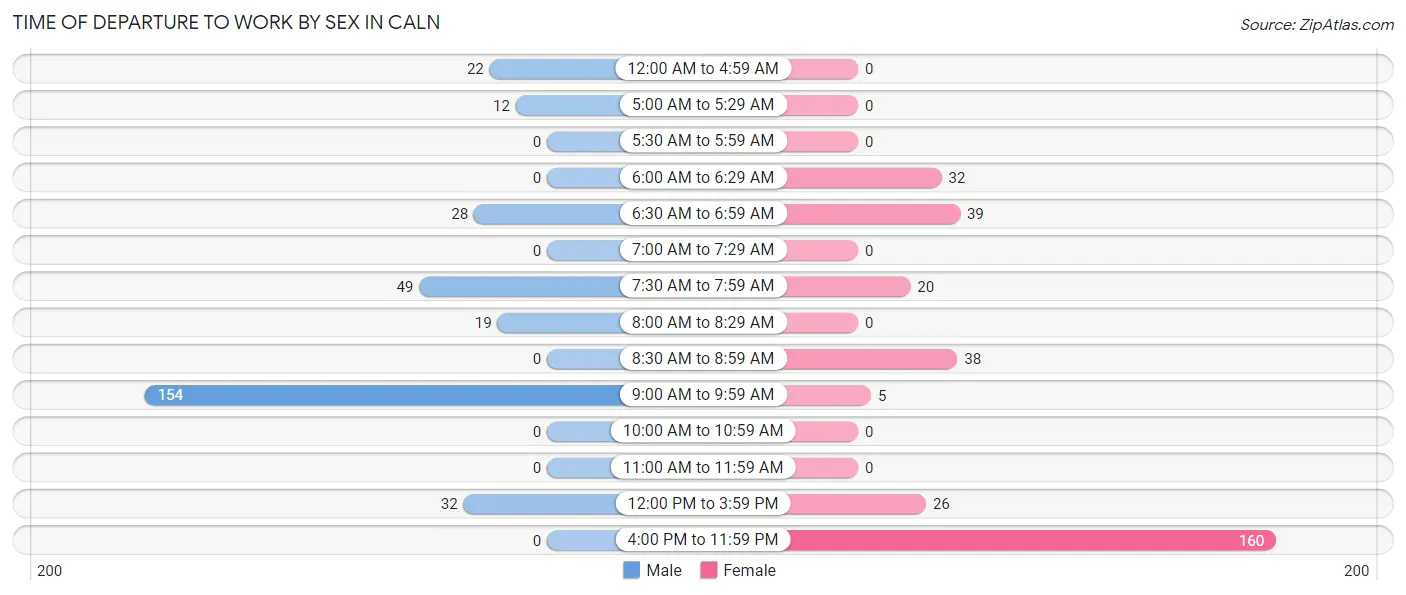
| Time of Departure | Male | Female |
| 12:00 AM to 4:59 AM | 22 (7.0%) | 0 (0.0%) |
| 5:00 AM to 5:29 AM | 12 (3.8%) | 0 (0.0%) |
| 5:30 AM to 5:59 AM | 0 (0.0%) | 0 (0.0%) |
| 6:00 AM to 6:29 AM | 0 (0.0%) | 32 (10.0%) |
| 6:30 AM to 6:59 AM | 28 (8.9%) | 39 (12.2%) |
| 7:00 AM to 7:29 AM | 0 (0.0%) | 0 (0.0%) |
| 7:30 AM to 7:59 AM | 49 (15.5%) | 20 (6.2%) |
| 8:00 AM to 8:29 AM | 19 (6.0%) | 0 (0.0%) |
| 8:30 AM to 8:59 AM | 0 (0.0%) | 38 (11.9%) |
| 9:00 AM to 9:59 AM | 154 (48.7%) | 5 (1.6%) |
| 10:00 AM to 10:59 AM | 0 (0.0%) | 0 (0.0%) |
| 11:00 AM to 11:59 AM | 0 (0.0%) | 0 (0.0%) |
| 12:00 PM to 3:59 PM | 32 (10.1%) | 26 (8.1%) |
| 4:00 PM to 11:59 PM | 0 (0.0%) | 160 (50.0%) |
| Total | 316 (100.0%) | 320 (100.0%) |
Housing Occupancy in Caln
Occupancy by Ownership in Caln
Of the total 503 dwellings in Caln, owner-occupied units account for 332 (66.0%), while renter-occupied units make up 171 (34.0%).
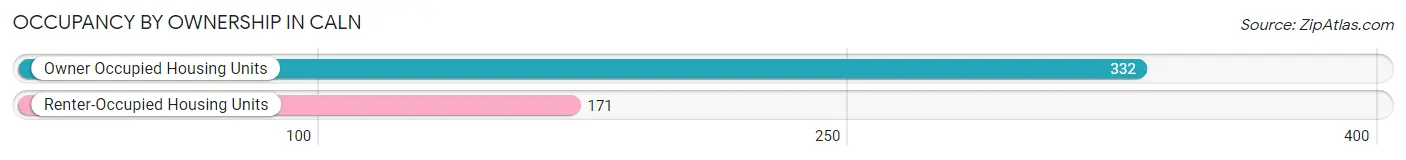
| Occupancy | # Housing Units | % Housing Units |
| Owner Occupied Housing Units | 332 | 66.0% |
| Renter-Occupied Housing Units | 171 | 34.0% |
| Total Occupied Housing Units | 503 | 100.0% |
Occupancy by Household Size in Caln
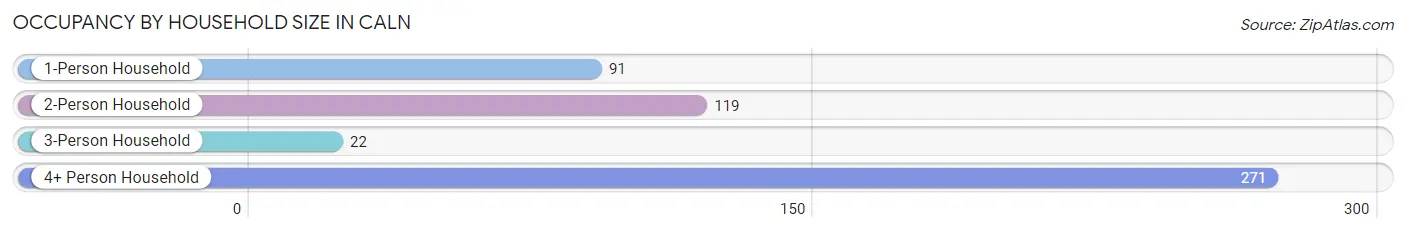
| Household Size | # Housing Units | % Housing Units |
| 1-Person Household | 91 | 18.1% |
| 2-Person Household | 119 | 23.7% |
| 3-Person Household | 22 | 4.4% |
| 4+ Person Household | 271 | 53.9% |
| Total Housing Units | 503 | 100.0% |
Occupancy by Ownership by Household Size in Caln
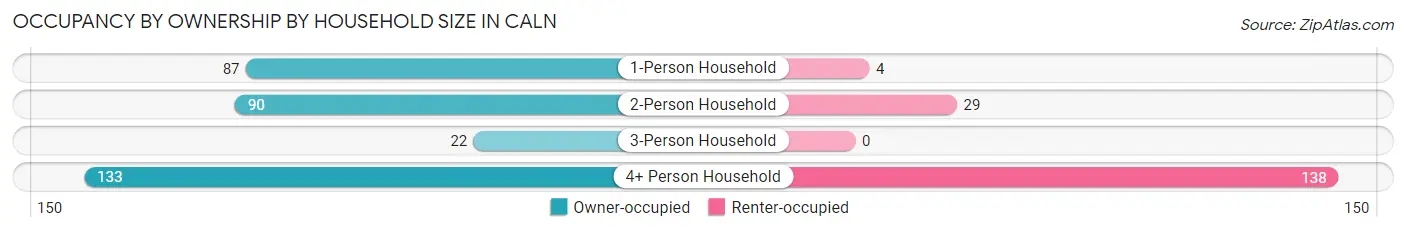
| Household Size | Owner-occupied | Renter-occupied |
| 1-Person Household | 87 (95.6%) | 4 (4.4%) |
| 2-Person Household | 90 (75.6%) | 29 (24.4%) |
| 3-Person Household | 22 (100.0%) | 0 (0.0%) |
| 4+ Person Household | 133 (49.1%) | 138 (50.9%) |
| Total Housing Units | 332 (66.0%) | 171 (34.0%) |
Occupancy by Educational Attainment in Caln
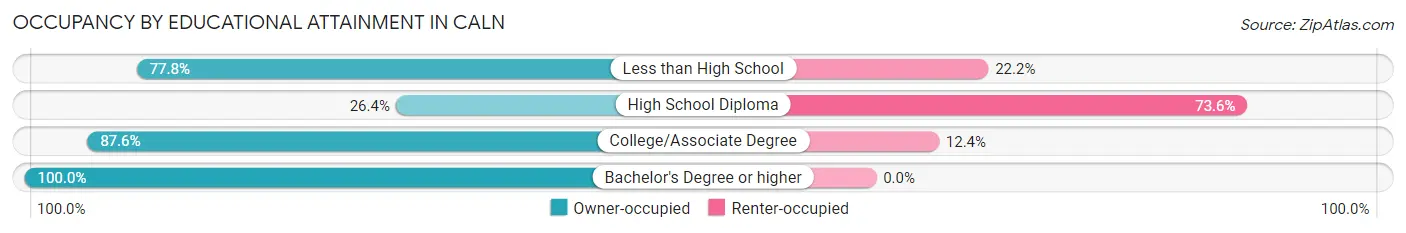
| Household Size | Owner-occupied | Renter-occupied |
| Less than High School | 28 (77.8%) | 8 (22.2%) |
| High School Diploma | 51 (26.4%) | 142 (73.6%) |
| College/Associate Degree | 148 (87.6%) | 21 (12.4%) |
| Bachelor's Degree or higher | 105 (100.0%) | 0 (0.0%) |
Occupancy by Age of Householder in Caln
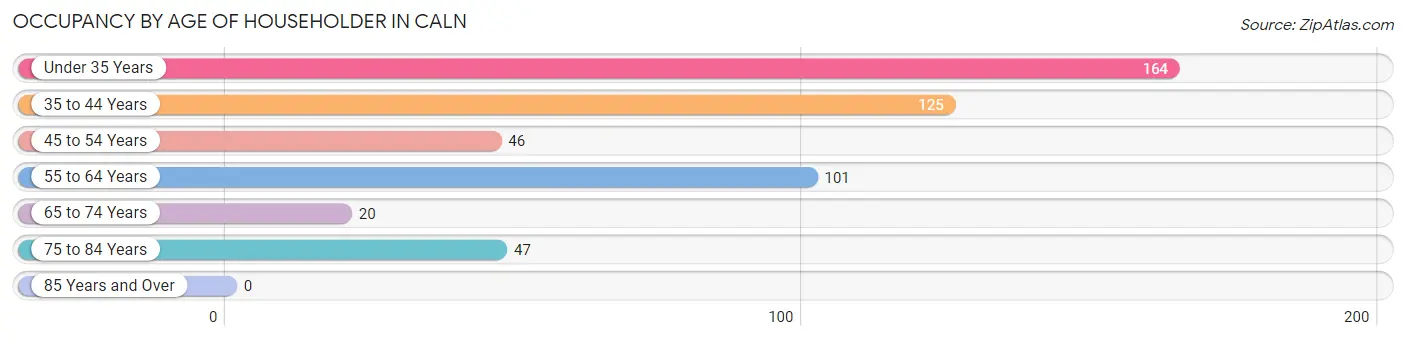
| Age Bracket | # Households | % Households |
| Under 35 Years | 164 | 32.6% |
| 35 to 44 Years | 125 | 24.8% |
| 45 to 54 Years | 46 | 9.1% |
| 55 to 64 Years | 101 | 20.1% |
| 65 to 74 Years | 20 | 4.0% |
| 75 to 84 Years | 47 | 9.3% |
| 85 Years and Over | 0 | 0.0% |
| Total | 503 | 100.0% |
Housing Finances in Caln
Median Income by Occupancy in Caln
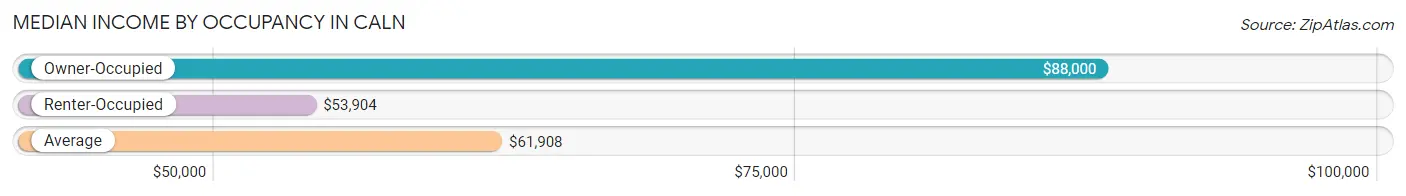
| Occupancy Type | # Households | Median Income |
| Owner-Occupied | 332 (66.0%) | $88,000 |
| Renter-Occupied | 171 (34.0%) | $53,904 |
| Average | 503 (100.0%) | $61,908 |
Occupancy by Householder Income Bracket in Caln
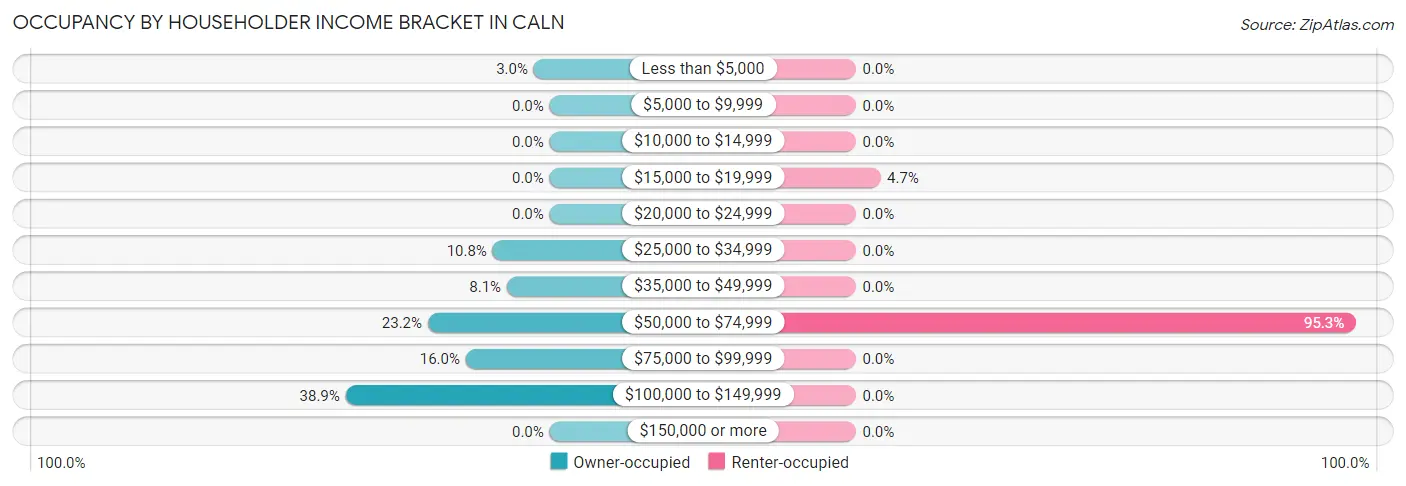
| Income Bracket | Owner-occupied | Renter-occupied |
| Less than $5,000 | 10 (3.0%) | 0 (0.0%) |
| $5,000 to $9,999 | 0 (0.0%) | 0 (0.0%) |
| $10,000 to $14,999 | 0 (0.0%) | 0 (0.0%) |
| $15,000 to $19,999 | 0 (0.0%) | 8 (4.7%) |
| $20,000 to $24,999 | 0 (0.0%) | 0 (0.0%) |
| $25,000 to $34,999 | 36 (10.8%) | 0 (0.0%) |
| $35,000 to $49,999 | 27 (8.1%) | 0 (0.0%) |
| $50,000 to $74,999 | 77 (23.2%) | 163 (95.3%) |
| $75,000 to $99,999 | 53 (16.0%) | 0 (0.0%) |
| $100,000 to $149,999 | 129 (38.9%) | 0 (0.0%) |
| $150,000 or more | 0 (0.0%) | 0 (0.0%) |
| Total | 332 (100.0%) | 171 (100.0%) |
Monthly Housing Cost Tiers in Caln
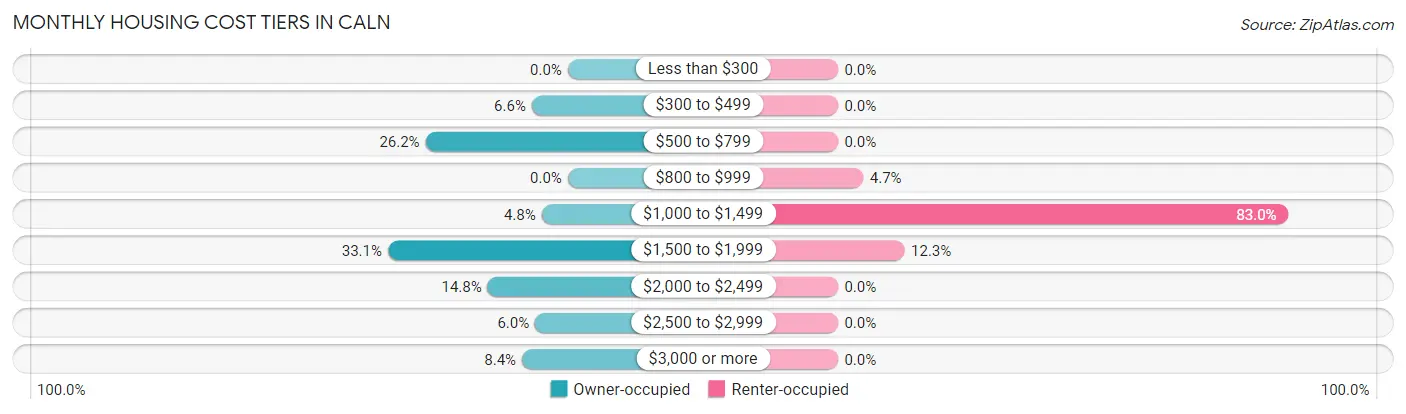
| Monthly Cost | Owner-occupied | Renter-occupied |
| Less than $300 | 0 (0.0%) | 0 (0.0%) |
| $300 to $499 | 22 (6.6%) | 0 (0.0%) |
| $500 to $799 | 87 (26.2%) | 0 (0.0%) |
| $800 to $999 | 0 (0.0%) | 8 (4.7%) |
| $1,000 to $1,499 | 16 (4.8%) | 142 (83.0%) |
| $1,500 to $1,999 | 110 (33.1%) | 21 (12.3%) |
| $2,000 to $2,499 | 49 (14.8%) | 0 (0.0%) |
| $2,500 to $2,999 | 20 (6.0%) | 0 (0.0%) |
| $3,000 or more | 28 (8.4%) | 0 (0.0%) |
| Total | 332 (100.0%) | 171 (100.0%) |
Physical Housing Characteristics in Caln
Housing Structures in Caln
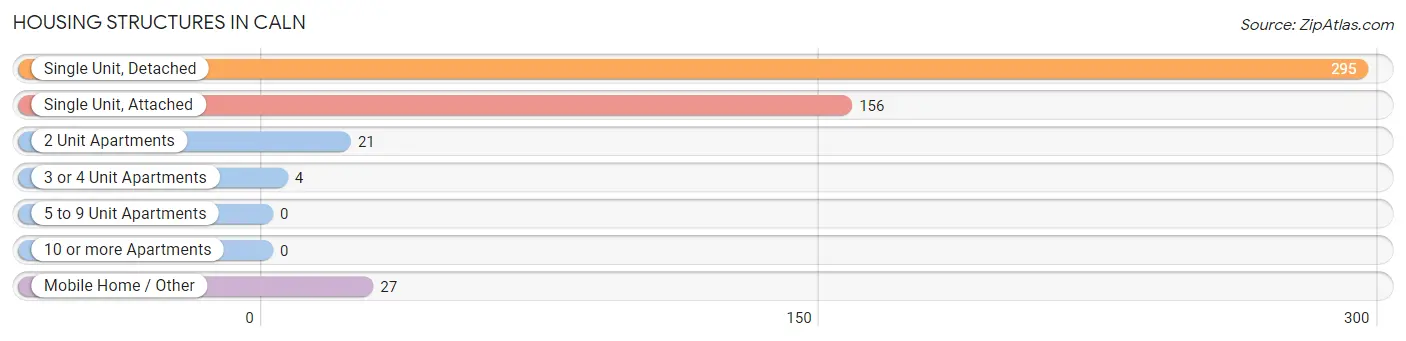
| Structure Type | # Housing Units | % Housing Units |
| Single Unit, Detached | 295 | 58.7% |
| Single Unit, Attached | 156 | 31.0% |
| 2 Unit Apartments | 21 | 4.2% |
| 3 or 4 Unit Apartments | 4 | 0.8% |
| 5 to 9 Unit Apartments | 0 | 0.0% |
| 10 or more Apartments | 0 | 0.0% |
| Mobile Home / Other | 27 | 5.4% |
| Total | 503 | 100.0% |
Housing Structures by Occupancy in Caln
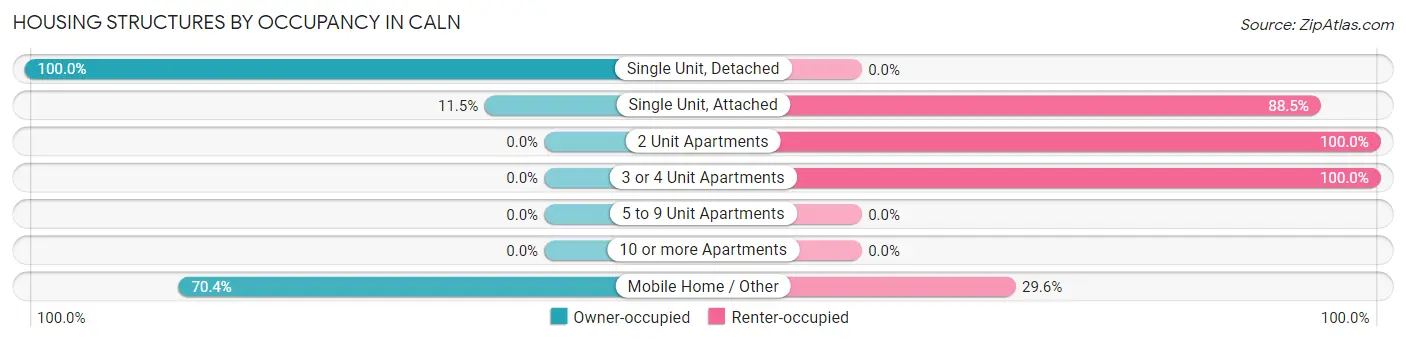
| Structure Type | Owner-occupied | Renter-occupied |
| Single Unit, Detached | 295 (100.0%) | 0 (0.0%) |
| Single Unit, Attached | 18 (11.5%) | 138 (88.5%) |
| 2 Unit Apartments | 0 (0.0%) | 21 (100.0%) |
| 3 or 4 Unit Apartments | 0 (0.0%) | 4 (100.0%) |
| 5 to 9 Unit Apartments | 0 (0.0%) | 0 (0.0%) |
| 10 or more Apartments | 0 (0.0%) | 0 (0.0%) |
| Mobile Home / Other | 19 (70.4%) | 8 (29.6%) |
| Total | 332 (66.0%) | 171 (34.0%) |
Housing Structures by Number of Rooms in Caln
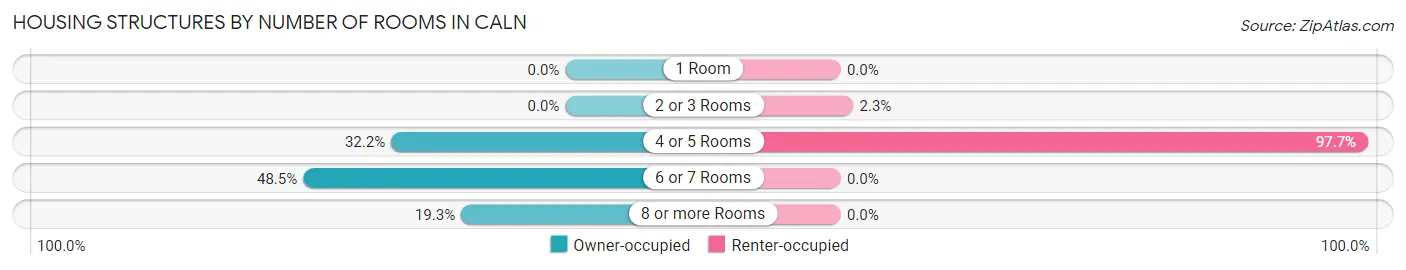
| Number of Rooms | Owner-occupied | Renter-occupied |
| 1 Room | 0 (0.0%) | 0 (0.0%) |
| 2 or 3 Rooms | 0 (0.0%) | 4 (2.3%) |
| 4 or 5 Rooms | 107 (32.2%) | 167 (97.7%) |
| 6 or 7 Rooms | 161 (48.5%) | 0 (0.0%) |
| 8 or more Rooms | 64 (19.3%) | 0 (0.0%) |
| Total | 332 (100.0%) | 171 (100.0%) |
Housing Structure by Heating Type in Caln
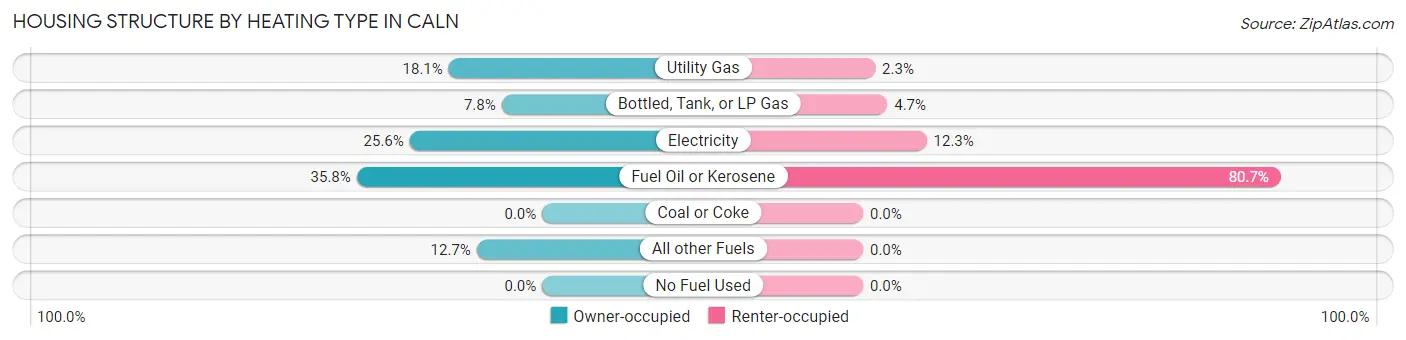
| Heating Type | Owner-occupied | Renter-occupied |
| Utility Gas | 60 (18.1%) | 4 (2.3%) |
| Bottled, Tank, or LP Gas | 26 (7.8%) | 8 (4.7%) |
| Electricity | 85 (25.6%) | 21 (12.3%) |
| Fuel Oil or Kerosene | 119 (35.8%) | 138 (80.7%) |
| Coal or Coke | 0 (0.0%) | 0 (0.0%) |
| All other Fuels | 42 (12.7%) | 0 (0.0%) |
| No Fuel Used | 0 (0.0%) | 0 (0.0%) |
| Total | 332 (100.0%) | 171 (100.0%) |
Household Vehicle Usage in Caln
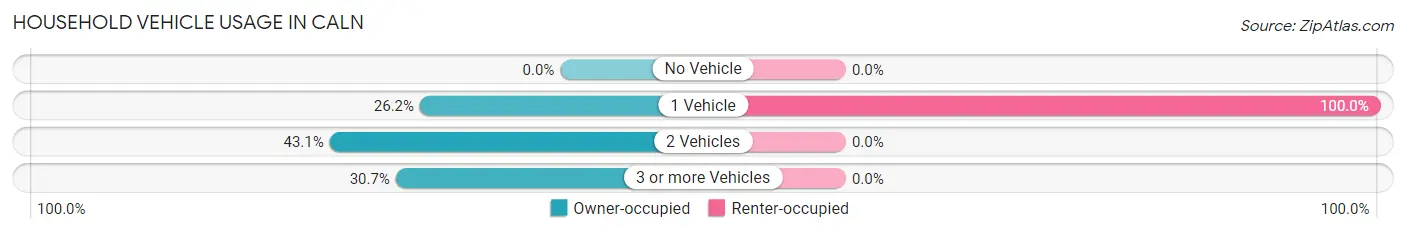
| Vehicles per Household | Owner-occupied | Renter-occupied |
| No Vehicle | 0 (0.0%) | 0 (0.0%) |
| 1 Vehicle | 87 (26.2%) | 171 (100.0%) |
| 2 Vehicles | 143 (43.1%) | 0 (0.0%) |
| 3 or more Vehicles | 102 (30.7%) | 0 (0.0%) |
| Total | 332 (100.0%) | 171 (100.0%) |
Real Estate & Mortgages in Caln
Real Estate and Mortgage Overview in Caln
| Characteristic | Without Mortgage | With Mortgage |
| Housing Units | 117 | 215 |
| Median Property Value | - | - |
| Median Household Income | $61,776 | $0 |
| Monthly Housing Costs | $726 | $28 |
| Real Estate Taxes | $4,500 | $0 |
Property Value by Mortgage Status in Caln
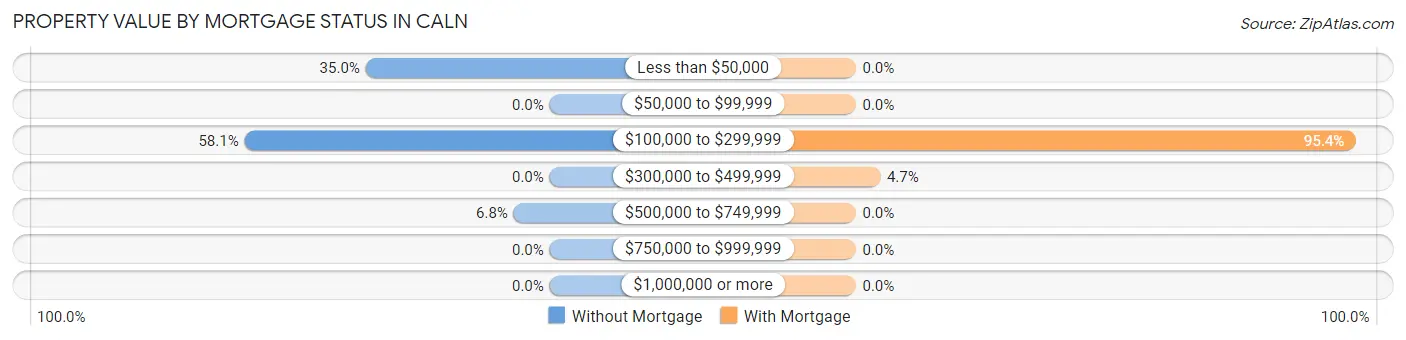
| Property Value | Without Mortgage | With Mortgage |
| Less than $50,000 | 41 (35.0%) | 0 (0.0%) |
| $50,000 to $99,999 | 0 (0.0%) | 0 (0.0%) |
| $100,000 to $299,999 | 68 (58.1%) | 205 (95.4%) |
| $300,000 to $499,999 | 0 (0.0%) | 10 (4.6%) |
| $500,000 to $749,999 | 8 (6.8%) | 0 (0.0%) |
| $750,000 to $999,999 | 0 (0.0%) | 0 (0.0%) |
| $1,000,000 or more | 0 (0.0%) | 0 (0.0%) |
| Total | 117 (100.0%) | 215 (100.0%) |
Household Income by Mortgage Status in Caln
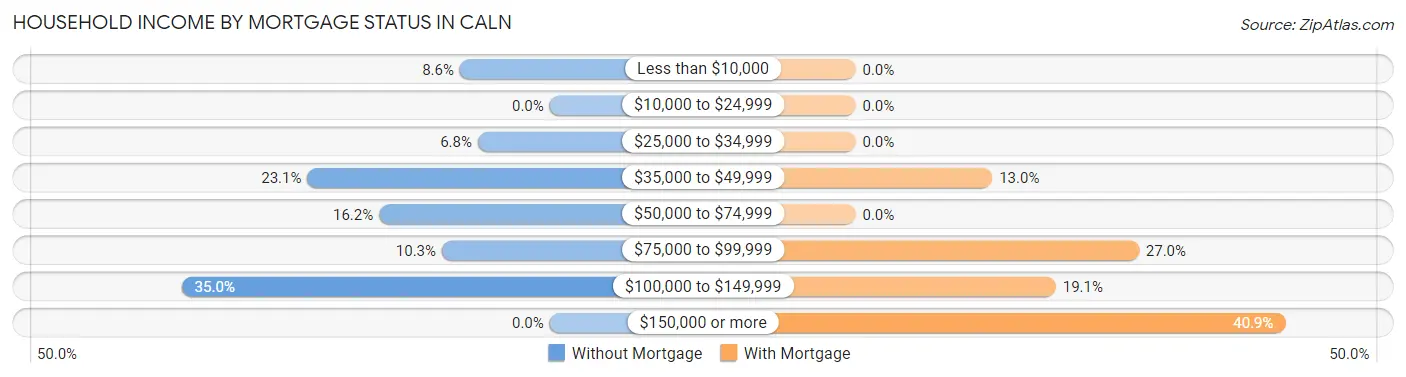
| Household Income | Without Mortgage | With Mortgage |
| Less than $10,000 | 10 (8.6%) | 0 (0.0%) |
| $10,000 to $24,999 | 0 (0.0%) | 0 (0.0%) |
| $25,000 to $34,999 | 8 (6.8%) | 0 (0.0%) |
| $35,000 to $49,999 | 27 (23.1%) | 28 (13.0%) |
| $50,000 to $74,999 | 19 (16.2%) | 0 (0.0%) |
| $75,000 to $99,999 | 12 (10.3%) | 58 (27.0%) |
| $100,000 to $149,999 | 41 (35.0%) | 41 (19.1%) |
| $150,000 or more | 0 (0.0%) | 88 (40.9%) |
| Total | 117 (100.0%) | 215 (100.0%) |
Property Value to Household Income Ratio in Caln
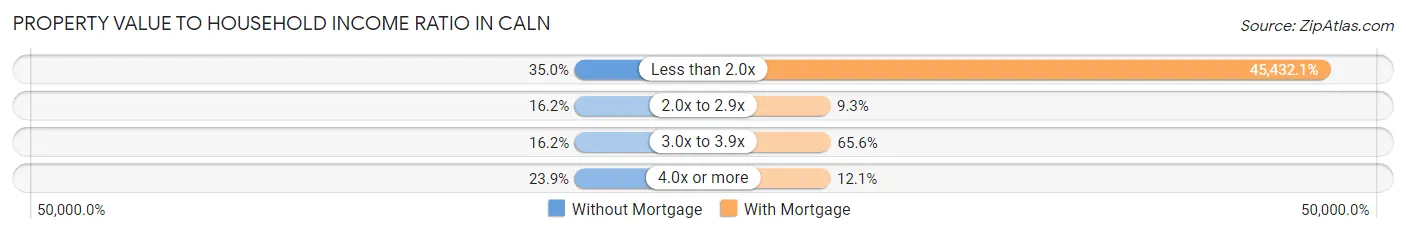
| Value-to-Income Ratio | Without Mortgage | With Mortgage |
| Less than 2.0x | 41 (35.0%) | 97,679 (45,432.1%) |
| 2.0x to 2.9x | 19 (16.2%) | 20 (9.3%) |
| 3.0x to 3.9x | 19 (16.2%) | 141 (65.6%) |
| 4.0x or more | 28 (23.9%) | 26 (12.1%) |
| Total | 117 (100.0%) | 215 (100.0%) |
Real Estate Taxes by Mortgage Status in Caln
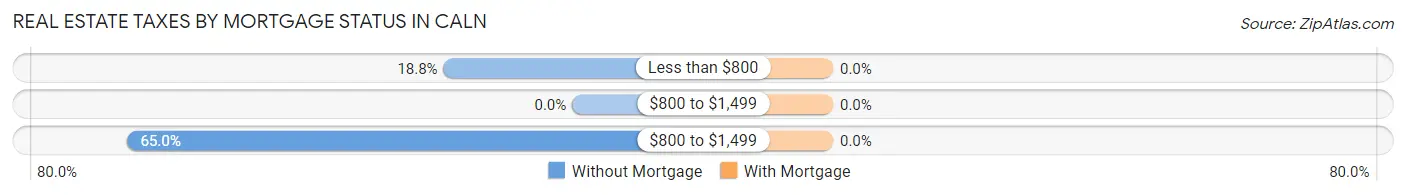
| Property Taxes | Without Mortgage | With Mortgage |
| Less than $800 | 22 (18.8%) | 0 (0.0%) |
| $800 to $1,499 | 0 (0.0%) | 0 (0.0%) |
| $800 to $1,499 | 76 (65.0%) | 0 (0.0%) |
| Total | 117 (100.0%) | 215 (100.0%) |
Health & Disability in Caln
Health Insurance Coverage by Age in Caln
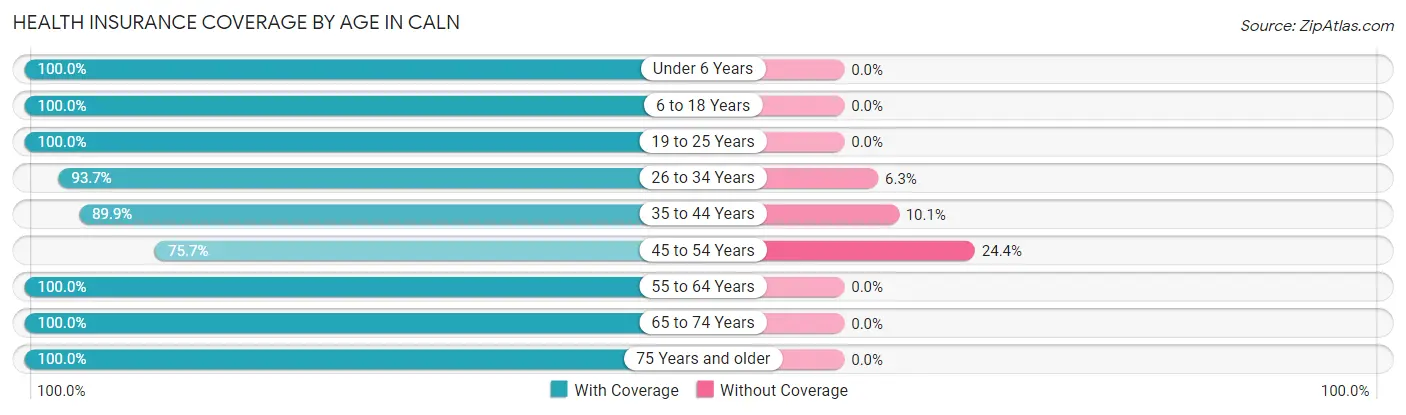
| Age Bracket | With Coverage | Without Coverage |
| Under 6 Years | 265 (100.0%) | 0 (0.0%) |
| 6 to 18 Years | 241 (100.0%) | 0 (0.0%) |
| 19 to 25 Years | 59 (100.0%) | 0 (0.0%) |
| 26 to 34 Years | 312 (93.7%) | 21 (6.3%) |
| 35 to 44 Years | 186 (89.9%) | 21 (10.1%) |
| 45 to 54 Years | 87 (75.6%) | 28 (24.3%) |
| 55 to 64 Years | 121 (100.0%) | 0 (0.0%) |
| 65 to 74 Years | 46 (100.0%) | 0 (0.0%) |
| 75 Years and older | 76 (100.0%) | 0 (0.0%) |
| Total | 1,393 (95.2%) | 70 (4.8%) |
Health Insurance Coverage by Citizenship Status in Caln
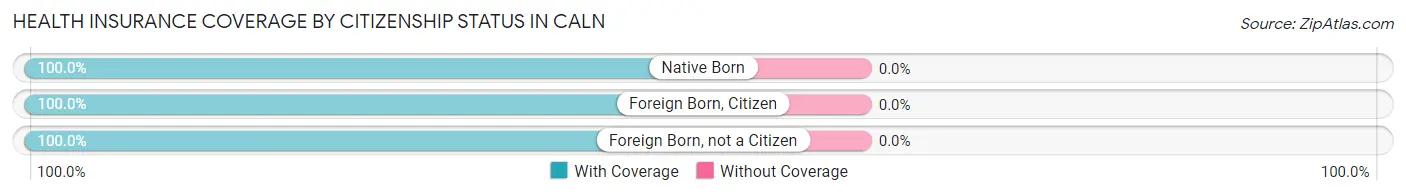
| Citizenship Status | With Coverage | Without Coverage |
| Native Born | 265 (100.0%) | 0 (0.0%) |
| Foreign Born, Citizen | 241 (100.0%) | 0 (0.0%) |
| Foreign Born, not a Citizen | 59 (100.0%) | 0 (0.0%) |
Health Insurance Coverage by Household Income in Caln
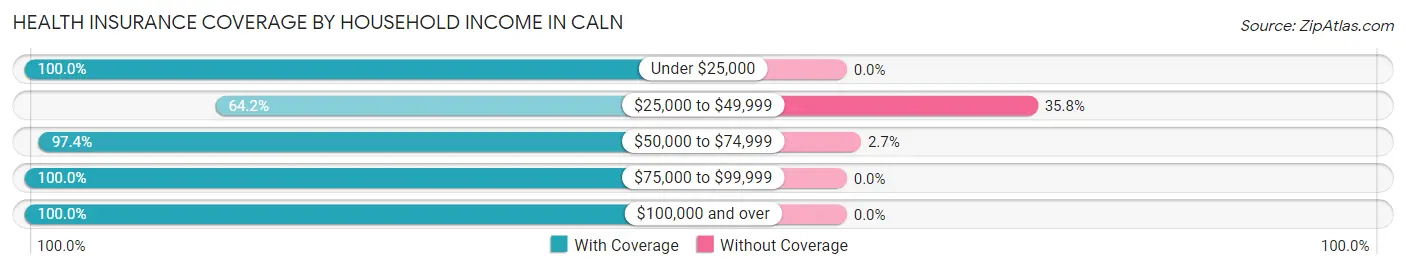
| Household Income | With Coverage | Without Coverage |
| Under $25,000 | 45 (100.0%) | 0 (0.0%) |
| $25,000 to $49,999 | 88 (64.2%) | 49 (35.8%) |
| $50,000 to $74,999 | 770 (97.4%) | 21 (2.6%) |
| $75,000 to $99,999 | 76 (100.0%) | 0 (0.0%) |
| $100,000 and over | 414 (100.0%) | 0 (0.0%) |
Public vs Private Health Insurance Coverage by Age in Caln
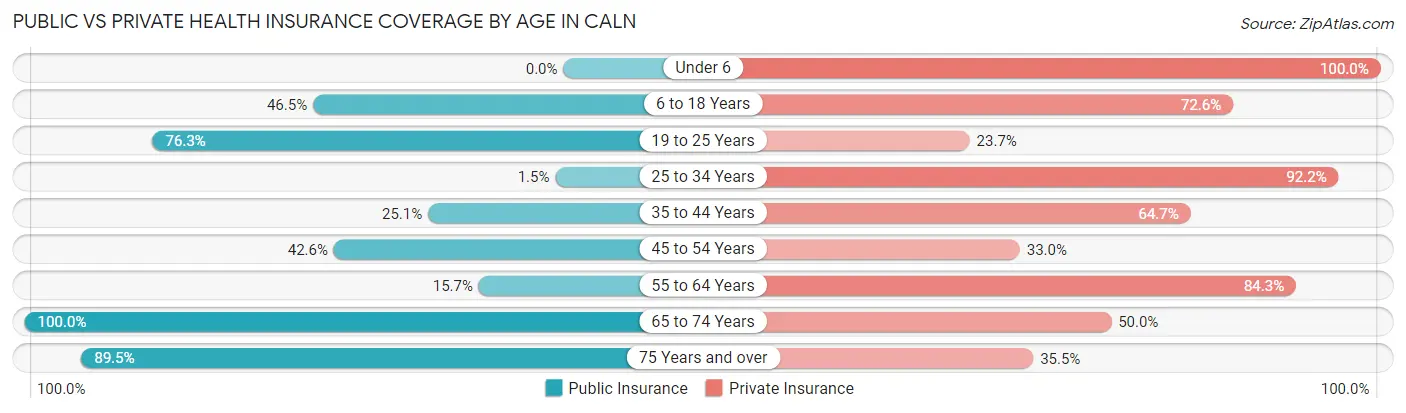
| Age Bracket | Public Insurance | Private Insurance |
| Under 6 | 0 (0.0%) | 265 (100.0%) |
| 6 to 18 Years | 112 (46.5%) | 175 (72.6%) |
| 19 to 25 Years | 45 (76.3%) | 14 (23.7%) |
| 25 to 34 Years | 5 (1.5%) | 307 (92.2%) |
| 35 to 44 Years | 52 (25.1%) | 134 (64.7%) |
| 45 to 54 Years | 49 (42.6%) | 38 (33.0%) |
| 55 to 64 Years | 19 (15.7%) | 102 (84.3%) |
| 65 to 74 Years | 46 (100.0%) | 23 (50.0%) |
| 75 Years and over | 68 (89.5%) | 27 (35.5%) |
| Total | 396 (27.1%) | 1,085 (74.2%) |
Disability Status by Sex by Age in Caln
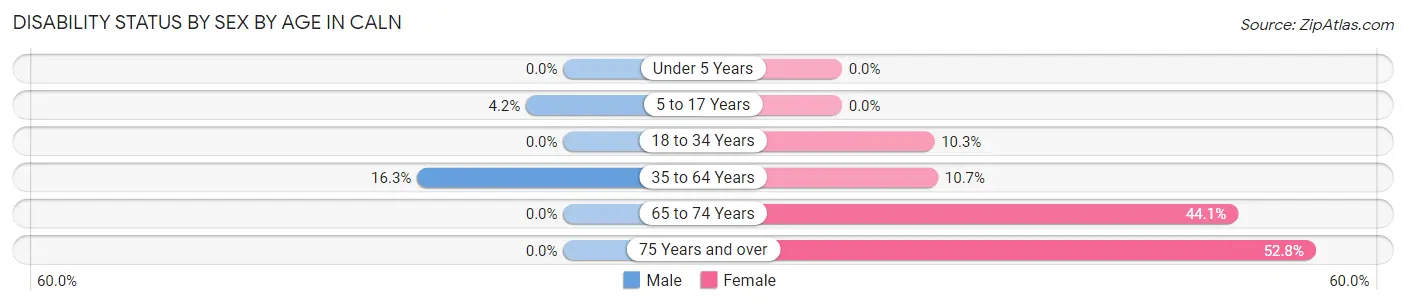
| Age Bracket | Male | Female |
| Under 5 Years | 0 (0.0%) | 0 (0.0%) |
| 5 to 17 Years | 10 (4.2%) | 0 (0.0%) |
| 18 to 34 Years | 0 (0.0%) | 21 (10.3%) |
| 35 to 64 Years | 28 (16.3%) | 29 (10.7%) |
| 65 to 74 Years | 0 (0.0%) | 15 (44.1%) |
| 75 Years and over | 0 (0.0%) | 19 (52.8%) |
Disability Class by Sex by Age in Caln
Disability Class: Hearing Difficulty
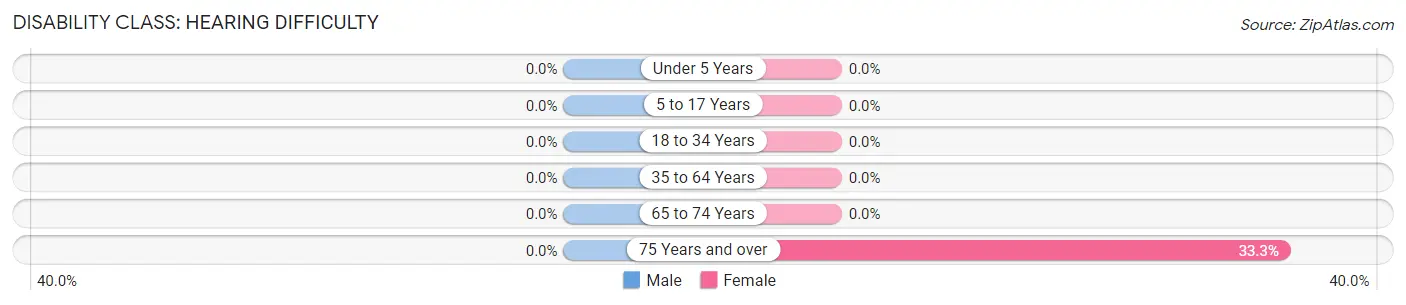
| Age Bracket | Male | Female |
| Under 5 Years | 0 (0.0%) | 0 (0.0%) |
| 5 to 17 Years | 0 (0.0%) | 0 (0.0%) |
| 18 to 34 Years | 0 (0.0%) | 0 (0.0%) |
| 35 to 64 Years | 0 (0.0%) | 0 (0.0%) |
| 65 to 74 Years | 0 (0.0%) | 0 (0.0%) |
| 75 Years and over | 0 (0.0%) | 12 (33.3%) |
Disability Class: Vision Difficulty
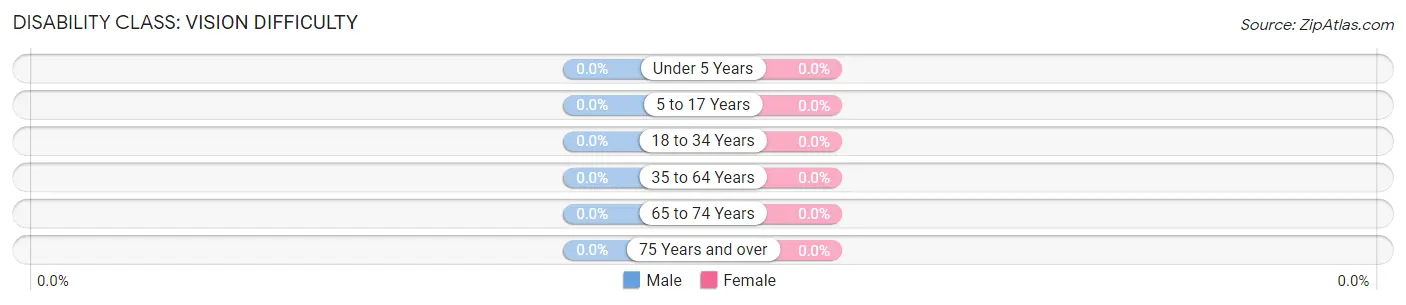
| Age Bracket | Male | Female |
| Under 5 Years | 0 (0.0%) | 0 (0.0%) |
| 5 to 17 Years | 0 (0.0%) | 0 (0.0%) |
| 18 to 34 Years | 0 (0.0%) | 0 (0.0%) |
| 35 to 64 Years | 0 (0.0%) | 0 (0.0%) |
| 65 to 74 Years | 0 (0.0%) | 0 (0.0%) |
| 75 Years and over | 0 (0.0%) | 0 (0.0%) |
Disability Class: Cognitive Difficulty
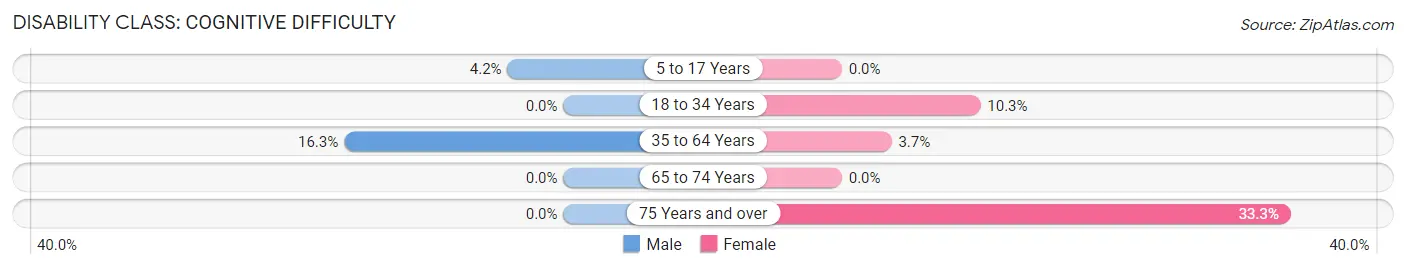
| Age Bracket | Male | Female |
| 5 to 17 Years | 10 (4.2%) | 0 (0.0%) |
| 18 to 34 Years | 0 (0.0%) | 21 (10.3%) |
| 35 to 64 Years | 28 (16.3%) | 10 (3.7%) |
| 65 to 74 Years | 0 (0.0%) | 0 (0.0%) |
| 75 Years and over | 0 (0.0%) | 12 (33.3%) |
Disability Class: Ambulatory Difficulty
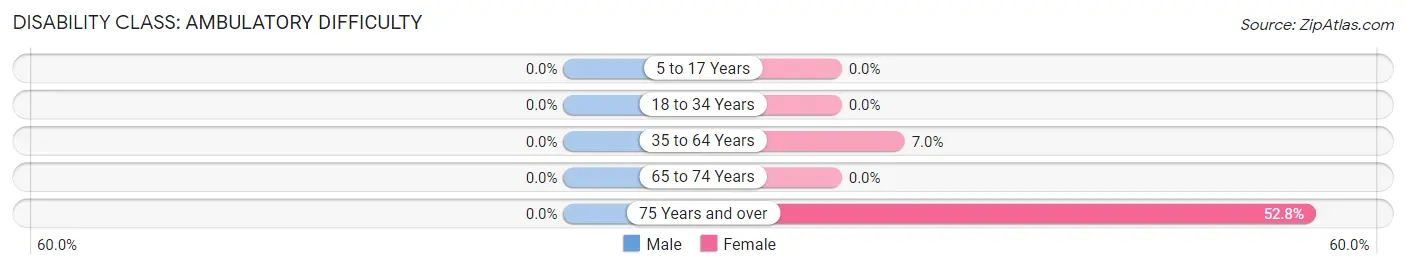
| Age Bracket | Male | Female |
| 5 to 17 Years | 0 (0.0%) | 0 (0.0%) |
| 18 to 34 Years | 0 (0.0%) | 0 (0.0%) |
| 35 to 64 Years | 0 (0.0%) | 19 (7.0%) |
| 65 to 74 Years | 0 (0.0%) | 0 (0.0%) |
| 75 Years and over | 0 (0.0%) | 19 (52.8%) |
Disability Class: Self-Care Difficulty
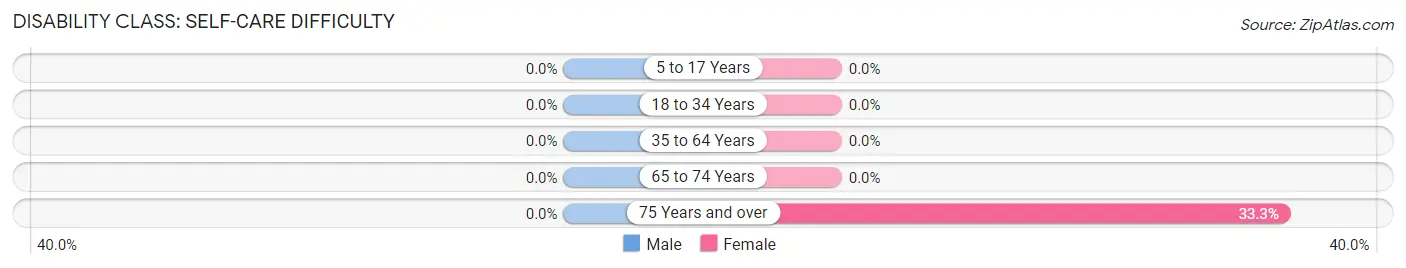
| Age Bracket | Male | Female |
| 5 to 17 Years | 0 (0.0%) | 0 (0.0%) |
| 18 to 34 Years | 0 (0.0%) | 0 (0.0%) |
| 35 to 64 Years | 0 (0.0%) | 0 (0.0%) |
| 65 to 74 Years | 0 (0.0%) | 0 (0.0%) |
| 75 Years and over | 0 (0.0%) | 12 (33.3%) |
Technology Access in Caln
Computing Device Access in Caln
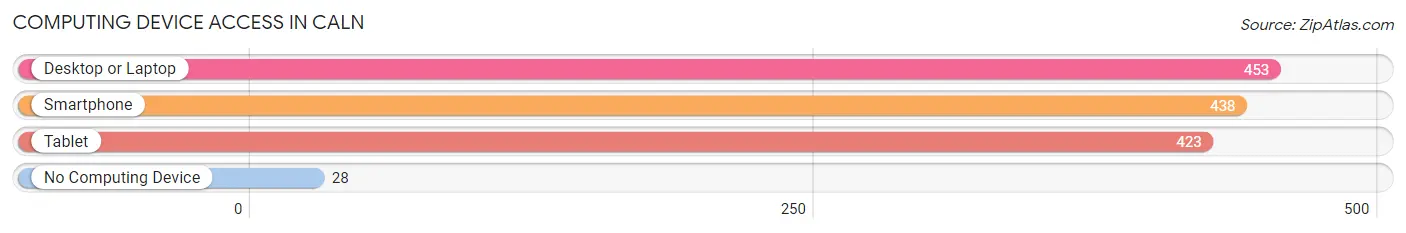
| Device Type | # Households | % Households |
| Desktop or Laptop | 453 | 90.1% |
| Smartphone | 438 | 87.1% |
| Tablet | 423 | 84.1% |
| No Computing Device | 28 | 5.6% |
| Total | 503 | 100.0% |
Internet Access in Caln
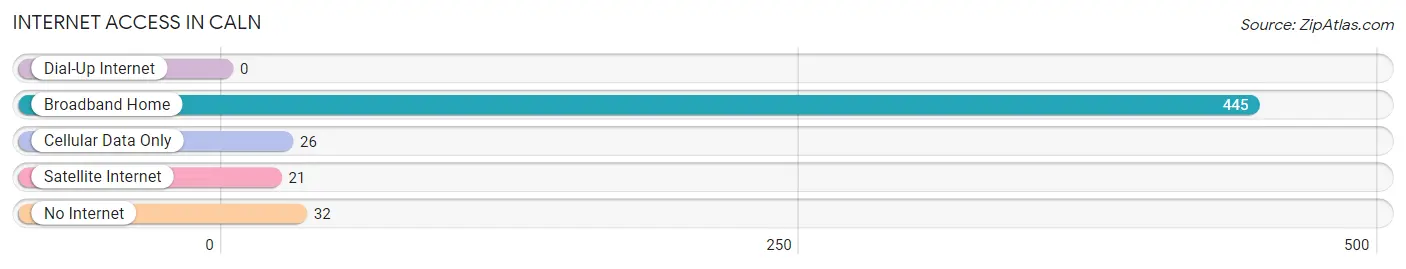
| Internet Type | # Households | % Households |
| Dial-Up Internet | 0 | 0.0% |
| Broadband Home | 445 | 88.5% |
| Cellular Data Only | 26 | 5.2% |
| Satellite Internet | 21 | 4.2% |
| No Internet | 32 | 6.4% |
| Total | 503 | 100.0% |
Caln Summary
Caln Township is a township located in Chester County, Pennsylvania. It is situated in the southeastern corner of the county, and is bordered by West Caln Township to the north, East Caln Township to the east, West Brandywine Township to the south, and East Brandywine Township to the west. The township is home to a population of approximately 11,000 people, and is part of the greater Philadelphia metropolitan area.
Geography
Caln Township is located in southeastern Chester County, Pennsylvania. It is bordered by West Caln Township to the north, East Caln Township to the east, West Brandywine Township to the south, and East Brandywine Township to the west. The township covers an area of approximately 11.5 square miles, and is situated at an elevation of approximately 500 feet above sea level. The township is located in the Piedmont region of Pennsylvania, and is characterized by rolling hills and valleys. The township is drained by the Brandywine Creek, which flows through the township from east to west.
Economy
Caln Township is home to a variety of businesses and industries. The township is home to several large employers, including the Caln Township School District, the Caln Township Police Department, and the Caln Township Fire Department. The township is also home to a number of small businesses, including retail stores, restaurants, and professional services. The township is also home to a number of industrial parks, which are home to a variety of manufacturing and distribution companies.
Demographics
As of the 2010 census, Caln Township had a population of 11,000 people. The racial makeup of the township was 87.3% White, 8.2% African American, 0.7% Asian, 0.3% Native American, and 3.5% from other races. The median household income in the township was $63,000, and the median family income was $71,000. The per capita income in the township was $27,000.
History
Caln Township was first settled in the late 17th century by English and Welsh immigrants. The township was officially incorporated in 1717, and was named after the Welsh town of Caerleon. The township was originally a farming community, and remained largely rural until the mid-20th century. In the 1950s, the township began to experience rapid growth, as the Philadelphia metropolitan area began to expand. The township has continued to grow since then, and is now home to a diverse population of 11,000 people.
Common Questions
What is Per Capita Income in Caln?
Per Capita income in Caln is $24,508.
What is the Median Family Income in Caln?
Median Family Income in Caln is $54,728.
What is the Median Household income in Caln?
Median Household Income in Caln is $61,908.
What is Income or Wage Gap in Caln?
Income or Wage Gap in Caln is 1.3%.
Women in Caln earn 98.7 cents for every dollar earned by a man.
What is Inequality or Gini Index in Caln?
Inequality or Gini Index in Caln is 0.24.
What is the Total Population of Caln?
Total Population of Caln is 1,463.
What is the Total Male Population of Caln?
Total Male Population of Caln is 696.
What is the Total Female Population of Caln?
Total Female Population of Caln is 767.
What is the Ratio of Males per 100 Females in Caln?
There are 90.74 Males per 100 Females in Caln.
What is the Ratio of Females per 100 Males in Caln?
There are 110.20 Females per 100 Males in Caln.
What is the Median Population Age in Caln?
Median Population Age in Caln is 31.4 Years.
What is the Average Family Size in Caln
Average Family Size in Caln is 3.4 People.
What is the Average Household Size in Caln
Average Household Size in Caln is 2.9 People.
How Large is the Labor Force in Caln?
There are 725 People in the Labor Forcein in Caln.
What is the Percentage of People in the Labor Force in Caln?
74.7% of People are in the Labor Force in Caln.
What is the Unemployment Rate in Caln?
Unemployment Rate in Caln is 7.0%.