Cities with the Highest Percentage of Ecuadorian Population in Pennsylvania
RELATED REPORTS & OPTIONS
Ecuadorian
Pennsylvania
Compare Cities
Map of Cities with the Highest Percentage of Ecuadorian Population in Pennsylvania
0.00%
25.00%
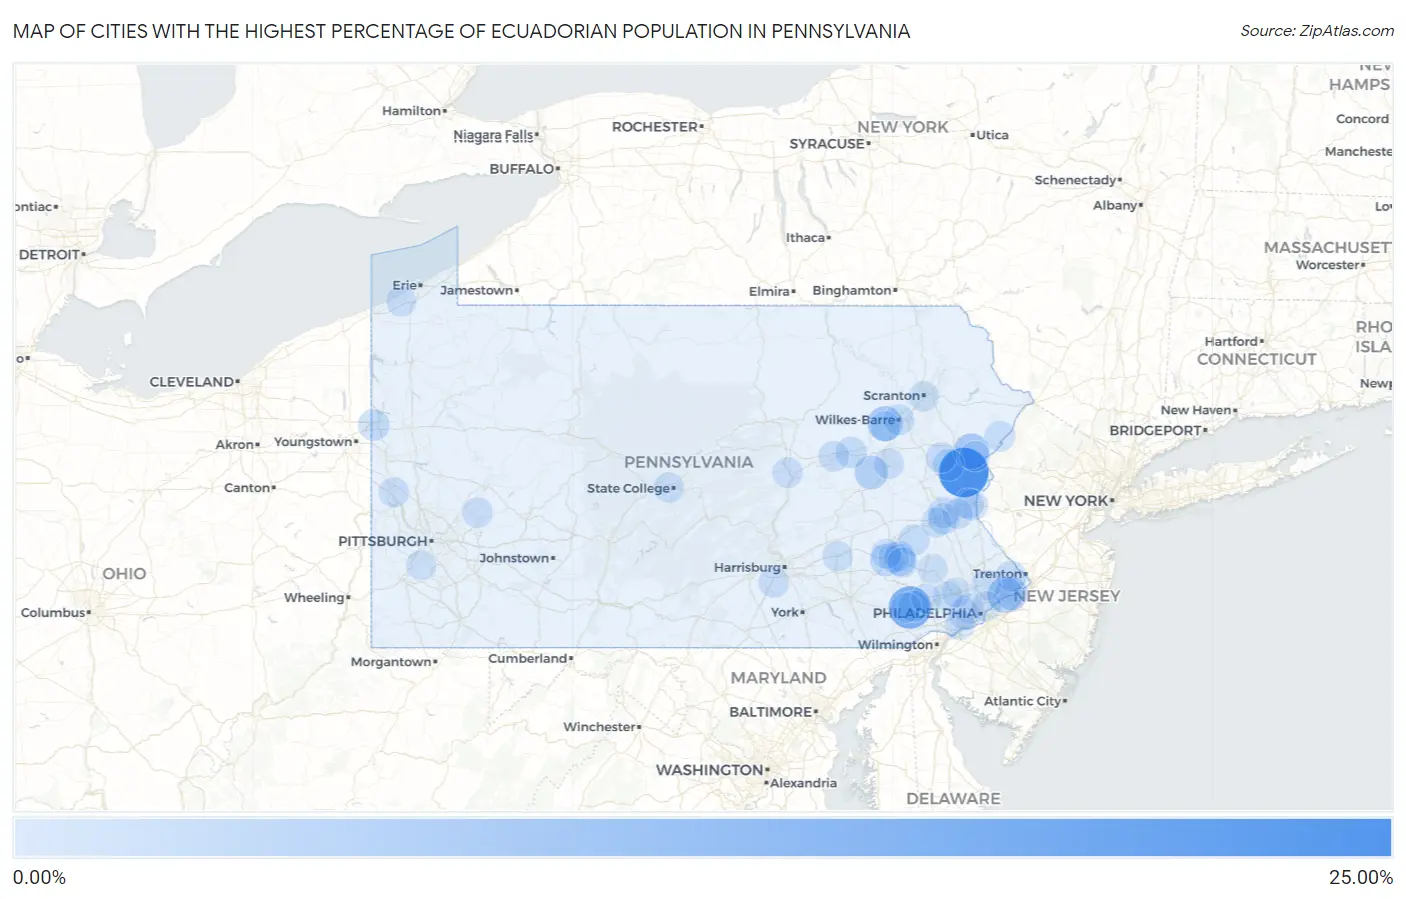
Cities with the Highest Percentage of Ecuadorian Population in Pennsylvania
| City | Ecuadorian | vs State | vs National | |
| 1. | Saylorsburg | 22.28% | 0.15%(+22.1)#1 | 0.24%(+22.0)#7 |
| 2. | Caln | 13.94% | 0.15%(+13.8)#2 | 0.24%(+13.7)#16 |
| 3. | Fawn Grove Borough | 8.22% | 0.15%(+8.07)#3 | 0.24%(+7.98)#47 |
| 4. | Le Raysville Borough | 7.61% | 0.15%(+7.46)#4 | 0.24%(+7.37)#49 |
| 5. | Penn Estates | 6.23% | 0.15%(+6.08)#5 | 0.24%(+5.99)#65 |
| 6. | Cornwells Heights | 6.20% | 0.15%(+6.05)#6 | 0.24%(+5.96)#66 |
| 7. | West Nanticoke | 5.68% | 0.15%(+5.53)#7 | 0.24%(+5.44)#73 |
| 8. | Sheppton | 3.77% | 0.15%(+3.62)#8 | 0.24%(+3.53)#110 |
| 9. | Shenandoah Borough | 3.61% | 0.15%(+3.46)#9 | 0.24%(+3.37)#115 |
| 10. | North Catasauqua Borough | 3.59% | 0.15%(+3.44)#10 | 0.24%(+3.34)#118 |
| 11. | Croydon | 3.48% | 0.15%(+3.33)#11 | 0.24%(+3.23)#124 |
| 12. | Coplay Borough | 3.22% | 0.15%(+3.07)#12 | 0.24%(+2.97)#145 |
| 13. | New Milford Borough | 3.10% | 0.15%(+2.95)#13 | 0.24%(+2.86)#149 |
| 14. | Stroudsburg Borough | 3.05% | 0.15%(+2.90)#14 | 0.24%(+2.81)#152 |
| 15. | Lincoln Park | 2.68% | 0.15%(+2.53)#15 | 0.24%(+2.43)#178 |
| 16. | East Stroudsburg Borough | 2.68% | 0.15%(+2.52)#16 | 0.24%(+2.43)#179 |
| 17. | Lansdowne Borough | 2.19% | 0.15%(+2.04)#17 | 0.24%(+1.95)#230 |
| 18. | West Easton Borough | 2.09% | 0.15%(+1.94)#18 | 0.24%(+1.85)#245 |
| 19. | Freemansburg Borough | 2.06% | 0.15%(+1.91)#19 | 0.24%(+1.82)#250 |
| 20. | Great Bend Borough | 1.93% | 0.15%(+1.78)#20 | 0.24%(+1.69)#279 |
| 21. | Reiffton | 1.91% | 0.15%(+1.76)#21 | 0.24%(+1.67)#284 |
| 22. | Mckinley | 1.80% | 0.15%(+1.65)#22 | 0.24%(+1.56)#302 |
| 23. | Walnutport Borough | 1.67% | 0.15%(+1.52)#23 | 0.24%(+1.43)#328 |
| 24. | Effort | 1.66% | 0.15%(+1.51)#24 | 0.24%(+1.41)#331 |
| 25. | Farrell | 1.64% | 0.15%(+1.49)#25 | 0.24%(+1.39)#335 |
| 26. | Fullerton | 1.43% | 0.15%(+1.28)#26 | 0.24%(+1.19)#383 |
| 27. | Allentown | 1.41% | 0.15%(+1.26)#27 | 0.24%(+1.17)#392 |
| 28. | Zelienople Borough | 1.40% | 0.15%(+1.25)#28 | 0.24%(+1.15)#399 |
| 29. | Tarentum Borough | 1.36% | 0.15%(+1.21)#29 | 0.24%(+1.12)#408 |
| 30. | Mifflinville | 1.33% | 0.15%(+1.18)#30 | 0.24%(+1.09)#422 |
| 31. | Hayti | 1.26% | 0.15%(+1.11)#31 | 0.24%(+1.01)#445 |
| 32. | Chester Heights Borough | 1.21% | 0.15%(+1.06)#32 | 0.24%(+0.965)#465 |
| 33. | Thorndale | 1.20% | 0.15%(+1.05)#33 | 0.24%(+0.955)#470 |
| 34. | Easton | 1.14% | 0.15%(+0.992)#34 | 0.24%(+0.900)#491 |
| 35. | New Jerusalem | 1.11% | 0.15%(+0.961)#35 | 0.24%(+0.868)#503 |
| 36. | Trappe Borough | 1.06% | 0.15%(+0.906)#36 | 0.24%(+0.814)#525 |
| 37. | Wilkes Barre | 1.05% | 0.15%(+0.899)#37 | 0.24%(+0.807)#529 |
| 38. | Milford Borough | 0.94% | 0.15%(+0.793)#38 | 0.24%(+0.701)#578 |
| 39. | Woodbourne | 0.87% | 0.15%(+0.716)#39 | 0.24%(+0.623)#610 |
| 40. | Indian Mountain Lake | 0.85% | 0.15%(+0.703)#40 | 0.24%(+0.611)#620 |
| 41. | Robesonia Borough | 0.84% | 0.15%(+0.687)#41 | 0.24%(+0.595)#629 |
| 42. | Shiremanstown Borough | 0.80% | 0.15%(+0.649)#42 | 0.24%(+0.557)#659 |
| 43. | Mcadoo Borough | 0.77% | 0.15%(+0.624)#43 | 0.24%(+0.532)#683 |
| 44. | Pine Ridge | 0.77% | 0.15%(+0.618)#44 | 0.24%(+0.525)#689 |
| 45. | Bloomsburg | 0.76% | 0.15%(+0.605)#45 | 0.24%(+0.513)#703 |
| 46. | North Apollo Borough | 0.73% | 0.15%(+0.576)#46 | 0.24%(+0.484)#730 |
| 47. | Winfield | 0.71% | 0.15%(+0.556)#47 | 0.24%(+0.464)#751 |
| 48. | Hyde Park | 0.69% | 0.15%(+0.536)#48 | 0.24%(+0.443)#769 |
| 49. | Emsworth Borough | 0.67% | 0.15%(+0.523)#49 | 0.24%(+0.431)#789 |
| 50. | Palmer Heights | 0.64% | 0.15%(+0.492)#50 | 0.24%(+0.399)#820 |
| 51. | Plymouth Borough | 0.64% | 0.15%(+0.491)#51 | 0.24%(+0.398)#822 |
| 52. | Bethlehem | 0.63% | 0.15%(+0.482)#52 | 0.24%(+0.389)#838 |
| 53. | Pennsbury Village Borough | 0.63% | 0.15%(+0.482)#53 | 0.24%(+0.389)#839 |
| 54. | Beaver Meadows Borough | 0.62% | 0.15%(+0.474)#54 | 0.24%(+0.381)#847 |
| 55. | Hanover Borough | 0.56% | 0.15%(+0.410)#55 | 0.24%(+0.318)#921 |
| 56. | Roaring Spring Borough | 0.56% | 0.15%(+0.407)#56 | 0.24%(+0.315)#926 |
| 57. | Pennside | 0.55% | 0.15%(+0.404)#57 | 0.24%(+0.311)#928 |
| 58. | Hazleton | 0.54% | 0.15%(+0.392)#58 | 0.24%(+0.300)#947 |
| 59. | Drexel Hill | 0.54% | 0.15%(+0.387)#59 | 0.24%(+0.294)#957 |
| 60. | Reading | 0.53% | 0.15%(+0.377)#60 | 0.24%(+0.285)#968 |
| 61. | Catawissa Borough | 0.50% | 0.15%(+0.354)#61 | 0.24%(+0.262)#996 |
| 62. | Souderton Borough | 0.47% | 0.15%(+0.324)#62 | 0.24%(+0.231)#1,036 |
| 63. | Fairview | 0.47% | 0.15%(+0.323)#63 | 0.24%(+0.230)#1,039 |
| 64. | Penn Wynne | 0.46% | 0.15%(+0.307)#64 | 0.24%(+0.214)#1,059 |
| 65. | Messiah College | 0.45% | 0.15%(+0.295)#65 | 0.24%(+0.202)#1,069 |
| 66. | Park Forest Village | 0.42% | 0.15%(+0.274)#66 | 0.24%(+0.181)#1,100 |
| 67. | Beaver Falls | 0.40% | 0.15%(+0.253)#67 | 0.24%(+0.160)#1,137 |
| 68. | Arlington Heights | 0.39% | 0.15%(+0.238)#68 | 0.24%(+0.145)#1,174 |
| 69. | Lebanon | 0.39% | 0.15%(+0.236)#69 | 0.24%(+0.143)#1,179 |
| 70. | Scranton | 0.35% | 0.15%(+0.199)#70 | 0.24%(+0.107)#1,252 |
| 71. | Macungie Borough | 0.34% | 0.15%(+0.188)#71 | 0.24%(+0.096)#1,274 |
| 72. | Spring Ridge | 0.33% | 0.15%(+0.184)#72 | 0.24%(+0.091)#1,284 |
| 73. | Dormont Borough | 0.33% | 0.15%(+0.179)#73 | 0.24%(+0.087)#1,295 |
| 74. | Wescosville | 0.32% | 0.15%(+0.173)#74 | 0.24%(+0.081)#1,306 |
| 75. | Lorane | 0.32% | 0.15%(+0.170)#75 | 0.24%(+0.078)#1,313 |
| 76. | Woodlyn | 0.32% | 0.15%(+0.169)#76 | 0.24%(+0.076)#1,316 |
| 77. | Emmaus Borough | 0.31% | 0.15%(+0.159)#77 | 0.24%(+0.066)#1,340 |
| 78. | Wilson Borough | 0.30% | 0.15%(+0.154)#78 | 0.24%(+0.062)#1,349 |
| 79. | Coatesville | 0.30% | 0.15%(+0.150)#79 | 0.24%(+0.058)#1,366 |
| 80. | Pen Argyl Borough | 0.28% | 0.15%(+0.135)#80 | 0.24%(+0.042)#1,403 |
| 81. | Phoenixville Borough | 0.28% | 0.15%(+0.127)#81 | 0.24%(+0.035)#1,424 |
| 82. | Bristol Borough | 0.27% | 0.15%(+0.123)#82 | 0.24%(+0.031)#1,433 |
| 83. | Yeadon Borough | 0.26% | 0.15%(+0.108)#83 | 0.24%(+0.015)#1,482 |
| 84. | Willow Grove | 0.25% | 0.15%(+0.104)#84 | 0.24%(+0.012)#1,493 |
| 85. | Dickson City Borough | 0.25% | 0.15%(+0.099)#85 | 0.24%(+0.006)#1,506 |
| 86. | Middletown Borough | 0.24% | 0.15%(+0.091)#86 | 0.24%(-0.001)#1,530 |
| 87. | Tremont Borough | 0.24% | 0.15%(+0.088)#87 | 0.24%(-0.005)#1,542 |
| 88. | West Hazleton Borough | 0.23% | 0.15%(+0.084)#88 | 0.24%(-0.009)#1,557 |
| 89. | Spring Grove Borough | 0.23% | 0.15%(+0.083)#89 | 0.24%(-0.009)#1,558 |
| 90. | Lionville | 0.22% | 0.15%(+0.073)#90 | 0.24%(-0.020)#1,596 |
| 91. | Chesterbrook | 0.22% | 0.15%(+0.071)#91 | 0.24%(-0.022)#1,604 |
| 92. | Sanatoga | 0.22% | 0.15%(+0.065)#92 | 0.24%(-0.028)#1,630 |
| 93. | Evans City Borough | 0.20% | 0.15%(+0.050)#93 | 0.24%(-0.043)#1,693 |
| 94. | West Chester Borough | 0.20% | 0.15%(+0.050)#94 | 0.24%(-0.043)#1,694 |
| 95. | Edgewood Borough | 0.19% | 0.15%(+0.043)#95 | 0.24%(-0.049)#1,720 |
| 96. | Mcmurray | 0.19% | 0.15%(+0.042)#96 | 0.24%(-0.050)#1,724 |
| 97. | New Cumberland Borough | 0.19% | 0.15%(+0.036)#97 | 0.24%(-0.056)#1,749 |
| 98. | Philadelphia | 0.18% | 0.15%(+0.031)#98 | 0.24%(-0.061)#1,769 |
| 99. | King Of Prussia | 0.17% | 0.15%(+0.022)#99 | 0.24%(-0.071)#1,806 |
| 100. | Nanticoke | 0.17% | 0.15%(+0.019)#100 | 0.24%(-0.073)#1,816 |
Common Questions
What are the Top 10 Cities with the Highest Percentage of Ecuadorian Population in Pennsylvania?
Top 10 Cities with the Highest Percentage of Ecuadorian Population in Pennsylvania are:
#1
22.28%
#2
13.94%
#3
6.23%
#4
6.20%
#5
5.68%
#6
3.77%
#7
3.48%
#8
2.68%
#9
1.91%
#10
1.66%
What city has the Highest Percentage of Ecuadorian Population in Pennsylvania?
Saylorsburg has the Highest Percentage of Ecuadorian Population in Pennsylvania with 22.28%.
What is the Percentage of Ecuadorian Population in the State of Pennsylvania?
Percentage of Ecuadorian Population in Pennsylvania is 0.15%.
What is the Percentage of Ecuadorian Population in the United States?
Percentage of Ecuadorian Population in the United States is 0.24%.