Zip Codes with the Highest Percentage of Population Employed in Food Preparation & Serving in Johnstown, PA
RELATED REPORTS & OPTIONS
Food Preparation & Serving
Johnstown
Compare Zip Codes
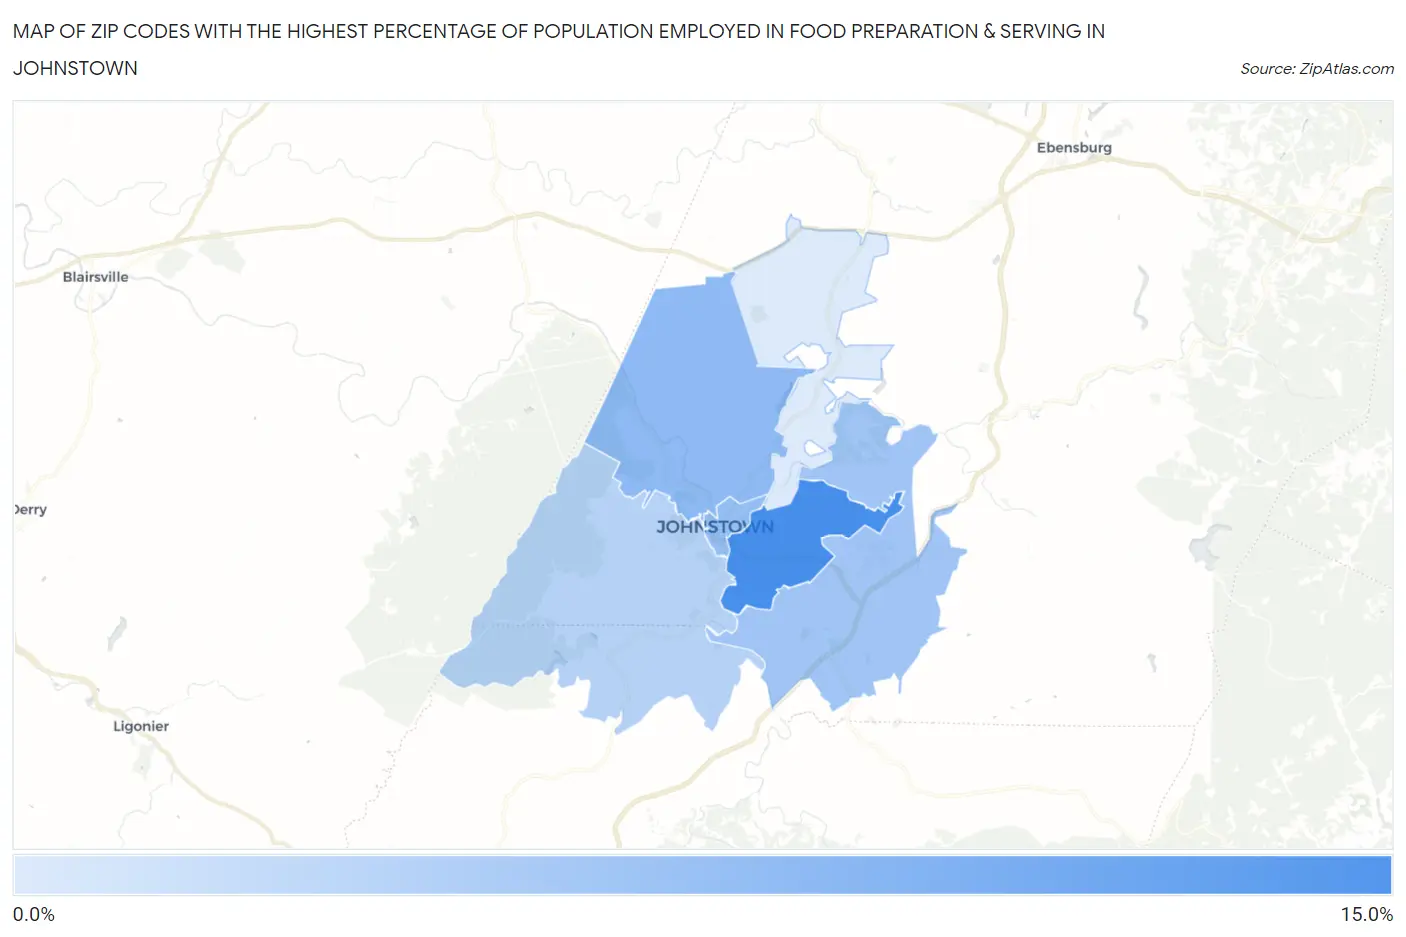
Map of Zip Codes with the Highest Percentage of Population Employed in Food Preparation & Serving in Johnstown
3.9%
11.3%
Zip Codes with the Highest Percentage of Population Employed in Food Preparation & Serving in Johnstown, PA
| Zip Code | % Employed | vs State | vs National | |
| 1. | 15902 | 11.3% | 5.0%(+6.28)#117 | 5.3%(+6.03)#1,909 |
| 2. | 15906 | 7.7% | 5.0%(+2.69)#268 | 5.3%(+2.45)#5,161 |
| 3. | 15901 | 7.4% | 5.0%(+2.34)#307 | 5.3%(+2.10)#5,769 |
| 4. | 15904 | 6.8% | 5.0%(+1.78)#366 | 5.3%(+1.54)#6,995 |
| 5. | 15905 | 5.7% | 5.0%(+0.687)#551 | 5.3%(+0.444)#10,245 |
| 6. | 15909 | 3.9% | 5.0%(-1.16)#1,021 | 5.3%(-1.40)#17,612 |
1
Common Questions
What are the Top 5 Zip Codes with the Highest Percentage of Population Employed in Food Preparation & Serving in Johnstown, PA?
Top 5 Zip Codes with the Highest Percentage of Population Employed in Food Preparation & Serving in Johnstown, PA are:
What zip code has the Highest Percentage of Population Employed in Food Preparation & Serving in Johnstown, PA?
15902 has the Highest Percentage of Population Employed in Food Preparation & Serving in Johnstown, PA with 11.3%.
What is the Percentage of Population Employed in Food Preparation & Serving in Johnstown, PA?
Percentage of Population Employed in Food Preparation & Serving in Johnstown is 10.3%.
What is the Percentage of Population Employed in Food Preparation & Serving in Pennsylvania?
Percentage of Population Employed in Food Preparation & Serving in Pennsylvania is 5.0%.
What is the Percentage of Population Employed in Food Preparation & Serving in the United States?
Percentage of Population Employed in Food Preparation & Serving in the United States is 5.3%.