Cities with the Highest Percentage of Czechoslovakian Population in Pennsylvania
RELATED REPORTS & OPTIONS
Czechoslovakian
Pennsylvania
Compare Cities
Map of Cities with the Highest Percentage of Czechoslovakian Population in Pennsylvania
0.00%
40.00%
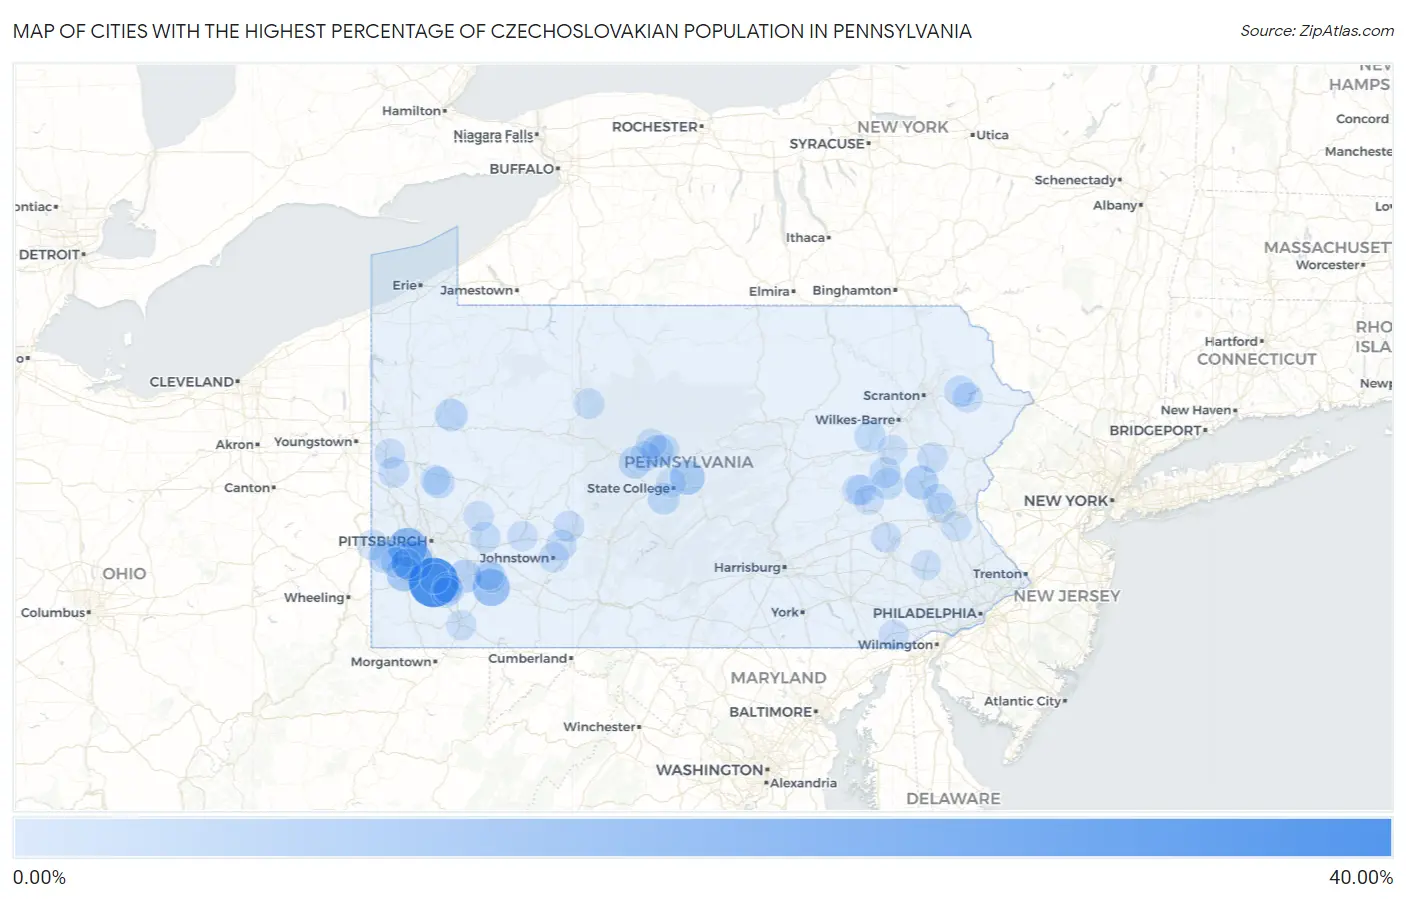
Cities with the Highest Percentage of Czechoslovakian Population in Pennsylvania
| City | Czechoslovakian | vs State | vs National | |
| 1. | Van Voorhis | 30.77% | 0.15% (+30.6)#1 | 0.079% (+30.7)#5 |
| 2. | Point View | 25.00% | 0.15% (+24.8)#2 | 0.079% (+24.9)#6 |
| 3. | Rosslyn Farms Borough | 17.09% | 0.15% (+16.9)#3 | 0.079% (+17.0)#9 |
| 4. | Hendersonville | 16.56% | 0.15% (+16.4)#4 | 0.079% (+16.5)#10 |
| 5. | Noblestown | 14.66% | 0.15% (+14.5)#5 | 0.079% (+14.6)#12 |
| 6. | Bear Rocks | 11.45% | 0.15% (+11.3)#6 | 0.079% (+11.4)#16 |
| 7. | Meadowlands | 8.47% | 0.15% (+8.31)#7 | 0.079% (+8.39)#29 |
| 8. | Pleasant Gap | 7.82% | 0.15% (+7.67)#8 | 0.079% (+7.74)#32 |
| 9. | Weissport East | 6.71% | 0.15% (+6.55)#9 | 0.079% (+6.63)#40 |
| 10. | Wyano | 5.66% | 0.15% (+5.50)#10 | 0.079% (+5.58)#54 |
| 11. | Pine Grove Borough | 5.16% | 0.15% (+5.00)#11 | 0.079% (+5.08)#62 |
| 12. | Ehrenfeld Borough | 4.89% | 0.15% (+4.74)#12 | 0.079% (+4.81)#67 |
| 13. | Kennerdell | 4.65% | 0.15% (+4.50)#13 | 0.079% (+4.57)#72 |
| 14. | West Sunbury Borough | 4.55% | 0.15% (+4.39)#14 | 0.079% (+4.47)#74 |
| 15. | Allport | 4.29% | 0.15% (+4.13)#15 | 0.079% (+4.21)#86 |
| 16. | Moshannon | 3.90% | 0.15% (+3.75)#16 | 0.079% (+3.82)#94 |
| 17. | Callimont Borough | 3.85% | 0.15% (+3.69)#17 | 0.079% (+3.77)#96 |
| 18. | Loganton Borough | 3.57% | 0.15% (+3.42)#18 | 0.079% (+3.49)#106 |
| 19. | East Conemaugh Borough | 3.42% | 0.15% (+3.27)#19 | 0.079% (+3.34)#117 |
| 20. | Oak Hills | 3.37% | 0.15% (+3.22)#20 | 0.079% (+3.30)#120 |
| 21. | Ramblewood | 3.29% | 0.15% (+3.14)#21 | 0.079% (+3.22)#123 |
| 22. | New Alexandria Borough | 3.21% | 0.15% (+3.06)#22 | 0.079% (+3.13)#126 |
| 23. | Hometown | 3.01% | 0.15% (+2.86)#23 | 0.079% (+2.93)#137 |
| 24. | Saxonburg Borough | 3.00% | 0.15% (+2.85)#24 | 0.079% (+2.92)#138 |
| 25. | Penn Lake Park Borough | 2.96% | 0.15% (+2.80)#25 | 0.079% (+2.88)#143 |
| 26. | Hunker Borough | 2.94% | 0.15% (+2.79)#26 | 0.079% (+2.86)#144 |
| 27. | The Hideout | 2.85% | 0.15% (+2.70)#27 | 0.079% (+2.77)#150 |
| 28. | Mocanaqua | 2.78% | 0.15% (+2.62)#28 | 0.079% (+2.70)#157 |
| 29. | Great Bend Borough | 2.67% | 0.15% (+2.52)#29 | 0.079% (+2.60)#169 |
| 30. | Clarence | 2.59% | 0.15% (+2.43)#30 | 0.079% (+2.51)#174 |
| 31. | Kelayres | 2.58% | 0.15% (+2.43)#31 | 0.079% (+2.50)#175 |
| 32. | Cross Creek | 2.55% | 0.15% (+2.40)#32 | 0.079% (+2.47)#179 |
| 33. | Slickville | 2.36% | 0.15% (+2.20)#33 | 0.079% (+2.28)#194 |
| 34. | Coaldale Borough Bedford County | 2.35% | 0.15% (+2.20)#34 | 0.079% (+2.27)#196 |
| 35. | Townville Borough | 2.32% | 0.15% (+2.16)#35 | 0.079% (+2.24)#198 |
| 36. | Arendtsville Borough | 2.24% | 0.15% (+2.08)#36 | 0.079% (+2.16)#210 |
| 37. | Renovo Borough | 2.22% | 0.15% (+2.07)#37 | 0.079% (+2.14)#211 |
| 38. | Paris | 2.20% | 0.15% (+2.05)#38 | 0.079% (+2.13)#216 |
| 39. | Chewton | 2.12% | 0.15% (+1.97)#39 | 0.079% (+2.04)#224 |
| 40. | Englewood | 2.11% | 0.15% (+1.96)#40 | 0.079% (+2.04)#227 |
| 41. | North Bend | 2.08% | 0.15% (+1.92)#41 | 0.079% (+2.00)#234 |
| 42. | Mammoth | 2.05% | 0.15% (+1.89)#42 | 0.079% (+1.97)#237 |
| 43. | Colver | 2.02% | 0.15% (+1.87)#43 | 0.079% (+1.94)#239 |
| 44. | Atlasburg | 1.98% | 0.15% (+1.82)#44 | 0.079% (+1.90)#244 |
| 45. | Vintondale Borough | 1.98% | 0.15% (+1.82)#45 | 0.079% (+1.90)#245 |
| 46. | Kersey | 1.96% | 0.15% (+1.81)#46 | 0.079% (+1.89)#248 |
| 47. | Mcadoo Borough | 1.90% | 0.15% (+1.74)#47 | 0.079% (+1.82)#260 |
| 48. | Hickory | 1.89% | 0.15% (+1.73)#48 | 0.079% (+1.81)#263 |
| 49. | Laurel Mountain Borough | 1.89% | 0.15% (+1.73)#49 | 0.079% (+1.81)#264 |
| 50. | Vinco | 1.88% | 0.15% (+1.73)#50 | 0.079% (+1.80)#266 |
| 51. | Donegal Borough | 1.80% | 0.15% (+1.65)#51 | 0.079% (+1.72)#283 |
| 52. | Lorain Borough | 1.72% | 0.15% (+1.57)#52 | 0.079% (+1.64)#298 |
| 53. | Mars Borough | 1.71% | 0.15% (+1.56)#53 | 0.079% (+1.63)#303 |
| 54. | Towamensing Trails | 1.69% | 0.15% (+1.54)#54 | 0.079% (+1.62)#308 |
| 55. | Muse | 1.64% | 0.15% (+1.49)#55 | 0.079% (+1.56)#319 |
| 56. | Black Lick | 1.60% | 0.15% (+1.45)#56 | 0.079% (+1.52)#324 |
| 57. | Fairhope | 1.60% | 0.15% (+1.45)#57 | 0.079% (+1.52)#326 |
| 58. | New Castle Northwest | 1.60% | 0.15% (+1.44)#58 | 0.079% (+1.52)#330 |
| 59. | Lincoln University | 1.56% | 0.15% (+1.41)#59 | 0.079% (+1.48)#338 |
| 60. | Spartansburg Borough | 1.52% | 0.15% (+1.37)#60 | 0.079% (+1.44)#357 |
| 61. | Oakland Borough | 1.50% | 0.15% (+1.34)#61 | 0.079% (+1.42)#361 |
| 62. | Johnstown | 1.49% | 0.15% (+1.33)#62 | 0.079% (+1.41)#363 |
| 63. | Grassflat | 1.48% | 0.15% (+1.32)#63 | 0.079% (+1.40)#364 |
| 64. | Rices Landing Borough | 1.45% | 0.15% (+1.30)#64 | 0.079% (+1.37)#373 |
| 65. | Dauberville | 1.43% | 0.15% (+1.27)#65 | 0.079% (+1.35)#384 |
| 66. | Fallston Borough | 1.42% | 0.15% (+1.27)#66 | 0.079% (+1.34)#387 |
| 67. | Munhall Borough | 1.42% | 0.15% (+1.26)#67 | 0.079% (+1.34)#391 |
| 68. | Pine Glen | 1.38% | 0.15% (+1.23)#68 | 0.079% (+1.30)#402 |
| 69. | New Stanton Borough | 1.36% | 0.15% (+1.20)#69 | 0.079% (+1.28)#418 |
| 70. | Tarentum Borough | 1.34% | 0.15% (+1.19)#70 | 0.079% (+1.26)#422 |
| 71. | Glenfield Borough | 1.34% | 0.15% (+1.19)#71 | 0.079% (+1.26)#424 |
| 72. | Altamont | 1.32% | 0.15% (+1.16)#72 | 0.079% (+1.24)#431 |
| 73. | Wallenpaupack Lake Estates | 1.30% | 0.15% (+1.15)#73 | 0.079% (+1.22)#441 |
| 74. | Beech Creek Borough | 1.30% | 0.15% (+1.15)#74 | 0.079% (+1.22)#442 |
| 75. | Sewickley Hills Borough | 1.29% | 0.15% (+1.14)#75 | 0.079% (+1.21)#447 |
| 76. | Morgan Hill | 1.28% | 0.15% (+1.12)#76 | 0.079% (+1.20)#456 |
| 77. | Shamokin Dam Borough | 1.26% | 0.15% (+1.10)#77 | 0.079% (+1.18)#460 |
| 78. | Pringle Borough | 1.25% | 0.15% (+1.10)#78 | 0.079% (+1.18)#462 |
| 79. | Leith Hatfield | 1.25% | 0.15% (+1.10)#79 | 0.079% (+1.17)#463 |
| 80. | Lynnwood Pricedale | 1.25% | 0.15% (+1.10)#80 | 0.079% (+1.17)#465 |
| 81. | Jefferson Borough Greene County | 1.24% | 0.15% (+1.09)#81 | 0.079% (+1.16)#469 |
| 82. | Cumbola | 1.23% | 0.15% (+1.08)#82 | 0.079% (+1.15)#472 |
| 83. | Valencia Borough | 1.20% | 0.15% (+1.04)#83 | 0.079% (+1.12)#487 |
| 84. | Allenport | 1.19% | 0.15% (+1.04)#84 | 0.079% (+1.11)#488 |
| 85. | Hyndman Borough | 1.19% | 0.15% (+1.03)#85 | 0.079% (+1.11)#491 |
| 86. | Toftrees | 1.14% | 0.15% (+0.989)#86 | 0.079% (+1.06)#511 |
| 87. | Beech Mountain Lakes | 1.13% | 0.15% (+0.981)#87 | 0.079% (+1.06)#516 |
| 88. | Beaver Meadows Borough | 1.12% | 0.15% (+0.970)#88 | 0.079% (+1.04)#517 |
| 89. | Freemansburg Borough | 1.12% | 0.15% (+0.965)#89 | 0.079% (+1.04)#523 |
| 90. | Halfway House | 1.12% | 0.15% (+0.962)#90 | 0.079% (+1.04)#527 |
| 91. | Patton Borough | 1.11% | 0.15% (+0.959)#91 | 0.079% (+1.03)#528 |
| 92. | Laurys Station | 1.10% | 0.15% (+0.945)#92 | 0.079% (+1.02)#536 |
| 93. | Stiles | 1.09% | 0.15% (+0.940)#93 | 0.079% (+1.02)#539 |
| 94. | Pleasant View | 1.09% | 0.15% (+0.938)#94 | 0.079% (+1.01)#542 |
| 95. | Baidland | 1.09% | 0.15% (+0.937)#95 | 0.079% (+1.01)#544 |
| 96. | Calumet | 1.09% | 0.15% (+0.936)#96 | 0.079% (+1.01)#545 |
| 97. | Mahanoy City Borough | 1.07% | 0.15% (+0.918)#97 | 0.079% (+0.992)#555 |
| 98. | Desales University | 1.06% | 0.15% (+0.908)#98 | 0.079% (+0.983)#559 |
| 99. | Claysville Borough | 1.03% | 0.15% (+0.880)#99 | 0.079% (+0.955)#575 |
| 100. | Meridian | 1.01% | 0.15% (+0.855)#100 | 0.079% (+0.930)#594 |
Common Questions
What are the Top 10 Cities with the Highest Percentage of Czechoslovakian Population in Pennsylvania?
Top 10 Cities with the Highest Percentage of Czechoslovakian Population in Pennsylvania are:
#1
30.77%
#2
16.56%
#3
14.66%
#4
11.45%
#5
8.47%
#6
7.82%
#7
6.71%
#8
5.66%
#9
4.65%
#10
4.29%
What city has the Highest Percentage of Czechoslovakian Population in Pennsylvania?
Van Voorhis has the Highest Percentage of Czechoslovakian Population in Pennsylvania with 30.77%.
What is the Percentage of Czechoslovakian Population in the State of Pennsylvania?
Percentage of Czechoslovakian Population in Pennsylvania is 0.15%.
What is the Percentage of Czechoslovakian Population in the United States?
Percentage of Czechoslovakian Population in the United States is 0.079%.